Relative Environmental, Economic, and Energy Performance Indicators of Fuel Compositions with Biomass


Heat and Mass Transfer Simulation Laboratory, National Research Tomsk Polytechnic University, 30 Lenin Avenue, Tomsk 634050, Russia
*
Author to whom correspondence should be addressed.
Appl. Sci. 2020, 10(6), 2092; https://doi.org/10.3390/app10062092
Submission received: 21 February 2020
/
Revised: 13 March 2020
/
Accepted: 16 March 2020
/
Published: 19 March 2020
(This article belongs to the Special Issue Environmental Friendly Technologies in Power Engineering)
Abstract
:The present study deals with the experimental research findings for the characteristics of ignition (ignition delay times, minimum ignition temperature) and combustion (maximum combustion temperature, concentration of anthropogenic emission), as well as theoretical calculations of integral environmental, economic, and energy performance indicators of fuel compositions based on coal processing waste with the most typical types of biomass (sawdust, leaves, straw, oil-containing waste, and rapeseed oil). Based on the results of the experiments, involving the co-combustion of biomass (10% mass) with coal processing waste (90% mass) as part of slurry fuels, we establish differences in the concentrations of NOx and SOx in the gaseous combustion products. They make up from 36 to 218 ppm when analyzing the flue gases of coal and fuel slurries. Additionally, the values of relative environmental, economic, and energy performance indicators were calculated for a group of biomass-containing fuel compositions. The calculation results for equal weight coefficients are presented. It was shown that the efficiency of slurry fuels with biomass is 10%–24% better than that of coal and 2%–8% better than that of filter-cake without additives. Much lower anthropogenic emissions (NOx by 25%–62% and SOx by 61%–88%) are confirmed when solid fossil fuels are partly or completely replaced with slurry fuels.
1. Introduction
Fuels, derived from waste (e.g., biomass), such as biogas, syngas, pyrolysis oil and spirits, are renewable energy sources [1,2]. They are in high demand nowadays due to high rates of fossil fuel depletion [3]. The employment of reactors and gasifiers with biomass is economically feasible, no matter whether heat and power are produced in small or large volumes. They can be used on a large scale in industry, thus, reducing the pollution of the environment with anthropogenic emissions, as compared with the widely used coal-fired power generation technologies [1,2]. Smaller-sized plants with lower efficiency can be used in remote or rural lands to provide energy security of rather large areas. Moreover, local bioresources can be used as raw materials [4]. Biomass waste is transformed into essential useful products [4]. Implementing biofuel technologies in power industry facilitates the development of a number of related aspects [2,5]: reducing the amount of waste buried at landfills; increasing the share of renewable energy resources in the energy industry; expanding local and national economy, tax base and allowances; improving waste handling requirements in the context of modernizing environmental policy; building positive public opinion on the energy-efficient waste recycling.
There are still discussions about the most rational approaches to the conversion of biomass [2,6,7]. There are known results for its co-combustion with solid fossil fuels (coals of different grades) [7,8] and as part of composite water-containing fuels with coal processing waste [9,10]. The main trend in the development of the corresponding fuel technologies is to use two subsequent stages (which are sometimes parallel in different layers of fuel mixtures) [5,11,12,13]: pyrolysis and gasification. However, there is a basic problem to implementing these processes in real life: the final fuel is very expensive, as compared with conventional liquid and gaseous fuels [5,14]. Therefore, it is important to use biomass as an additional fuel component, meant to improve the production process characteristics and enhance the quality of the final product. It seems relevant to compare fuel compositions with different biomass in terms of relative environmental, economic, and energy performance indicators.
The results [15,16] are known for a comparative analysis of fuel compositions, based on water and coal processing waste, with regard to these indicators. The main focus [10] is usually on the comparison of nitrogen and sulfur concentrations in the combustion products of slurries and coals, with their initial masses and combustion conditions being identical. The results [15], obtained when the combustion of water-containing slurries and coal produce identical amount of energy, are of the greatest interest. Kurgankina et al. [16] performed a complex evaluation of the combustion efficiency of coal processing waste as part of water-containing slurries, considering a group of parameters: heat of combustion, ignition delay time, minimum temperature of combustion initiation, maximum combustion temperature, sulfur and nitrogen oxide concentrations in flue gases, cost of components, etc. The findings obtained provided a foundation for the development of measures [17] of possible technological modifications to fuel systems at boiler units and thermal power plants, when switching from typical solid, liquid, and gas fuels to cheaper waste-derived slurries. Thus, Glushkov et al. [18] did a theoretical and experimental validation of the viability of burning a wide range of waste as part of water-containing slurries to solve the problem of its recycling, reducing the consumption rates of conventional energy resources, and cutting the anthropogenic emissions in flue gases. Zaitsev et al. [19] also showed the feasibility of gasification of such waste in order to address the above-mentioned issues. Nyashina et al. [10,20] established that adding biomass to slurry fuels based on coal processing waste substantially reduces the gaseous anthropogenic emissions. Therefore, biomass is commonly regarded as a promising component of fuel slurries. However, its efficiency as the main and additional component of fuel mixtures has not yet been studied in terms of a complex of environmental, economic, and energy performance indicators. It makes sense to perform such analysis using Multiple Criteria Decision Making (MCDM) [21,22]. MCDM unites a group of standard methods of evaluating the efficiency of certain processes or objects [21]. Weighted Sum Method (WSM), Weighted Product Method (WPM) and Analytic Hierarchy Process (AHP) are the most popular methods for the energy sector, allowing for an objective evaluation of the prospects of different engineering decisions. In accordance with the criteria selected, we use Weighted Sum Method in our research. This method, being universal for different applications, is one of the most common MCDM techniques used in the energy industry.
The purpose of present work is to compare the environmental, economic, and energy performance indicators, calculated, using experimental data, for fuel compositions with different kinds of biomass. They included pine sawdust, wheat straw, birch leaves, sunflower cake, and rapeseed oil. These components are available in most of the world’s regions and can be replaced by a similar component, if necessary (e.g., wheat straw by rapeseed or rice straw).
2. Materials and Methods
Two categories of biomass—dry and wet—are commonly distinguished by their state of matter [7]. Biomass is also identified as a product or production waste [7,23,24]. Table 1 presents kinds of biomass, used for pyrolysis, gasification, and co-combustion, in different regions of the world. Based on the literature analysis (Table 1), for our experimental research we chose the most typical kinds of biomass (Table 2) from the categories of wood biomass, agricultural biomass, oil and oilseed waste, shell and husk. They included pine sawdust, wheat straw, birch leaves, sunflower cake, and rapeseed oil. These components are available in most of the world’s regions and can be replaced by a similar component, if necessary (e.g., wheat straw by rapeseed or rice straw).
At present, the amount of coal processing waste (filter cakes) is the largest of all the accumulated industrial waste. The quantity of this waste is annually increasing by 700–800 million tons [41,42]. Lack of efficient methods of disposing of such waste leads to enormous mounds (dozens or even hundreds of hectares) of coal [41,42]. Coal processing waste is a mixture of fine coal particles (80–140 µm) with water and surfactants [41]. Notably, these products cannot be exactly regarded as waste, as the content of carbon in them is on average 65%–75% (in a dry state).
Producing composite liquid fuels from them by adding biomass, water, municipal solid waste, and other components is a promising way of increasing the efficiency of resource exploitation [43], optimizing the energy industry [17], and reducing the environmental pollution [18,43].
Fuel slurries were produced in several stages. Biomass samples were dried at room temperature and then milled using a Pulverisette 14 rotary mill (FRITSCH GmbH - Milling and Sizing, Idar-Oberstein, Germany) with rotor speed of 6000–20,000 rpm. After milling, biomass was sieved through a sifter with a mesh size of 140 µm, using a laboratory plansifter. After that, a thin layer of milled biomass was spread on the surface of a sheet of paper and left at room temperature for several days to equilibrate in atmospheric moisture. Biomass was not dried any more.
In this study, we used coal flotation waste—filter cake in the initial wet state (as it is produced at coal washing plants)—as the main component of slurry fuels. Filter cake is a slurry consisting of coal dust, water, and surfactants. Coal particles have a size of 80–140 μm, therefore, no additional pulverization was necessary. Fuel mixtures were produced by stirring all the slurry components for 5–10 minutes, using a homogenizer.
The composition of all fuel mixtures consisted of 90% filter cake (in the wet state) and 10% biomass or vegetable oil. The mass fraction of the main component and additives, when preparing composite fuels, is selected based on the region-specific distribution of resources. The concentration of additives in fuels can normally vary from 5% to 20%. Such ratio is quite typical when recovering oil production waste [8], residual wood [44], sunflower hulls [45], and rapeseed oil [46] by co-firing them with coal fuels. When burning coal-water fuels based on coal processing waste, which is abundant at industrial landfills, adding a relatively small amount of other combustible components with different generation rates makes it possible to recover a group of different kinds of waste by co-firing them. The mass concentration we chose (10%) is also universal in terms of combustion technologies. Adding a lot of solid plant waste significantly increases the viscosity of the mixture, making it unfit for pipeline transportation and flame combustion in boiler furnaces. One should also keep in mind that power generation facilities must not depend entirely on the scale of crop farming, which is, in turn, too dependent on subjective factors (weather conditions in the region and natural hazards). Additional components should be chosen based on their availability, generation scale, and presence of alternatives. Thus, for instance, various kinds of wood (pine, birch, oak), forest fuels (leaves of different trees, pine needles, grass), hull of different crops (rice, wheat, cotton), and waste of plant raw material processing to produce foodstuffs (sunflower and rapeseed press cake, palm kernel waste, cocoa shells, sugar cane bagasse) are interchangeable. It can be therefore concluded that for this research we have chosen typical biomass components, having alternatives in other regions, and their mass concentration of 10% is an appropriate value for composite fuels.
Table 2 presents the properties of coal and other components, used in this research to produce slurries.
Thus, in the present study, the following types of fuels (with relative mass fractions) were considered, the list of which is presented in Table 3.
In present research, it was recorded the following main parameters: ignition delay times τd, threshold temperatures of combustion initiation Tgmin, maximum combustion temperatures Tbmax, and the most hazardous gaseous anthropogenic emissions (NOx, SOx). It was also calculated the ash content and combustion heat of slurry fuels with regard to the characteristics and mass concentration of the components (Table 2). The parameter values obtained were then used to calculate the relative parameters showing the advantages of slurry fuels vs. coal.
The ignition and combustion characteristics of slurry fuels with biomass were determined using an experimental setup presented in Figure 1 [15,18]. A high-temperature air medium was created with a tube muffle furnace R 50/250/13 (Nabertherm GmbH, Lilienthal, Germany). The temperature in the experiments was varied from 700 to 900 °C. This range covers the most typical temperatures of the combustion of slurry fuels with biomass, for which the typical ignition and combustion stages are usually studied [43,47]. After the furnace was heated, the fuel on the holder was placed into it, using the sample feeder. A Phantom v411 high-speed color camera (Vision Research Inc, Wayne, NJ, USA) was used to determine the ignition delay times of the experimental samples. The Tema Automotive Video software (Image Systems AB, Linköping, Sweden) was used to analyze the video recordings of the experiments. A video camera was installed on the side of the muffle furnace facing the side where the fuel sample was introduced into it. The ignition delay time was the interval from the moment when heating started up until ignition, characterized by a flame. The minimum temperature of the fuel ignition Tgmin (i.e., the temperature above which stable combustion occurs) was recorded using a K-type thermocouple (temperature range 0–1100 °C, systematic error ±3 °C, response time no more than 10 s), built into the muffle furnace. The maximum temperature of the fuel combustion Tbmax (i.e., the temperature achieved on the particle surface during the heterogeneous combustion of the fuel) was recorded using an S-type thermocouple (temperature range 0–1600 °C, systematic error ±1 °C, response time no more than 1 s).
The gaseous emission compositions were analyzed by a Testo 340 gas analysis system (Testo SE & Co. KGaA, Lenzkirch, Germany). The video camera was replaced with the gas analyzer when anthropogenic emissions were measured. The gas analyzer consisted of the following components: a modular probe, a gas sampling hose, an external unit of sample preparation, and a computing unit with built-in electrochemical sensors (O2 (accuracy 0.2%), CO (accuracy ± 5%), NOx (accuracy ± 5%), SO2 (accuracy ± 10%)). The concentration of CO2 (accuracy ± 0.2%) was calculated automatically based on O2 measurement. The modular probe of the gas analyzer was installed on the opposite side of the fuel sample. Thermal insulation was applied to the apertures, through which the fuel and probe were introduced. Flue gases from combustion went through the modular probe and gas sampling hose to a unit, intended to cool them and decrease their humidity. The cooled sample was directed to the measurement sensors of the computing unit of the gas analyzer. A specialized EasyEmission software (Testo SE & Co. KGaA, Lenzkirch, Germany), installed on the personal computer, was used to continuously monitor and record the flue gas components.
The ignition and combustion characteristics were recorded with the initial fuel droplet radius about 2 mm. Droplets of such size are quite easily reproduced in multiple experiments (with an allowable deviation of ± 0.15 mm), and they are held tightly on the holder rod (Figure 1). Moreover, 2 mm fuel droplets allow for a detailed study of the ignition and combustion times and temperatures (it is more difficult with very small droplets due to high rates of heat and mass transfer and a greater contribution of thermal interaction between the fuel and the holder). In the previous experiments [15,18], the initial size of slurry fuel droplets was varied. Using the data from [15,18], the values of the ignition and combustion characteristics can be predicted under study for fuel droplets and particles of different sizes of the compositions used. To measure the main gaseous anthropogenic emissions, the fuel sample mass was increased to 1 g, because a single droplet does not produce enough flue gases for the gas analyzer sensors to detect. The setup elements, errors, techniques of measurement and experimental data processing are described in more detail in [15,18].
At each experiment 5–7 runs were conducted under constant conditions (rough errors were excluded). The results were averaged, and confidence intervals were calculated. The systematic error of ignition time measurement was ±0.001 s (due consideration of the video recording characteristics).
3. Results and Discussion
3.1. Experimental Results
Figure 2 shows typical combustion stages of a composite fuel droplet. Such fuel contains several components with different thermophysical properties and states of matter. Therefore, the combustible components of the mixture are not ignited simultaneously. Slurries, like many other fossil fuels, are characterized by a homogeneous (gas-phase) as well as heterogeneous combustion mechanisms (Figure 2). Adding biomass can significantly affect the duration and intensity of both combustion regimes. In particular, biomass with a high content of volatiles (such as, leaves, sawdust) accelerates the gas-phase ignition and facilitates a larger flame and its long burnout (these parameters also depend on heating conditions).
Figure 3 and Figure 4 present the experimental research findings for a group of fuel compositions. These include the established ignition delay times, minimum air temperatures sufficient for fuel ignition, maximum combustion temperatures of fuel (Tbmax was measured at Tg ≈ 700 °C), as well as anthropogenic emission concentrations. It can be clearly seen (Figure 3 and Figure 4) that not all the biomass kinds, added to the fuel compositions, produce significant changes in the characteristics under study. This is explained by the component composition of some additives, which is quite close to the coal processing waste being used. The fuel with vegetable (rapeseed) oil features the longest ignition delay times. When it is heated, the vegetable oil components decompose. Unlike petroleum oil, vegetable oil does not produce combustible gas components during decomposition. Thus, extra time is required for the endothermic processes to develop and the coke residue to ignite. For instance, ignition delay time τd of the composition with rapeseed oil differs 1.8–2.0 times from that of the composition with biomass (sunflower hulls) in the heating temperature Tg range from 700 to 900 °C (Figure. 3a). Varying the kind of plant biomass (sunflower waste, straw, sawdust, leaves) had a marginal effect on the changes of the ignition delay times and ignition temperature (Figure 3), which is explained by similar properties of these components with a major influence of volatiles at the ignition stage. The content of volatiles in the dry ash-free substance was no less than 76% for all the solid biomass additives used in present study. At a relatively low ash and moisture content of the plant biomass, volatiles can rapidly form combustible reaction mixtures with the air. The shortest ignition delay times were typical of coal (Figure 3a), which is due to a small fraction of water (as compared with slurries). Moisture evaporation consumes a lot of energy (specific vaporization heat of water is 2.2 MJ/kg). Compared to that, the thermal decomposition of the organic mass of coal is less energy-consuming. Therefore, a reduction in the fraction of water decreases the inert period. However, the experiments show that dry coal is ignited at higher temperatures, than wet slurries do. This is probably explained by the reactions of interaction of water vapors with carbon [48]. The combustion temperature of a coal particle was much higher than that of slurries (Figure 3b) due to low moisture content and greater combustion heat. Value of Tbmax is directly proportional to the combustion conditions and calorific value of the fuel. Thus, an increase in the fuel moisture content reduces the temperature in its combustion zone. However, using high-energy additives (e.g., sawdust) can increase this parameter.
When analyzing the anthropogenic emissions, it was established that any plant-based component, added to coal or coal processing waste, substantially reduces sulfur and nitrogen oxide concentrations (Figure 4). The co-combustion of biomass with coal processing waste reduces NOx by 25%–62% and SOx by 61%–88%. The presence of water and additional plant component significantly affects the concentrations of sulfur and nitrogen oxides, produced from combustion. Replacing coal with neutral (in terms of sulfur and nitrogen) components has a direct effect on the amount of fuel sulfur and nitrogen [49,50]. They are the main sources of the corresponding oxides, formed in the oxidation of volatiles and coke of the fuel during combustion, which is why the lowest emissions were recorded for the composition with rapeseed oil, which has the lowest amount of sulfur and nitrogen (Table 2). Metal-containing components in the ash part of dry plant components and filter cake (ash analysis (wt %) biomass and filter cake are presented in [10,20]) can also react with sulfur and nitrogen oxides (CaO+SO2+1/2O2→CaSO4; 3SO2+2Fe(OH)3→Fe2(SO3)3+H2O; 2Fe+3NO→3/2N2+Fe2O3) [10,49,50,51] at certain temperatures (over 800 °C). This produces new substances, which either become ash residue or take part in further chemical transformations, without NOx or SOx formation [49,51].
Based on the data [10,20] about the composition of fuel components, biomass contains a greater amount of metal compounds (e.g., calcium, magnesium), capable of reacting with sulfur and nitrogen oxides, than filter cake does. We can assume that sulfur and nitrogen oxides interact with metal compounds during the combustion in a gas medium, even when 10% of biomass is added to filter cake. This hypothesis is also confirmed by the results of other authors [49,52,53]. In particular, in the combustion of straw, the reactions between metal-containing compounds in the ash part of biomass and gaseous emissions can compensate for a higher content of nitrogen (as compared with filter cake) (Table 2). Additionally, the final NOx emissions are affected by the type of nitrogen-containing compounds in the fuel. In biomass, most of the nitrogen is in volatile components, which are released and burn out at the initial stage of ignition and combustion as compounds, some of which do not produce nitrogen oxides [54]. In the case of coal and coal processing waste, nitrogen oxides are usually formed at the stage of the oxidation of the coke part at relatively high temperatures [49].
In addition to anthropogenic emissions during the co-combustion of fossil fuels with some additives, carcinogenic substances are also formed. We previously established [55] that the combustion temperatures of composite fuels based on filter cake are 1000–1400 °C. It is generally agreed that combustion temperatures of 850 °C and a gas residence time of 2 s or 1000 °C and a gas residence time of 1 s are necessary for total destruction of polychlorinated dibenzodioxins and dibenzofurans (PCDD/Fs) in flue gases. Since decomposition increases exponentially with temperature and incineration temperature of 1200 °C, which is typical of chlorinated hydrocarbon wastes, requires a residence time measured in milliseconds for total destruction [56]. The critical temperature zone for the maximum rate of PCDD/Fs from precursors such as chlorophenol is 350–400 °C depending on the precursor concentration. Furthermore, the rate of PCDD/Fs formation from these precursors is 1 or 2 orders of magnitude greater than dioxin formation rates from conventional de novo synthesis. The maximum rate of dioxin formation from de novo synthesis is in excess of 300 °C [57].Therefore, in order to minimize PCDD/Fs formation in this temperature zone it is necessary to cool the gases through the critical temperature zone as rapidly as possible. In general, according to McKay [56] effective PCDD/Fs minimization can be achieved by applying the following [56]: “In the first case, combustion temperature should be above 1000 °C, combustion residence time should be greater than 1 s, combustion chamber turbulence should be represented by a Reynolds number greater than 50,000. In the second category, very rapid gas cooling from 400 to 250 °C should be achieved, semi-dry lime scrubbing and bag filtration coupled with activated carbon injection adsorption as end-of-pipe treatments can all play a role in prevention or minimization of dioxins in the final flue gas emission to the atmosphere”. The design of typical industrial coal-fired boilers can provide all the necessary conditions to minimize PCDD/Fs concentrations in flue gases from the combustion of composite fuel.
3.2. MCDM Principles and Selected Criteria
Multiple Criteria Decision Making principles employ standard criteria and parameters for a comparative evaluation of the potential of using slurry technologies. MCDM provides an optimal solution when there is a great number of random arguments; it uses a single approach for a consistent and repeatable decision-making.
To estimate the resulting efficiency of fuels, all the calculated and measured values were divided into groups (Table 4): energy performance, environmental, and economic. Energy performance indicators allow us to evaluate the ignition and combustion characteristics of fuels of different component compositions. This group includes ignition delay times, maximum combustion temperature, minimum ignition temperature, heat of combustion, and ash content. Environmental indicators incorporate the concentrations of sulfur and nitrogen oxides, measured as different fuels are burnt. Economic indicators consider the cost and capital costs. The cost (C) characterizes the total price of the fuel mixture and how cost-efficient it is for power generation plants. The capital costs are expenses incurred on the purchase of fuel system equipment at plants, as well as its refitting [17].
Based on the criteria presented in Table 4, it was calculated the resulting efficiency indicator of slurries, using the Weighted Sum Method. This method, being universal for different applications, is one of the most common MCDM techniques used in the energy industry [21].
The WSM combines all the multi-objective functions into one scalar, composite objective function using the weighted sum by the formula:
where γj is weight coefficient for each criterion; Xij is normalized value of criterion.
The normalized value was determined by comparing each criterion with one optimal value within each criterion. The normalized criteria values corresponded to the interval 0–1. There are frequently objective difficulties in the tradeoff of weight coefficients, since the subsequent decision depends greatly on this step. It is critical to take into account the priorities in each particular region of the world. It is reasonable to use non-equal weight coefficients, when priorities are ranged to solve certain applied problems for a particular world’s region, country, or enterprise. In this case, realistic weight coefficients are introduced based on particular legal regulations (laws, taxes, duties) and large volumes of statistical data (geographic aspects, current economic situation, state of environment, level of technological facilities, and availability of energy resources). It is possible to introduce non-equal weight coefficients for some world’s regions. However, obtained results will be too specific to hold interest on the international level. The main purpose of this work was to study the potential advantages of fuel compositions with biomass. Therefore, the calculation results for equal weight coefficients are presented. The best fuel in terms of the criteria under consideration will be the one with the highest weighted sum (An).
3.3. Efficiency Indicators of Combustion of Slurry Fuels with Biomass
The absolute and standardized values of fuel evaluation criteria, obtained in the experimental research and theoretical analysis, are presented in Table 5. It can be concluded that all the slurry fuels are inferior to coal in terms of energy performance parameters: ignition delay times, calorific value, and maximum combustion temperature. This result is explained by the fact that slurries contain quite a lot of moisture. Its evaporation prolongs the ignition, reduces energy performance characteristics of the fuel, thus, affecting the maximum combustion temperature. In terms of heat of combustion and maximum combustion temperature, the composition with rapeseed oil is closest to coal. The heat of combustion of this composition is 42.1 MJ/kg. However, the ignition delay times of this composition are, on the contrary, the longest. The cetane number (a measure of the fuel ignition value) of rapeseed oil is 37.6 [58], which is quite a low indicator of ignition. A standard fuel is characterized by a cetane number from 48 to 51, whereas a superior quality fuel—from 51 to 55. At a cetane number lower than 40, the fuel ignition delay time rises sharply. Therefore, the ignition delay of the composition with rapeseed oil is greater than that of the composition with dry biomass. However, due to almost zero ash content of oil, the composition with rapeseed oil performed the best in this criterion, since agricultural and wood biomass can contain quite a lot of ash (Table 2) and additives, affecting not only the ignition, but also slagging indicators. The energy performance indicators for the compositions with dry biomass (Figure 3, Table 5) are in good agreement. This result can be attributed to a low fraction of biomass in slurries and similar characteristics of the materials under consideration.
The environmental criteria for slurry fuels are much higher than those for coals within the whole temperature range (Figure 4). That gives slurries a major advantage. A reduction in emission concentrations is explained by the influence of a number of factors. The main ones are a lower fraction of sulfur and nitrogen in the fuel, lower combustion temperature, interaction of sulfur and nitrogen oxides with water vapors and with the components of biomass pyrolysis and gasification, resulting in the formation of salts in ash and a decrease in NOx and SOx concentrations. It is difficult to single out one particular dry biomass additive. For instance, at 700 °C and 800 °C, straw and leaves proved to be the best additives, whereas at 900 °C, using 10% of sunflower cake had a major effect. As mentioned above, this is explained by chemical reactions developing between biomass components and the gases under study [10]. The main conclusion is that this research focuses on the variation ranges of anthropogenic emission concentrations, when biomass is added to fuel slurry compositions. They show great prospects of using biomass for an environmentally friendly recovery of coal processing waste to produce energy.
The economic criteria, including cost of components and economic indicators of preparation, storage, and combustion, were better for slurries, too. The cost of the slurries under study was derived from the market prices of the components [59,60,61]. Using coal processing waste to produce slurries decreases the fuel cost up to sevenfold. Adding biomass can increase or decrease the cost of the resulting slurry, depending on the type of biomass, the degree of its involvement and use in other sectors, accumulated volumes, and location. In this study, it was considered the most typical and widespread biomass (often waste), therefore, the final cost of the slurry did not increase much. Fuel with rapeseed oil is an exception, since the latter is more expensive than coal. At present, rapeseed oil is actively used in the food and energy industries to produce biodiesel. Thus, its extensive use increases the cost of slurries.
Using the method from [17], the preparation, storage, and combustion costs were calculated for coal (main fuel) and slurry fuels based on coal flotation waste at a thermal power plant. When switching from traditional fuel to slurries, the amount of the necessary equipment for the systems listed above decreases significantly, hence the costs are reduced as well. Costly equipment (unloader, belt conveyor, crusher, pulverizer, raw coal and coal dust bunker, sizer, cyclone, etc.) for coal storage, pulverization, and transportation is no longer needed. The fuel system, when using composite fuels based on coal processing waste, includes much fewer elements and consists of tanks for storing separate components and ready-to-use slurries with a homogenizer and fuel feeding system. When using filter cake, no equipment for fuel pulverization and transportation on the conveyor is needed, since coal particles are already 80–140 µm in size.
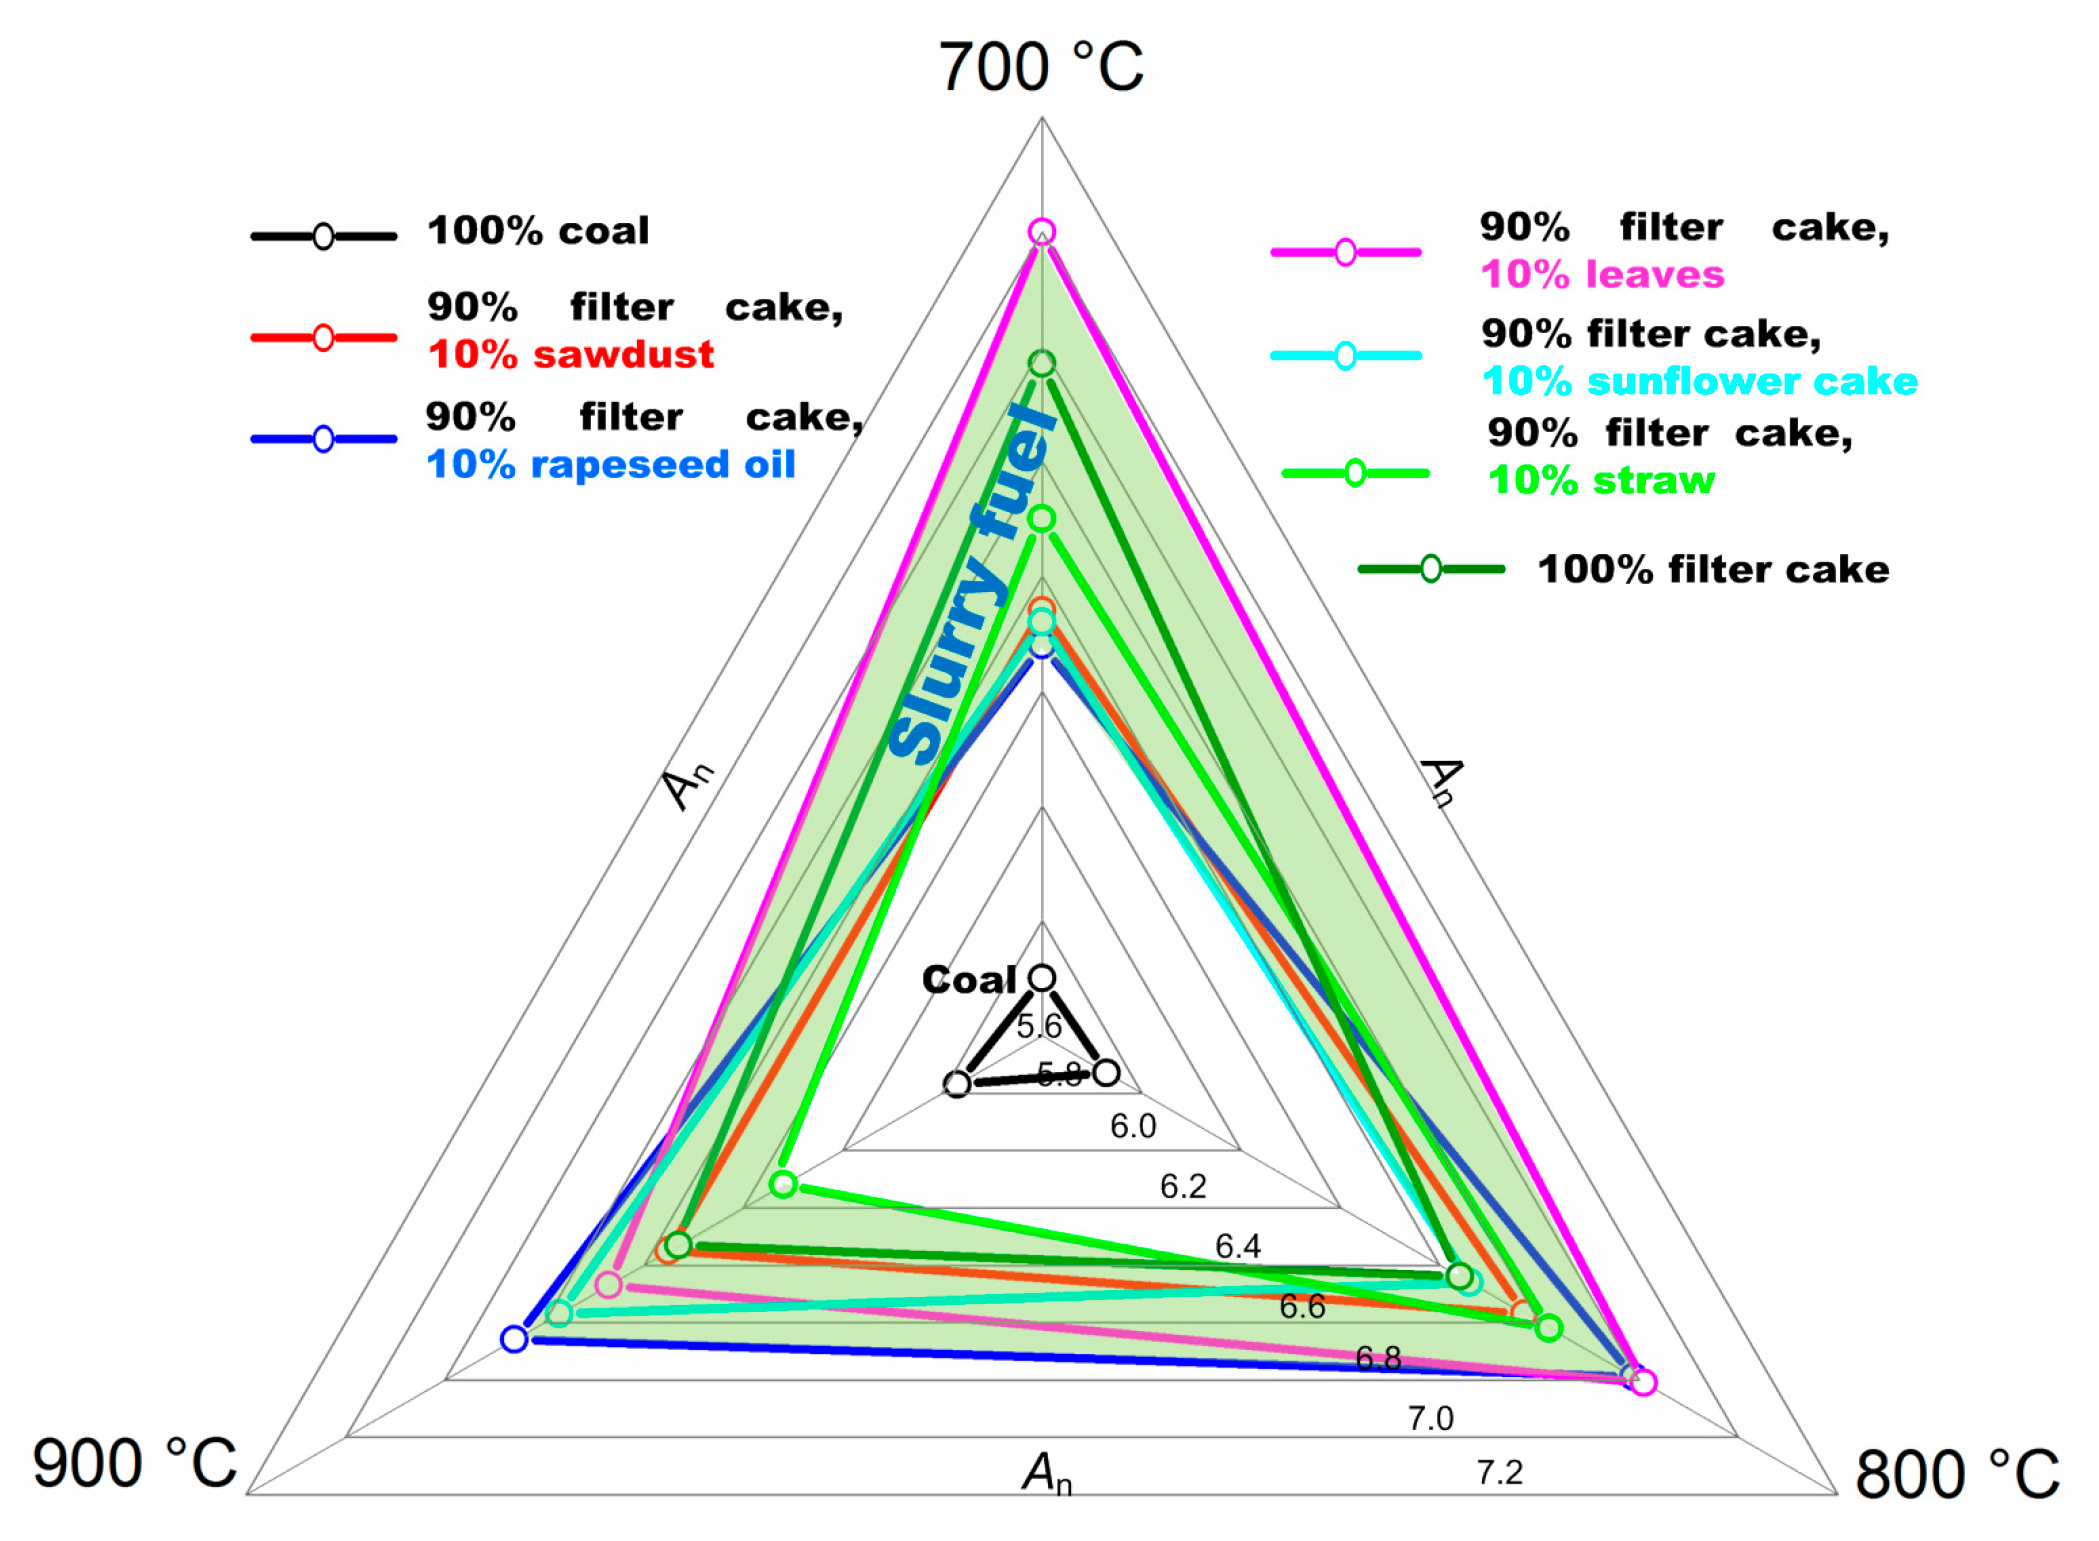
Using Equation (1), it was calculated the relative efficiency indicator for all the fuels. The results are presented in Table 6. Figure 5 presents an angle diagram to illustrate the regions of minor and, on the contrary, great differences in the integral characteristics, studied for the six compositions vs. coal.
The findings (Table 6, Figure 5) show that all the slurries are characterized by a higher complex efficiency indicator than coal (green region in Figure 5). Obtained results show that replacing conventional coal with slurries will make it possible to increase the fuel efficiency by 10%–24%, depending on the combustion conditions and type of biomass used in the mixture. The composition with 90% filter cake and 10% leaves features the maximum An. This fuel has quite good indicators in all the criteria, which leads to the highest An. Considering these criteria separately (Table 5), the composition with 90% filter cake and 10% rapeseed oil was the best in the group in most of the criteria, however the high cost of rapeseed oil and its low ignition indicator led to a lower overall efficiency An. Therefore, it is reasonable to choose the type and concentration of biomass in the fuel composition, evaluating a complex of environmental, economic, and energy performance indicators.
4. Conclusions
(i) The analysis of possible slurry fuel components showed good prospects of using different kinds of biomass as additional fuel components in real practice. In terms of the scale of distribution and the main energy performance characteristics, the most relevant kinds of biomass include wood and agricultural waste (sawdust, straw, bagasse, leaves, shell) and oil production waste (oil cake).
(ii) It was experimentally established that the co-combustion of biomass and coal processing waste can reduce the concentrations of NOx by 25–62% and SOx by 61%–88% compared to dry coal combustion conditions. The presence of water and an additional biomass component in the fuel composition significantly reduces the concentrations of sulfur and nitrogen oxides formed during their combustion.
(iii) The efficiency of fuel compositions with biomass, when using slurry combustion technologies, exceeds that of coal by 10%–24% in terms of environmental, economic, and energy performance indicators. It can vary from 6.12 to 7.0. The temperature conditions of combustion, type of plant component used and its cost have a decisive effect.
Author Contributions
Conceptualization, D.G.; data curation, V.M.; formal analysis, G.N.; funding acquisition, D.G.; investigation, G.N. and K.V.; methodology, V.M.; project administration, K.V.; writing—original draft, G.N. and K.V.; writing—review and editing, D.G.. All authors have read and agreed to the published version of the manuscript.
Funding
The reported study was funded by Russian Foundation for Basic Research, National Council of Brazil for Scientific and Technological Development and Ministry of Science & Technology Government of India according to the research project No 19–53–80019.
Conflicts of Interest
The authors declare no conflict of interest.
Nomenclature
| An | relative complex parameter |
| Ad | ash content, % |
| C | fuel cost, USD/kg |
| Cdaf, Hdaf, Ndaf, Odaf | fraction of carbon, hydrogen, nitrogen, oxygen in the sample converted to a dry ash free state, % |
| N | capital costs, USD |
| Qas | heat of combustion, MJ/kg |
| Std | fraction of sulfur in the sample converted to a dry state, % |
| Tbmax | maximum combustion temperature, °C |
| Tg | temperature in the combustion chamber, °C |
| Tgmin | minimum ignition temperature, °C |
| Tf | flash-point of liquid combustible component, °C |
| Tign | ignition temperature of liquid combustible component, °C |
| Vdaf | yield of volatiles of the sample in a dry ash-free state, % |
| Wa | moisture content of analytical sample in an air-dry state, % |
| τ | time, s |
| τd | ignition delay time, s |
References
- Malico, I.; Nepomuceno Pereira, R.; Gonçalves, A.C.; Sousa, A.M.O. Current status and future perspectives for energy production from solid biomass in the European industry. Renew. Sustain. Energy Rev. 2019, 112, 960–977. [Google Scholar] [CrossRef]
- Ahmad, A.A.; Zawawi, N.A.; Kasim, F.H.; Inayat, A.; Khasri, A. Assessing the gasification performance of biomass: A review on biomass gasification process conditions, optimization and economic evaluation. Renew. Sustain. Energy Rev. 2016, 53, 1333–1347. [Google Scholar] [CrossRef]
- Wang, C.; Feng, Q.; Lv, Q.; Zhao, L.; Du, Y.; Wang, P.; Zhang, J.; Che, D. Numerical Investigation on Co-firing Characteristics of Semi-Coke and Lean Coal in a 600 MW Supercritical Wall-Fired Boiler. Appl. Sci. 2019, 9, 889. [Google Scholar] [CrossRef] [Green Version]
- AlNouss, A.; McKay, G.; Al-Ansari, T. Production of syngas via gasification using optimum blends of biomass. J. Clean. Prod. 2020, 242, 118499. [Google Scholar] [CrossRef]
- Sikarwar, V.S.; Zhao, M.; Clough, P.; Yao, J.; Zhong, X.; Memon, M.Z.; Shah, N.; Anthony, E.J.; Fennell, P.S. An overview of advances in biomass gasification. Energy Environ. Sci. 2016, 9, 2939–2977. [Google Scholar] [CrossRef] [Green Version]
- Nipattummakul, N.; Ahmed, I.I.; Kerdsuwan, S.; Gupta, A.K. Hydrogen and syngas production from sewage sludge via steam gasification. Int. J. Hydrog. Energy 2010, 35, 11738–11745. [Google Scholar] [CrossRef]
- Bhuiyan, A.A.; Blicblau, A.S.; Islam, A.K.M.S.; Naser, J. A review on thermo-chemical characteristics of coal/biomass co-firing in industrial furnace. J. Energy Inst. 2018, 91, 1–18. [Google Scholar] [CrossRef]
- Kopczyński, M.; Lasek, J.A.; Iluk, A.; Zuwała, J. The co-combustion of hard coal with raw and torrefied biomasses (willow (Salix viminalis), olive oil residue and waste wood from furniture manufacturing). Energy 2017, 140, 1316–1325. [Google Scholar] [CrossRef]
- Fu, B.; Liu, G.; Mian, M.M.; Zhou, C.; Sun, M.; Wu, D.; Liu, Y. Co-combustion of industrial coal slurry and sewage sludge: Thermochemical and emission behavior of heavy metals. Chemosphere 2019, 233, 440–451. [Google Scholar] [CrossRef]
- Nyashina, G.S.; Kuznetsov, G.V.; Strizhak, P.A. Effects of plant additives on the concentration of sulfur and nitrogen oxides in the combustion products of coal-water slurries containing petrochemicals. Environ. Pollut. 2020, 258, 113682. [Google Scholar] [CrossRef]
- Peng, W.X.; Ge, S.B.; Ebadi, A.G.; Hisoriev, H.; Esfahani, M.J. Syngas production by catalytic co-gasification of coal-biomass blends in a circulating fluidized bed gasifier. J. Clean. Prod. 2017, 168, 1513–1517. [Google Scholar] [CrossRef]
- Trippe, F.; Fröhling, M.; Schultmann, F.; Stahl, R.; Henrich, E. Techno-economic assessment of gasification as a process step within biomass-to-liquid (BtL) fuel and chemicals production. Fuel Process. Technol. 2011, 92, 2169–2184. [Google Scholar] [CrossRef]
- Chyou, Y.-P.; Chang, D.-M.; Chen, P.-C.; Chien, H.-Y.; Wu, K.-T.; Chein, R.-Y. Development of Biomass Gasification Technology with Fluidized-Bed Reactors for Enhancing Hydrogen Generation: Part I, Hydrodynamic Characterization of Dual Fluidized-Bed Gasifiers. Appl. Sci. 2019, 10, 2. [Google Scholar] [CrossRef] [Green Version]
- AlNouss, A.; McKay, G.; Al-Ansari, T. A techno-economic-environmental study evaluating the potential of oxygen-steam biomass gasification for the generation of value-added products. Energy Convers. Manag. 2019, 196, 664–676. [Google Scholar] [CrossRef]
- Nyashina, G.S.; Kurgankina, M.A.; Strizhak, P.A. Environmental, economic and energetic benefits of using coal and oil processing waste instead of coal to produce the same amount of energy. Energy Convers. Manag. 2018, 174, 175–187. [Google Scholar] [CrossRef]
- Kurgankina, M.A.; Nyashina, G.S.; Strizhak, P.A. Advantages of switching coal-burning power plants to coal-water slurries containing petrochemicals. Appl. Therm. Eng. 2019, 147, 998–1008. [Google Scholar] [CrossRef]
- Kurgankina, M.A.; Nyashina, G.S.; Strizhak, P.A. Prospects of thermal power plants switching from traditional fuels to coal-water slurries containing petrochemicals. Sci. Total Environ. 2019, 671, 568–577. [Google Scholar] [CrossRef]
- Nyashina, G.S.; Shlegel, N.E.; Vershinina, K.Y.; Strizhak, P.A. Industrial Waste as Part of Coal-Water Slurry Fuels. Energy Fuels 2018, 32, 11398–11410. [Google Scholar] [CrossRef]
- Zaitsev, A.S.; Egorov, R.I.; Strizhak, P.A. Light-induced gasification of the coal-processing waste: Possible products and regimes. Fuel 2018, 212, 347–352. [Google Scholar] [CrossRef]
- Nyashina, G.; Strizhak, P. Impact of Forest Fuels on Gas Emissions in Coal Slurry Fuel Combustion. Energies 2018, 11, 2491. [Google Scholar] [CrossRef] [Green Version]
- Kumar, A.; Sah, B.; Singh, A.R.; Deng, Y.; He, X.; Kumar, P.; Bansal, R.C. A review of multi criteria decision making (MCDM) towards sustainable renewable energy development. Renew. Sustain. Energy Rev. 2017, 69, 596–609. [Google Scholar] [CrossRef]
- Haddad, B.; Liazid, A.; Ferreira, P. A multi-criteria approach to rank renewables for the Algerian electricity system. Renew. Energy 2017, 107, 462–472. [Google Scholar] [CrossRef]
- Sahu, S.G.; Chakraborty, N.; Sarkar, P. Coal-biomass co-combustion: An overview. Renew. Sustain. Energy Rev. 2014, 39, 575–586. [Google Scholar] [CrossRef]
- Sh, L.; Lee, B.-H.; Lee, Y.-J.; Jeon, C.-H. Comparing the Physicochemical Properties of Upgraded Biomass Fuel by Torrefaction and the Ashless Technique. Appl. Sci. 2019, 9, 5519. [Google Scholar] [CrossRef] [Green Version]
- Socci, J.; Saraeian, A.; Stefanidis, S.D.; Banks, S.W.; Shanks, B.H.; Bridgwater, T. The role of catalyst acidity and shape selectivity on products from the catalytic fast pyrolysis of beech wood. J. Anal. Appl. Pyrolysis 2019. [Google Scholar] [CrossRef]
- Johansson, A.C.; Sandström, L.; Öhrman, O.G.W.; Jilvero, H. Co-pyrolysis of woody biomass and plastic waste in both analytical and pilot scale. J. Anal. Appl. Pyrolysis 2018, 134, 102–113. [Google Scholar] [CrossRef]
- Riaza, J.; Mason, P.; Jones, J.M.; Gibbins, J.; Chalmers, H. High temperature volatile yield and nitrogen partitioning during pyrolysis of coal and biomass fuels. Fuel 2019, 248, 215–220. [Google Scholar] [CrossRef]
- Pighinelli, A.L.M.T.; Boateng, A.A.; Mullen, C.A.; Elkasabi, Y. Evaluation of Brazilian biomasses as feedstocks for fuel production via fast pyrolysis. Energy Sustain. Dev. 2014, 21, 42–50. [Google Scholar] [CrossRef]
- Mishra, R.K.; Mohanty, K. Thermal and catalytic pyrolysis of pine sawdust (Pinus ponderosa) and Gulmohar seed (Delonix regia) towards production of fuel and chemicals. Mater. Sci. Energy Technol. 2019, 2, 139–149. [Google Scholar] [CrossRef]
- Mishra, R.K.; Mohanty, K. Pyrolysis kinetics and thermal behavior of waste sawdust biomass using thermogravimetric analysis. Bioresour. Technol. 2018, 251, 63–74. [Google Scholar] [CrossRef]
- Kozlov, A. The study of the kinetics of formation of gaseous products during thermochemical conversion of woody biomass. E3S Web Conf. 2019, 114, 07008. [Google Scholar] [CrossRef]
- Zubkova, V.; Strojwas, A.; Bielecki, M.; Kieush, L.; Koverya, A. Comparative study of pyrolytic behavior of the biomass wastes originating in the Ukraine and potential application of such biomass. Part 1. Analysis of the course of pyrolysis process and the composition of formed products. Fuel 2019, 254, 115688. [Google Scholar] [CrossRef]
- Akubo, K.; Nahil, M.A.; Williams, P.T. Pyrolysis-catalytic steam reforming of agricultural biomass wastes and biomass components for production of hydrogen/syngas. J. Energy Inst. 2019, 92, 1987–1996. [Google Scholar] [CrossRef]
- Liu, X.; Luo, Z.; Yu, C.; Xie, G. Conversion mechanism of fuel-N during pyrolysis of biomass wastes. Fuel 2019, 246, 42–50. [Google Scholar] [CrossRef]
- Tian, H.; Jiao, H.; Cai, J.; Wang, J.; Yang, Y.; Bridgwater, A.V. Co-pyrolysis of Miscanthus Sacchariflorus and coals: A systematic study on the synergies in thermal decomposition, kinetics and vapour phase products. Fuel 2020, 262, 116603. [Google Scholar] [CrossRef]
- Pelaez-Samaniego, M.R.; Mesa-Pérez, J.; Cortez, L.A.B.; Rocha, J.D.; Sanchez, C.G.; Marín, H. Use of blends of gasoline with biomass pyrolysis-oil derived fractions as fuels in an Otto engine. Energy Sustain. Dev. 2011, 15, 376–381. [Google Scholar] [CrossRef]
- Yi, L.; Liu, H.; Li, S.; Li, M.; Wang, G.; Man, G.; Yao, H. Catalytic pyrolysis of biomass wastes over Org-CaO/Nano-ZSM-5 to produce aromatics: Influence of catalyst properties. Bioresour. Technol. 2019, 294, 122186. [Google Scholar] [CrossRef]
- Li, J.; Qiao, Y.; Zong, P.; Qin, S.; Wang, C.; Tian, Y. Fast pyrolysis characteristics of two typical coastal zone biomass fuels by thermal gravimetric analyzer and down tube reactor. Bioresour. Technol. 2019, 283, 96–105. [Google Scholar] [CrossRef]
- David, E.; Kopac, J. Pyrolysis of rapeseed oil cake in a fixed bed reactor to produce bio-oil. J. Anal. Appl. Pyrolysis 2018, 134, 495–502. [Google Scholar] [CrossRef]
- Chang, Z.; Duan, P.; Xu, Y. Catalytic hydropyrolysis of microalgae: Influence of operating variables on the formation and composition of bio-oil. Bioresour. Technol. 2015, 184, 349–354. [Google Scholar] [CrossRef]
- Li, D.; Wu, D.; Xu, F.; Lai, J.; Shao, L. Literature overview of Chinese research in the field of better coal utilization. J. Clean. Prod. 2018, 185, 959–980. [Google Scholar] [CrossRef]
- Zhao, C.; Luo, K. Sulfur, arsenic, fluorine and mercury emissions resulting from coal-washing byproducts: A critical component of China’s emission inventory. Atmos. Environ. 2017, 152, 270–278. [Google Scholar] [CrossRef]
- Yang, Z.; Zhang, Y.; Liu, L.; Wang, X.; Zhang, Z. Environmental investigation on co-combustion of sewage sludge and coal gangue: SO2, NOx and trace elements emissions. Waste Manag. 2016, 50, 213–221. [Google Scholar] [CrossRef] [PubMed]
- McIlveen-Wright, D.R.; Pinto, F.; Armesto, L.; Caballero, M.A.; Aznar, M.P.; Cabanillas, A.; Huang, Y.; Franco, C.; Gulyurtlu, I.; McMullan, J.T. A comparison of circulating fluidised bed combustion and gasification power plant technologies for processing mixtures of coal, biomass and plastic waste. Fuel Process. Technol. 2006, 87, 793–801. [Google Scholar] [CrossRef]
- Haykiri-Acma, H.; Turan, A.Z.; Yaman, S.; Kucukbayrak, S. Controlling the excess heat from oxy-combustion of coal by blending with biomass. Fuel Process. Technol. 2010, 91, 1569–1575. [Google Scholar] [CrossRef]
- Staroń, A.; Kowalski, Z.; Staroń, P.; Banach, M. Analysis of the useable properties of coal-water fuel modified with chemical compounds. Fuel Process. Technol. 2016, 152, 183–191. [Google Scholar] [CrossRef]
- Yanik, J.; Duman, G.; Karlström, O.; Brink, A. NO and SO2 emissions from combustion of raw and torrefied biomasses and their blends with lignite. J. Environ. Manag. 2018, 227, 155–161. [Google Scholar] [CrossRef]
- Burdukov, A.P.; Popov, V.I.; Tomilov, V.G.; Fedosenko, V.D. The rheodynamics and combustion of coal–water mixtures. Fuel 2002, 81, 927–933. [Google Scholar] [CrossRef]
- Daood, S.S.; Ord, G.; Wilkinson, T.; Nimmo, W. Fuel additive technology—NOx reduction, combustion efficiency and fly ash improvement for coal fired power stations. Fuel 2014, 134, 293–306. [Google Scholar] [CrossRef]
- Shahzad, K.; Saleem, M.; Kazmi, M.; Ali, Z.; Hussain, S.; Akhtar, N.A. Effect of Hydrodynamic Conditions on Emissions of NOx, SO2, and CO from Co-Combustion of Wheat Straw and Coal Under Fast Fluidized Bed Condition. Combust. Sci. Technol. 2016, 188, 1303–1318. [Google Scholar] [CrossRef]
- Zhao, B.; Su, Y.; Liu, D.; Zhang, H.; Liu, W.; Cui, G. SO2/NOx emissions and ash formation from algae biomass combustion: Process characteristics and mechanisms. Energy 2016, 113, 821–830. [Google Scholar] [CrossRef]
- Rokni, E.; Ren, X.; Panahi, A.; Levendis, Y.A. Emissions of SO2, NOx, CO2, and HCl from Co-firing of coals with raw and torrefied biomass fuels. Fuel 2018, 211, 363–374. [Google Scholar] [CrossRef]
- Armesto, L.; Bahillo, A.; Cabanillas, A.; Veijonen, K.; Otero, J.; Plumed, A.; Salvador, L. Co-combustion of coal and olive oil industry residues in fluidised bed. Fuel 2003, 82, 993–1000. [Google Scholar] [CrossRef]
- Zhang, Z.; Zeng, Q.; Hao, R.; He, H.; Yang, F.; Mao, X.; Mao, Y.; Zhao, P. Combustion behavior, emission characteristics of SO2, SO3 and NO, and in situ control of SO2 and NO during the co-combustion of anthracite and dried sawdust sludge. Sci. Total Environ. 2019, 646, 716–726. [Google Scholar] [CrossRef]
- Glushkov, D.O.; Paushkina, K.K.; Shabardin, D.P. Co-combustion of coal processing waste, oil refining waste and municipal solid waste: Mechanism, characteristics, emissions. Chemosphere 2020, 240, 124892. [Google Scholar] [CrossRef]
- McKay, G. Dioxin characterisation, formation and minimisation during municipal solid waste (MSW) incineration: Review. Chem. Eng. J. 2002, 86, 343–368. [Google Scholar] [CrossRef]
- Mukherjee, A.; Debnath, B.; Ghosh, S.K. A Review on Technologies of Removal of Dioxins and Furans from Incinerator Flue Gas. Procedia Environ. Sci. 2016, 35, 528–540. [Google Scholar] [CrossRef]
- Goering, C.E.; Schwab, A.W.; Daugherty, M.J.; Pryde, E.H.; Heakin, A.J. Fuel Properties of Eleven Vegetable Oils. Trans. ASAE 1982, 25, 1472–1477. [Google Scholar] [CrossRef]
- BP Statistical Review of World Energy 2019; Pureprint Group Limited: London, UK, 2019.
- Cho, M.J.; Choi, Y.S.; Paik, S.H.; Mun, H.S.; Cha, D.S.; Han, S.K.; Oh, J.H. Comparison of productivity and cost between two integrated harvesting systems in South Korea. Forests 2019, 10, 763. [Google Scholar] [CrossRef] [Green Version]
- Perea-Moreno, M.A.; Manzano-Agugliaro, F.; Perea-Moreno, A.J. Sustainable energy based on sunflower seed husk boiler for residential buildings. Sustain. 2018, 10, 3407. [Google Scholar] [CrossRef] [Green Version]
Figure 1.
Scheme of experimental setup.

Figure 2.
Frames of slurry fuel (90% filter cake, 10% straw) combustion.

Figure 3.
Ignition delay times of slurry droplets with biomass and coal vs. combustion chamber temperatures (a); threshold (minimum) ignition temperatures and maximum combustion temperatures of slurry droplets (b): 1%–100% coal; 2%–90% filter cake and 10% sawdust; 3%–90% filter cake and 10% rapeseed oil; 4%–90% filter cake and 10% leaves; 5%–90% filter cake and 10% sunflower cake; 6%–90% filter cake and 10% straw; 7%–100% filter cake. The Y-axis represents the fuel number. The caption to the figure shows these numbers and the corresponding fuel. Different color in (b) correspond to color in (a) that characterized different fuel compositions.
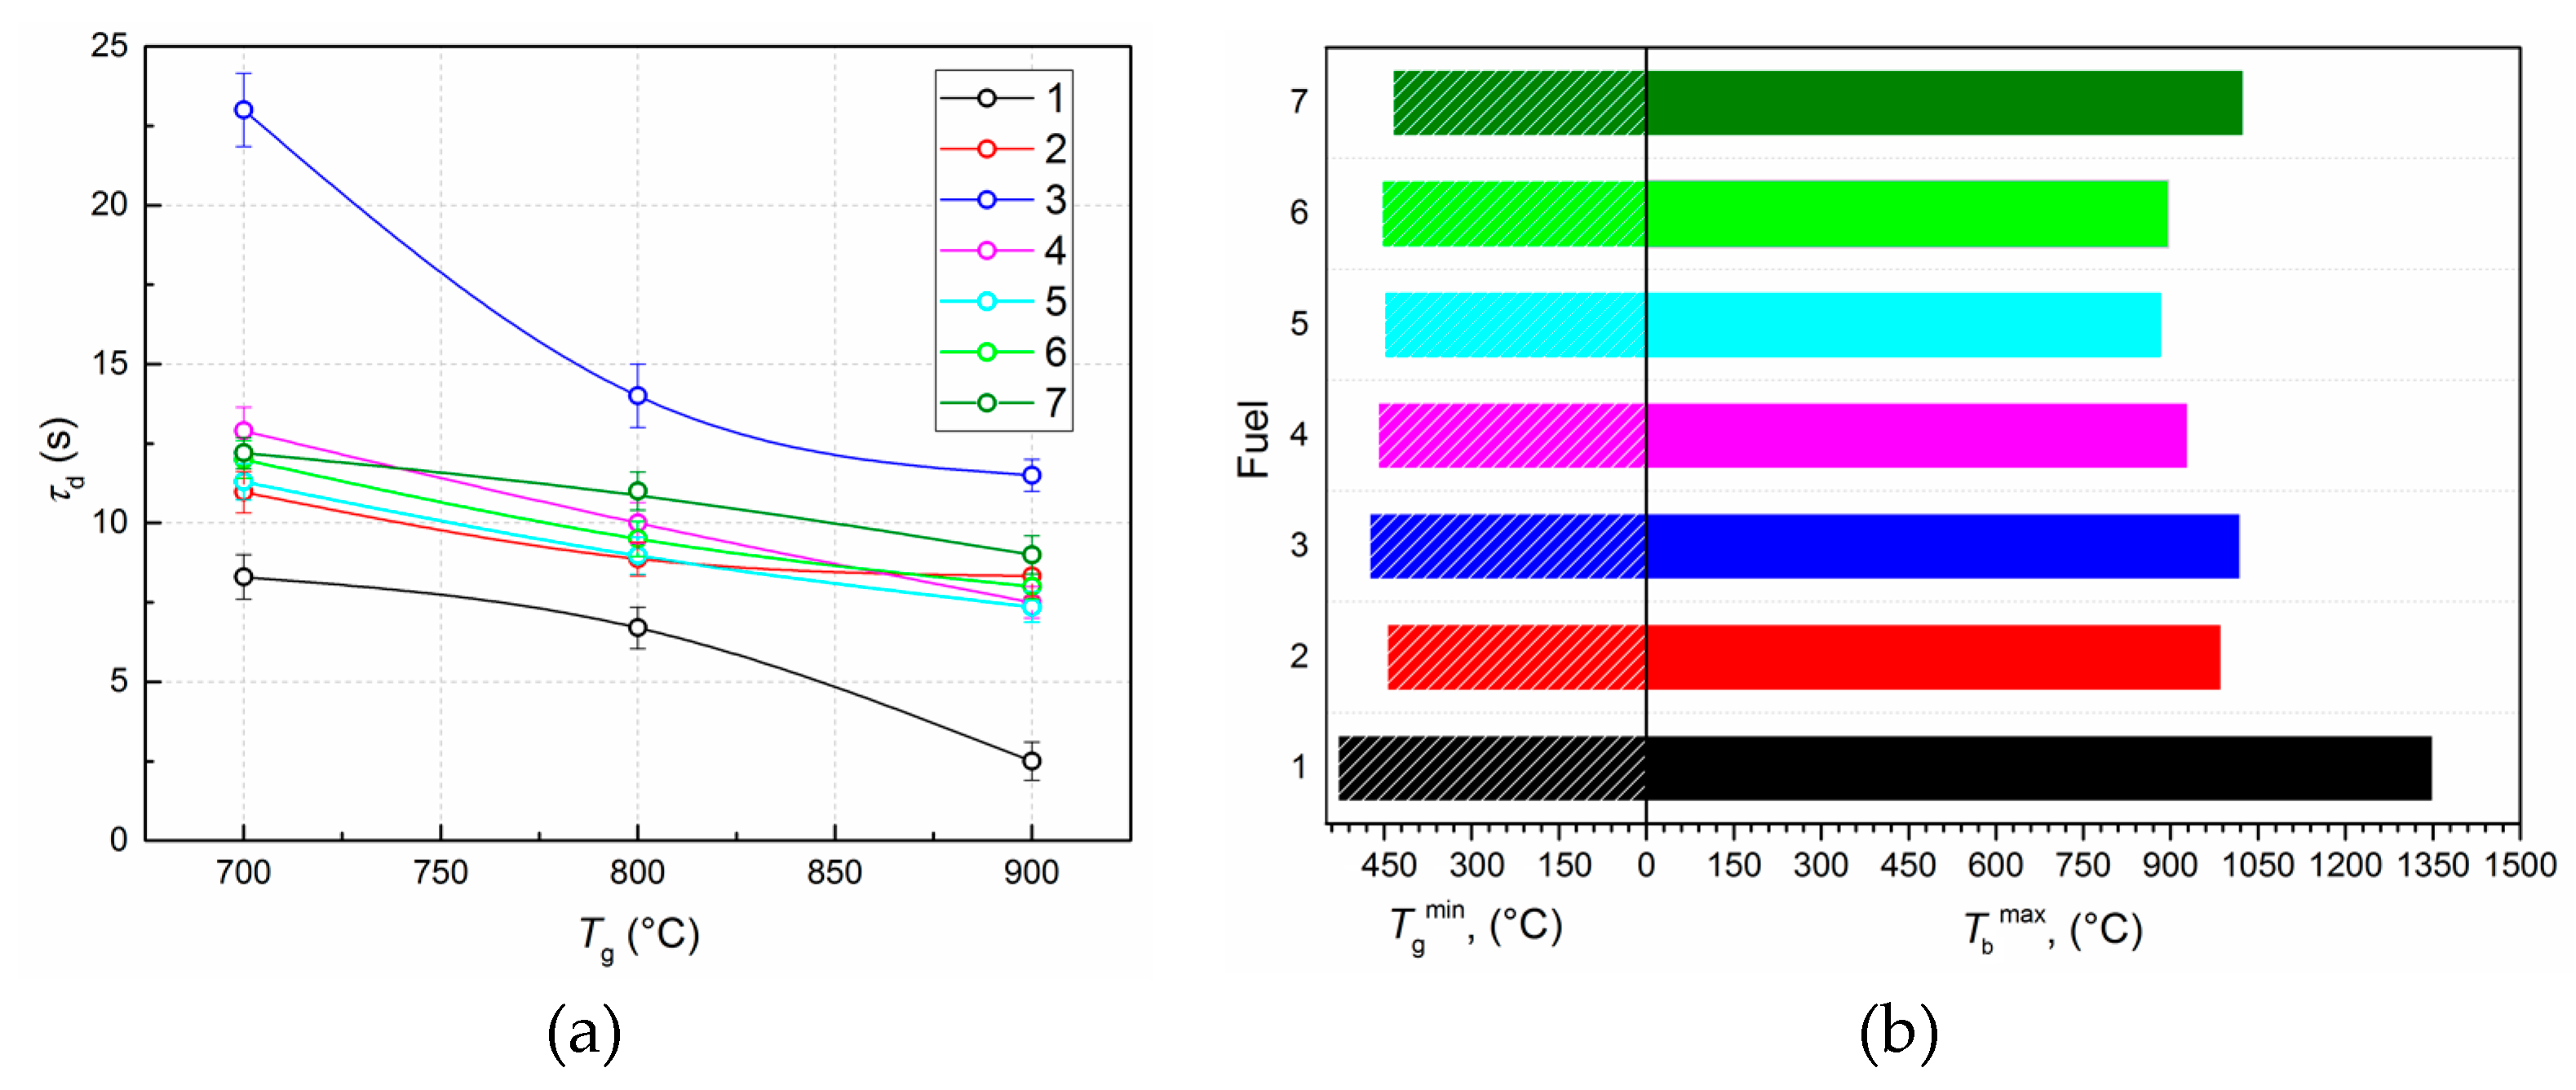
Figure 4.
Concentration of nitrogen (a) and sulfur oxides (b) emissions of slurry fuels with biomass and coal vs. combustion chamber temperatures: 1%– 00% coal; 2%–90% filter cake and 10% sawdust; 3%–90% filter cake and 10% rapeseed oil; 4%–90% filter cake and 10% leaves; 5%–90% filter cake and 10% sunflower cake; 6%–90% filter cake and 10% straw; 7%–100% filter cake.

Figure 5.
Comparison of integral efficiency indicator for all the fuels under study.

Table 1.
Kinds and characteristics of biomass, produced in abundance and used in fuel technologies in the world.
Table 1.
Kinds and characteristics of biomass, produced in abundance and used in fuel technologies in the world.
| Biomass | Country | Ultimate Analysis (wt %) | Proximate Analysis (wt %) | Ref. | ||||||||
|---|---|---|---|---|---|---|---|---|---|---|---|---|
| C | H | O | N | S | Moisture | Volatile Matter | Fixed Carbon | Ash | Heat of Combustion (MJ/kg) | |||
| Wood biomass | ||||||||||||
| Beech sawdust | Europe, Russia | 44.1 | 6.3 | 49.4 | 0.2 | 0 | 4.7 | 87.6 | 8 | 0.8 | 19.5 | [25] |
| Woody biomass (pine, fir) | Sweden | 51.6 | 6.2 | 42 | 0.1 | 0.021 | 4.3 | 83.8 | – | 0.3 | 19.36 | [26] |
| Wood pellet | UK | 52.34 | 6.8 | 40.7 | 0.16 | – | 6.7 | 84.3 | 15.7 | 0.8 | 20.8 | [27] |
| Eucalyptus wood | Brazil | 56.38 | 4.77 | 38.78 | 0.07 | – | 11.56 | 74.97 | 12.98 | 0.45 | 17.91 | [28] |
| Pine sawdust | India | 56.53 | 6.93 | 32.55 | 3.33 | 0.66 | 7.85 ± 0.05 | 77.27 ± 0.65 | 12.20 ± 0.15 | 2.78 ± 0.12 | 18.55 ± 0.43 | [29] |
| Pine sawdust | India | 50.32 | 6 | 42.99 | 0.69 | – | 6.09 ± 0.3 | 78.03 ± 0.2 | 12.16 ± 0.1 | 2.07 ± 0.03 | 18.44 ± 09 | [30] |
| Pine sawdust | Russian | 54.4 | 5.2 | 40.0 | 0.4 | – | 3.5 | 80.1 | 15.1 | 1.1 | – | [31] |
| Pine sawdust | Korea | 46.92 | 5.78 | 46.73 | 0.08 | 0.49 | 8.31 | 79.41 | 19.46 | 1.13 | – | [24] |
| Agricultural biomass | ||||||||||||
| Wheat straw | Ukraine | 51.5 | 5.75 | 41.97 | 0.65 | 0.13 | 6.84 | – | – | 11.59 ± 0.76 | 16.12 ± 0.19 | [32] |
| Wheat straw | UK | 40.58 | 4.84 | 53.84 | 0.74 | 0 | 5.19 | 64.24 | 15.60 | 14.97 | – | [33] |
| Wheat straw | China | 54.08 | 5.83 | 39.08 | 0.56 | 0.45 | 2.50 | 72.36 | 18.00 | 5.64 | – | [34] |
| Rice straw | China | 55.48 | 5.68 | 37.37 | 1.03 | 0.44 | 1.51 | 69.09 | 18.09 | 11.31 | – | [34] |
| Rice Husk | China | 37.6 | 5.26 | 55.45 | 1.69 | 0 | 8.02 | 61.43 | 12.53 | 18.02 | – | [33] |
| Energy crops | Northeast Asia, China | 50.73 | 7.08 | 41.95 | 0.14 | 0.10 | 10.67 | 65.65 | 18.34 | 5.34 | 17.00 | [35] |
| Sugar cane bagasse | India | 49.4 | 6.2 | 43.2 | 0.4 | 0.8 | 10 | 76 | 9.6 | 4.4 | 17.2 | [30] |
| Waste of sugar cane bagasse | Brazil | 44.7 | 5.8 | 48.97 | 0.45 | 0.08 | 9.92 | 81.55 | 6.90 | 11.57 | 17.74 | [36] |
| Corn stalks | Ukraine | 48.84 | 5.40 | 44.08 | 1.68 | 0.16 | 8.13 | – | – | 12.30 ± 0.87 | 14.24 ± 0.46 | [32] |
| Corn stalks | China | 46.6 | 5.8 | 47.0 | 0.4 | 0.2 | – | 86.9 | 11.8 | 1.3 | – | [37] |
| Corn waste (cob) | India | 49.28 | 5.9 | 44.2 | 0.54 | 0.08 | 10.2 | 80 | 4.2 | 5.7 | 15.5 | [30] |
| Jerusalem artichoke stalks | China | 45.36 | 6.11 | 47.26 | 0.75 | 0.52 | 15.76 | 67.4 | 13.5 | 3.34 | 15.69 | [38] |
| Oilseed waste | ||||||||||||
| Palm fruit bunches | United Arab Emirates | 44.06 | 5.97 | 49.05 | 0.74 | 0.18 | 8.73 | 67.51 | 17.47 | 6.28 | 17.2 | [5] |
| Date palm waste (leaves) | United Arab Emirates | 40.75 | 5.55 | 52.14 | 1.32 | 0.24 | 12.03 | 58.17 | 15.41 | 14.4 | 18.9 | [5] |
| Palm kernel cake | China | 57.22 | 5.93 | 34.10 | 2.46 | 0.29 | 2.88 | 75.83 | 15.99 | 5.30 | – | [34] |
| Sunflower husks | Ukraine | 52.76 | 6.32 | 38.31 | 2.61 | 0.14 | 6.1 | – | – | 6.81 ± 0.51 | 19.31 ± 0.13 | [32] |
| Seeds de-oil cake | China | 45.3 | 6.2 | 43.8 | 4.5 | 0.2 | – | 73.5 | 18.2 | 7.3 | – | [37] |
| Olive waste | UK | 52.8 | 6.5 | 39.1 | 1.6 | – | 5.9 | 80.1 | 19.9 | 7.6 | 20.1 | [27] |
| Rapeseed oil cake | Romania | 45.95 | 6.21 | 40.17 | 6.76 | 0.91 | 10.02 | 67.84 | 15.47 | 6.77 | 25.41 | [39] |
| Shell and husk | ||||||||||||
| Nut shell (areca) | India | 48.71 | 5.79 | 43.45 | 1.95 | 0.1 | 7.43 ± 0.1 | 74.05 ± 0.2 | 15.55 ± 0.3 | 2.48 ± 0.05 | 18.21 ± 09 | [30] |
| Coconut shell | UK | 48.31 | 5.26 | 46.14 | 0.29 | 0 | 7.16 | 68.58 | 22.00 | 2.26 | – | [33] |
| Walnut shell | Ukraine | 51.56 | 5.66 | 48.44 | 1.98. | 0.11. | 4.1 | – | – | 0.41 ± 0.11 | 16.79 ± 0.08 | [32] |
| Peanut shell | China | 49.8 | 5.8 | 43.7 | 0.6 | 0.1 | – | 84.1 | 14.5 | 1.4 | – | [37] |
| Palm kernel shell | UK | 50.1 | 6.24 | 42.16 | 1.50 | 0 | 6.70 | 67.52 | 22.13 | 3.65 | – | [33] |
| Other | ||||||||||||
| Algae | China | 58.9 | 7.0 | 25.4 | 8.2 | 0.5 | 10 | 81 | 16 | 9 | – | [40] |
| Cotton stalk | India | 46.3 | 6.4 | 46.8 | 0.3 | 0.2 | 8.9 | 71 | 16.6 | 3.5 | 19.2 | [30] |
Table 2.
Typical properties of fuel slurry components.
| Component | Proximate Analysis | Ultimate Snalysis | |||||||
|---|---|---|---|---|---|---|---|---|---|
| Water Fraction, % | Ad, % | Vdaf, % | Qas, MJ/kg | Cdaf, % | Hdaf, % | Ndaf, % | Std, % | Odaf, % | |
| Solid components in dry state | |||||||||
| Coal | 2.05 | 14.65 | 27.03 | 29.76 | 80.10 | 4.49 | 1.84 | 0.87 | 12.70 |
| Filter cake | 43.5 | 26.46 | 23.08 | 24.83 | 87.38 | 5.09 | 2.05 | 1.02 | 4.46 |
| Leaves (birch) | 6.95 | 6.25 | 76.85 | 17.05 | 49.91 | 5.92 | 0.86 | 0.09 | 43.22 |
| Straw (wheat) | 7.0 | 2.8 | 78.5 | 17.7 | 50.20 | 6.36 | 1.09 | traces | 42.35 |
| Sunflower cake | 11.5 | 5.9 | 81 | 16.6 | 48.44 | 6.92 | 3.05 | traces | 41.59 |
| Sawdust (pine) | 7.0 | 1.6 | 83.4 | 18.1 | 52.5 | 6.58 | 0.22 | traces | 40.70 |
| Liquid component | |||||||||
| Tf, oC | Tign, oC | Qas, MJ/kg | C, % | H, % | N, % | O, % | S, % | ||
| Rapeseed oil | 225 | 260 | 42.1 | 79.6 | 11.4 | 0 | 8.97 | 0.03 | |
Table 3.
Fuels list.
| No. of Fuel Composition | Fuel Components |
|---|---|
| 1 | 100% coal |
| 2 | 90% filter cake, 10% sawdust |
| 3 | 90% filter cake, 10% rapeseed oil |
| 4 | 90% filter cake, 10% leaves |
| 5 | 90% filter cake, 10% sunflower cake |
| 6 | 90% filter cake, 10% straw |
| 7 | 100% filter cake |
Table 4.
Criteria of fuel efficiency evaluation using the Weighted Sum Method (WSM).
| Group | Criteria |
|---|---|
| Energy performance | Ignition delay times, τd (s) |
| Maximum combustion temperature, Tbmax (°C) | |
| Minimum ignition temperature, Tgmin (°C) | |
| Heat of combustion, Qas (MJ/kg) | |
| Ash content, Ad (%) | |
| Environmental | Nitrogen oxide emissions, NOx (ppm) |
| Sulfur oxide emissions, SOx (ppm) | |
| Economic | Fuel cost, C (USD/kg) |
| Capital costs, N (USD) |
Table 5.
Absolute (abs) and normalized (norm) fuel efficiency evaluation criteria for WSM method.
| Criteria | Fuel * | ||||||||||||||
|---|---|---|---|---|---|---|---|---|---|---|---|---|---|---|---|
| 1 | 2 | 3 | 4 | 5 | 6 | 7 | |||||||||
| abs | norm | abs | norm | abs | norm | abs | norm | abs | norm | abs | norm | abs | norm | ||
| τd, s | at 700 °C | 8.3 | 1 | 10.97 | 0.76 | 23 | 0.36 | 12.9 | 0.64 | 11.3 | 0.74 | 12 | 0.69 | 12.2 | 0.68 |
| at 800 °C | 6.7 | 1 | 8.87 | 0.76 | 14 | 0.48 | 10 | 0.67 | 8.97 | 0.75 | 9.5 | 0.71 | 11.3 | 0.59 | |
| at 900 °C | 2.5 | 1 | 8.33 | 0.30 | 11.5 | 0.22 | 7.5 | 0.33 | 7.36 | 0.34 | 8 | 0.31 | 9.5 | 0.26 | |
| Tbmax, °C | 1350 | 1 | 987 | 0.73 | 1020 | 0.76 | 930 | 0.69 | 885 | 0.66 | 896 | 0.66 | 1025 | 0.76 | |
| Tgmin, °C | 530 | 0.84 | 445 | 1 | 475 | 0.94 | 461 | 0.96 | 449 | 0.99 | 454 | 0.98 | 448 | 0.99 | |
| Qas, MJ/kg | 29.76 | 1 | 14.55 | 0.49 | 18.96 | 0.64 | 14.44 | 0.49 | 14.4 | 0.34 | 14.51 | 0.49 | 14,15 | 0.47 | |
| Ad, % | 14.65 | 0.79 | 13.61 | 0.85 | 11.64 | 1 | 14.08 | 0.83 | 14.04 | 0.83 | 13.73 | 0.85 | 14.95 | 0.78 | |
| NOx, ppm | at 700 °C | 140 | 0.41 | 80 | 0.71 | 57 | 1 | 78 | 0.73 | 84 | 0.68 | 104 | 0.55 | 80 | 0.71 |
| at 800 °C | 179 | 0.45 | 100 | 0.8 | 80 | 1 | 130 | 0.53 | 108 | 0.74 | 122 | 0.66 | 157 | 0.51 | |
| at 900 °C | 320 | 0.38 | 165 | 0.73 | 120 | 1 | 180 | 0.57 | 130 | 0.92 | 150 | 0.8 | 242 | 0.49 | |
| SOx, ppm | at 700 °C | 65 | 0.11 | 25 | 0.28 | 14.5 | 0.48 | 8 | 0.88 | 15 | 0.47 | 7 | 1 | 17 | 0.41 |
| at 800 °C | 205 | 0.10 | 48 | 0.42 | 23 | 0.87 | 25 | 0.8 | 40 | 0.5 | 20 | 1 | 55 | 0.36 | |
| at 900 °C | 274 | 0.20 | 78 | 0.72 | 56 | 1 | 77 | 0.73 | 64 | 0.88 | 75 | 0.75 | 98 | 0.57 | |
| C, USD/kg | 0.08 | 0.125 | 0.019 | 0.52 | 0.090 | 0.11 | 0.013 | 0.75 | 0.016 | 0.62 | 0.012 | 0.85 | 0.01 | 1 | |
| N, USD | 665.000 | 0.43 | 290.000 | 1 | 290.000 | 1 | 290.000 | 1 | 290.000 | 1 | 290.000 | 1 | 290.000 | 1 | |
* Note: 1%–100% coal; 2%–90% filter cake and 10% sawdust; 3%–90% filter cake and 10% rapeseed oil; 4%–90% filter cake and 10% leaves; 5%–90% filter cake and 10% sunflower cake; 6%–90% filter cake and 10% straw.
Table 6.
Resulting efficiency indicators calculated according WSM.
| Temperature | An | ||||||
|---|---|---|---|---|---|---|---|
| 100% Coal | 90% Filter Cake, 10% Sawdust | 90% Filter Cake, 10% Rapeseed Oil | 90% Filter Cake, 10% Leaves | 90% Filter Cake, 10% Sunflower Cake | 90% Filter Cake, 10% Straw | 100% Filter Cake | |
| 700 °C | 5.70 | 6.34 | 6.28 | 7.0 | 6.32 | 6.50 | 6.77 |
| 800 °C | 5.73 | 6.57 | 6.79 | 6.81 | 6.46 | 6.62 | 6.44 |
| 900 °C | 5.77 | 6.35 | 6.66 | 6.47 | 6.57 | 6.12 | 6.33 |
© 2020 by the authors. Licensee MDPI, Basel, Switzerland. This article is an open access article distributed under the terms and conditions of the Creative Commons Attribution (CC BY) license (http://creativecommons.org/licenses/by/4.0/).
Share and Cite
MDPI and ACS Style
Glushkov, D.; Nyashina, G.; Medvedev, V.; Vershinina, K. Relative Environmental, Economic, and Energy Performance Indicators of Fuel Compositions with Biomass. Appl. Sci. 2020, 10, 2092. https://doi.org/10.3390/app10062092
AMA Style
Glushkov D, Nyashina G, Medvedev V, Vershinina K. Relative Environmental, Economic, and Energy Performance Indicators of Fuel Compositions with Biomass. Applied Sciences. 2020; 10(6):2092. https://doi.org/10.3390/app10062092
Chicago/Turabian StyleGlushkov, Dmitrii, Galina Nyashina, Valeriy Medvedev, and Kseniya Vershinina. 2020. "Relative Environmental, Economic, and Energy Performance Indicators of Fuel Compositions with Biomass" Applied Sciences 10, no. 6: 2092. https://doi.org/10.3390/app10062092
Note that from the first issue of 2016, this journal uses article numbers instead of page numbers. See further details here.