Article

The Importance of Incorporating Denitrification in the Assessment of Groundwater Vulnerability

by
Gianluigi Busico
1,2,
Nerantzis Kazakis
2,*,
Nicolò Colombani
3,
Khabat Khosravi
4,
Konstantinos Voudouris
2 and
Micòl Mastrocicco
1
1
Department of Environmental, Biological and Pharmaceutical Sciences and Technologies, University of Campania “Luigi Vanvitelli”, Via Vivaldi 43, 81100 Caserta, Italy
2
Department of Geology, Lab. of Engineering Geology & Hydrogeology, Aristotle University of Thessaloniki, 54124 Thessaloniki, Greece
3
Department of Materials, Environmental Sciences and Urban Planning “SIMAU”, Polytechnic University of Marche, via Brecce Bianche 12, 60131 Ancona, Italy
4
School of Engineering, University of Guelph, ON N1G 2W1, Canada
*
Author to whom correspondence should be addressed.
Appl. Sci. 2020, 10(7), 2328; https://doi.org/10.3390/app10072328
Submission received: 27 February 2020 / Revised: 23 March 2020 / Accepted: 26 March 2020 / Published: 28 March 2020
(This article belongs to the Special Issue Denitrification in Agricultural Soils)

Abstract

:
Human activities are deeply connected with groundwater reservoirs, so protecting them from pollution has become a priority in many regions of the world. Nitrate is considered the main groundwater pollutant since it is directly linked to many human activities. Agricultural activities and domestic wastewater have been identified as the main sources of nitrate in groundwater. Nevertheless, there are some natural processes that can mitigate nitrate pollution. Together with dilution processes, the degradation of nitrate through denitrification has been acknowledge as a process that can potentially reduce nitrogen loads, in both deep and shallow aquifers. Usually these processes were not properly quantified in vulnerability assessment methods, until the introduction of LOS indices. In this study, the application of the LOS indices on 4 agricultural areas is discussed, highlighting how the LOS indices can identify portions of the landscape with higher potential denitrification and how they directly enhance the groundwater vulnerability assessment. Previous studies have shown that LOS indices are a valuable tool for proper vulnerability assessment to nitrate, however they need to be coupled with other parameters that also describe nitrate behavior in groundwater. The SINTACS-SVN and DRASTIC-PA methods that include the LOS indices, were applied for the first time in the Epanomi coastal area to evaluate the reliably of the assessment and, despite the different classes range and the weights applied, similar groundwater vulnerability assessment maps were obtained. The nitrate vulnerability maps were comparable with the observed nitrate concentrations and were found to be highly comparable with original LOS maps. Nevertheless, it should be kept in mind that vulnerability methods are only screening tools and groundwater quality observations are pivotal information for environmental management.

1. Introduction

Groundwater pollution represents one of the main concerns all over the world, especially for those regions where agriculture is the primary activity. This is mainly due to the high dependence of all human assets (agricultural, industrial, municipals, etc.) on groundwater resources, that could make them highly susceptible to external pollution [1]. The intensive use of groundwater resources, indeed, influences not only water availability but also groundwater quality, bringing to its progressive deterioration over time [2].
One of the most common pollutants, generally associated with groundwater degradation, is surely nitrate [3]. The European Commission [4] established that a nitrate concentration higher than 25 mg/L is enough to consider water resources at risk of pollution, and 50 mg/L of nitrate is fixed as the maximum value not to be exceeded in many regions. Intensive agricultural practices, together with domestic wastewater disposal, industrial discharge and urban activities have been identified as the main sources of nitrate in groundwater [5,6,7,8]. Generally, the alluvial plains are the areas more characterized by intensive agricultural activities and accordingly they are often affected by groundwater nitrate pollution [9,10,11,12].
When the assessment of nitrate pollution in groundwater has to be done, the chemical–biological processes of contaminant attenuation are often not properly considered. In an agricultural environment, it is possible to distinguish between different nitrogen (N) inputs/outputs of the system. Among the inputs, fertilizer/manure application, atmospheric deposition and nitrification are considered, while among the outputs, denitrification and surface run-off can be recognized as the main removal processes [13]. Considering the output processes, the degradation of nitrate through denitrification can potentially reduce the N levels in both deep and shallow aquifers [14]. Denitrification relates to the dissimilatory reduction, done by aerobic bacteria, of the ionic nitrogen oxides (NO3 and NO2) to the gaseous oxides (NO and N2O), which may be further reduced to dinitrogen (N2). This process is emphasized in shallow aquifers influenced by surface water recharge, where denitrification could efficiently attenuate NO3 concentration in groundwater. Factors like the dissolved organic carbon content in the soil, the presence of peat layers (that strongly enhance reducing condition) [15], the vegetation type and the soil/aquifer temperature, can directly influence the denitrification rate making it highly variable in time and space [16,17].

Denitrification in Groundwater Vulnerability Assessment

To properly protect the groundwater resources, an effective prevention from contamination is essential [18]. In this contest of prevention, vulnerability maps play an important role thanks to their ability to show complex hydrogeological systems in an easily understandable way [19]. Groundwater vulnerability can be classified in two categories [20]: (i) intrinsic vulnerability, which depends only on the geological and hydrogeological features of the aquifer system, and (ii) specific vulnerability, that refers to the vulnerability of groundwater to specific contaminants and involves in the evaluation the physical–chemical properties of each contaminant.
In the last 50 years, different methods for groundwater vulnerability and risk mapping for NO3 pollution have been proposed and tested in many regions of the world. They are distinguished in two main categories: (i) deterministic models, that include the simulation of the physical, biological and chemical NO3 leaching processes occurring in the vadose and saturated zones, and (ii) overlay and index techniques. The first require a huge amount of data but are also quite efficient. Mastrocicco et al. [21] recently showed how reactive modeling might represent a valuable tool to quantify the complex biogeochemical reactions which can take place in underground environments. Sun et al. [22] and Hoang et al. [17] enhanced Soil and Water Assessment Toll (SWAT) model to properly simulate denitrification in alluvial wetlands and in riparian zones, respectively. Despite the high reliability of deterministic models, the overlay indices are the most used worldwide, due to their ease of use and data accessibility. DRASTIC [23], SINTACS [24] and AVI [25] are three of the most used and modified overlay indices. They usually asses the aquifer vulnerability through the analysis of several factors like: depth to the water table, aquifer recharge, aquifer media, soil media, topography, impact of the vadose zone, hydraulic conductivity and hydraulic resistance. However, these methodologies suffer for different drawbacks [26]: (i) they can be extremely subjective especially in the rating scale and weighting selection, and (ii) they do not analyze physical processes occurring within the aquifers, such as denitrification and NO3 dilution/dispersion. To overcome these drawbacks and to include processes like nitrification and denitrification in the vulnerability evaluation, some modified and new methodologies have been proposed. Following the EU Nitrates Directive [27], Padovani and Trevisan [28] created the Improved flux Prototypes for NO2 emission from Agriculture (IPNOA index). This methodology, unlike the other rating methods, provides the evaluation of different factors that can be directly connected to denitrification processes, such as climate, irrigation, type of agricultural practices, together with the amount and kind of fertilizer used. IPNOA has been applied and modified to assess the “nitrate vulnerable zones” on the European territory [29,30,31]. However, this method requires very specific information, and this could shrink its application only in well-characterized areas. Busico et al. [32] proposed a simplified version of IPNOA called Protection from Natural and Anthropogenic sources (PNA), maintaining some parameters like soil organic carbon and irrigation in the evaluation but making it more broadly applicable.
Within the category of the rating methods, Kazakis and Voudouris [6] proposed a DRASTIC modification named DRASTIC-PA where superficial run-off and N losses through soils were introduced in the vulnerability evaluation. Aschonitis et al. [33] defined and calculated the annual losses of water and N from percolation and superficial run-off via the LOS indices. These indices account for nitrification/denitrification processes in the vulnerability evaluation, normally neglected by the overly indices. In the same way Busico et al. [5,12] proposed two SINTACS modifications: SINTACS Specific Vulnerability to Nitrate (SVN) and Specific Vulnerability to Anthropogenic Pollution (SVAP) involving LOS indices together with other parameters for the specific assessment of aquifer vulnerability to anthropogenic pollution, obtaining more reliable results than those gained using the standard applications.
The aim of this paper is to analyze the application of the LOS indices in four well characterized study areas and to state how and how much the inclusion of the LOS indices in the vulnerability assessment can enhance the reliability of the methodology. The Campania plain, the Garigliano plain, the Florina basin and Epanomi coastal zone were chosen as reference areas as they are typical alluvial plains of the Mediterranean region characterized by intensive agriculture.

2. Materials and Methods
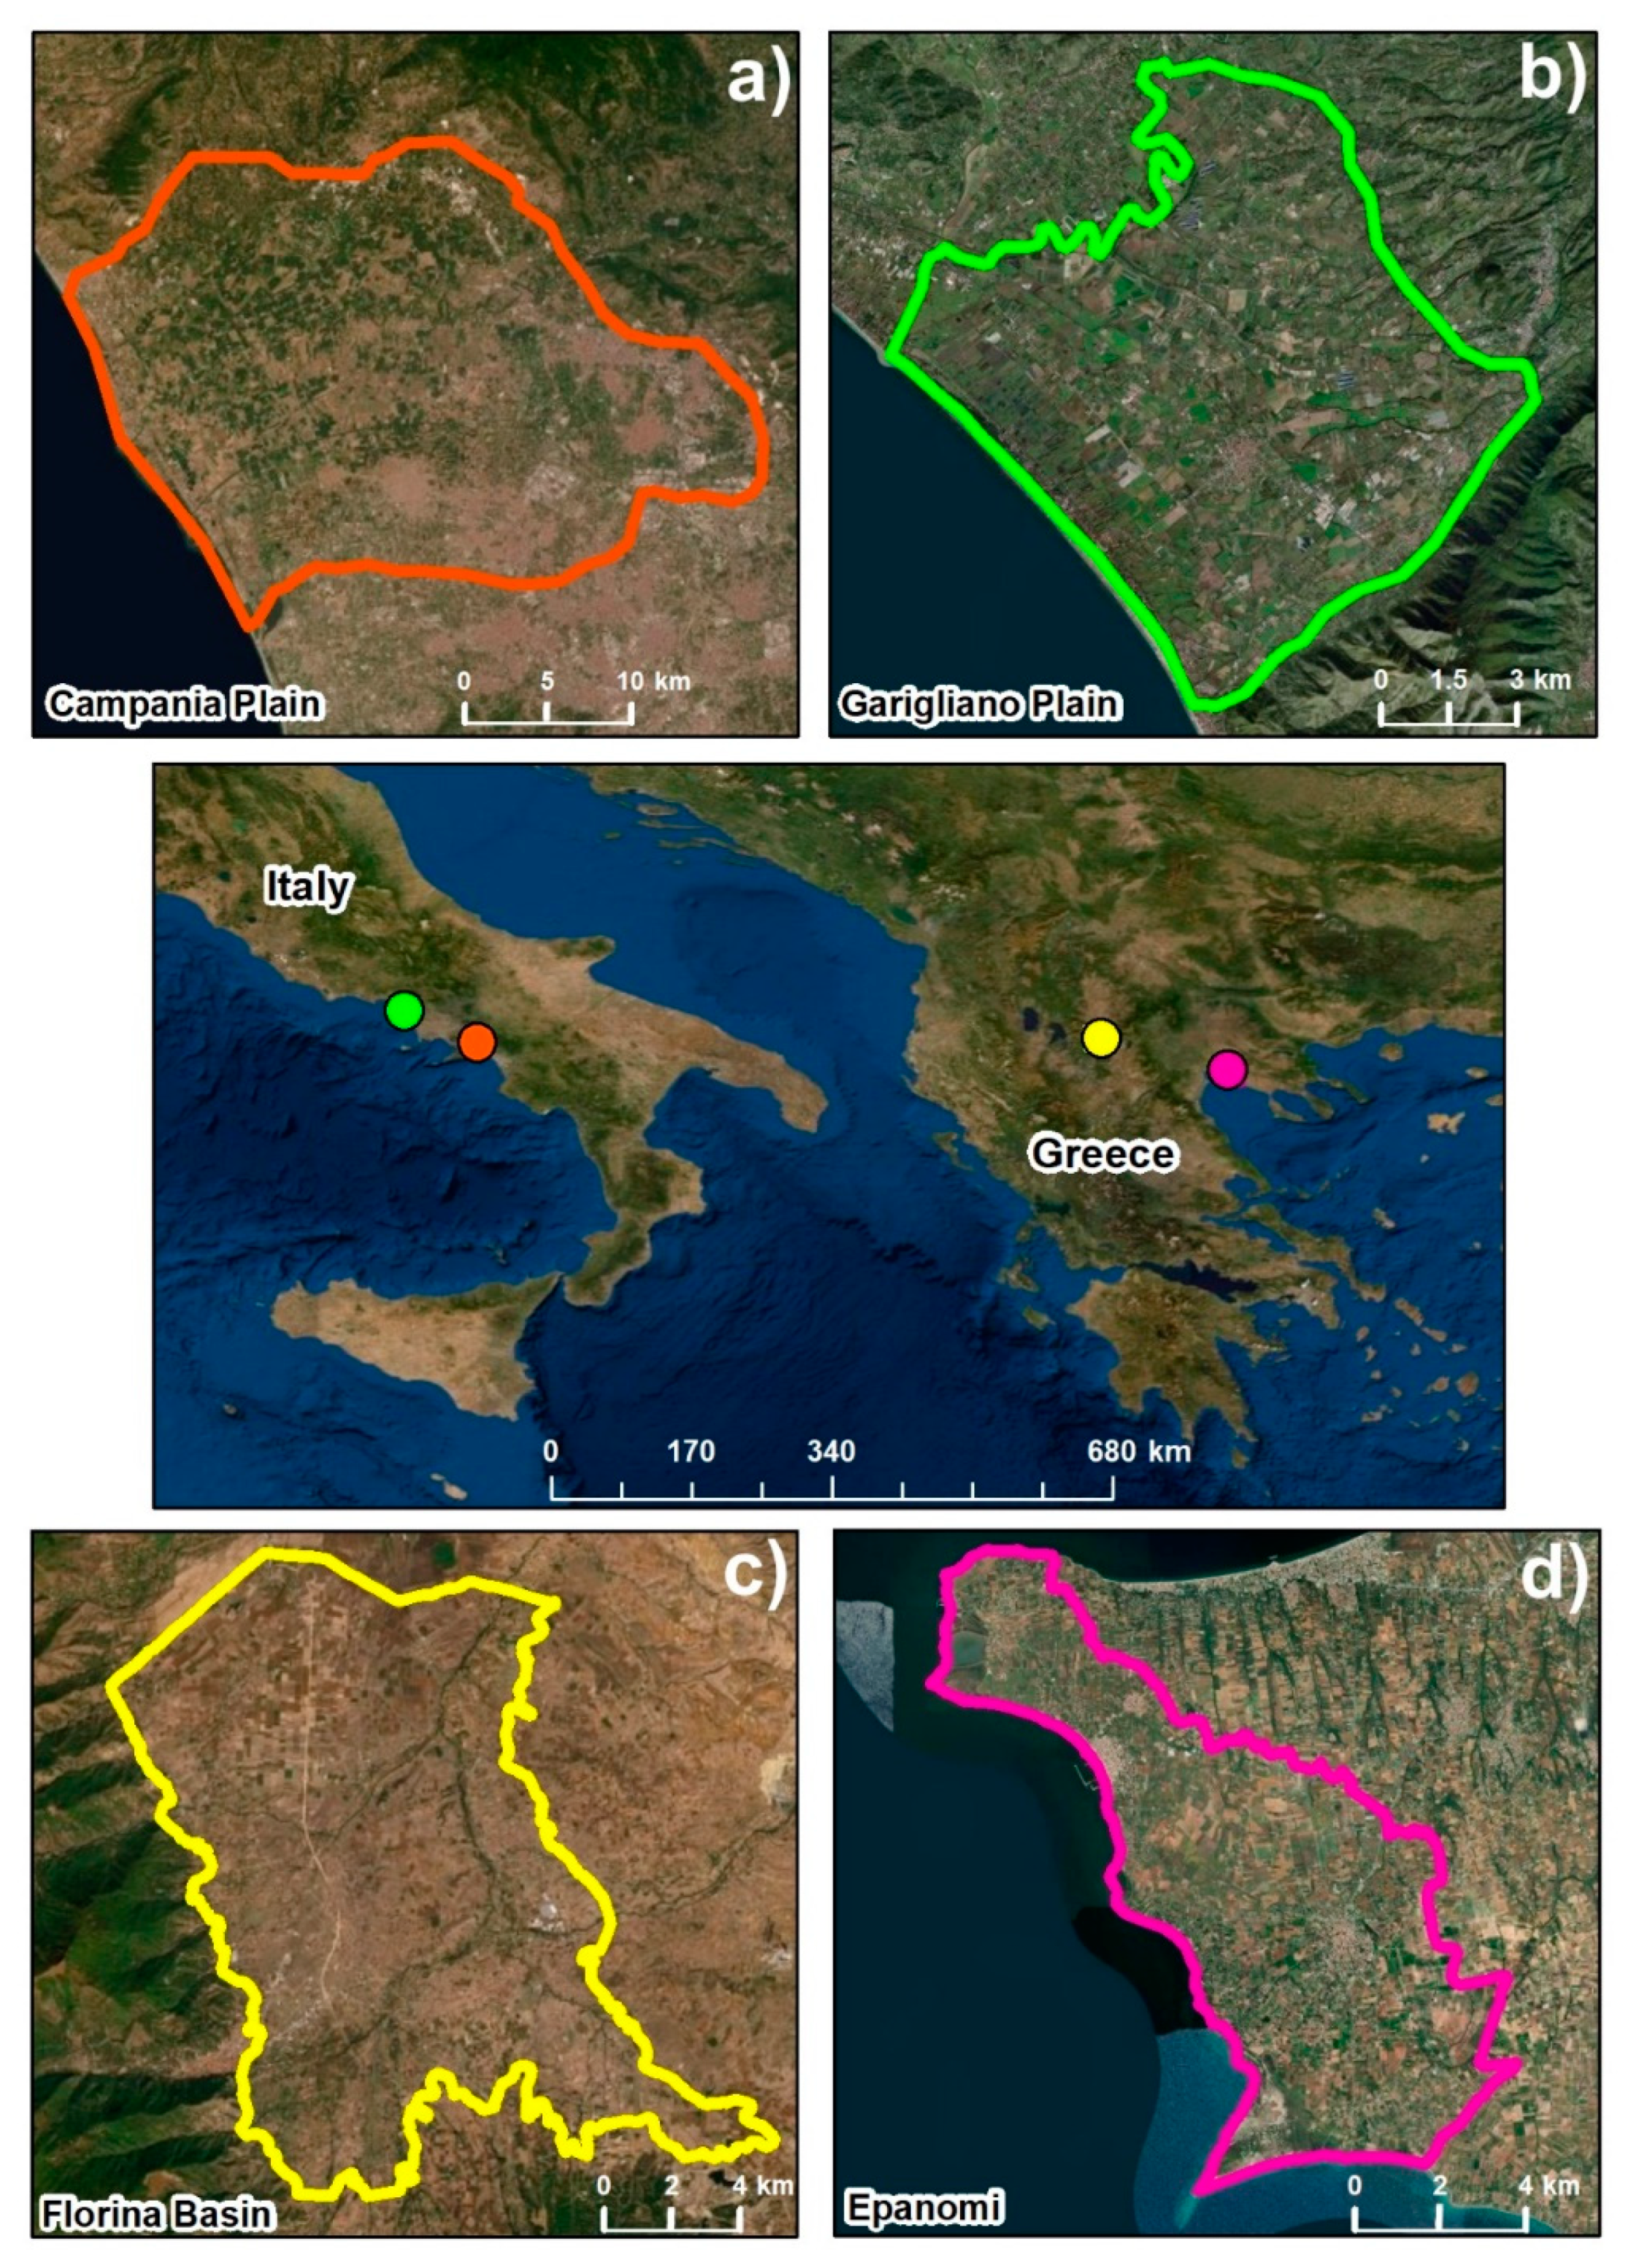
2.1. Study Areas

Four study areas have been chosen for the application of the LOS indices. The first site is a portion of the porous aquifer of the Campania plain (CP) (Figure 1a) located in the Campania region, Southern Italy. CP is a flat area hosted in a graben originated by tectonic extensive movements along the Tyrrhenian margin of the Apennine chain during the Upper Pliocene-Lower Pleistocene [34]. The phreatic aquifer is made of sedimentary alluvial deposits and the main groundwater composition is Ca-HCO3–Na-K-HCO3. The investigated area covers 776 km2 and is occupied by agriculture for the 70% of its extension. CP has a typical Mediterranean climate with an average precipitation of approximately 800 mm/y and a mean annual temperature of 22 °C [35]. The second study area is the Garigliano plain (Figure 1b), also located in the Campania region. Like the CP, it is a graben filled with continental and volcanoclastic sediments [32]. The main aquifer is hosted in alluvial and volcanic sediments with a Na-K-HCO3 groundwater’s composition. The area covers 100 km2 with an agricultural land use. The third study area under investigation is the Florina basin in the West Macedonia region, Greece (Figure 1c). The alluvial aquifer covers an area of 180 km2 and is made of an alternation of sands, gravels, conglomerates and clays with a predominant Ca-HCO3 composition [5]. The main land use is agriculture, that covers most of the basin. The region has a continental climate with a mean precipitation of approximately 470 mm/y. The last study area is Epanomi coastal area located in the eastern part of the Chalkidiki Peninsula in central Macedonia, Northern Greece (Figure 1d). It covers an area of 100 km2, and the local unconfined aquifer is made of alluvial and Neogene formations. The mean precipitation is approximately 450 mm/y [36].

2.2. LOS Indices

The LOS indices [33] are generally used to assess the intrinsic vulnerability of agricultural land to water (LOSW) and nitrogen (LOSN) losses through percolation and run-off. They are indices build via multiple regression analysis using the GLEAMS V3.0 model [37,38]. LOS indices were developed for two main goals: (i) to avoid the complexity typical of process-based models which require a big amount of data to describe the aquifer properties and (ii) to reduce the subjectivity of the indices when using weights and ratings. Anyhow, LOS indices are limited to the agricultural soils since GLEAMS was developed specifically for these kinds of soils. They were successfully calibrated and applied in Italy and Greece with good results [39,40]. The general forms of the LOS indices for water and nitrogen losses are the following:
L O S W P = { a 1 K s i + a 2 S i + a 3 P C P i + a 4 P E i + a 5 I R i } 2
L O S N P = { a 1 O M i + a 2 T i + a 3 K s i + a 4 S i + a 5 P C P i + a 6 P E i + a 7 I R i } 2
where: LOSW is the water losses (mm/y), LOSN is the nitrogen losses (kg/ha/y) and P indicates the percolation process, Ks is the soil hydraulic conductivity (mm/d), S is the surface slope (%), PCP is the precipitation (mm/y), PE is the potential evapotranspiration (mm∙ y-1), IR is the irrigation applied by the model (mm/y), OM is the organic matter (%) and T is the mean annual temperature (°C).

3. Results and Discussion

All the seven parameters necessary for the LOSN-P application have been digitalized using a raster format with a resolution of 25 x 25 m in Geographic Information System (GIS) environment using ArcGIS 10.2, for all the four study areas. The required information was sourced and collected from local authority websites, technical reports and literature review.

3.1. Italian Application

For the CP study area, all the necessary information has been collected and further digitalized for the application of LOSN-P. In the LOSN-P formulation, the values of OM in the soil layer surely represent the most critical parameter for the assessment of N losses, as the organic carbon is the main electron donor required by denitrifying bacteria. The data concerning the OM content in the first 30 cm of soil have been obtained from the SIAS project (Sviluppo di Indicatori Ambientali sul Suolo in Italia—Development of Soil Indicators in Italy). The spatial distribution of OM in the Campania plain is highly variable, ranging from 0.03 % in the soils of the coastal area to 10% in the soils near the Volturno River, where thin peat layers occur. The mean annual precipitation, temperature and evapotranspiration have been calculated using an available record of 15 years from 2000 to 2015 on 4 meteorological stations scattered upon the study area; they are 900 mm/y, 22 °C and 750 mm/y, respectively. The Ks has been obtained analyzing and interpreting the soil classification available in “I Sistemi di terre della Campania” [41]. Here a shapefile of soil classification is presented together with some soil characteristics like texture and bulk density that have been utilized for state the values of the soil hydraulic conductivity (Ks). Finally, the slope has been calculated with a GIS function from the Digital Terrain Model (DTM). The LOSN-P was calculated according to Equation (2) using the raster calculator toolbox and it is represented in Figure 2a. The total amount of N loss for the CP ranges from a minimum of 10 kg/ha/y to a maximum of 65 kg/ha/y. Among all the seven parameters, soil texture, OM and slope strongly affected this index. Generally, the areas with the lower slope values are characterized by the higher N loss rate. In fact, the entire coastal zone in the West and the South part of the plain are characterized by high N loss rate through percolation, promoted by the flat topography and the high Ks, despite the low percentage of OM in the soil.
Low N loss rates, instead, are located along the carbonate relief in the Northern and Eastern part of the plain. Looking at LOSN-P spatial distribution (Figure 1a), the areas where a low LOSN-P index is registered, correspond to the sites with a high denitrification potential. This is confirmed by the assumption that those areas are the ones with low Ks values and strong reducing conditions due to the presence of peat layers. In fact, it has been highlighted that denitrification processes are often negatively correlated with Ks, because even though a large pool of organic carbon and nitrate are available in high Ks porous matrices, the microbial community grows better in low Ks sediments where low flow conditions allow the simultaneous presence of substrates, nutrients and favorable redox conditions [42]. Moreover, strong reducing conditions positively affect denitrification where other elements like Fe2+, Mn2+, could also be used as electron donors instead of organic carbon [43]. The same procedure adopted for the CP has been followed for the LOSN-P application in the Garigliano river plain. Since the plain is located just North to CP, all the input parameters were collected using the same sources used for the previous study area. The meteorological conditions are the same found in CP, as well as the soil’s characteristics; the main difference concerns the percentage of OM, which is almost half respect to the CP, with values going from 0.1% to 4.0%. The highest values of OM are located in the Northern and central part of the plain, while the lowest values characterize the coastal soils. In addition, in this case, the highest rates of N loss occur in the coastal area with values around 30 kg/ha/y, with a general decrease moving inland, with values around 18 kg/ha/y. In the plain there is a general match between the areas with high percentage of OM, low values of Ks and low N loss rates, confirming how these areas can be the ones with the largest denitrification potential.

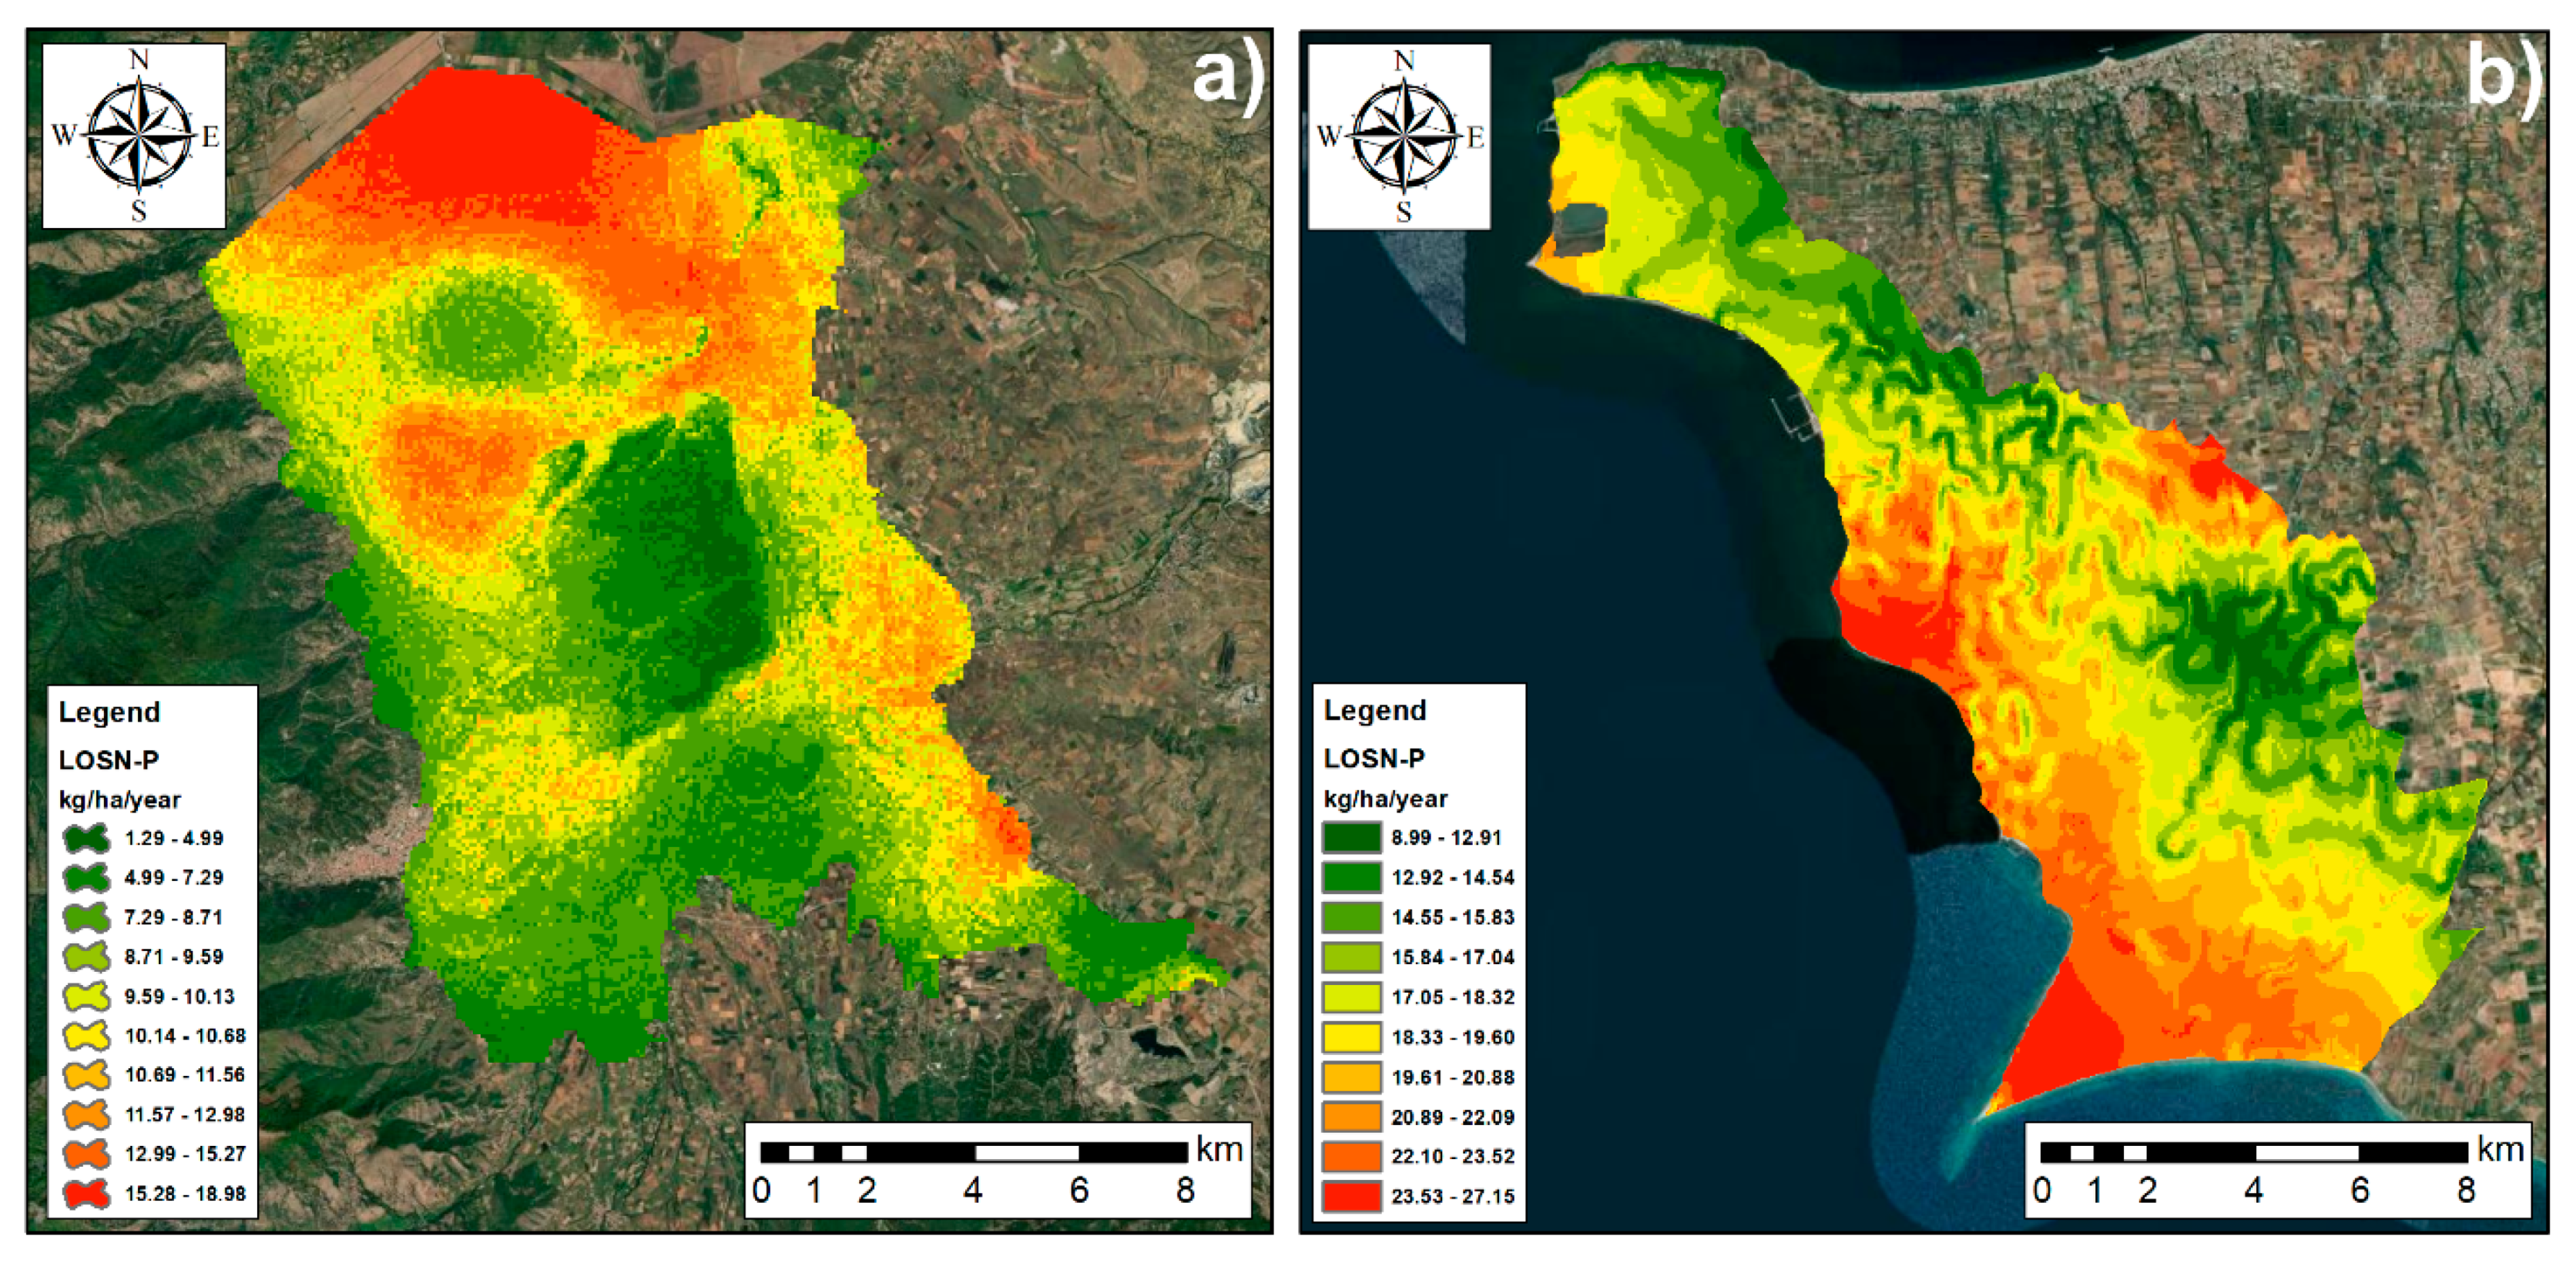
3.2. The Greek Study Areas

For the application of LOSN-P in the Florina basin, all the information has been obtained from previous studies [44]. The OM in the basin ranges from a minimum of 1.0% to a maximum of 4.0% with the highest values localized in the center of the basin, while to the North and to the South the soils suffer for a lack of OM content. The precipitation also varies from a minimum of 400 mm/y in the South to a maximum of 550 mm/y in the North, showing a steady increase. Similarly, to the precipitation behavior, the potential evapotranspiration ranges from 200 to 300 mm/y. The amount of irrigation is estimated around 345 mm/y over all the basin and the mean annual temperature is 12 °C. The topography is almost flat with higher slope in the center of the plain. The final LOSN-P is shown in Figure 3a. Generally, the values of N loss follow the morphology of the study area with a maximum rate observed in the North and the lowest rate near the reliefs and in the Southern portion of the basin. Within the flat area of the Florina basin, the soils with the low OM are the ones characterized by high N loss rates, confirming how OM is directly correlated with denitrification processes.
For the Epanomi coastal area, the data of mean annual precipitation, potential evapotranspiration and irrigation are 480 mm/y, 850 mm/y and 340 mm/y, respectively. The highest Ks values are located along the coastal area and in a small portion of the territory in the West margin of the basin. These areas coincide to the areas that show the lower percentage of OM. According to the LOSN-P index, N losses due to deep percolation vary from 8.9 to 28.8 kg/ha/y with the highest N loss rates along the small coastal plain.
Generally, the four applications described above confirm how LOSN-P can be used for identifying those areas with a high denitrification potential, and how the denitrification process may be directly or inversely correlated with some specific parameters considered in the groundwater vulnerability assessment methods.

3.3. Specific Vulnerability Assessment to NO3

Usually, denitrification is not involved in the standard vulnerability assessment methodologies, the only parameters considered in the most used methods, namely DRASTIC and SINTACS, that can be directly correlated to denitrification are the soil and recharge factors. Both DRASTIC and SINTACS refer to the soil characteristics in terms of texture and thickness, neglecting other common parameters linked to denitrification, like the soil OM and Ks. For three of the previously discussed study areas, two new SINTACS-based approaches have been proposed and applied: SINTACS-SVN [12] and SVAP [5]. These methodologies integrate LOSN-P index in the assessment of the specific groundwater vulnerability to NO3, replacing the common soil parameters. In particular, SINTACS-SVN was applied to the Campania plain while SVAP was applied to the Garigliano plain and the Florina basin. In those new applications, some of the pre-existing SINTACS parameters were replaced with new ones (LOSN, LOSW, aquifer thickness, groundwater velocity and hydraulic resistance) while weights and classes were calibrated against NO3 concentrations for the SINTACS-SVN method and with a general pollution factor for the SVAP method. In both the applications a strong correlation between the final new indices and NO3 concentrations was found, despite the weak and sometimes negative correlation previously obtained using the standard methodologies, like SINTACS or DRASTIC.
The LOSN-P factor registered three different weights of impact in the three study areas, but generally the parameter influence on the final vulnerability assessment was equal to approximately 10%. Moreover, occasionally a negative correlation between NO3 concentration and LOSN-P was found. This finding confirmed how LOSN-P could be a useful parameter to be included in the vulnerability assessment, but at the same time it cannot stand alone for the correct assessment of groundwater vulnerability to NO3 pollution. This is because other factors intervene in determining NO3 concentrations in groundwater and must be involved in the final assessment, like the dilution factors, the groundwater velocity and the characteristics of the whole vadose zone, among others. Furthermore, it is crucial to consider the amount of fertilizers used for each kind of land use, that in some cases could overcome the attenuation role of the denitrification process.

3.4. Application of SINTACS-SVN and DRASTIC-PA to Epanomi Coastal Area

In this study, to prove how LOSN-P can have a crucial role in the vulnerability assessment, two well-known modified methodology, DRASTIC-PA and SINTACS-SVN, have been applied to the Epanomi coastal zone. Both methodologies were calibrated on different study areas and the complete calibration/validation procedure, together with the weights and classes range are available in Kazakis and Voudouris [6] and in Busico et al. [12]. In the case of the Epanomi coastal plain, DRASTIC-PA and SINTACS-SVN will be applied using the original weights and scores without a new specific calibration for this study area. This will further reveal the reliability of the two methodologies in a new study area, without a targeted calibration but as standalone methods. Both SINTACS-SVN and DRASTIC-PA use almost the same parameters, except for the groundwater velocity in DRASTIC-PA and Ks in SINTACS-SVN. Two vulnerability maps were produced overlaying the seven parameters for SINTACS-SVN and DRASTIC-PA, using the weights shown in the following equations:
SINTACS-SVN = 3.60(S) + 0.36(I) + 0.09(N) + 2.52(T) + 2.52(A) + 0.45(C) + 2.25(S)
DRASTIC-PA = 0.5(D) + 1.1(R) + 1.8(A) + 0.7(S) + 0.8(T) + 4.5(I) + 0.6(C)
The two vulnerability maps divided the domain in 5 vulnerability classes, going from very low to very high. Geometrical interval was used for DRASTIC-PA while quantile classification for SINTACS-SVN. One of the main differences concerning LOSN-P in the two methodologies can be noticed analyzing Equations (3) and (4). In the SINTACS-SVN formula the factor accounting for LOSN-P, namely (N), has a weight of 0.09 while in the DRASTIC-PA formula, its weight is 0.7 (represented by S). So, it is clear how in the DRASTIC-PA, LOSN-P has a much higher weight compared to the SINTACS-SVN. The final maps are shown in Figure 4. SINTACS-SVN (Figure 4b) and DRASTIC-PA (Figure 4a) show a remarkably similar discrimination of the different vulnerability classes: very high vulnerability zones are located along the coastline, especially in the Southern and Northern part of the Epanomi coastal zone, very low and low vulnerability zones instead are more frequent moving towards the Eastern border. Both methods show a positive Pearson’s r correlation (0.57 for SINTACS_SVS and 0.68 for DRASTIC-PA) with NO3 concentrations.
The nitrate values in the study area ranges from 3 mg/L up to 350 mg/L with more than 50% of the dataset exceeding the World Health Organization (WHO) drinking water limit of 50 mg/L. The higher NO3 concentration has been attributed to the fertilizer application as the main land use of the study area is agricultural with wheat and vegetables crops (mainly tomatoes). These two crops usually required a high amount of N as fertilizer that has been estimated around 150 kg N/ha for wheat and 250 kg/ha for tomatoes in agreement with Cavero et al. [45]. Compared to the SINTACS-SVN, the DRASTIC-PA shows a better spatial delineation of the vulnerability zones, due to the difference in classes’ rating among the two methods, nevertheless both methods are perfectly comparable with the LOSN-P index for the Epanomi coastal zone (Figure 3b), showing a good correspondence among the areas with the higher N loss and the ones with the higher vulnerability.
This application further remarked how these new methodologies, that directly involve the role of different NO3 attenuation processes in soil and groundwater in the vulnerability assessment are reliable, easily applicable even without a specific calibration and widely applicable worldwide. Providing that the boundary conditions (climate, hydrological setting, etc.) match the ones for which the new vulnerability approaches were defined.

4. Conclusions

In this study the application of LOSN index in four different study areas and its role in improving the vulnerability assessment methodologies was analyzed. In all the applications, LOSN was able to quantify N losses and indirectly to locate the areas characterized by a high denitrification potential, highlighting its positive/negative correlation with soil organic carbon, reducing condition and soil hydraulic conductivity. Moreover, a new vulnerability assessment for the Epanomi coastal zone was proposed using two different methodologies, SINTACS-SVN and DRASTIC-PA, that propose extremely different classes’ range and weights. The specific vulnerability maps to nitrate for the Epanomi coastal zone show the same vulnerability zones’ delimitation, a high correlation with observed nitrate concentrations and especially in this application the vulnerability map showed good correspondence with the spatial discretization of the LOSN index. The SINTACS-SVN and DRASTIC-PA here applied to the Epanomi coastal zone, were slightly improved by the incorporation the LOS indices. Furthermore, this study highlights that LOS indices alone cannot describe the aquifer’s nitrate vulnerability because others hydrogeological factors like aquifer thickness can be relevant. Their integrations in vulnerability methods can provide more realistic results in respect to the basic vulnerability assessment methods. The application remarked the importance to involve all the attenuation processes of nitrate, like denitrification, in groundwater vulnerability assessment.

Author Contributions

Conceptualization, G.B. and M.M.; methodology, G.B., N.K; software, G.B.; formal analysis, G.B., N.K. and N.C.; investigation, G.B., N.K., K.V. and M.M.; data curation, G.B.; writing—original draft preparation, G.B.; writing—review and editing, N.C., K.K., M.M., K.V. All authors have read and agreed to the published version of the manuscript.

Funding

This research did not receive any funding.

Conflicts of Interest

The authors declare no conflict of interest. The funders had no role in the design of the study; in the collection, analyses, or interpretation of data; in the writing of the manuscript, or in the decision to publish the results.

References

  1. Li, R.; Merchant, J.W. Modeling vulnerability of groundwater to pollution under future scenarios of climate change and biofuels-related land use change: A case study in North Dakota, USA. Sci. Total. Environ. 2013, 447, 32–45. [Google Scholar] [CrossRef] [PubMed] [Green Version]
  2. Miglietta, P.P.; Toma, P.; Fanizzi, F.P.; De Donno, A.; Coluccia, B.; Migoni, D.; Bagordo, F.; Serio, F. A Grey Water Footprint Assessment of Groundwater Chemical Pollution: Case Study in Salento (Southern Italy). Sustainability 2017, 9, 799. [Google Scholar] [CrossRef] [Green Version]
  3. Voudouris, K.; Panagopoulos, A.; Koumantakis, I. Nitrate pollution in the coastal aquifer system of the Korinthos prefecture (Greece). Glob. Nest. J. 2004, 6, 31–38. [Google Scholar]
  4. Directive 2006/118/EC of the European Parliament and the Council on the Protection of Groundwater against Pollution and Deterioration. Available online: https://eur-lex.europa.eu/LexUriServ/LexUriServ.do?uri=OJ:L:2006:372:0019:0031:EN:PDF (accessed on 27 February 2020).
  5. Busico, G.; Kazakis, N.; Cuoco, E.; Colombani, N.; Tedesco, D.; Voudouris, K.; Mastrocicco, M. A novel hybrid method of specific vulnerability to anthropogenic pollution using multivariate statistical and regression analyses. Water Res. 2020, 171, 115386. [Google Scholar] [CrossRef] [PubMed]
  6. Kazakis, N.; Voudouris, K. Groundwater vulnerability and pollution risk assessment of porous aquifers to nitrate: Modifying the DRASTIC method using quantitative parameters. J. Hydrol. 2015, 525, 13–25. [Google Scholar] [CrossRef]
  7. Gu, B.; Ge, Y.; Chang, S.X.; Luo, W.; Chang, S.X. Nitrate in groundwater of China: Sources and driving forces. Glob. Environ. Chang. 2013, 23, 1112–1121. [Google Scholar] [CrossRef]
  8. Burow, K.R.; Nolan, B.T.; Rupert, M.G.; Dubrovsky, N.M. Nitrate in Groundwater of the United States, 1991−2003. Environ. Sci. Technol. 2010, 44, 4988–4997. [Google Scholar] [CrossRef]
  9. Lockhart, K.; King, A.; Harter, T. Identifying sources of groundwater nitrate contamination in a large alluvial groundwater basin with highly diversified intensive agricultural production. J. Contam. Hydrol. 2013, 151, 140–154. [Google Scholar] [CrossRef]
  10. Costa, J.; Massone, H.; Martínez, D.; Suero, E.; Vidal, C.; Bedmar, F.; Martinez, D. Nitrate contamination of a rural aquifer and accumulation in the unsaturated zone. Agric. Water Manag. 2002, 57, 33–47. [Google Scholar] [CrossRef]
  11. Busico, G.; Cuoco, E.; Kazakis, N.; Colombani, N.; Mastrocicco, M.; Tedesco, D.; Voudouris, K. Multivariate statistical analysis to characterize/discriminate between anthropogenic and geogenic trace elements occurrence in the Campania Plain, Southern Italy. Environ. Pollut. 2018, 234, 260–269. [Google Scholar] [CrossRef]
  12. Busico, G.; Kazakis, N.; Colombani, N.; Mastrocicco, M.; Voudouris, K.; Tedesco, D. A modified SINTACS method for groundwater vulnerability and pollution risk assessment in highly anthropized regions based on NO3− and SO42−concentrations. Sci. Total. Environ. 2017, 609, 1512–1523. [Google Scholar] [CrossRef] [PubMed]
  13. Buczko, U.; Kuchenbuch, R.; Lennartz, B. Assessment of the predictive quality of simple indicator approaches for nitrate leaching from agricultural fields. J. Environ. Manag. 2010, 91, 1305–1315. [Google Scholar] [CrossRef] [PubMed]
  14. Debernardi, L.; De Luca, D.; Lasagna, M. Correlation between nitrate concentration in groundwater and parameters affecting aquifer intrinsic vulnerability. Environ. Earth Sci. 2007, 55, 539–558. [Google Scholar] [CrossRef]
  15. Cornelis, W.; Oltenfreiter, G.; Gabriels, D.; Hartmann, R. Splash-Saltation of Sand due to Wind-Driven Rain. Soil Sci. Soc. Am. J. 2004, 68, 32–40. [Google Scholar]
  16. Ranalli, A.J.; Macalady, D.L. The importance of the riparian zone and in-stream processes in nitrate attenuation in undisturbed and agricultural watersheds – A review of the scientific literature. J. Hydrol. 2010, 389, 406–415. [Google Scholar] [CrossRef]
  17. Hoang, L.; Van Griensven, A.; Mynett, A. Enhancing the SWAT model for simulating denitrification in riparian zones at the river basin scale. Environ. Model. Softw. 2017, 93, 163–179. [Google Scholar] [CrossRef]
  18. Huan, H.; Wang, J.; Teng, Y. Assessment and validation of groundwater vulnerability to nitrate based on a modified DRASTIC model: A case study in Jilin City of northeast China. Sci. Total. Environ. 2012, 440, 14–23. [Google Scholar] [CrossRef]
  19. Patrikaki, O.; Kazakis, N.; Voudouris, K. Vulnerability map: A useful tool for groundwater protection: An example from Mouriki basin, North Greece. Fresenius Environ. Bull. 2012, 8, 2516–2521. [Google Scholar]
  20. National Research Council. Groundwater Vulnerability Assessment: Predictive Relative Contamination Potential under Conditions of Uncertainty; National Academy Press: Washington, DC, USA, 1993; pp. 42–46. [Google Scholar]
  21. Mastrocicco, M.; Colombani, N.; Castaldelli, G. Direct measurement of dissolved dinitrogen to refine reactive modelling of denitrification in agricultural soils. Sci. Total. Environ. 2019, 647, 134–140. [Google Scholar] [CrossRef]
  22. Sun, X.; Bernard-Jannin, L.; Sauvage, S.; Garneau, C.; Arnold, J.; Srinivasan, R.; Pérez, J.M.S. Assessment of the denitrification process in alluvial wetlands at floodplain scale using the SWAT model. Ecol. Eng. 2017, 103, 344–358. [Google Scholar] [CrossRef]
  23. Aller, L.; Bennet, T.; Lehr, J.H.; Petty, R.J. DRASTIC: A Standardized System for Evaluating Groundwater Pollution Potential Using Hydrologic Settings; Robert, S., Ed.; Technical Report; U.S. EPA Report, 600/2-87/035; Kerr Environmental Research Laboratory: Ada, OK, USA, 1987. [Google Scholar]
  24. Civita, M.V. The Combined Approach When Assessing and Mapping Groundwater Vulnerability to Contamination. J. Water Resour. Prot. 2010, 2, 14–28. [Google Scholar] [CrossRef] [Green Version]
  25. Van Stempvoort, D.R.; Ewert, L.; Wassenaar, L.I. Aquifer vulnerability index: A GIS-compatible method for groundwater vulnerability mapping. Can. Water Resour. J./Rev. Can. Ressour. Hydr. 1993, 18, 25–37. [Google Scholar] [CrossRef] [Green Version]
  26. Stigter, T.; Ribeiro, L.; Dill, A.C. Evaluation of an intrinsic and a specific vulnerability assessment method in comparison with groundwater salinisation and nitrate contamination levels in two agricultural regions in the south of Portugal. Hydrogeol. J. 2005, 14, 79–99. [Google Scholar] [CrossRef]
  27. European Commission (2011) Report from the Commission to the Council and the European Parliament on Implementation of Council Directive 91/676/EEC Concerning the Protection of Waters Against Pollution Caused by Nitrates from Agricultural Sources Based on Member State Reports for the Period 2004–200.
  28. Padovani, L.M.; Trevisan, M. I nitrati di Origine Agricola Nelle Acque Sotterranee (Un Indice Parametrico per L’individuazione di Aree Vulnerabili); Pitagora Editrice: Bologna, Italy, 2002. [Google Scholar]
  29. Pisciotta, A.; Cusimano, G.; Favara, R.; Antonino, P.; Gioacchino, C.; Rocco, F. Groundwater nitrate risk assessment using intrinsic vulnerability methods: A comparative study of environmental impact by intensive farming in the Mediterranean region of Sicily, Italy. J. Geochem. Explor. 2015, 156, 89–100. [Google Scholar] [CrossRef]
  30. Matzeu, A.; Secci, R.; Uras, G. Methodological approach to assessment of groundwater contamination risk in an agricultural area. Agric. Water Manag. 2017, 184, 46–58. [Google Scholar] [CrossRef]
  31. Rizeei, H.M.; Azeez, O.S.; Pradhan, B.; Khamees, H.H. Assessment of groundwater nitrate contamination hazard in a semi-arid region by using integrated parametric IPNOA and data-driven logistic regression models. Environ. Monit. Assess. 2018, 190, 633. [Google Scholar] [CrossRef]
  32. Busico, G.; Mastrocicco, M.; Cuoco, E.; Sirna, M.; Tedesco, D. Protection from natural and anthropogenic sources: A new rating methodology to delineate “Nitrate Vulnerable Zones”. Environ. Earth Sci. 2019, 78, 104. [Google Scholar] [CrossRef]
  33. Castaldelli, G.; Mastrocicco, M.; Colombani, N.; Salemi, E.; Kazakis, N.; Voudouris, K.; Castaldelli, G. Assessment of the Intrinsic Vulnerability of Agricultural Land to Water and Nitrogen Losses via Deterministic Approach and Regression Analysis. Water Air Soil Pollut. 2011, 223, 1605–1614. [Google Scholar]
  34. Casciello, E.; Cesarano, M.; Pappone, G. Extensional detachment faulting on the Tyrrhenian margin of the southern Apennines contractional belt (Italy). J. Geol. Soc. 2006, 163, 617–629. [Google Scholar] [CrossRef]
  35. Mastrocicco, M.; Busico, G.; Colombani, N. Deciphering Interannual Temperature Variations in Springs of the Campania Region (Italy). Water 2019, 11, 288. [Google Scholar] [CrossRef] [Green Version]
  36. Kazakis, N.; Busico, G.; Colombani, N.; Mastrocicco, M.; Pavlou, A.; Voudouris, K. GALDIT-SUSI a modified method to account for surface water bodies in the assessment of aquifer vulnerability to seawater intrusion. J. Environ. Manag. 2019, 235, 257–265. [Google Scholar] [CrossRef] [PubMed]
  37. Leonard, R.A.; Davis, F.M.; Knisel, W.G. Groundwater Loading Effects of Agricultural Management Systems (GLEAMS). A tool to assess soil-climate-management-pesticide interaction; U. S. Department of Agriculture: Tifton, GA, USA, 1989.
  38. De Paz, J.M.; Ramos, C. Linkage of a geographical information system with the gleams model to assess nitrate leaching in agricultural areas. Environ. Pollut. 2002, 118, 249–258. [Google Scholar] [CrossRef]
  39. Castaldelli, G.; Castaldelli, G.; Colombani, N.; Mastrocicco, M. A combined methodology to assess the intrinsic vulnerability of aquifers to pollution from agrochemicals. Arab. J. Geosci. 2016, 9. [Google Scholar]
  40. Castaldelli, G.; Mastrocicco, M.; Colombani, N.; Salemi, E.; Castaldelli, G. Assessment of the intrinsic vulnerability of agricultural land to water and nitrogen losses: Case studies in Italy and Greece. In Proceedings of the International Association of Hydrological Sciences; Copernicus GmbH: Bologna, Italy, 2014; Volume 364, pp. 14–19. [Google Scholar]
  41. Di Gennaro, A. I Sistemi di Terra Della Campania; SELCA: Firenze, Italy, 2002. [Google Scholar]
  42. Caruso, A.; Boano, F.; Ridolfi, L.; Chopp, D.L.; Packman, A. Biofilm-induced bioclogging produces sharp interfaces in hyporheic flow, redox conditions, and microbial community structure. Geophys. Res. Lett. 2017, 44, 4917–4925. [Google Scholar] [CrossRef] [Green Version]
  43. Tomasek, A.; Kozarek, J.L.; Hondzo, M.; Lurndahl, N.; Sadowsky, M.J.; Wang, P.; Staley, C. Environmental drivers of denitrification rates and denitrifying gene abundances in channels and riparian areas. Water Resour. Res. 2017, 53, 6523–6538. [Google Scholar] [CrossRef]
  44. Voudouris, K.; Mandrali, P.; Kazakis, N. Preventing Groundwater Pollution Using Vulnerability and Risk Mapping: The Case of the Florina Basin, NW Greece. Geosciences 2018, 8, 129. [Google Scholar] [CrossRef] [Green Version]
  45. Cavero, J.; Plant, R.; Shennan, C.; Friedman, D.; Williams, J.; Kiniry, J.; Benson, V. Modeling nitrogen cycling in tomato–safflower and tomato–wheat rotations. Agric. Syst. 1999, 60, 123–135. [Google Scholar] [CrossRef]
Figure 1. Study areas: (a) Campania plain, (b) Garigliano River plain, (c) Florina basin, (d) Epanomi.
Applsci 10 02328 g001
Figure 2. LOSN-P application for (a) the Campania plain and (b) the Garigliano plain.
Applsci 10 02328 g002
Figure 3. LOSN-P application for (a) the Florina basin, and (b) the Epanomi coastal area.
Applsci 10 02328 g003
Figure 4. (a) DRASTIC-PA application and (b) SINTACS-SVN for Epanomi coastal zone.
Applsci 10 02328 g004

