Abstract
Rapid Visual Screening (RVS) is a procedure that estimates structural scores for buildings and prioritizes their retrofit and upgrade requirements. Despite the speed and simplicity of RVS, many of the collected parameters are non-commensurable and include subjectivity due to visual observations. This might cause uncertainties in the evaluation, which emphasizes the use of a fuzzy-based method. This study aims to propose a novel RVS methodology based on the interval type-2 fuzzy logic system (IT2FLS) to set the priority of vulnerable building to undergo detailed assessment while covering uncertainties and minimizing their effects during evaluation. The proposed method estimates the vulnerability of a building, in terms of Damage Index, considering the number of stories, age of building, plan irregularity, vertical irregularity, building quality, and peak ground velocity, as inputs with a single output variable. Applicability of the proposed method has been investigated using a post-earthquake damage database of reinforced concrete buildings from the Bingöl and Düzce earthquakes in Turkey.
1. Introduction
Averting a subsequent natural calamity is certainly relatively impractical. However, due to the rapid progress of simulation science and seismological studies, it is quite possible to mitigate the catastrophic effects post-disaster. If earthquake safety (risk) assessment of buildings is viewed as Heinrich’s domino theory of cause and effects [1], damage results from a chain of sequential events, metaphorically like a line of dominoes falling over. Where the first piece is the seismic hazard, which plays an important role and is inherently unavoidable, followed by the building vulnerability, then construction characteristics, which lead to seismic risk and damage of buildings and cause loss and injury of residents, respectively. When one of the dominoes falls, it triggers the next one, and the next, but improving or removing a key factor (such as retrofitting buildings) prevent or minimize the impact of the chain reaction of dominoes. As it is not possible to modify the seismic hazard to reduce the risk, emphasis should be placed on the study of vulnerability assessment and reduction as a measure of damage/loss mitigation. In urban areas midst, the construction of new building stock is a substantial number of structures still in service, which were constructed either when national seismic codes were not evolved due to lack of research or they were not strictly enforced by the law. For instance, in Istanbul, Turkey, as a high seismic area, around 90% of buildings are substandard, which can be generalized into other earthquake-prone regions in Turkey [2]. The reliability of this building stock resulting from earthquake-induced collapse currently is uncertain. Nonetheless, it is also not feasible to perform a detailed seismic vulnerability analysis on each building as a solution to the scenario, as it is complicated and expensive to perform. This indicates the necessity of a reliable, rapid, and computationally easy method for seismic vulnerability assessment, commonly known as Rapid Visual Screening (RVS). In RVS methodology, a observational survey of buildings will be performed, and according to the data collected during the visual inspection, a structural score will be calculated without performing any structural calculations to determine the expected damage of a building and whether the building needs detailed assessment [3]. Although this method might save time and resources due to the subjective/qualitative judgments of experts who performed the inspection, the evaluation process is dominated by vagueness and uncertainties, which vagueness can be handled adequately through the fuzzy set theory [4] but do not cover all sort of uncertainties due to its crisp membership functions [5]. In this study, a novel method of rapid visual hazard safety assessment of buildings against earthquake is introduced in which an interval type-2 fuzzy logic system (IT2FLS) would be used to cover uncertainties. In addition, the scope of this paper is on the reinforced concrete buildings.
2. Review of Rapid Visual Screening Procedures
Federal Emergency Management Agency (FEMA), USA in 1988 has proposed the initial Rapid Visual Screening (RVS) methodology as “Rapid Visual Screening of Buildings for Potential Seismic Hazards: A Handbook” [6]. Furthermore, in 2002, because of earthquake disasters in the 1990s, the methodology was modified to integrate the latest technological advancements [7]. RVS has been widely used in seismic countries as a practical and simple tool for evaluating the vulnerability of buildings; therefore, this challenge is in the interest of many researchers and still is under development and improvement. In this manner, some efforts have been made to develop national RVS for India (IITK-GSDMA) [8], Turkey (EMPI) [9], Italy [10], and the Philippines [11]. Some practical comparisons carried out between different national RVS methods and their robustness have been discovered [12,13,14]. Although RVS is an acceptable estimation method that gives a general overview to do proper earthquake mitigation planning, the variables considered contain a level of uncertainty [15].
In addition to national and local RVS methods, there are many other RVS methods developed by using linear regression [16,17], Multi-criteria decision making [3], Artificial Neural Networks (ANNs) [18,19,20,21], Fuzzy Logic (see Table 1), and some other methods concerning their consideration and experiences on a region or country scale [22]. These methods can be categorized into two groups: (a) methods based on statistical and machine learning approaches, like linear regression and ANN, and (b) methods based on expert systems such as fuzzy-based methods.

Table 1.
Summary of Fuzzy Logic application in visually earthquake hazard safety assessment of buildings.
Methods based on statistical approaches reduce the problem to a linear relationship between inputs and the output, which is not realistic as the relation between building parameters, seismicity parameters, and damageability is a non-linear relation. Methods based on machine learning approaches suffer from a lack of data where there is not enough datasets consisting of building parameters before earthquakes and type of damage after earthquakes. In addition, these approaches are local and limited to a specific area; last approaches, based on fuzzy systems, consider the expert’s opinion, and model vagueness exist in words that describe the building parameters. Table 1 presents a summary of the fuzzy systems applied for RVS purposes.
Fuzzy systems contributed significant achievements in vulnerability assessment because of making definite decisions based on imprecise or ambiguous data [23]. The main problem with all previous studies based on conventional type-1 fuzzy logic system (T1FLS) is that they only consider vagueness in membership functions while does not including all types of uncertainties due to its crisp membership functions. However, this issue can be solved by implementing IT2FLS as their membership functions (MFs) are themselves fuzzy [5]. Therefore, an RVS method based on an IT2FLS is considered to overcome the weakness of RVS methods based on the type-1 fuzzy system.
3. Type-2 Fuzzy Logic System
Zadeh has introduced the initial concept of fuzzy set (type-1) in 1965 [31] and later in 1975 developed the extension of it as the type-2 fuzzy set [32]. In this paper, it has been assumed that the reader is familiar with the basics of the fuzzy logic system and type-1 Fuzzy Logic Systems (T1FLS) so that here the focus is entirely on the IT2FLS and its advantages over T1FLS. The main limitations of the T1FLS is that it cannot adequately handle the linguistic, measurement and parameter uncertainties [33] due to [5]: 1—the expressions and words that are used in the antecedents and consequences of rules can be uncertain, and 2—consequences may have a histogram of values associated with them, mainly when knowledge is obtained from a group of experts who do not all agree. In this regard, IT2FLS, characterized by MFs that are themselves fuzzy, therefore, in case there are difficulties in the determination of membership grade even as a crisp number in [0, 1], type-2 fuzzy sets are then adequate to use. So far, IT2FLSs have been used in different areas to deal with high uncertainty, non-linearity and time-varying behavior [34], including computing with words [35], intelligent controllers [36], pattern recognition [37]. A typical IT2FLS consists of five parts as fuzzifier, rule base, inference engine, type-reducer, and defuzzifier. Moreover, in T2FLS, at least one of the fuzzy sets (membership functions) in the rule base must be type-2. All parts of T2FLS are similar to T1FLS except the type-reducer, which is introduced to convert the type-2 membership functions into a type-1 before defuzzification. The process of type reduction is usually performed by the most popular computationally intensive Karnik–Mendel (KM) iterative algorithms proposed by Wu and Mendel [38]. A type-2 fuzzy set à can be defined by its type-2 membership function as:
where x ∈ X, u ∈ ⊆ [0, 1], and X represents the universe of the primary variable x of Ã. Here ∫∫ denotes all the admissible x and u. The point-value representation of à is as:
The secondary MF of à is also called a vertical slice of :
where 0 ≤≤ 1, and denotes the secondary MF of Ã. The secondary membership grades of IT2FLS all equal 1, that is to say, for any x = x’, ≡ 1.
Type-2 carries the UMFs, LMFs, and FOU. The FOU is uncertainty in the primary membership grades of a type-2 MF, which consists of a bounded region; the UMF is a subset that has the maximum membership grade of the FOU, and the LMF is a subset that has the minimum membership grade of the FOU. The two-dimensional is referred to as the footprint of uncertainty (FOU) of Ã:
where is the primary membership of Ã; here the lower MF (LMF) and upper MF (UMF) comprise the FOU, where [39]:
And,
There are two types of T2FLSs as Mamdani and Takagi–Sugeno [34]. Here the focus is on Mamdani-type as it is more popular than Takagi–Sugeno. Therefore, the rules of IF-THEN [40] can be written as:
Or in another way:
where l is the rule number, and are the (i = 1, ..., p) input and antecedent set of rule l, respectively, are consequent sets and A is the input fuzzy sets, while y is the input and “∼” shows that the fuzzy set is a type-2 fuzzy set.
While adopting the popular centroid TR [41], the firing output set is generated from by each fuzzy rule and the corresponding consequent IT2FLS, i.e.,
While ∩ denotes the minimum or product t-norm operation. The final output can be achieved by merging all the rule firing output sets :
Here ∪ indicates the maximum operation. Then the type-reduced set can be obtained by computing the centroid of :
To find the final crisp output value for the inference process, the aggregate type-2 fuzzy set is first reduced to an interval type-1 fuzzy set, which is a range with lower limit and upper limit. This interval type-1 fuzzy set is commonly referred to as the centroid of the type-2 fuzzy set. In theory, this centroid is the average of the centroids of all the type-1 fuzzy sets embedded in the type-2 fuzzy set. In practice, it is not possible to compute the exact values of lower and upper limits. Instead, iterative type-reduction methods are used to estimate these values. Here the two points and can be calculated by common type-reduction algorithms such as Karnik–Mendel (KM) [42], Enhanced Karnik–Mendel (EKM) [43] and weighted EKM [44].
RVS Modeling Based on Interval Type-2 Fuzzy System
Figure 1 presents the schematic structure of a proposed RVS model based on IT2FLS. The model consists of 6 input variables and one output variable as damage category (damage index).
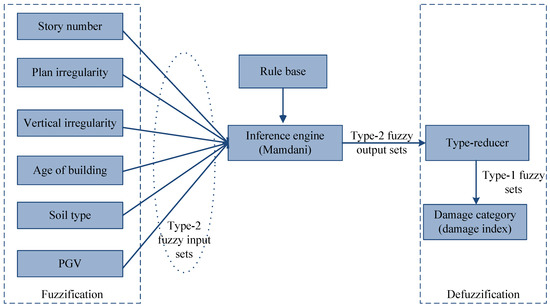
Figure 1.
The structure of the proposed RVS based on IT2FLS.
Following are the explanation of different parts of the model: Input variables represent structural and environmental characteristics, which affect the global seismic response of a structure. These characteristics are presented in Figure 1 as input variables and in the fuzzification component. Each characteristic is described in linguistic terms that indicate its state. These terms are attributed to fuzzy sets, which are defined over the variable’s universe of discourse via MFs. As can be seen in Figure 1 the fuzzifier of maps a vector of six inputs into six IT2 fuzzy sets , i = 1, 2, ..., 6. In this study a non-singleton fuzzifier has been considered because it is useful when the measurements are corrupted by non-stationary noise and has shown better performance [45].
Generally, there is no restriction on the number of MFs one could use; however, it is practically recommended to use less than 7 MFs in each input domain of a type-1 or type-2 fuzzy system to reduce computational cost, reduce number of rules, and make interpreting more straightforward [46]. The common MF shapes in type-2 are Gaussian, bell-shaped and piecewise linear. Figure 2 shows the Gaussian and generalized bell-shaped MFs for story number, plan irregularity, vertical irregularity, age, soil type, and PGV, respectively. While a few of these variables have numerical values, the others are all in linguistic forms. However, in the classical modeling the inputs, plan irregularity and vertical irregularity are quantified as 1 implying existence (yes) and 0 as nonexistence (no) of the effect according to the crisp two-valued logic. The linguistic terms used for the definition of each variable and the respective fuzzy sets are described as:
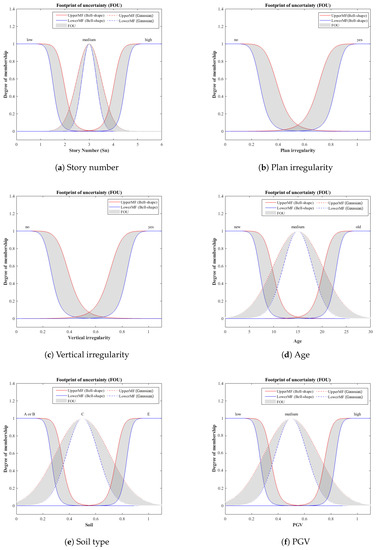
Figure 2.
Gaussian and generalized bell-shaped membership functions for input variables (a) story number, (b) plan irregularity, (c) vertical irregularity, (d) age, (e) soil type, (f) PGV.
- Story number: Depending on the number of stories, one of the following classes should be selected. The classifications on this study are for mid-rise buildings as the number of stories less than 3 (Low), between 3 and 6 (Medium), and more than 6 (High) as presented in Figure 2a.
- Plan Irregularity: This parameter should be considered when any of the irregularities, for instance, buildings with re-entrant corners (L, T, U, E, + shape) and buildings with different lateral resistance in both directions, have been observed. Any asymmetrical plan and distribution of vertical elements can cause torsion to the building (Figure 2b).
- Vertical irregularity: If any of the irregularities such as steps in elevation view, inclined walls, buildings on a hill, soft story, buildings with short columns, and discontinuity in frames are identified, then this parameter should be considered (see Figure 2c).
- Age of building: This parameter is classified into three different input variable membership function as New (age <15 years), Moderate (15 < age < 30), and Old (age > 30) as presented in Figure 2d.
- Soil type: The soil type is classified into three different input variable membership function as A/B (rock and dense soil), C (stiff soil), and E (soft) as shown in Figure 2e.
- Peak Ground Velocity (PGV): The velocity is used to characterize the amplitude of seismic motion at intermediate frequencies therefore, it is useful to indicate the potential damage for structures sensitive to the field of intermediate frequencies [9,47]. In this paper, the PGV numerical values at any desired locations are based on the micro zoning studies by Sucuoglu and Yilmaz [48], which are fuzzified into three MFs as Low, Medium, and High, which are illustrated in Figure 2f.
Lastly, the output variable damage index represents the possibility that a structure will suffer a particular damage type. Five MFs for the building damage categorization (Output variable) are considered to be: No damage, Low, Medium, Severe, and Collapse. Figure 3 presents the building damage index categorization MFs.
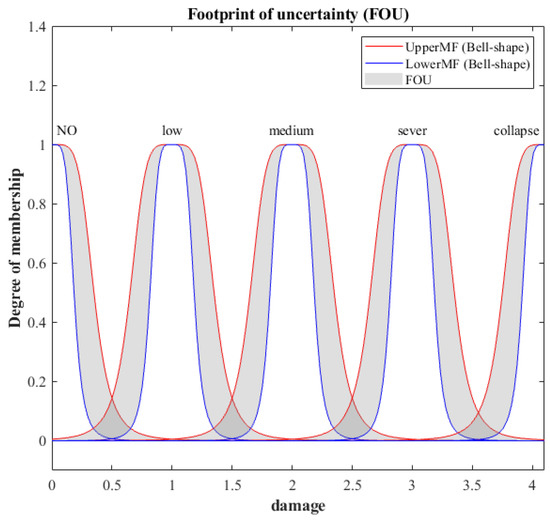
Figure 3.
Generalized bell-shaped membership functions for damage as output variable.
Following the above explanations, the logical rules for each variable are presented with the building assessment, and their fuzzification can be achieved by considering fuzzy words for input variables and damage categories. The defined rules in this study are 3 × 2 × 2 × 3 × 3 × 3 = 324 rules, of which some examples are presented in Table 2. In this paper Mamdani fuzzy system is considered where the rules consequent is fuzzy IT2 sets. Therefore, all rules defined based on Mamdani Type.
Table 2.
The structure of the T2FLS in this study.
Minimum and product t-norms are the most popular inference methods to compute firing intervals of the rules for IT2 fuzzy systems. However, there are not much difference between the outcome of each method. Therefore, minimum t-norm is applied for the inference engine. Finally, for Type reduction, the EKM method is applied as it is modification of the Karnik–Mendel (KM) algorithm with an improved initialization, modified termination condition, and improved computational efficiency.
4. Results and Discussion
The methodology based on IT2FLS was implemented on MATLAB (MATLAB is a registered trademark of The MathWorks, Inc.) using the provided Fuzzy Logic Toolbox. The version of the IT2FLS toolbox used allows the intuitive implementation of IT2FLSs, where it can cover all the phases of its design. Furthermore, the proposed method has been examined by evaluating the buildings database of the Bingöl earthquake (2003) and Düzce earthquake (1999) in Turkey. For this purpose, the information of 28 reinforced concrete buildings in Bingöl, and 484 reinforced concrete buildings in Düzce have been selected from the SERU (Structural Engineering Research Unit) database [49], which was collected from the street survey by a team of researchers from Middle East Technical University (METU), Ankara. The Bingöl earthquake struck with a magnitude , reported peak ground acceleration (PGA) 0.556 g and PGV 34.5 cm/s [50]. Moreover, studies by Akkar et al. [51] and Harirchian et al. [12] provide detailed technical information about the characteristics of the Bingöl earthquake and the information about the observed buildings, respectively. A report from the observed damage to the buildings in different places in Bingöl stated that damages were mostly due to the properties of structures, and not due to the foundation conditions or any ground deformation [52]. Therefore, it has been assumed that for assessing the vulnerability of the buildings in Bingöl there are no corrections or additional parameters required for different soil conditions, and the soil condition of the selected area are quite uniform, predominantly granular alluvial deposits, which are dense to very dense (Soil Type A or B) [53]. In 12 November 1999, a powerful earthquake struck the city of Düzce (Turkey) within a magnitude of , PGA 0.821 g and PGV 66.9 m/s [53]. A district in Düzce with a total number of 484 three- to six-story RC buildings was surveyed and collected by SERU [49] after the Düzce earthquake. Moreover, soil conditions were uniform, and stiff clays with interbedded layers of dense sands and gravels. The measured ( 30) at DZC station was 294 m/s, which categorized the soil as a ground type C according to classification in this study, and topography was flat over the surveyed district [54]. Düzce is located under a high seismic zone and the information extracted from the database was similar to Bingöl.
Figure 4 and Figure 5 show the distribution of the observed damage categories of buildings in Bingöl and Düzce, respectively [49]. Moreover, the estimation based on the fuzzy synthetic evaluation proposed by Tesfamariam [55] on the same Bingöl dataset, and the estimation by the proposed method in this paper based on IT2FLS can be seen. It shows that the proposed method has a good agreement with the observed damage state distributions. From the data in Figure 4 and Figure 5, it can be manifested that the proposed method considered safety factor by overestimating the damage states more than moderate and underestimate low damage and no damage because of caring more about safety and expecting higher risk. Moreover, by modifying fuzzy parameters, these values can be adjusted for different regions and purposes based on the authority’s requirements. However, in comparison with the Tesfamariam method, the proposed method in this paper has provided a more regular distribution and classification for each damage state. Table 3 contains the description of the damage state in Figure 4 and Figure 5 with relative decisions and recommendations for each of them.
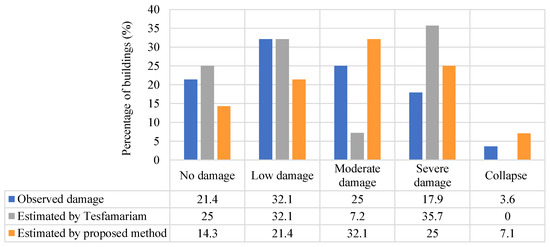
Figure 4.
Damage state of selected building data of Bingöl from RVS methodologies.
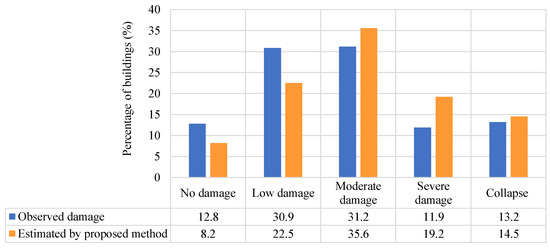
Figure 5.
Damage state of selected building data of Düzce.
Table 3.
Description of damage levels and recommended decision (adopted from [56]).
5. Conclusions
The assessment of earthquake resistance identification of existing buildings in the pre-earthquake period presents a very significant task, which must be accomplished in a rapid, simple, economical, and efficient manner. In this regard, the RVS methods were developed to assess the seismic vulnerability of buildings via an observation survey. Despite its efficiency, the evaluation process is dominated by vagueness-type uncertainty. This issue has been addressed by proposing a novel interval type-2 fuzzy system of rapid visual hazard safety assessment of buildings against earthquakes. Later, for efficiency validation of the proposed method, the method has been used to estimate the building damage category of the Bingöl and Düzce earthquake dataset, which shows a better estimation than the proposed method by Tesfamariam [55].
Nonetheless, the small size of the existing database did not result in a robust method and requires further investigation using additional data. Therefore, it is worthwhile to spend time and funds to collect data after future seismic events to optimize the proposed method, when considering that pre-earthquake assessment aims to reduce seismic risk, which in turn can be interpreted in terms of economic benefits and life protection.
Author Contributions
All authors have read and agreed to the published version of the manuscript.
Funding
This research received no external funding.
Acknowledgments
We acknowledge the support of the German Research Foundation (DFG) and the Bauhaus-Universität Weimar within the Open-Access Publishing Programme. Also, the authors appreciate the technical support of Mojtaba Shahraki, Mahdi Faramarzi, and Zouhour Jaouadi.
Conflicts of Interest
The authors declare no conflict of interest.
References
- Rad, K.G. Application of domino theory to justify and prevent accident occurance in construction sites. IOSR J. Mech. Civ. Eng. IOSR-JMCE 2013, 6, 72–76. [Google Scholar]
- Sucuoğlu, H.; Yazgan, U.; Yakut, A. A Screening Procedure for Seismic Risk Assessment in Urban Building Stocks. Earthq. Spectra 2007, 23, 441–458. [Google Scholar] [CrossRef]
- Harirchian, E.; Harirchian, A. Earthquake Hazard Safety Assessment of Buildings via Smartphone App: An Introduction to the Prototype Features- 30. Forum Bauinformatik: Von jungen Forschenden für junge Forschende: September 2018, Informatik im Bauwesen; Professur Informatik im Bauwesen; Bauhaus-Universität Weimar: Weimar, Germany, 2018; pp. 289–297. [Google Scholar] [CrossRef]
- Tesfamariam, S.; Saatcioglu, M. Seismic vulnerability assessment of reinforced concrete buildings using hierarchical fuzzy rule base modeling. Earthq. Spectra 2010, 26, 235–256. [Google Scholar] [CrossRef]
- Mendel, J.M.; John, R.B. Type-2 fuzzy sets made simple. IEEE Trans. Fuzzy Syst. 2002, 10, 117–127. [Google Scholar] [CrossRef]
- Federal Emergency Management Agency. Rapid Visual Screening of Buildings for Potential Seismic Hazards: A Handbook (FEMA P-154); Homeland Security Department, Federal Emergency Management Agency: Washington, DC, USA, 2015.
- Yadollahi, M.; Adnan, A.; Zin, R. Seismic vulnerability functional method for rapid visual screening of existing buildings. Arch. Civ. Eng. 2012, 58, 363–377. [Google Scholar] [CrossRef][Green Version]
- Rai, D.C. Review of Documents on Seismic Evaluation of Existing Buildings; Indian Institute of Technology Kanpur India: Kanpur, India, 2005. [Google Scholar]
- Ansal, A.; Özaydın, K.; Edinçliler, A.; Sağlamer, A.; Sucuoğlu, H.; Özdemir, P. Earthquake Master Plan for Istanbul; Metropolital Municipality of Istanbul, Planning and Construction Directorate; Geotechnical and Earthquake Investigation Department: Istanbul, Turkey, 2003.
- Angeletti, P.; Bellina, A.; Guagenti, E.; Moretti, A.; Petrini, V. Comparison between vulnerability assessment and damage index, some results. In Proceedings of the 9th World Conference on Earthquake Engineering, Tokyo, Japan, 2–9 August 1988; Volume 7, pp. 181–186. [Google Scholar]
- Vallejo, C.B. Rapid Visual Screening of Buildings in the City of Manila, Philippines. In 5th Civil Engineering Conference in the Asian Region and Australasian Structural Engineering Conference 2010; Engineers Australia: Sydney, Australia, 2010; pp. 513–518. [Google Scholar]
- Harirchian, E.; Lahmer, T.; Buddhiraju, S.; Mohammad, K.; Mosavi, A. Earthquake Safety Assessment of Buildings through Rapid Visual Screening. Buildings 2020, 10, 51. [Google Scholar] [CrossRef]
- Harirchian, E.; Lahmer, T. Earthquake Hazard Safety Assessment of Buildings via Smartphone App: A Comparative Study. IOP Conf. Ser. Mater. Sci. Eng. 2019, 652, 012069. [Google Scholar] [CrossRef]
- Işık, E. Investigation of an Existing RC Building with Different Rapid Assessment Methods. Bitlis Eren Univ. J. Sci. Technol. 2015, 5, 71–74. [Google Scholar] [CrossRef]
- Ketsap, A.; Hansapinyo, C.; Kronprasert, N.; Limkatanyu, S. Uncertainty and fuzzy decisions in earthquake risk evaluation of buildings. Eng. J. 2019, 23, 89–105. [Google Scholar] [CrossRef]
- Jain, S.K.; Mitra, K.; Kumar, M.; Shah, M. A proposed rapid visual screening procedure for seismic evaluation of RC-frame buildings in India. Earthq. Spectra 2010, 26, 709–729. [Google Scholar] [CrossRef]
- Ningthoujam, M.; Nanda, R.P. Rapid visual screening procedure of existing building based on statistical analysis. Int. J. Disaster Risk Reduct. 2018, 28, 720–730. [Google Scholar] [CrossRef]
- Morfidis, K.E.; Kostinakis, K.G.; Networks, A.N.; Vulnerability, S. Use Of Artificial Neural Networks in the R/C Buildings’ Seismic Vulnerabilty Assessment: The Practical Point. In Proceedings of the 7th International Conference on Computational Methods in Structural Dynamics and Earthquake Engineering, Crete, Greece, 24–26 June 2019; pp. 24–26. [Google Scholar]
- Morfidis, K.; Kostinakis, K. Approaches to the rapid seismic damage prediction of r/c buildings using artificial neural networks. Eng. Struct. 2018, 165, 120–141. [Google Scholar] [CrossRef]
- Morfidis, K.; Kostinakis, K. Seismic parameters’ combinations for the optimum prediction of the damage state of R/C buildings using neural networks. Adv. Eng. Softw. 2017, 106, 1–16. [Google Scholar] [CrossRef]
- Tesfamariam, S.; Liu, Z. Earthquake induced damage classification for reinforced concrete buildings. Struct. Saf. 2010, 32, 154–164. [Google Scholar] [CrossRef]
- Nanda, R.P.; Majhi, D.R. Review on Rapid Seismic Vulnerability Assessment for Bulk of Buildings. J. Inst. Eng. India Ser. A 2013, 94, 187–197. [Google Scholar] [CrossRef]
- Gowd, B.P.; Jayasree, K.; Hegde, M.N. Comparison of artificial neural networks and fuzzy logic approaches for crack detection in a beam like structure. Int. J. Artif. Intell. Appl. 2018, 9, 35–51. [Google Scholar]
- Irwansyah, E.; Hartati, S. Three-Stage Fuzzy Rule-Based Model for Earthquake Non-Engineered Building House Damage Hazard Determination. J. Adv. Comput. Intell. Intell. Inform. 2017, 21, 1298–1311. [Google Scholar] [CrossRef]
- Shahriar, A.; Modirzadeh, M.; Sadiq, R.; Tesfamariam, S. Seismic induced damageability evaluation of steel buildings: A Fuzzy-TOPSIS method. Earthq. Struct. 2012, 3, 695–717. [Google Scholar] [CrossRef]
- Şen, Z. Supervised fuzzy logic modeling for building earthquake hazard assessment. Expert Syst. Appl. 2011, 38, 14564–14573. [Google Scholar] [CrossRef]
- Şen, Z. Rapid visual earthquake hazard evaluation of existing buildings by fuzzy logic modeling. Expert Syst. Appl. 2010, 37, 5653–5660. [Google Scholar] [CrossRef]
- Tesfamariam, S.; Saatcioglu, M. Risk-based seismic evaluation of reinforced concrete buildings. Earthq. Spectra 2008, 24, 795–821. [Google Scholar] [CrossRef]
- Moseley, J.; Dritsos, S. Rapid assessment of seismic vulnerability using fuzzy logic. In Proceedings of the 3rd Conference on Earthquake Engineering and Engineering Seismology, Athens, Greece, 5–7 November 2008. [Google Scholar]
- Demartinos, K.; Dritsos, S. First-level pre-earthquake assessment of buildings using fuzzy logic. Earthq. Spectra 2006, 22, 865–885. [Google Scholar] [CrossRef]
- Zadeh, L.A. Fuzzy sets. Inf. Control 1965, 8, 338–353. [Google Scholar] [CrossRef]
- Zadeh, L.A. The concept of a linguistic variable and its application to approximate reasoning-III. Inf. Sci. 1975, 9, 43–80. [Google Scholar] [CrossRef]
- Tan, W.W.; Chua, T.W. Uncertain rule-based fuzzy logic systems: Introduction and new directions (Mendel, JM; 2001) [book review]. IEEE Comput. Intell. Mag. 2007, 2, 72–73. [Google Scholar] [CrossRef]
- Chen, Y. Study on centroid type-reduction of interval type-2 fuzzy logic systems based on noniterative algorithms. Complexity 2019. [Google Scholar] [CrossRef]
- Mendel, J.M. A comparison of three approaches for estimating (synthesizing) an interval type-2 fuzzy set model of a linguistic term for computing with words. Granul. Comput. 2016, 1, 59–69. [Google Scholar] [CrossRef]
- Hagras, H.; Wagner, C. Towards the wide spread use of type-2 fuzzy logic systems in real world applications. IEEE Comput. Intell. Mag. 2012, 7, 14–24. [Google Scholar] [CrossRef]
- Mendoza, O.; Melín, P.; Castillo, O. Interval type-2 fuzzy logic and modular neural networks for face recognition applications. Appl. Soft Comput. 2009, 9, 1377–1387. [Google Scholar] [CrossRef]
- Wu, D.; Mendel, J.M. Computing with words for hierarchical decision making applied to evaluating a weapon system. IEEE Trans. Fuzzy Syst. 2010, 18, 441–460. [Google Scholar] [CrossRef]
- Aisbett, J.; Rickard, J.T.; Morgenthaler, D.G. Type-2 fuzzy sets as functions on spaces. IEEE Trans. Fuzzy Syst. 2010, 18, 841–844. [Google Scholar] [CrossRef]
- Cheng, S.; Zadeh, L. On fuzzy mapping and control. IEEE Trans. Syst. Man Cybern. 1972, 2, 30–34. [Google Scholar] [CrossRef]
- Liu, F. An efficient centroid type-reduction strategy for general type-2 fuzzy logic system. Inf. Sci. 2008, 178, 2224–2236. [Google Scholar] [CrossRef]
- Mendel, J.M. On KM algorithms for solving type-2 fuzzy set problems. IEEE Trans. Fuzzy Syst. 2012, 21, 426–446. [Google Scholar] [CrossRef]
- Wu, D.; Mendel, J.M. Enhanced karnik–mendel algorithms. IEEE Trans. Fuzzy Syst. 2008, 17, 923–934. [Google Scholar]
- Liu, X.; Mendel, J.M.; Wu, D. Study on enhanced Karnik–Mendel algorithms: Initialization explanations and computation improvements. Inf. Sci. 2012, 184, 75–91. [Google Scholar] [CrossRef]
- Chua, T.W.; Tan, W.W. Ga optimisation of non-singleton fuzzy logic system for ecg classification. In Proceedings of the 2007 IEEE Congress on Evolutionary Computation, Singapore, 25–28 September 2007; pp. 1677–1684. [Google Scholar]
- Wu, D.; Mendel, J.M. Recommendations on designing practical interval type-2 fuzzy systems. Eng. Appl. Artif. Intell. 2019, 85, 182–193. [Google Scholar] [CrossRef]
- Allen, T.I.; Wald, D.J.; Hotovec, A.J.; Lin, K.W.; Earle, P.S.; Marano, K.D. An Atlas of ShakeMaps for Selected Global Earthquakes; Technical Report; US Geological Survey: Reston, VA, USA, 2008.
- Sucuoglu, H.; Yilmaz, T. Duzce, Turkey: A city hit by two major earthquakes in 1999 within three months. Seismol. Res. Lett. 2001, 72, 679–689. [Google Scholar] [CrossRef]
- SERU. Middle East Technical University, Ankara, Turkey. Archival Material from Düzce Database Located at Website. Available online: http://www.seru.metu.edu.tr (accessed on 31 January 2020).
- Aydan, Ö.; Ulusay, R.; Miyajima, M. The Bingöl Earthquake of May 1, 2003; Japan Society of Civil: Tokyo, Japan, 2003. [Google Scholar]
- Akkar, S.; Boore, D.M.; GüLkan, P. An evaluation of the strong ground motion recorded during the May 1, 2003 Bingöl Turkey, Earthquake. J. Earthq. Eng. 2005, 9, 173–197. [Google Scholar] [CrossRef]
- Ozcebe, G.; Ramirez, J.; Wasti, S.; Yakut, A. May 2003 Bingöl Earthquake Engineering Report; TUBITAK: Ankara, Turkey, 2003; pp. 75–100.
- Bayhan, B.; Gülkan, P. Buildings subjected to recurring earthquakes: A tale of three cities. Earthq. Spectra 2011, 27, 635–659. [Google Scholar] [CrossRef]
- Chever, L. Use of seismic assessment methods for planning vulnerability reduction of existing building stock. In Proceedings of the 15th World Conference on Earthquake Engineering—WCEE, Lisbon, Portugal, 24–28 September 2012; p. 10. [Google Scholar]
- Tesfamariam, S. Seismic Risk Assessment of Reinforced Concrete Buildings Using Fuzzy Based Techniques. Ph.D. Thesis, University of Ottawa, Ottawa, ON, Canada, 2008. [Google Scholar]
- Allali, S.A.; Abed, M.; Mebarki, A. Post-earthquake assessment of buildings damage using fuzzy logic. Eng. Struct. 2018, 166, 117–127. [Google Scholar] [CrossRef]
© 2020 by the authors. Licensee MDPI, Basel, Switzerland. This article is an open access article distributed under the terms and conditions of the Creative Commons Attribution (CC BY) license (http://creativecommons.org/licenses/by/4.0/).