Application of Impact-Echo Method to 3D SIBIE Procedure for Damage Detection in Concrete


1
Department of Civil and Earth Resources Engineering, Graduate School of Engineering, Kyoto University, Kyoto 615-8540, Japan
2
Center for the Promotion of Interdisciplinary Education and Research, Graduate School of Engineering, Kyoto University, Kyoto 615-8540, Japan
*
Author to whom correspondence should be addressed.
Appl. Sci. 2020, 10(8), 2729; https://doi.org/10.3390/app10082729
Submission received: 25 February 2020
/
Revised: 7 April 2020
/
Accepted: 12 April 2020
/
Published: 15 April 2020
(This article belongs to the Special Issue Nondestructive Testing (NDT))
Abstract
:In this study, to visualize damage and defects, such as cracks and voids in concrete, the SIBIE (stack imaging of spectral amplitudes based on impact echo) procedure is applied and numerically improved to construct a three-dimensional (3D) model of elastic wave propagation behavior. A unit of arrayed accelerometers is installed to detect multi-channel signal waveforms in the frequency domain. The resonant frequencies due to reflections at each node in 3D lattice nodes are computed by using the distances from elastic wave input to multiple output locations. The amplitudes corresponding to the resonant frequencies in the spectrum are summed up as the reflection intensity of elastic wave at each node. The reflection intensity distribution is visualized finally in the targeted area three-dimensionally. Case studies are carried out on the proposal of the improved 3D-SIBIE procedure, applied to a concrete specimen with simulated-damage as well as in-situ highway RC (Reinforced Concrete) slabs in service. As for the signal detection, a non-contact elastic wave detecting system using a laser doppler vibrometer is also introduced to consider and validate the promising remote sensing and inspection technique for damage evaluation in concrete with the 3D SIBIE procedure.
1. Introduction
1.1. Non-Destructive Testing for Concrete
It has been generally recognized that preventive and proactive maintenance ideas are necessary for such social infrastructure as bridges and tunnels to develop rational life-cycle scenarios. For reinforced concrete (RC) members, essential issues involve the establishment of a maintenance system with appropriate measurements before evolving the serious damage and failure. For non-destructive testing (NDT), to qualify the materials’ property or structural integrity of concrete, several NDT methods have been applied.
Since sufficient and effective maintenance of infrastructure is desired under the restriction of budget, appropriate inspections by means of NDT must be applied adequately. As for the damage assessment and estimation of repair and retrofit recovery in concrete structures, in addition to developing effective NDTs, innovative methods corresponding to the damage characteristics must be established in parallel. Also, it is strongly demanded to propose appropriate management systems for ageing concrete infrastructures, adapting the aforementioned accurate and ready-to-use inspection techniques for the damage in concrete.
In concrete structures of bridges such as decks, the most problematic type of damage is fatigue damage due to numerous repetitions of excessive traffic overloads [1,2]. The final form of damage due to cyclic loads is well known as horizontally induced large cracks in steel–concrete composite slabs [3]. As it is difficult to detect interior damage, which potentially affects structural performance, by visual inspection [4], this becomes a very serious problem for highway structures composed of reinforced concrete (RC) [5]. For the RC bridge slabs in service, inspection work is generally allowed to implement the bottom side, not including the top side, to avoid controlling the traffic. Therefore, a one-side access NDT method is strongly demanded to quantify or assess the damage in RC members. When the special permission to access both sides is given for in-depth inspections or experimental purposes, tomographic approaches with elastic waves have been applied to visualize the internal damages. Specifically, AE (acoustic emission) sensors or accelerometer arrays are installed on the bottom side and artificial excitations are made on the top side so the internal damage can be visualized with such elastic wave parameters as P-wave velocity and energy attenuation [6,7]. One-side measurements with surface wave techniques have thus been employed to investigate the interior damage of concrete [8]. However, specific depths could not so far be identified with this technique. Meanwhile, the impact-echo method is the most well-used non-destructive testing for concrete structures to characterize the surface area of interest [9,10]. The SIBIE (Stack Imaging of spectral amplitudes Based on Impact-Echo) procedure is an advanced visualization technique using the data of impact echo testing [11,12]. SIBIE demonstrates a two-dimensional (2D) internal image of concrete simply with one receiver while leaving such issues to study such as 3D visualization and more accurate damage identification.
1.2. Impact-Echo Method
Impact-echo is an acoustic method for the nondestructive evaluation of concrete, which is based on the use of impact-generated elastic waves that propagate through concrete, and they are reflected by internal flaws or external surfaces [9]. Impact-echo can be used to not only determine the location and extent of flaws, such as cracks, delamination, and voids in the targeted concrete, but also to provide thickness measurements of concrete slabs as well [10].
As shown in Figure 1, in the impact-echo system, an induced elastic wave at a surface of concrete propagates and reflected by defects or the surfaces in concrete. The received signal is monitored by a transducer coupled to the surface near the elastic wave source. The time-domain waveform is transformed into the frequency-domain one using the fast Fourier transform (FFT). The frequency spectrum contains those resonance frequencies due to reflections at such interfaces as the internal defects and the surfaces of the material of interest. When the P-wave velocity in the concrete is known, the detected peak frequency can be expressed as in Equations (1) and (2), respectively.
where fT is resonance frequency due to material thickness, fd is resonance frequency due to internal damage (defect), T is the thickness of targeted member, d is defect depth, and Cp is P-wave velocity in concrete.
1.3. SIBIE Procedure
In order to visualize such defect as crack and void in concrete, SIBIE (stack imaging of spectrum amplitudes based on impact-echo) procedure has been developed [11,12]. In the procedure, a targeted cross-section is modeled and divided into square elements as shown in Figure 2. Then, resonant frequencies obtained from FFT analysis due to elastic wave reflections at each element are computed. The travel distance from the input, which is excited by hammering (tapping) concrete surface with steel sphere ball of 10 mm diameter, to the output through the elements is calculated by Equation (3).
where is the distance from the input (impact) point to the nodal point of an element and is the distance from the nodal point of an element to the output (signal detection) point. The resonant frequencies due to reflections at each element are calculated by Equation (4).
In the frequency spectrum, amplitudes corresponding to these resonances are summed up at each nodal point. Thus, the reflection intensity as the data stacking result at all the analytical elements is prepared for the visualized contour image. After the SIBIE analysis, a 2D view of the contour image is displayed, and the high reflected zone is visually identified as the estimated location of anomaly namely damage.
The SIBIE procedure has been applied for the case studies in the author’s previous research. The results for detecting grouted and un-grouted PC (pre-stressed concrete) sheaths is illustrated as in Figure 2 [11]. The size of each mesh is of dimensions 10 × 10 mm. In the figures, it can be observed that both grouted and un-grouted sheaths were clearly identified with the values of reflection intensities. The contour values are given as the relative amplitude, which is obtained by normalizing data with a maximum amplitude provided from the FFT result, of the P-wave intensity computed from frequency spectrum of received signal.
In the above-mentioned results, after the SIBIE procedure, it is possible to identify the grouting condition only when the sheath location is preliminarily known. When the sum of distance R in Equation (3) from input point to a nodal point and the nodal point to output point is the same (Figure 2), it is understandable that the same reflection intensities are given. As the location is based on Equation (3), there are many candidates of nodes with the same travel distance, and therefore the conventional the SIBIE procedure with only one receiver cannot occasionally provide correct geometrical information for asymmetrically distributed damage to the vertical axis e.g., in Figure 2. To upgrade the procedure from 2D to 3D with multiple receivers, in this study, an array with multiple sensors over a targeted area is employed. Specifically, four accelerometers and laser doppler vibrometer system, which is innovatively introduced for remote sensing technique, are used to improve the identification of damage in concrete. A concrete slab of existing structures and an experimentally casted slabs embedded by artificial damage with styrofoam are subjected to the expanded SIBIE procedure.
1.4. Remote Sensing for Elastic Wave Detection with Laser Doppler Vibrometer
As for remotely detecting elastic waves propagated through concrete, non-contact acoustic systems with a laser doppler vibrometer (LDV) for detecting signals have been reported [13,14,15]. These research approaches provide remote and rapid operations for inspection works based on the elastic wave method. In this study, a laser doppler vibrometer is also introduced, in addition to conventional accelerometers, to detect the elastic wave in concrete. The signal output from LDV is generally a continuous analog voltage that is directly proportional to the velocity component at targeted surface along the laser beam direction. The system specification of LDV used in this study is given as digital velocity decoder with 0.5 Hz–22 kHz frequency band and velocity resolution is <0.02 (µm/sec)/√Hz. The signal detectable distance of LDV is from 0.1 to 30 m. This enables the non-contact vibration measurements of concrete surface and obtain the signal information required for the SIBIE analysis in addition to the conventional contact signal acquisition system with accelerometers.
2. 3D SIBIE Procedure
2.1. Sensor Array with Accelerometers and Laser Doppler Vibrometer
To develop an improvement for the SIBIE procedure in this study, the measurement and the computation steps in the procedure are extended to three-dimensional (3D) model, using a multi- sensor (accelerometer) array unit for on-site measurement as shown in Figure 3. The unit is developed to access only underneath an RC deck in service with 30 × 30 cm grid composing of 4 sensors, arranging each apex of 300 mm square. The thickness of the deck is approximately 400 mm, composed of 180 mm RC (reinforced concrete), 70 mm FRC (fiber reinforced concrete) overlay, and 50 mm asphalt pavement.
The multi-sensor inputs and outputs provide the spectral amplitudes of resonance frequencies due to 3D propagation of elastic wave reflections at each element (voxels) in depth (thickness of the targeted concrete) direction of 2D plane (300 × 300 mm), which is the volume of interest for 3D SIBIE analysis. Additionally, to achieve remote-controlled non-destructive testing, the center of the array unit is targeted by laser doppler vibrometer to obtain the signal as well as the accelerometers in the laboratory test. Figure 4 shows the application overview and the received signal when introducing the laser doppler vibrometer to detect the signals. As the waveform signal detected by LDV demonstrates sufficient amplitude, this can be used as the received signal through the concrete by the SIBIE procedure.
2.2. Computing Procedure for 3D SIBIE
The following steps show one-side access measurement and the computation procedure, developed in this study for the 3D SIBIE procedure. Figure 5 displays the targeted volume of interest and cross sections employed for the computation.
- Place the sensor array on one surface of targeted concrete and hammer with steel sphere ball of 10 mm diameter near each sensor (n = 4) for 10 times respectively.
- Divide 300 (x-direction) × 300 mm (z-direction) in depth (y-direction) for volume of interest into 10 mm meshes.
- Employ the nodal points on the cross sections of x = 0, x = 300, z = 0, z = 300, x = z, x + z = 300 to mitigate computational load.
- Calculate R (travel length of elastic wave) from each nodal point to input and output points (R is the shortest linear path as explained).
- Search for fR frequencies due to reflection of propagating P-wave with velocity of Cp.
- Normalize the amplitude from 0 to 1 based on the highest peak value in the frequency spectrum to cancel the variability of each manual hammering impact.
- Stack amplitudes according to fR and quantify reflection intensity values at each nodal point.
- Visualize 3D geometry with the stacking data based on local polynomial regression method.
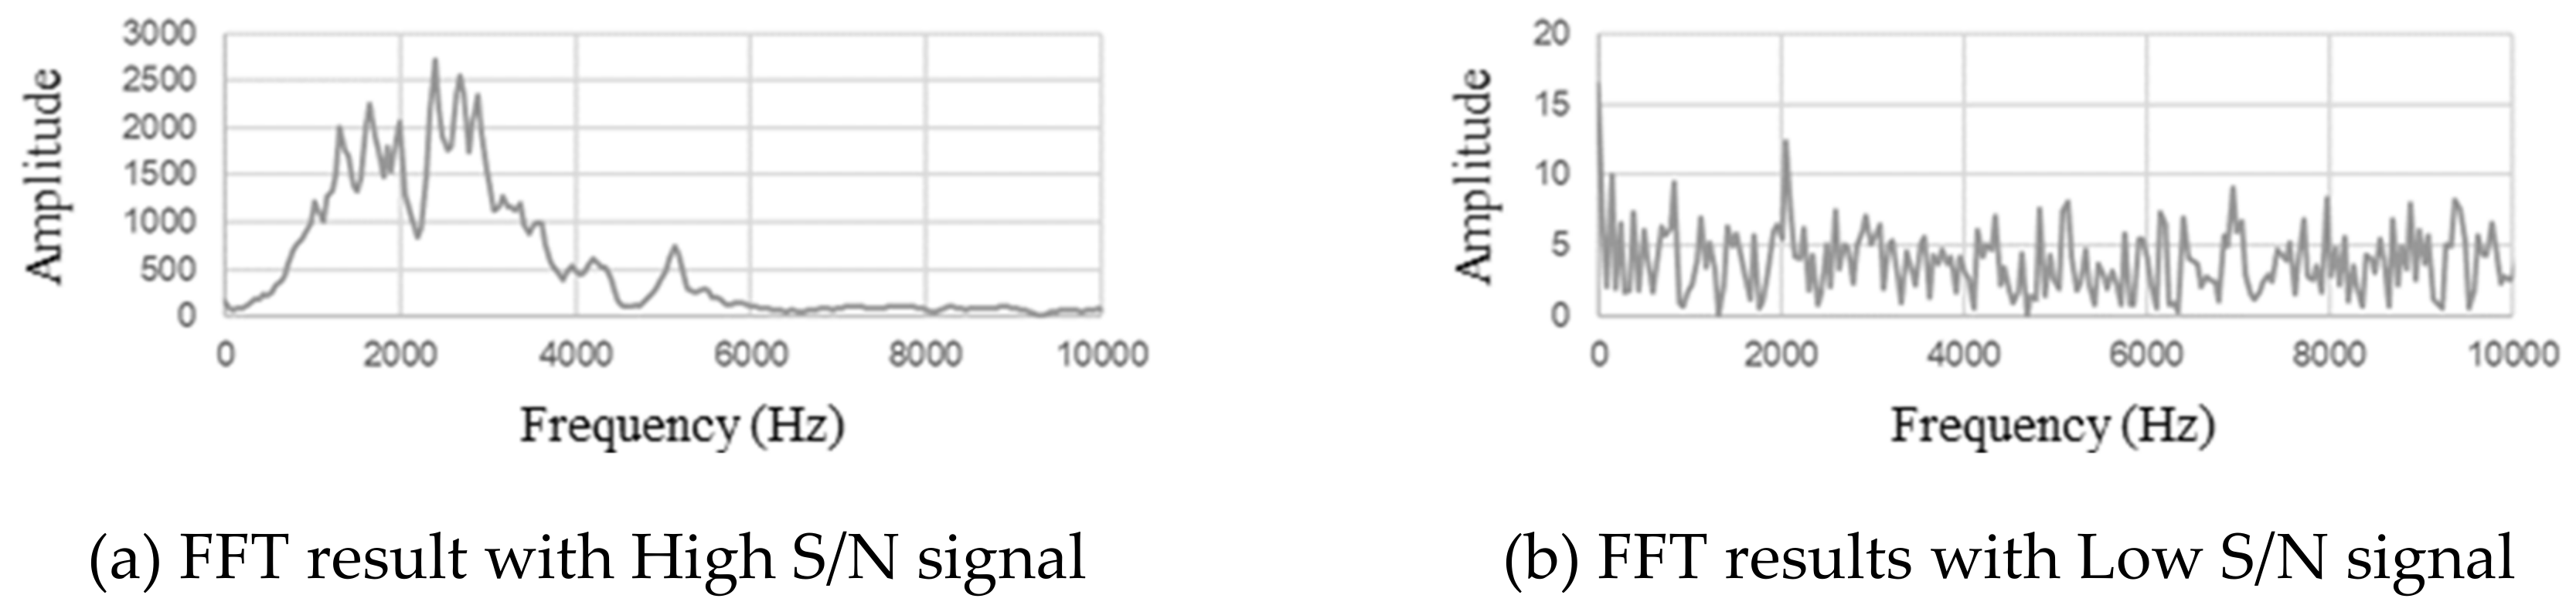
Figure 6 shows the example of frequency spectrum successfully obtained from the received signal followed by FFT analysis. Sampling rate is set at 100 kHz in the following measurement. Those sampling rates are appropriately determined to discuss the FFT (Fast Fourier Transform) results in this study since the waveform is sampled at 10000 points for FFT to achieve the sufficient resolution less than 50 Hz.
Meanwhile, some recorded waveform due to an impact of low energy may cause the low S/N (signal-to-noise ratio) signal and FFT indeterminate peaks. The procedure of FFT signal data stacking with/without including low S/N waveforms are shown in Figure 7. Tapping 10 times according to the above-mentioned steps for 3D SIBIE method, FFT peak stacking results in giving an incorrect data with unclear frequency spectrum when some signals into a sensor are not entirely high S/N, wherein n = 3, 6, 8, 9 for the example. As a consequence, between the process of 5 and 6 for the development of the 3D SIBIE procedure, low S/N signals are removed from the computation to guarantee data quality. The FFT signal data stacking result without signal normalization procedure is indicated numerically as in Figure 8, where the process of 6 is excluded. It is obvious that the spectrum of n:3 is different from others in 5 kHz implying that this is attributed to some noises. As shown in Figure 8a, the stacked amplitude of 10 raw data without the signal normalization is influenced by the noise signal of n:10 but now found in Figure 8b. The normalization for each frequency spectrum before stacking is thus very effective on the data acquisition process of the 3D SIBIE procedure.
3. Examination of 3D SIBIE Procedure
3.1. Application of Accelerometer Array for Detecting Signals
3.1.1. Reinforced Concrete Bridge Deck
The 3D SIBIE procedure has been applied for existing structures. A RC bridge deck in service was targeted. Two different areas were selected for the case study after the crack inspection work. The crack inspection procedure is schematically described in Figure 9 with 4 steps as follows.
- Drilling a 5 mm diameter hole into the concrete deck from the surface of asphalt pavement
- Injecting epoxy resin (in orange-colored to clearly see the crack)
- Re-Drilling a 10 mm diameter hole at the same location after the resin is hardened
- Inserting a flexible fiber optic borescope into concrete to take photos
Figure 10 shows an example of the view from the fiberscope when it caught the crack filled with resin. In this way, damaged and non-damaged namely intact parts are chosen for the 3D SIBIE procedure. Figure 11 shows the 3D SIBIE result for the RC deck in the intact part and Figure 12 shows that for RC deck in the damaged part where a lateral crack in concrete and also delamination between an asphalt pavement layer and a concrete layer was found. The sensor array was placed on the bottom surface of the deck and measurement was carried out for the 3D SIBIE procedure. The top surface denotes that of asphalt pavement and the bottom shows the bottom of the concrete layer both in Figure 11 and Figure 12. In these figures, the thickness of the concrete layer is 0–180 mm, 180–250 mm in the fiber reinforced concrete (FRC) overlay, and the asphalt pavement is 250–300 mm from the bottom. In the intact part as shown in Figure 11, no sharply defined reflection intensity is found in the volume of interest while, for the damaged part as shown in Figure 12, the color gradations show strong reflections of elastic waves due to anomaly such as cracks or voids around the bottom of the RC deck (see the bottom area in the right side sectional view). Also, three layers consisting of concrete, FRC and asphalt can be classified by the 3D visualized image. As the strong reflections are obtained from the large difference of acoustic impedance of which the individual materials have, the delamination between the asphalt and the concrete layers, which can be visually confirmed, and sub-critical cracks, which cannot be visually confirmed, are possibly attributed to this fact.
3.1.2. Concrete Specimen with Simulated Defect
Concrete specimen using high-early strength cement was prepared for 30 MPa design strength. The size is 300 (x-direction) × 400 (y-direction) × 300 mm (z-direction). The thickness is defined as y-direction in this study. Figure 13 shows the geometrical information of concrete specimens and sensing (accelerometers and LDV) locations. As for experimentally simulating damage in concrete, a cubic styrofoam of 300 (x-direction) × 50 (y-direction for thickness) × 150 mm (z-direction) was embedded at 175 mm depth in the y-direction in the center of specimen.
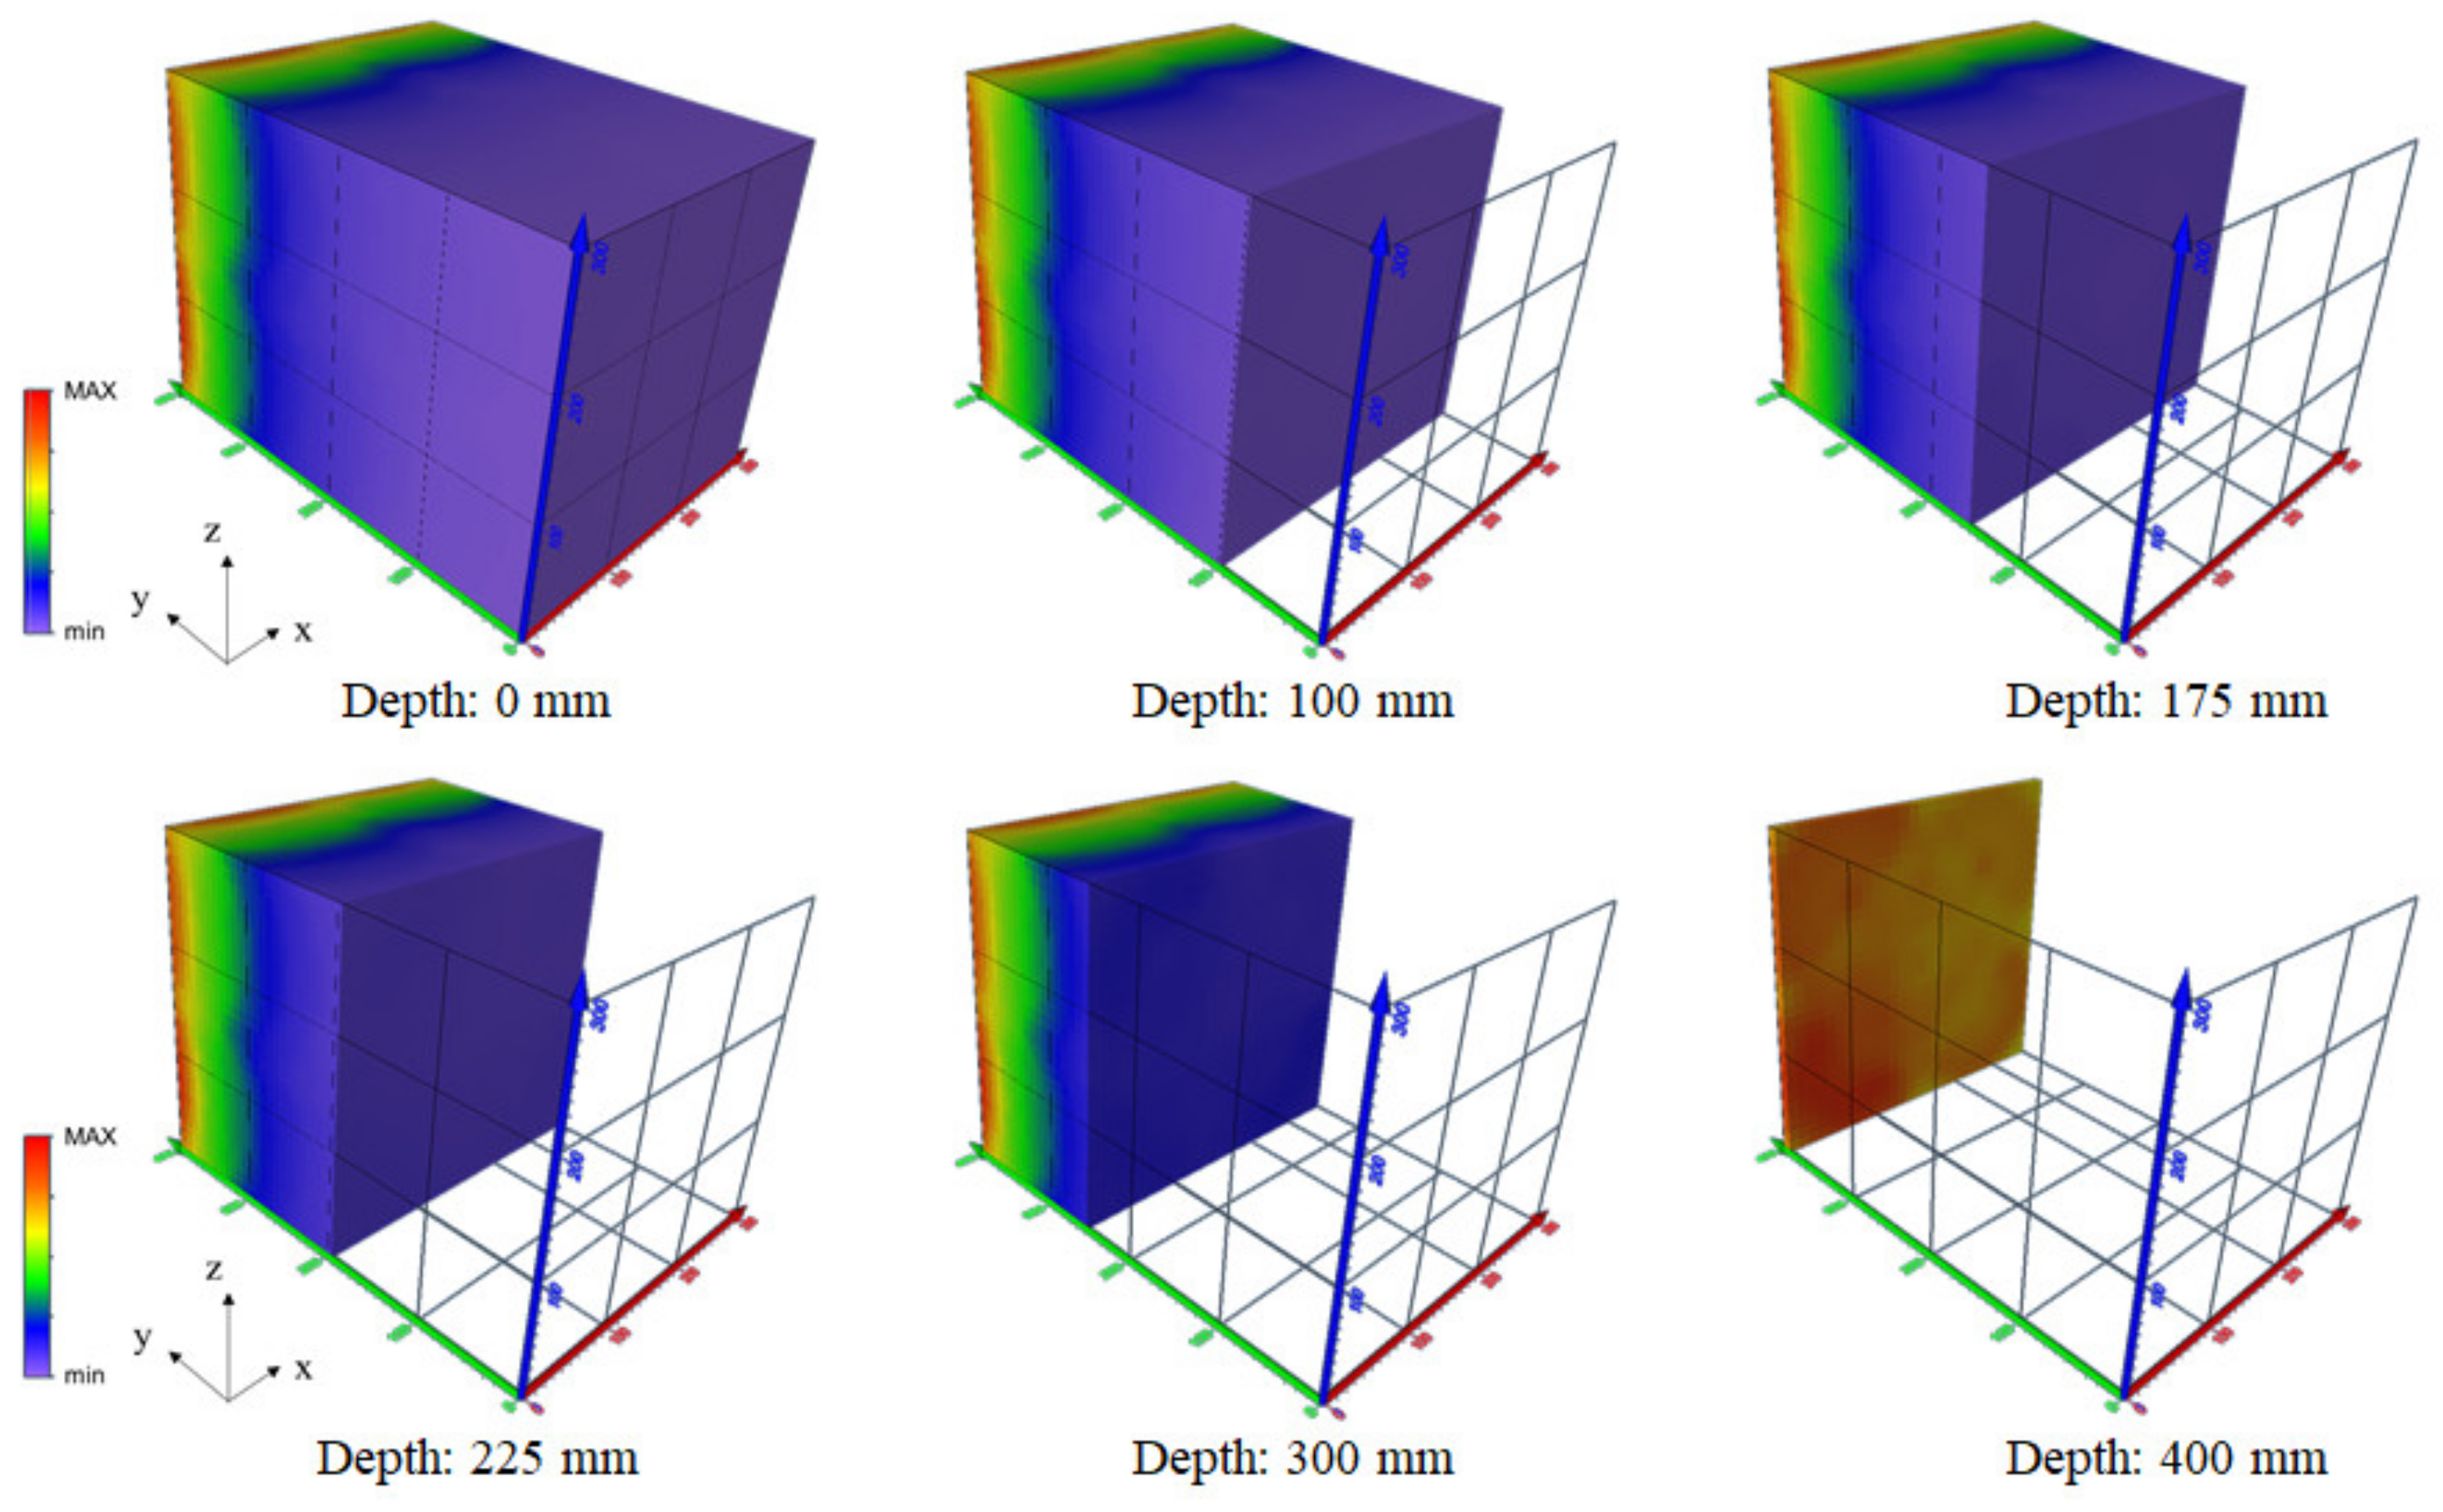
As shown in Figure 14 and Figure 15, when the accelerometer array unit is employed for detecting signals, in the visualization results with the 3D SIBIE procedure for interior concrete, the location of defect (simulated damage) is clearly identified from 175 to 225 mm in the depth (y) direction in Figure 14, where higher reflection intensity is given, while no remarkable changes is not found in other depths as well as in the intact specimen as shown in Figure 15. Note, the values of reflection intensities are provided as color gradations relatively from 0 to 1 as normalized data based on the maximum value of each contour displayed. The reflection intensity at the embedded styrofoam is even lower than that of the thickness reflection at 400 mm depth in the y-direction, since the acoustic impedance of air is obviously lower than that of the styrofoam. As for the result of intact concrete in Figure 15, only the thickness reflection is demonstrably observed at 400 mm depth in the y-direction.
3.2. Application of Laser Doppler Vibrometer for Detecting Signals
A laser doppler vibrometer for detecting signals has been introduced for the 3D SIBIE procedure to visualize the simulated damage in the concrete specimen. When LDV signal detection is applied and the data are introduced to the 3D SIBIE procedure, the visualized images in Figure 16 successfully indicate the defect position with higher reflection intensity at the middle depth of the specimen than that at the other area in the targeted volume of interest. On the other hand, when it is applied to the intact specimen as shown in Figure 17, an intensive reflection is only obtained from the thickness at 400 mm depth in the y-direction, as is the case of the accelerometers.
3.3. 3D SIBIE Procedure Improved with Signal Amplification
As explained in this study, the 3D SIBIE procedure is developed based on 3D model with the use of the multiple-sensor array. The procedure is successfully applied for the case studies of the targeted concrete specimen for the laboratory test by employing the accelerometer array unit and the laser doppler vibrometer for detecting signals as well as the case of the existing RC deck in service. As the results, the extension of the 2D computation process for the conventional SIBIE procedure to 3D coordinates enables to visualize the interior damage. The 3D SIBIE procedure has a great promise for on-site and non-contact measurement and potentially could be used to operate remote and rapid damage inspection and material assessment for concrete structures.
The 3D SIBIE procedure do not consider the attenuation of propagation in elastic waves so that the results described above in Figure 14, Figure 15, Figure 16 and Figure 17, relatively high reflection intensity is found even in the intact area of interest. Since the amplitude in frequency domain of the signal detected at the receiving point with the accelerometers or LDV by reflection of elastic wave becomes smaller as its propagation distance becomes longer, it is considered that the deeper the detection depth in the targeted volume, the smaller the reflection intensity mathematically in the result of signal computing process of the SIBIE procedure.
Pile Integrity Test (PIT) utilizes a simple principle of elastic wave characters to assure the quality of the concrete pile. When elastic waves are excited at the pile head, it is assumed that elastic waves travel at the speed of C inside the concrete pile shaft, and the pile length can be determined by measuring the time lapse of T. Based on the detected signal waveform between the time of hammering and the time of receiving reflections on pile head, as shown in Figure 18, the amplitude of the reflected wave is attenuated due to the effect of geometrical or internal damping of the materials during the propagation.
Thus, in the applied technique for in-situ measurement, an exponential amplification function is applied across the recorded waveform to amplify the low energy reflection peaks from the pile toe and other internal defects such as voids and cracks [16,17,18].
In the same manner as in the signal amplification method of PIT principle, the method is also introduced for the 3D SIBIE procedure to correct the reflection intensity in the visualization results. Figure 19 shows some examples of actually recorded signals with the accelerometer sensor array, explained in Figure 13, followed by hammering at concrete surface. In order to define an exponential function for signal amplification in consideration with the signal attenuation through the targeted concrete, an exponential function is derived for each data set from the obtained waveforms as in Figure 20.
The respective functions for each recorded data can be used to calibrate the attenuation of the detected signals. By using the calibrated data according to the signal amplification function, as shown in Figure 21, Figure 22, Figure 23 and Figure 24, the visualization images of reflection intensity are modified by the 3D SIBIE procedure. The results indicate that the visualized images are changed due to the improved signal processing. This means that reflection intensities at the damage-simulated part with styrofoam is sufficiently high compared to those at an intact part without the consideration of the attenuation effect during elastic waves propagation. On the other hand, as for intact cases, the relatively high reflection intensities expressed in the intact part are perfectly removed and only the high reflection at 400-mm depth corresponding to the boundary of the specimen is obtained.
In order to get even clearer visualized image, more elastic wave ray paths by increasing the number of hammering locations and sensors would work effectively. In addition, it is necessary to take into account the fact that the elastic wave velocity is not constant in real situation. It is assumed in the above-mentioned computations of this study that the elastic velocity is the same throughout the targeted concrete matrix. The further investigation needs to consider that the velocity could be varied according to the material property and treated as the variable number in the 3D-SIBIE procedure.
4. Conclusions
There is great demand for simplified and innovative techniques for the maintenance and assessment of concrete structures. Inspection works need to be ready-to-use as well as save time and costs related to damage evaluation. Developments in this area will support damage visualization to diagnose social infrastructures practically, i.e. highways, tunnels, and dams built using concrete.
In order to visualize damage, such as cracks and voids in concrete, the SIBIE (stack imaging of spectral amplitudes based on impact echo) procedure was applied and improved numerically. SIBIE was proposed in this study to be upgraded from a 2D to 3D model of elastic wave propagation behavior. Using the multiple sensor array composed of a handy mechanical device with accelerometers, the 3D SIBIE procedure was developed as a simple and ready to use measuring technique. It was also found that the laser doppler vibration sensing method could work for the remote data acquisition in the detection of elastic wave reflection for the procedure.
The procedure was successfully applied for the case studies of targeting RC deck in service as well as a concrete specimen for the laboratory test. In terms of results, the extension of the 2D computation process for the conventional SIBIE procedure to 3D coordinates enabled to estimate and display interior damages and geometrical information of materials constituting the layers of RC deck, such as asphalt pavement, fiber-reinforced overlay, and concrete. Additionally, the data computation process was improved considering the signal attenuation during the propagation, resulting in a clearer finding in terms of the damage assessment in the visualized images than that of the conventional calculation method.
It could be concluded that the 3D SIBIE procedure has a great promise for on-site measurement and can be employed to operate deterioration diagnosis for invisible damage in concrete and material assessment for concrete infrastructures accordingly.
Author Contributions
Conceptualization, K.H., T.S. and M.O.; Formal analysis, K.H.; Funding acquisition, T.S.; Investigation, K.H.; Methodology, K.H.; Visualization, K.H.; Validation, K.H. and T.S.; Supervision, T.S. and M.O.; Writing—Original Draft, K.H.; Writing—Review and Editing, T.S. All authors have read and agreed to the published version of the manuscript.
Funding
This research received no external funding.
Conflicts of Interest
The authors declare no conflict of interest.
References
- ACI Committee 215. Consideration for design of concrete subjected to fatigue loading. ACI J. 1974, 71, 97–121. [Google Scholar]
- Zhang, J.; Peng, H.; Cai, C.S. Field study of overload behavior of an existing reinforced concrete bridge under simulated vehicle loads. J. Bridge Eng. 2010, 16, 226–237. [Google Scholar] [CrossRef]
- Fujiyama, C.; Maekawa, K. A computational simulation for the damage mechanism of steel-concrete composite slabs under high cycle fatigue loads. J. Adv. Concr. Technol. 2011, 9, 193–204. [Google Scholar] [CrossRef] [Green Version]
- Fathalla, E.; Tanaka, Y.; Maekawa, K. Effect of crack orientation on fatigue life of reinforced concrete bridge decks. Appl. Sci. 2019, 9, 1644. [Google Scholar] [CrossRef] [Green Version]
- Toutlemonde, F.; Ranc, G. Fatigue tests of cracked reinforced concrete slabs for estimating the service life of composite bridge decks. Revue Française de Génie Civil 2001, 5, 483–494. [Google Scholar] [CrossRef]
- Hashimoto, K.; Shiotani, T.; Nishida, T.; Miyagawa, T. Application of elastic-wave tomography to repair inspection in deteriorated concrete structures. J. Disaster Res. 2017, 12, 2017. [Google Scholar] [CrossRef]
- Chai, H.K.; Momoki, S.; Kobayashi, Y.; Aggelis, D.G.; Shiotani, T. Tomographic reconstruction for concrete using attenuation of ultrasound. NDT E Int. 2011, 44, 206–211. [Google Scholar] [CrossRef]
- Chai, H.K.; Aggelis, D.G.; Momoki, S.; Kobayashi, Y.; Shiotani, T. Single-side access tomography for evaluating interior defect of concrete. Constr. Build. Mater. 2010, 24, 2411–2418. [Google Scholar] [CrossRef]
- Carino, N.J.; Sansalone, M. Detecting voids in metal tendon ducts using the impact-echo method. Mater. J. Am. Concr. Inst. 1992, 89, 296–303. [Google Scholar]
- Sansalone, M.; Lin, J.M.; Streett, W.B. A New Procedure for determining the thickness of concrete highway pavements using surface wave speed measurements and the impact-echo method. In Innovations of Nondestructive Testing; Pessiki, S., Olson, L., Eds.; American Concrete Institute: Farmington Hills, MI, USA, 1997; p. 167. [Google Scholar]
- Ohtsu, M.; Watanabe, T. Stack Imaging of Spectral Amplitudes based on Impact-Echo for Flaw Detection. NDT E Int. 2002, 35, 189–196. [Google Scholar] [CrossRef]
- Ohtsu, M.; Yamada, M. and Sonoda, T. Quantitative evaluation of SIBIE procedure and case studies. Constr. Build. Mater. 2013, 48, 1248–1254. [Google Scholar] [CrossRef]
- Akamatsu, R.; Sugimoto, T.; Utagawa, N.; Katakura, K. Proposal of non-contact inspection method for concrete structures using high-power directional sound source and scanning laser doppler vibrometer. Jpn. J. Appl. Phys. 2013, 52, 07HC12. [Google Scholar] [CrossRef]
- Kurahashi, S.; Mikami, K.; Kitamura, T.; Hasegawa, N.; Okada, H.; Kondo, S.; Nishikino, M.; Kawauchi, T.; Shimada, Y. Demonstration of 25-Hz-inspection speed laser remote sensing for internal concrete defects. J. Appl. Remote Sens. 2018, 12, 015009. [Google Scholar] [CrossRef] [Green Version]
- Furusawa, A.; Takenaka, Y.; Nishimura, A. Proposal of laser-induced ultrasonic guided wave for corrosion detection of reinforced concrete structures in Fukushima daiichi nuclear power plant decommissioning site. Appl. Sci. 2019, 9, 3544. [Google Scholar] [CrossRef] [Green Version]
- Rausche, F.; Kung, S.R.; Linkins, G. Comparison of pulse echo and transient response pile integrity test methods. Transp. Res. Rec. 1991, 1331, 21–27. [Google Scholar]
- Rausche, F.; Linkins, G.; Kung, S.R. Pile integrity testing and analysis. In Proceedings of the International Conference on the Application of Stress-Wave Theory to Piles, The Hague, The Netherlands, 21–24 September 1992; pp. 613–617. [Google Scholar]
- Ni, S.H.; Lehmann, L.; Charng, J.J.; Lo, K.F. Low-strain integrity testing of drilled piles with high slenderness ratio. Comput. Geotech. 2006, 33, 283–293. [Google Scholar] [CrossRef]
Figure 1.
Schematic of impact-echo method applied to the testing interior concrete.
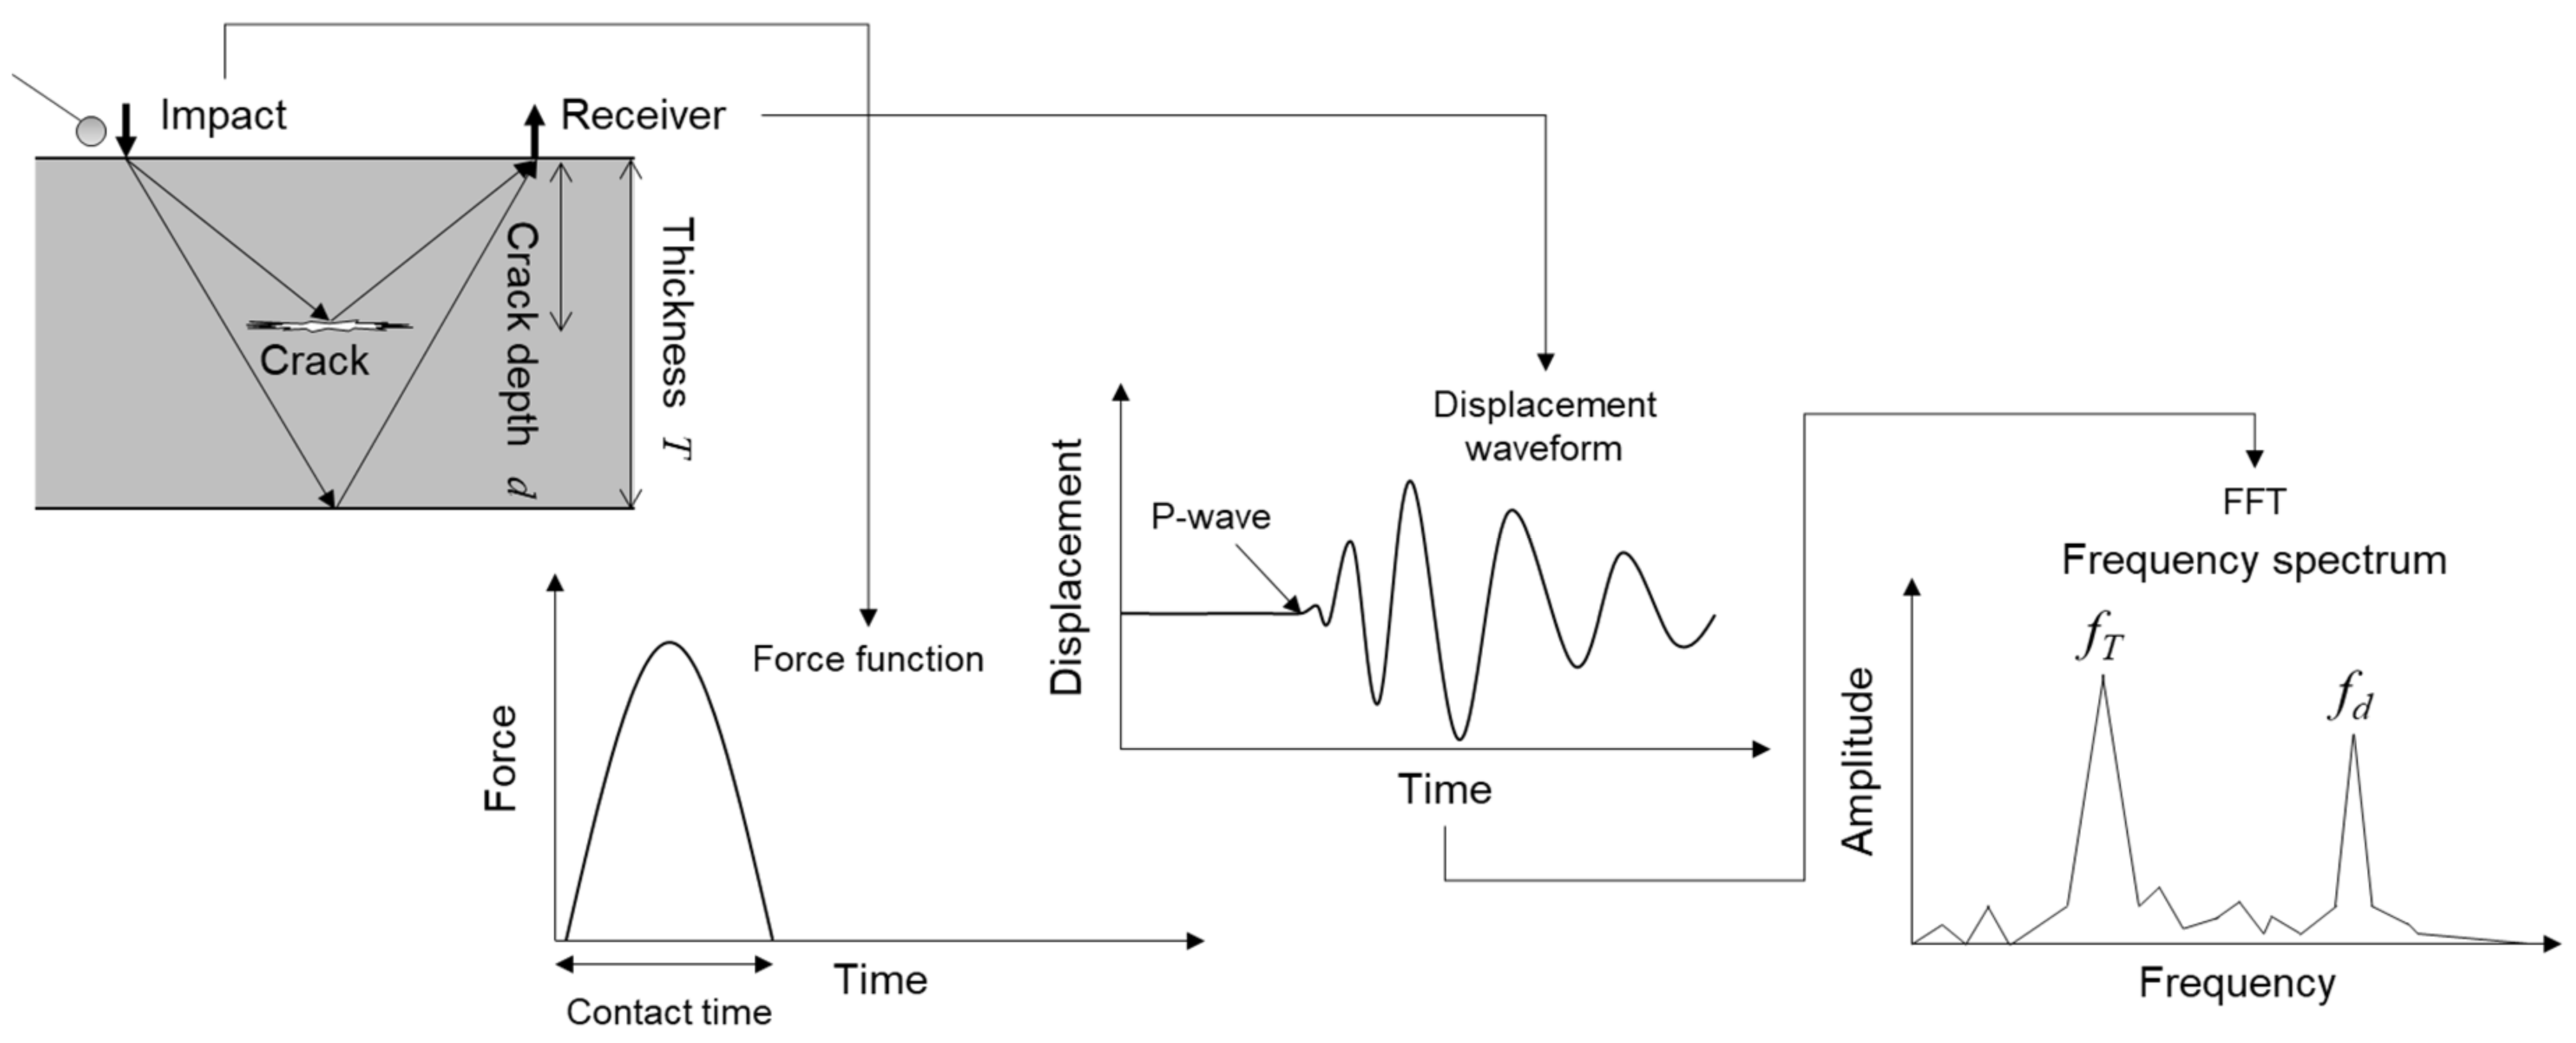
Figure 2.
Mesh division and results of SIBIE (Stack Imaging of spectral amplitudes Based on Impact-Echo) procedure [3].
Figure 2.
Mesh division and results of SIBIE (Stack Imaging of spectral amplitudes Based on Impact-Echo) procedure [3].

Figure 3.
(a) Accelerometer array unit; (b) Overview of on-site implementation.
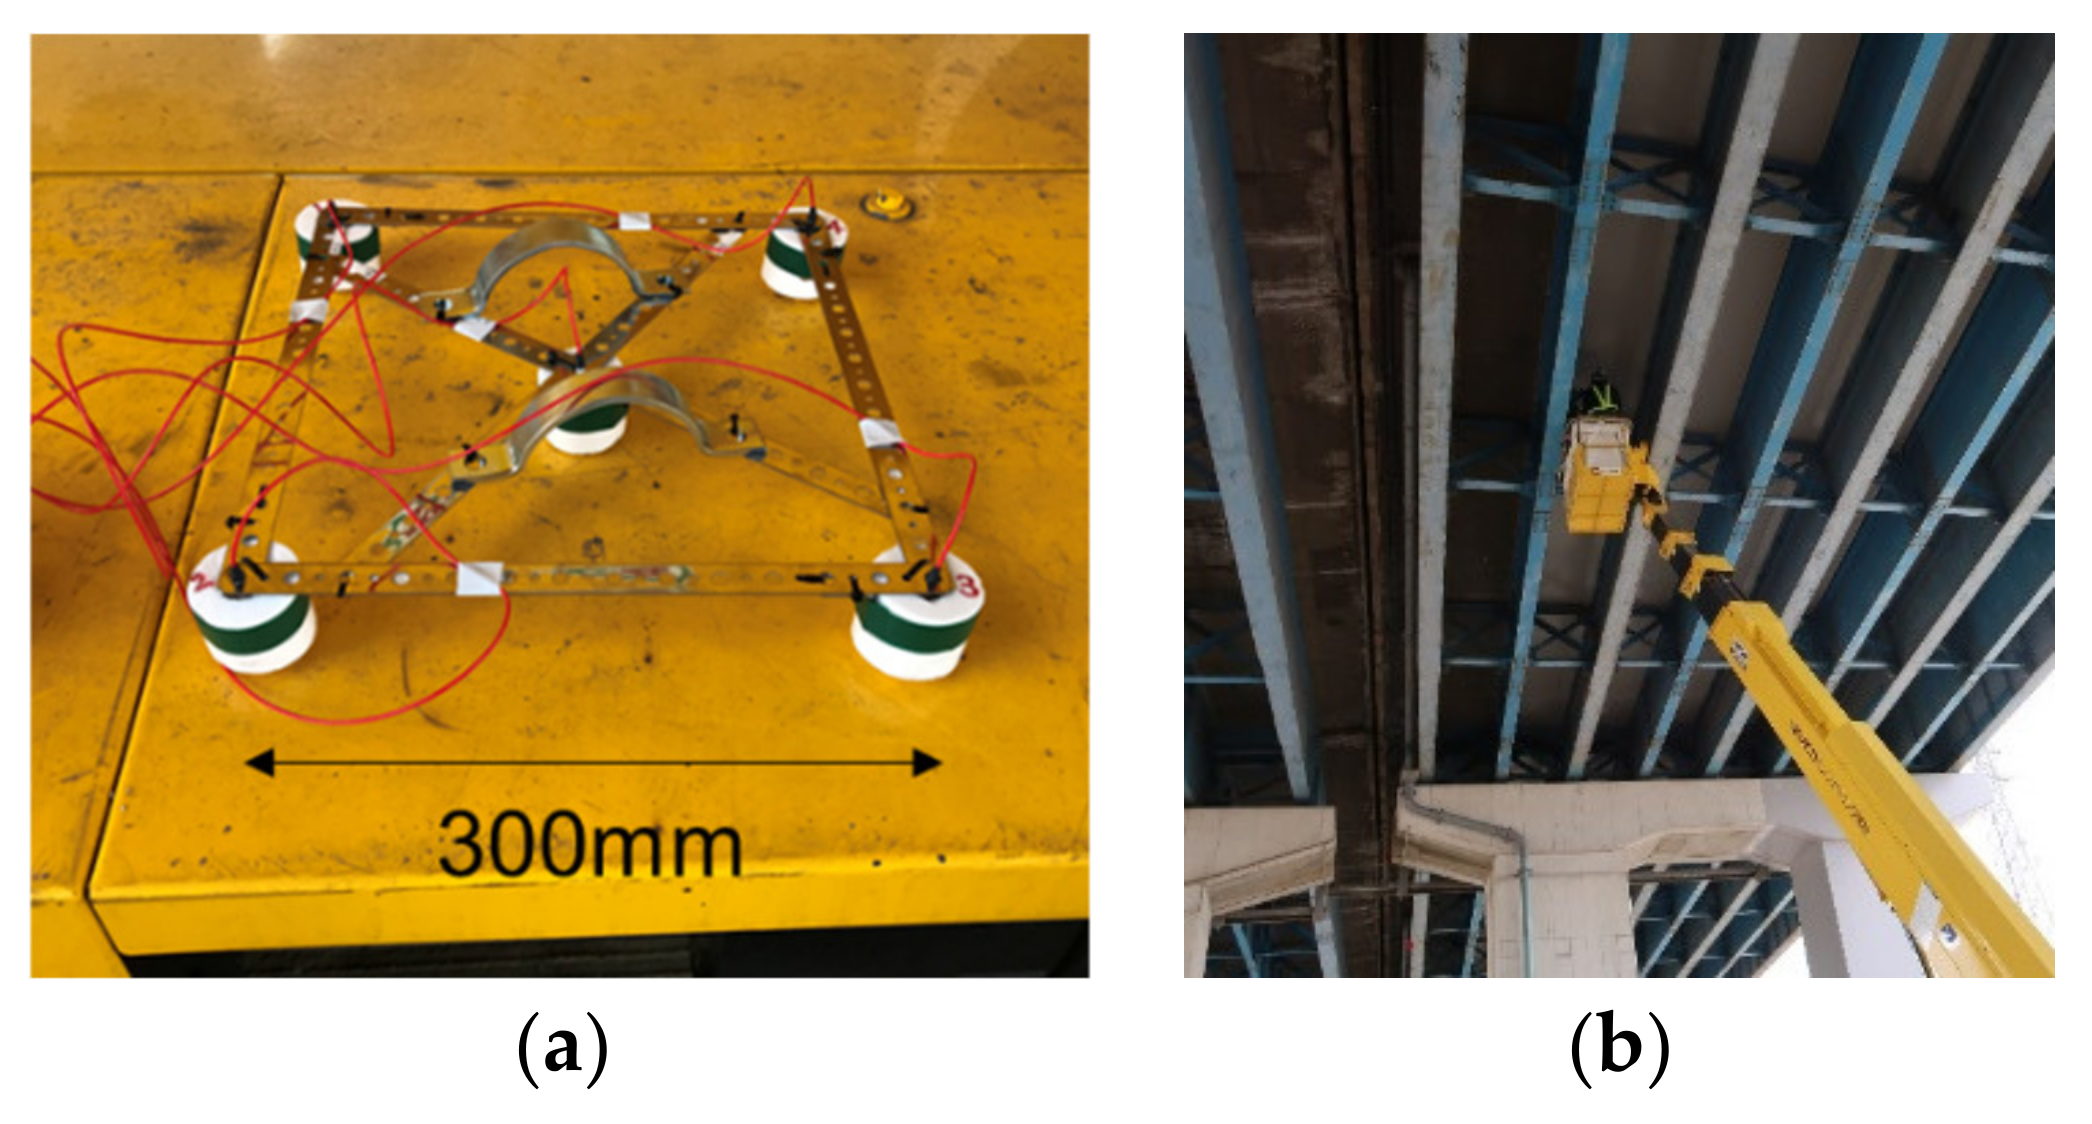
Figure 4.
(a) Laser doppler vibrometer; (b) Detected waveform with application of laser doppler vibrometer for laboratory test.
Figure 4.
(a) Laser doppler vibrometer; (b) Detected waveform with application of laser doppler vibrometer for laboratory test.
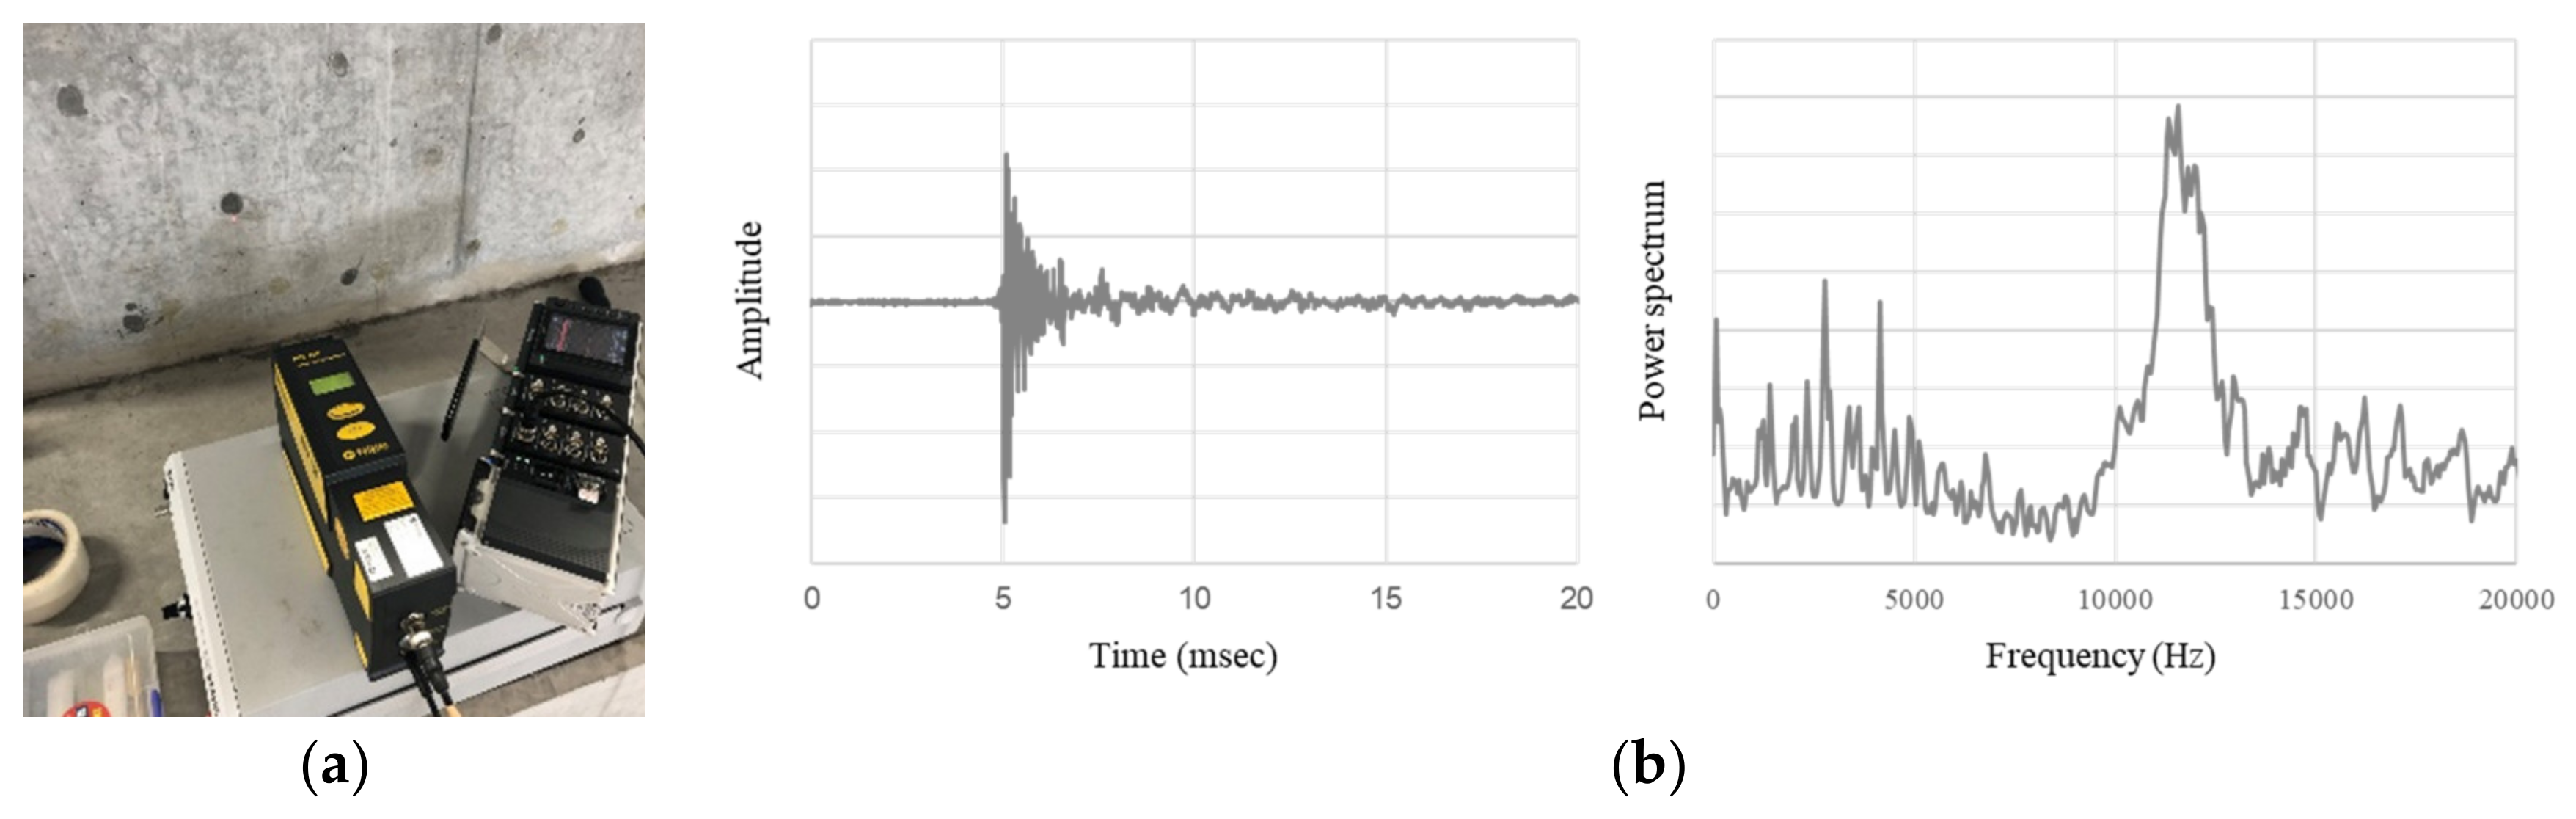
Figure 5.
Volume of interest and cross section for 3D SIBIE procedure.
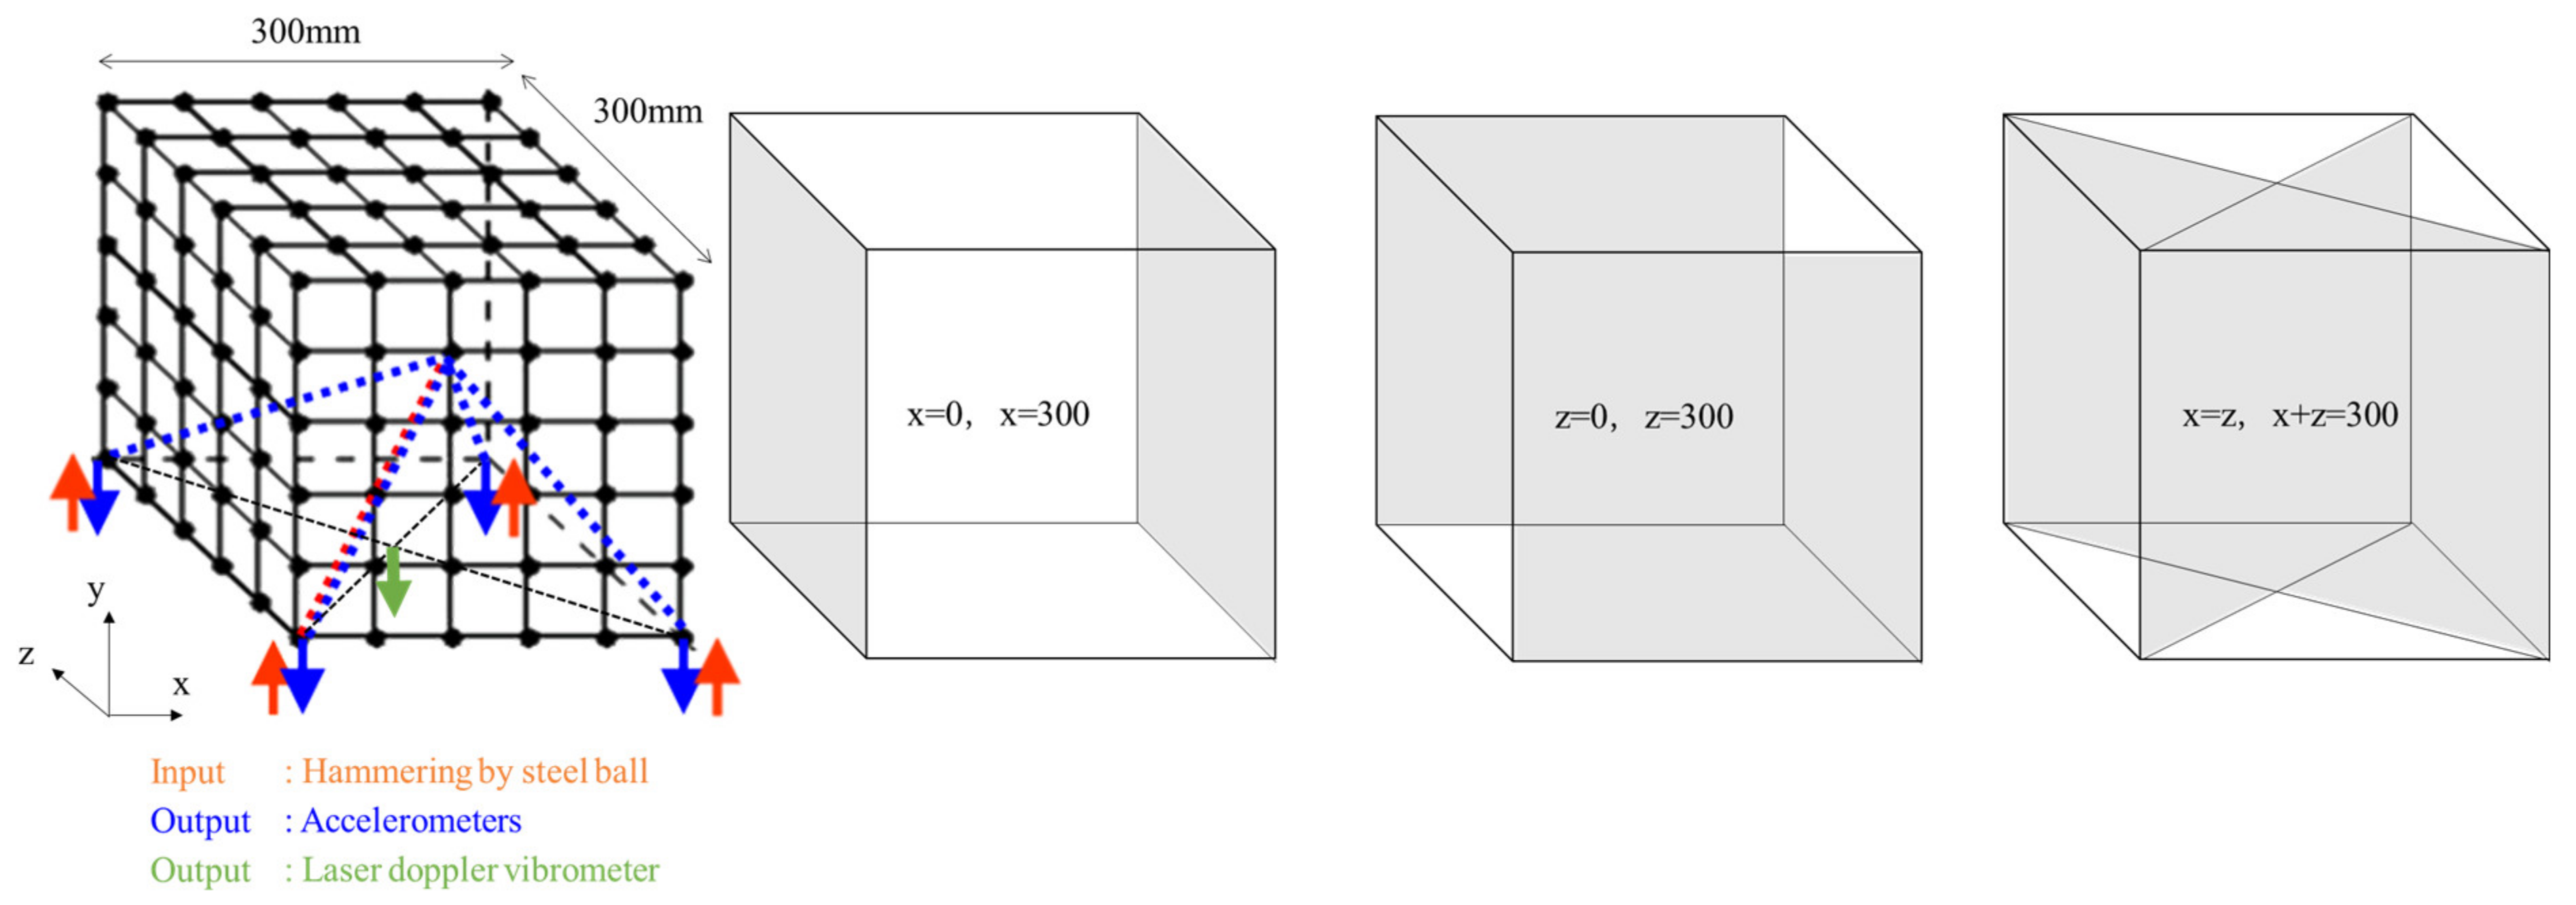
Figure 6.
An example of FFT (Fast Fourier Transform) result of low S/N signal.
Figure 7.
FFT signal data stacking procedure.
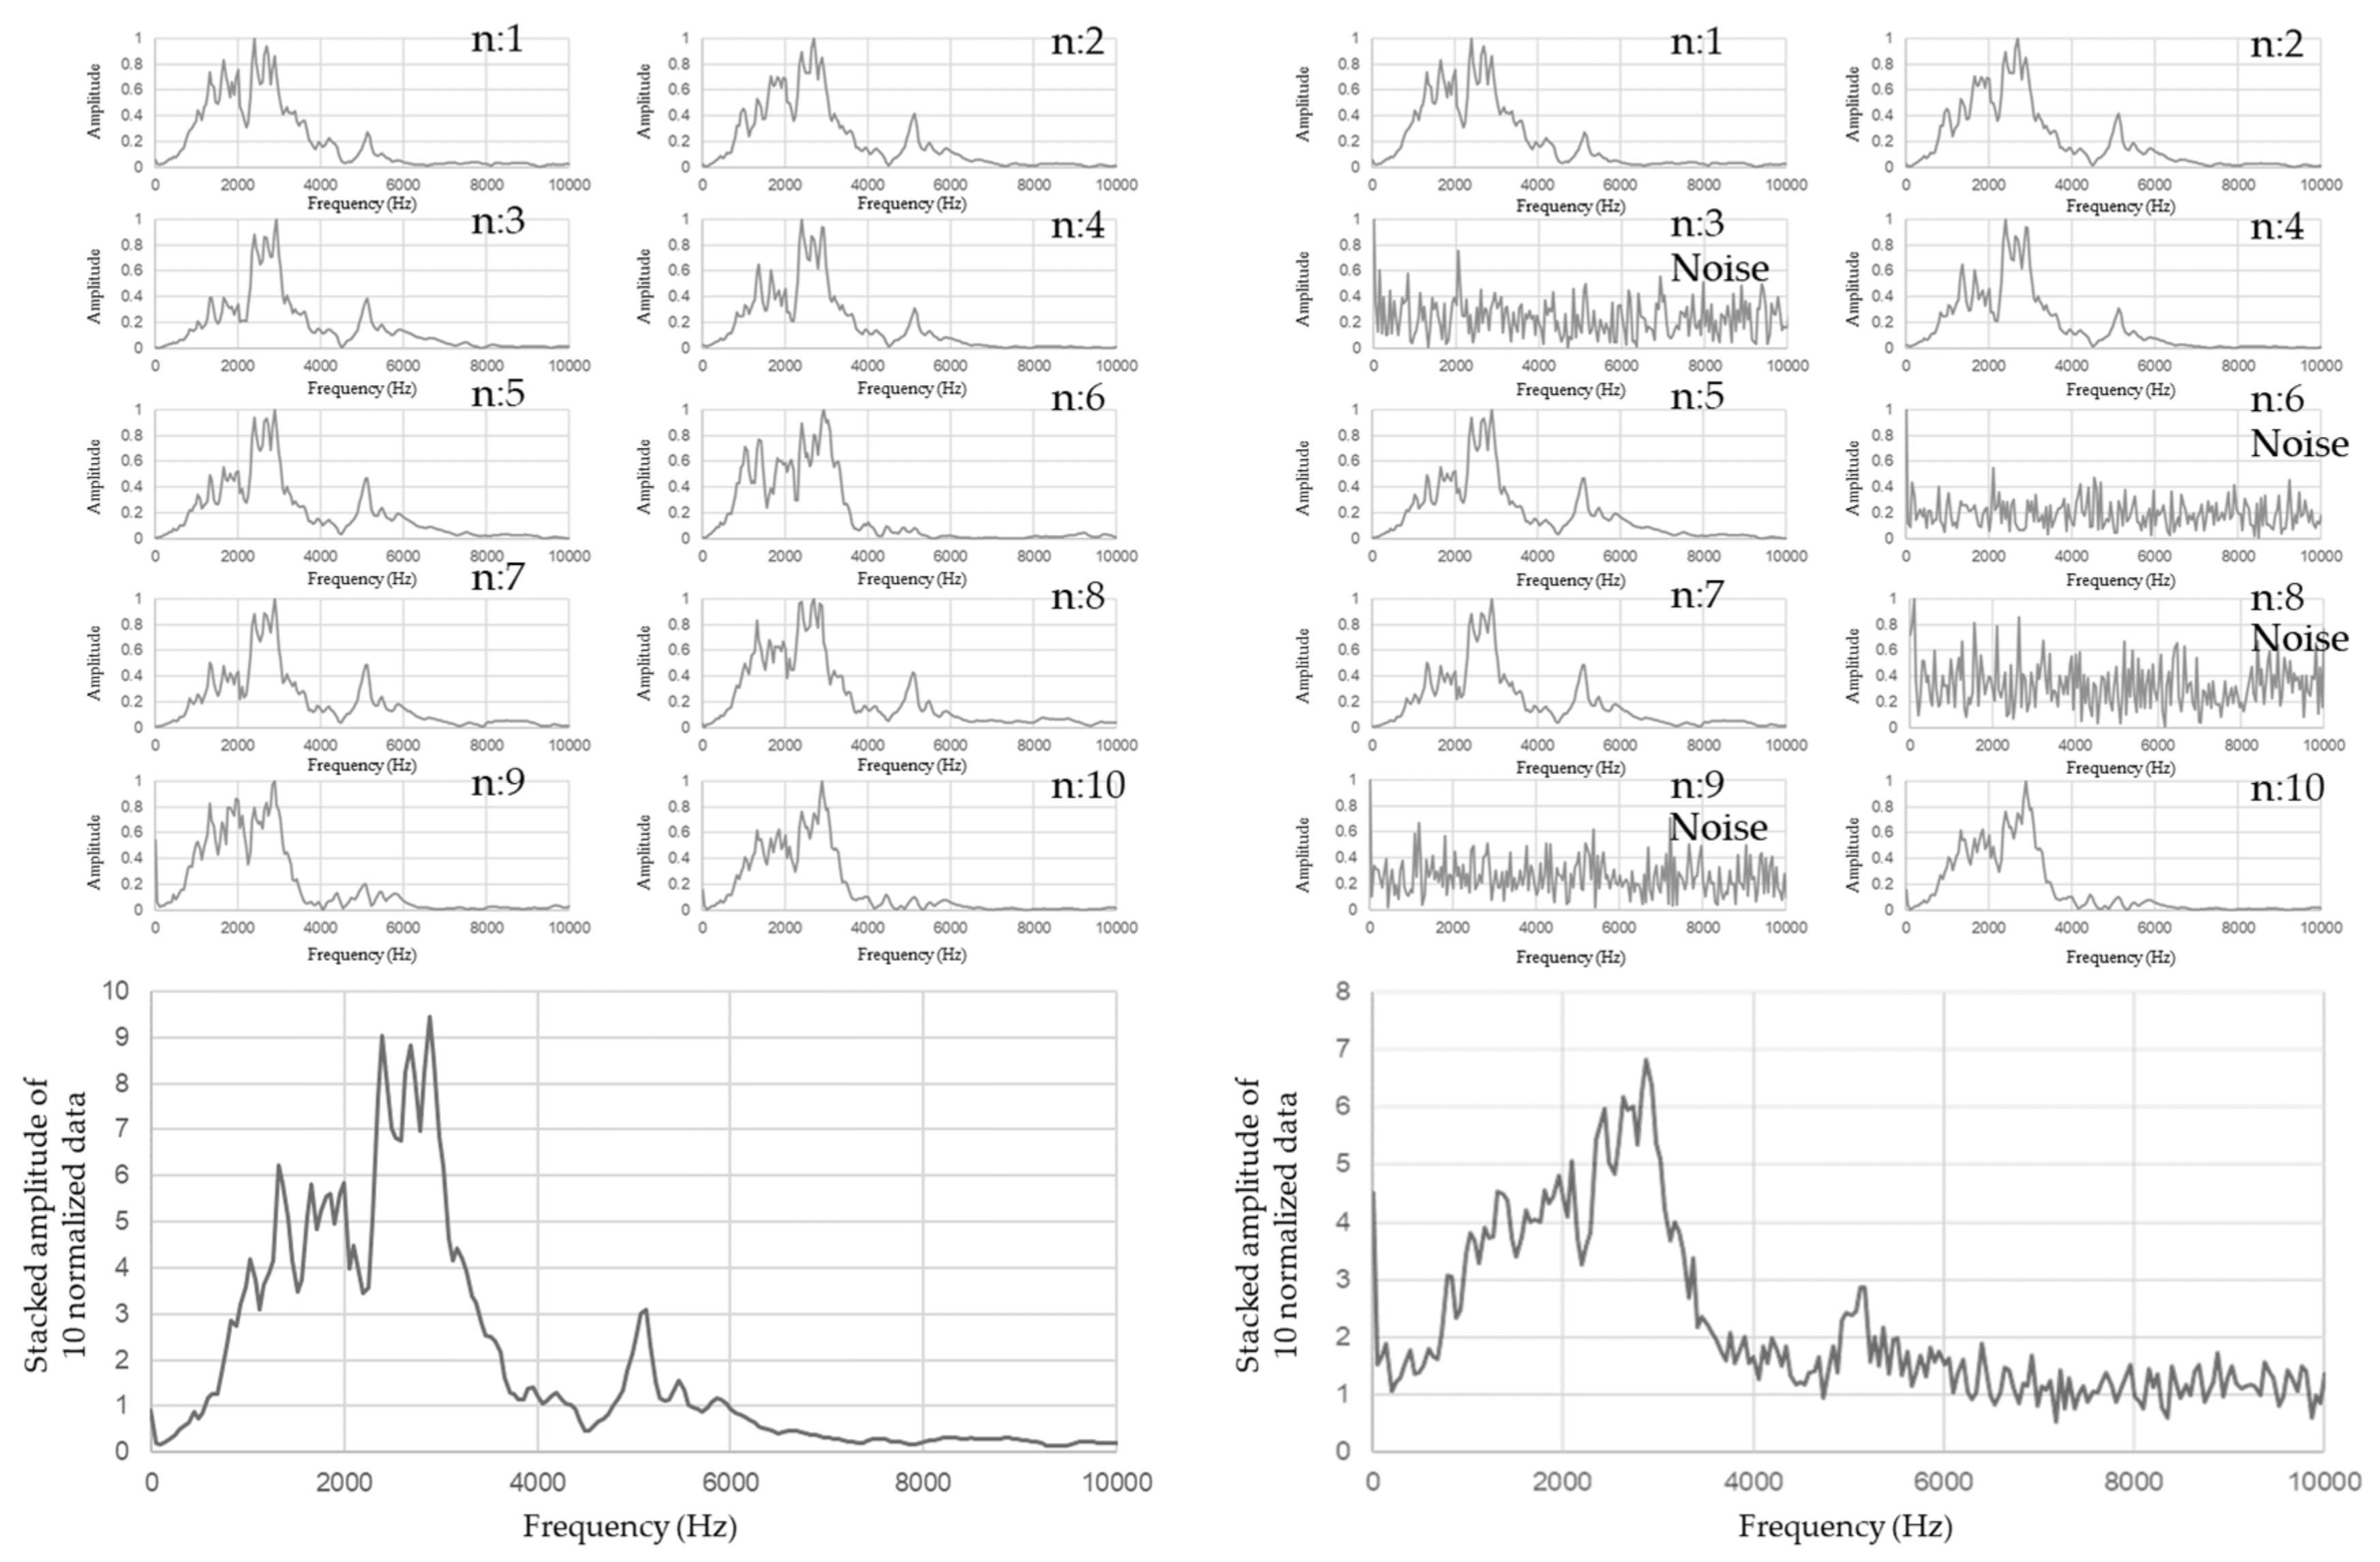
Figure 8.
FFT signal data stacking procedure with/without each signal normalization procedure.
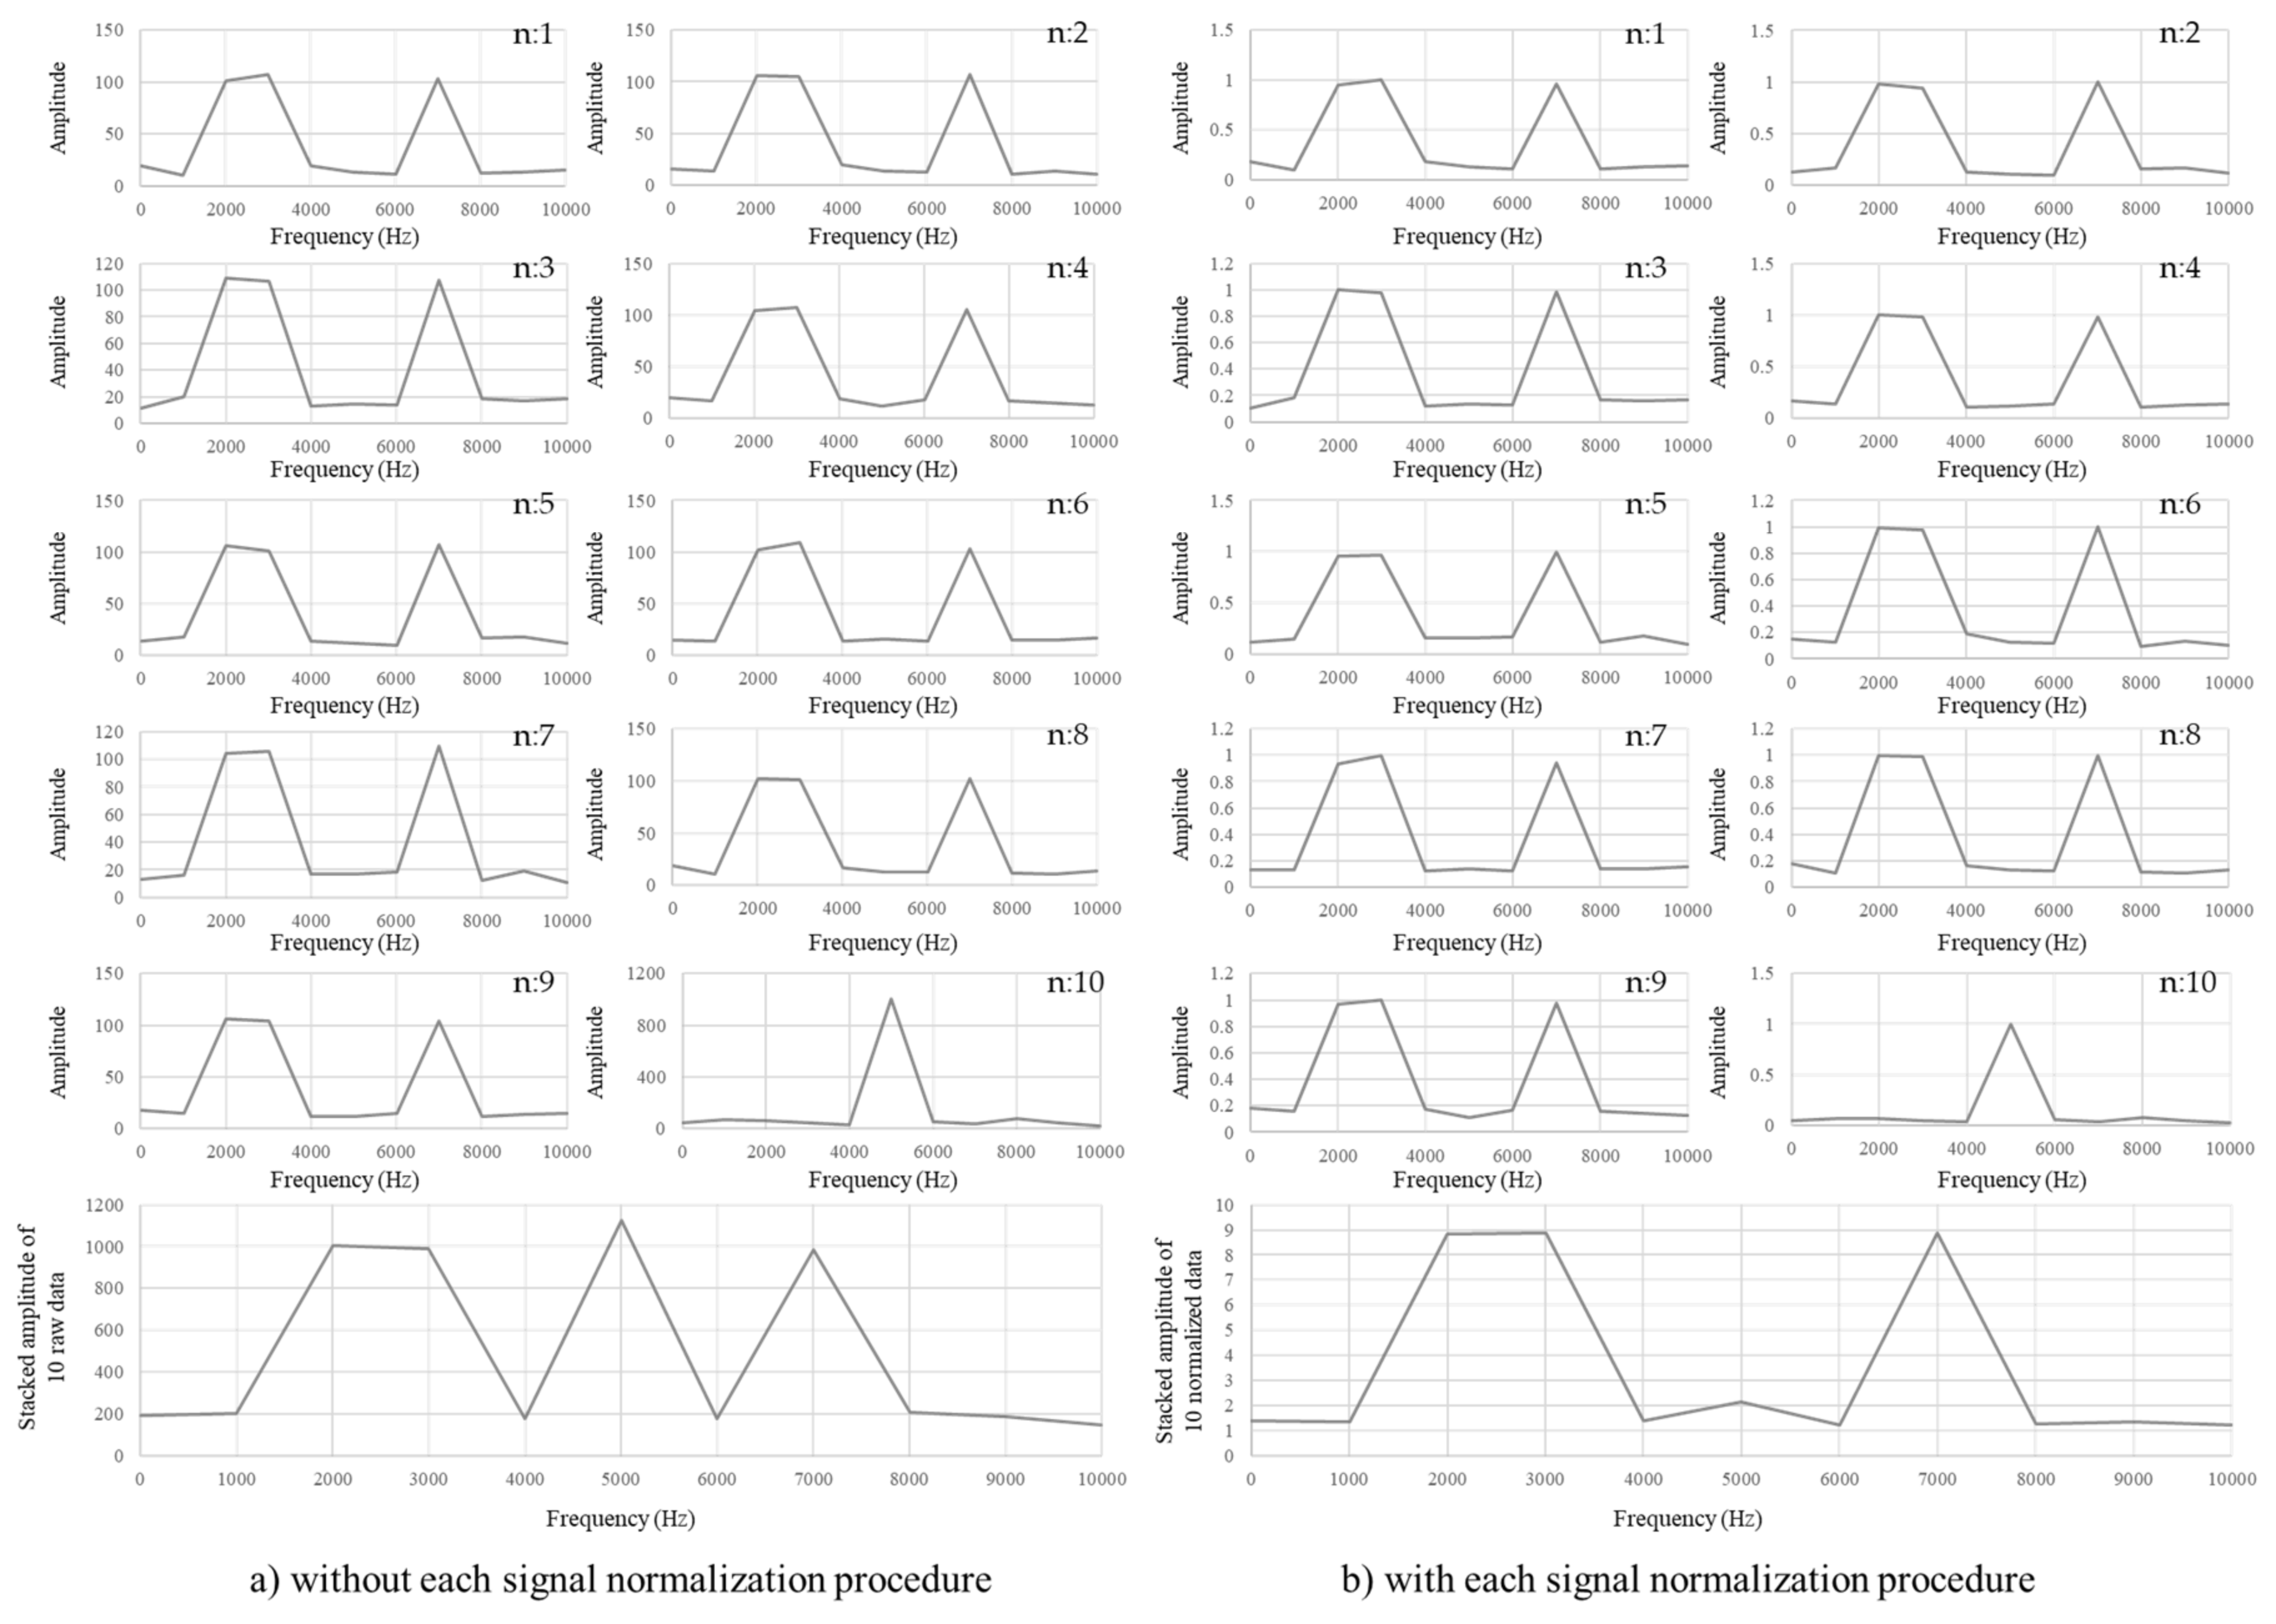
Figure 9.
Visual rack inspection procedure.
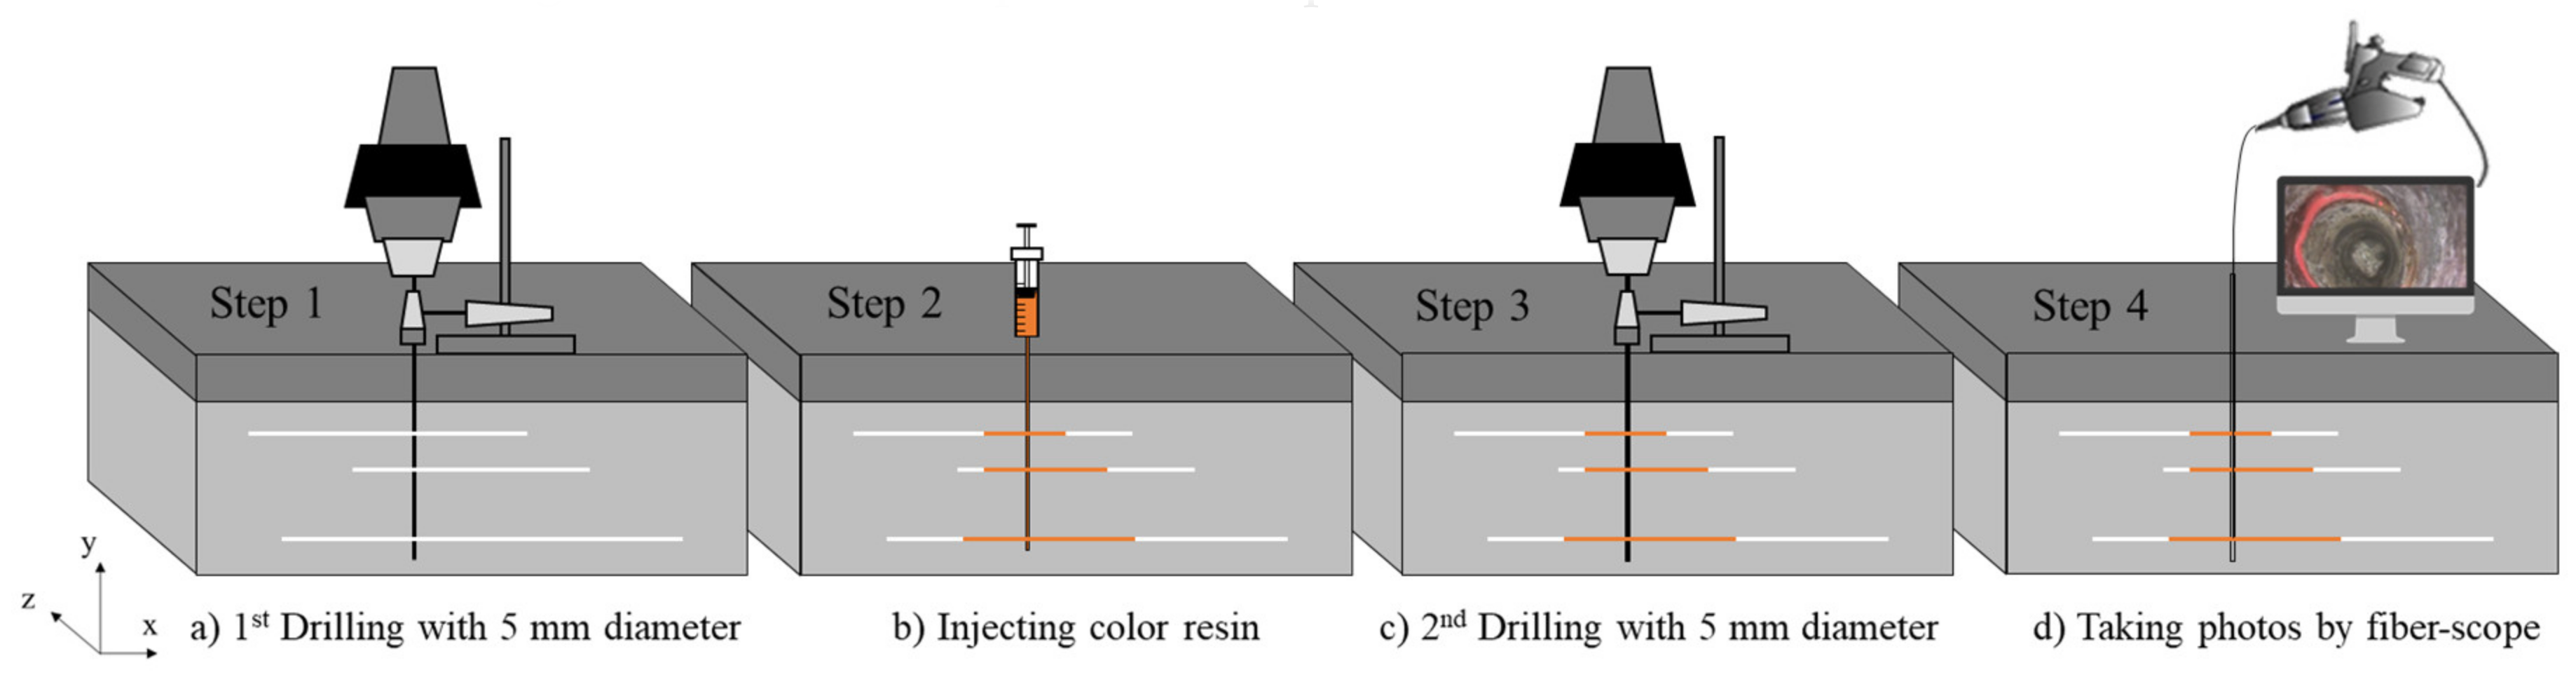
Figure 10.
Cracks filled with resin (a,b).
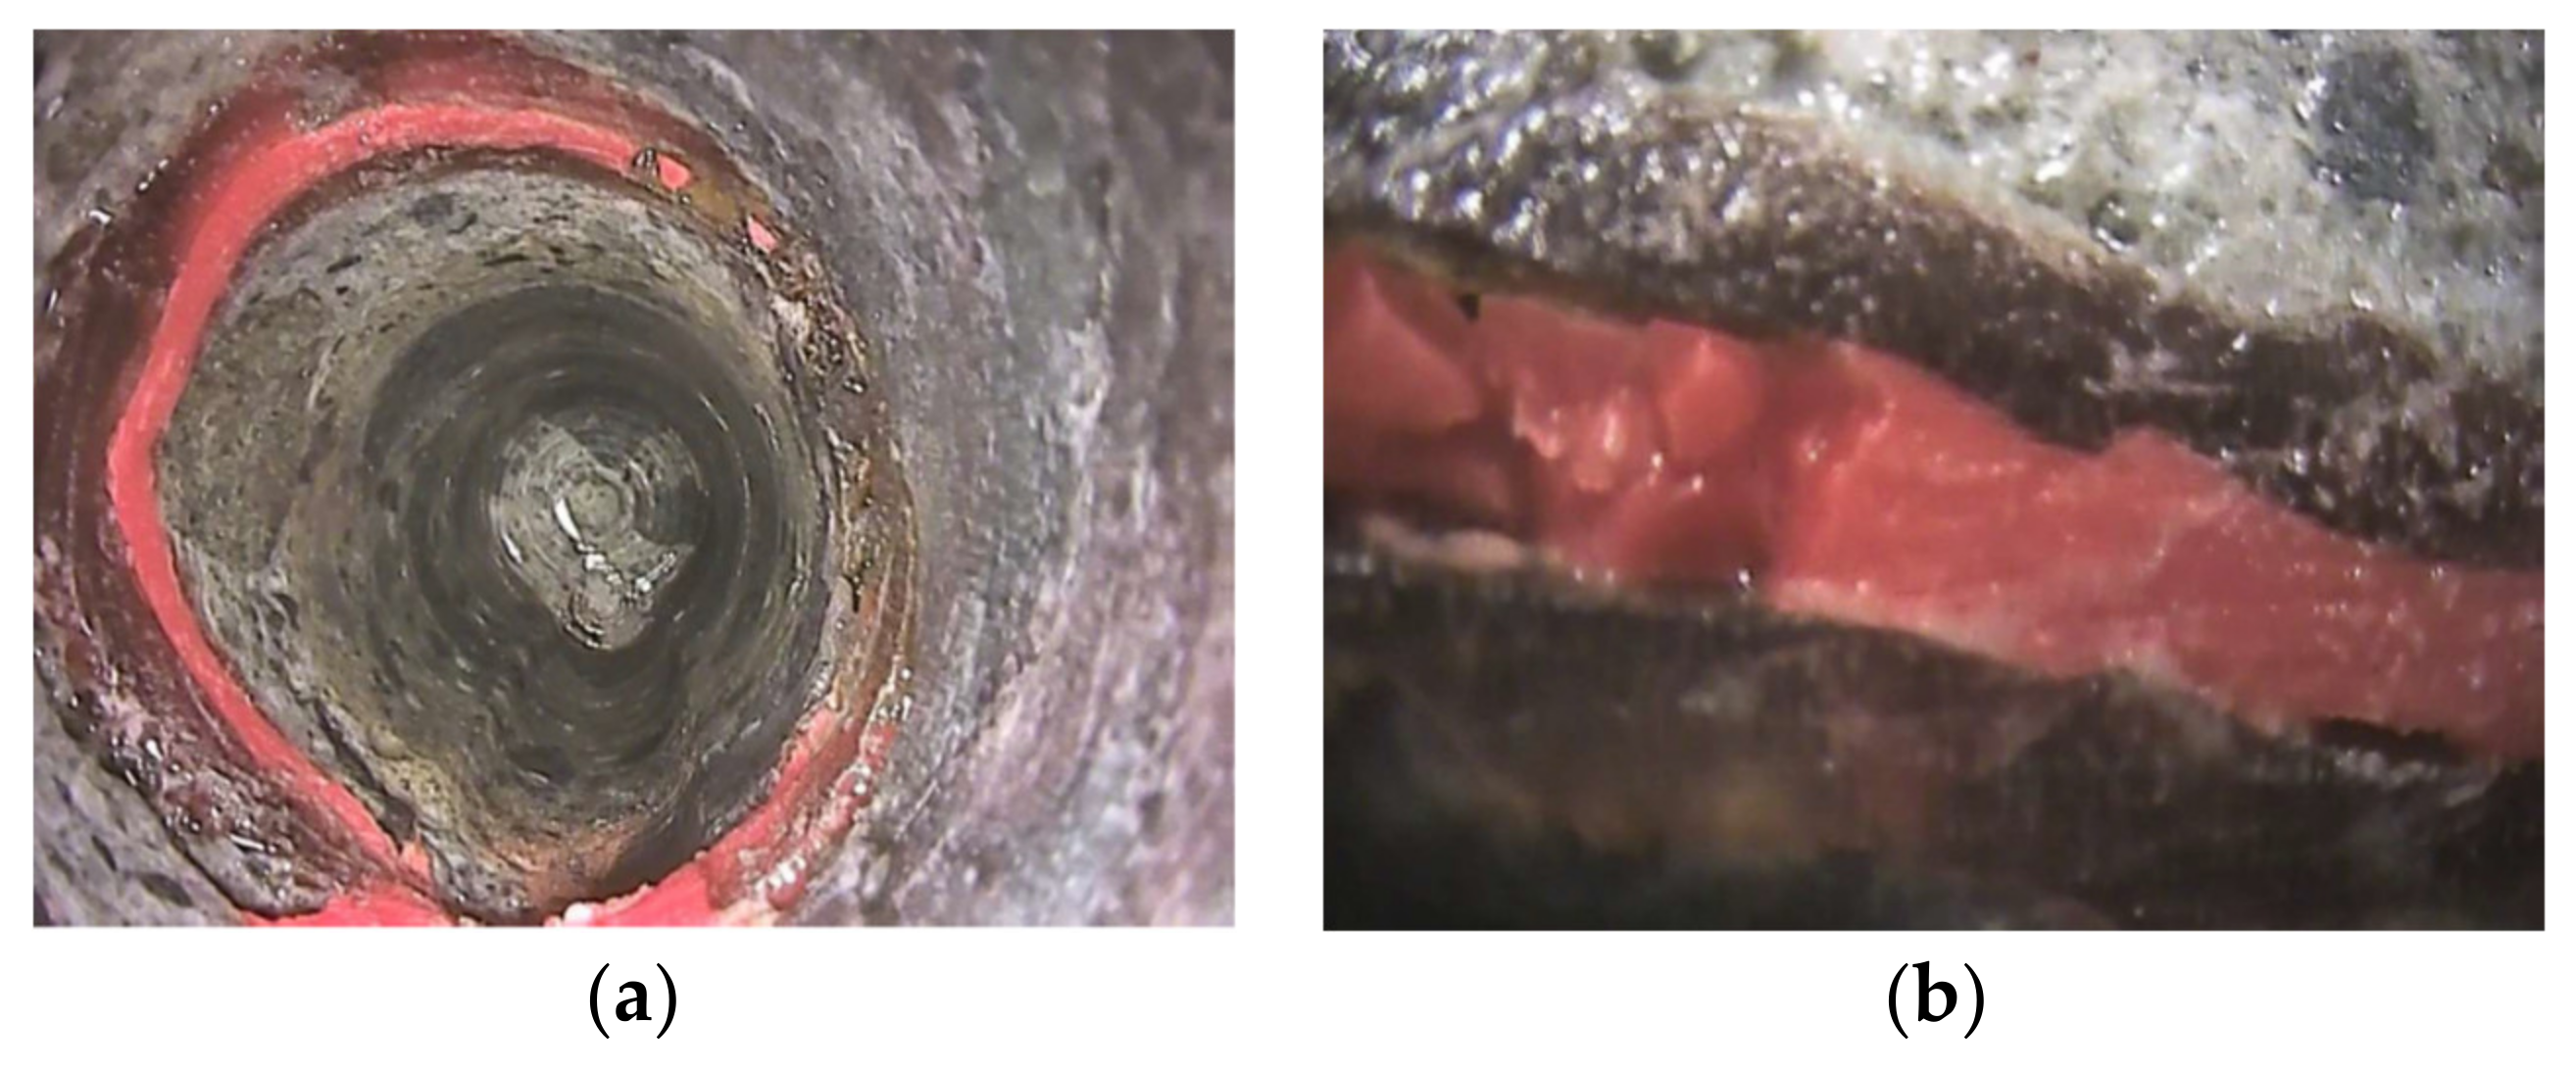
Figure 11.
3D SIBIE result at intact part.
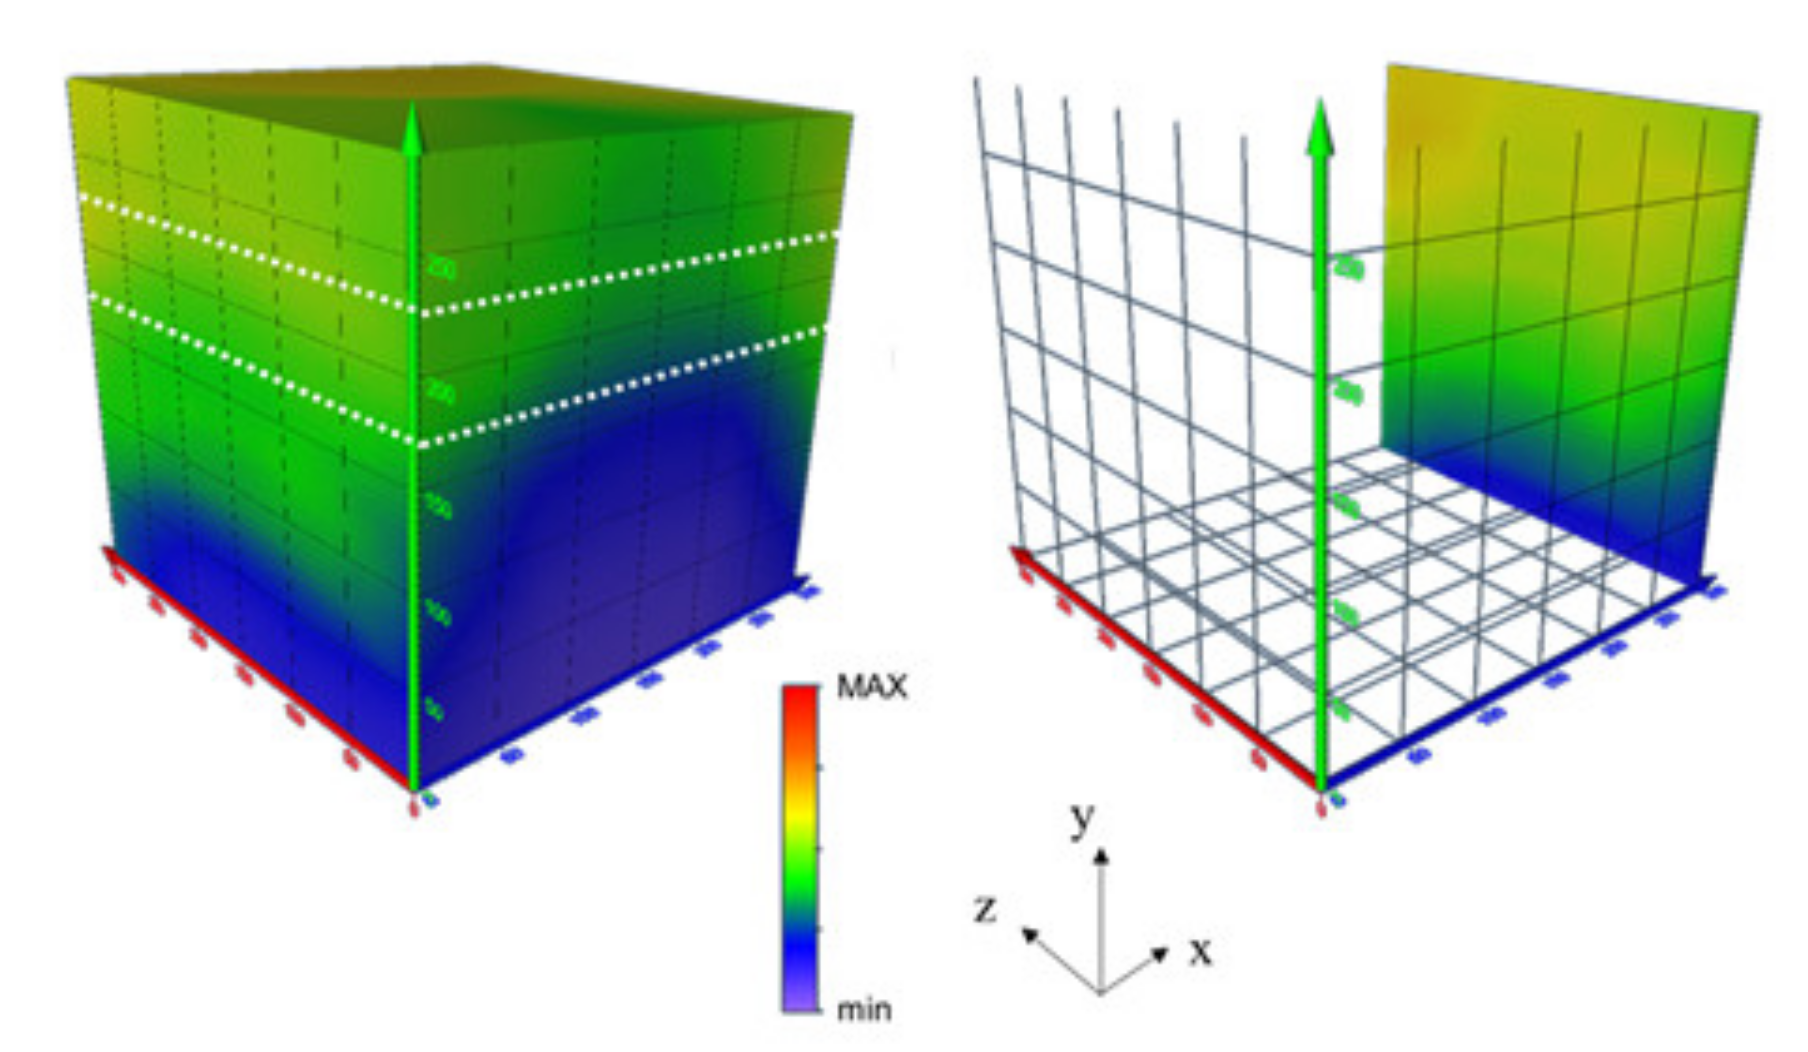
Figure 12.
3D SIBIE result at damaged part.

Figure 13.
Concrete specimens and sensor locations (with defect and with no defect (intact)).
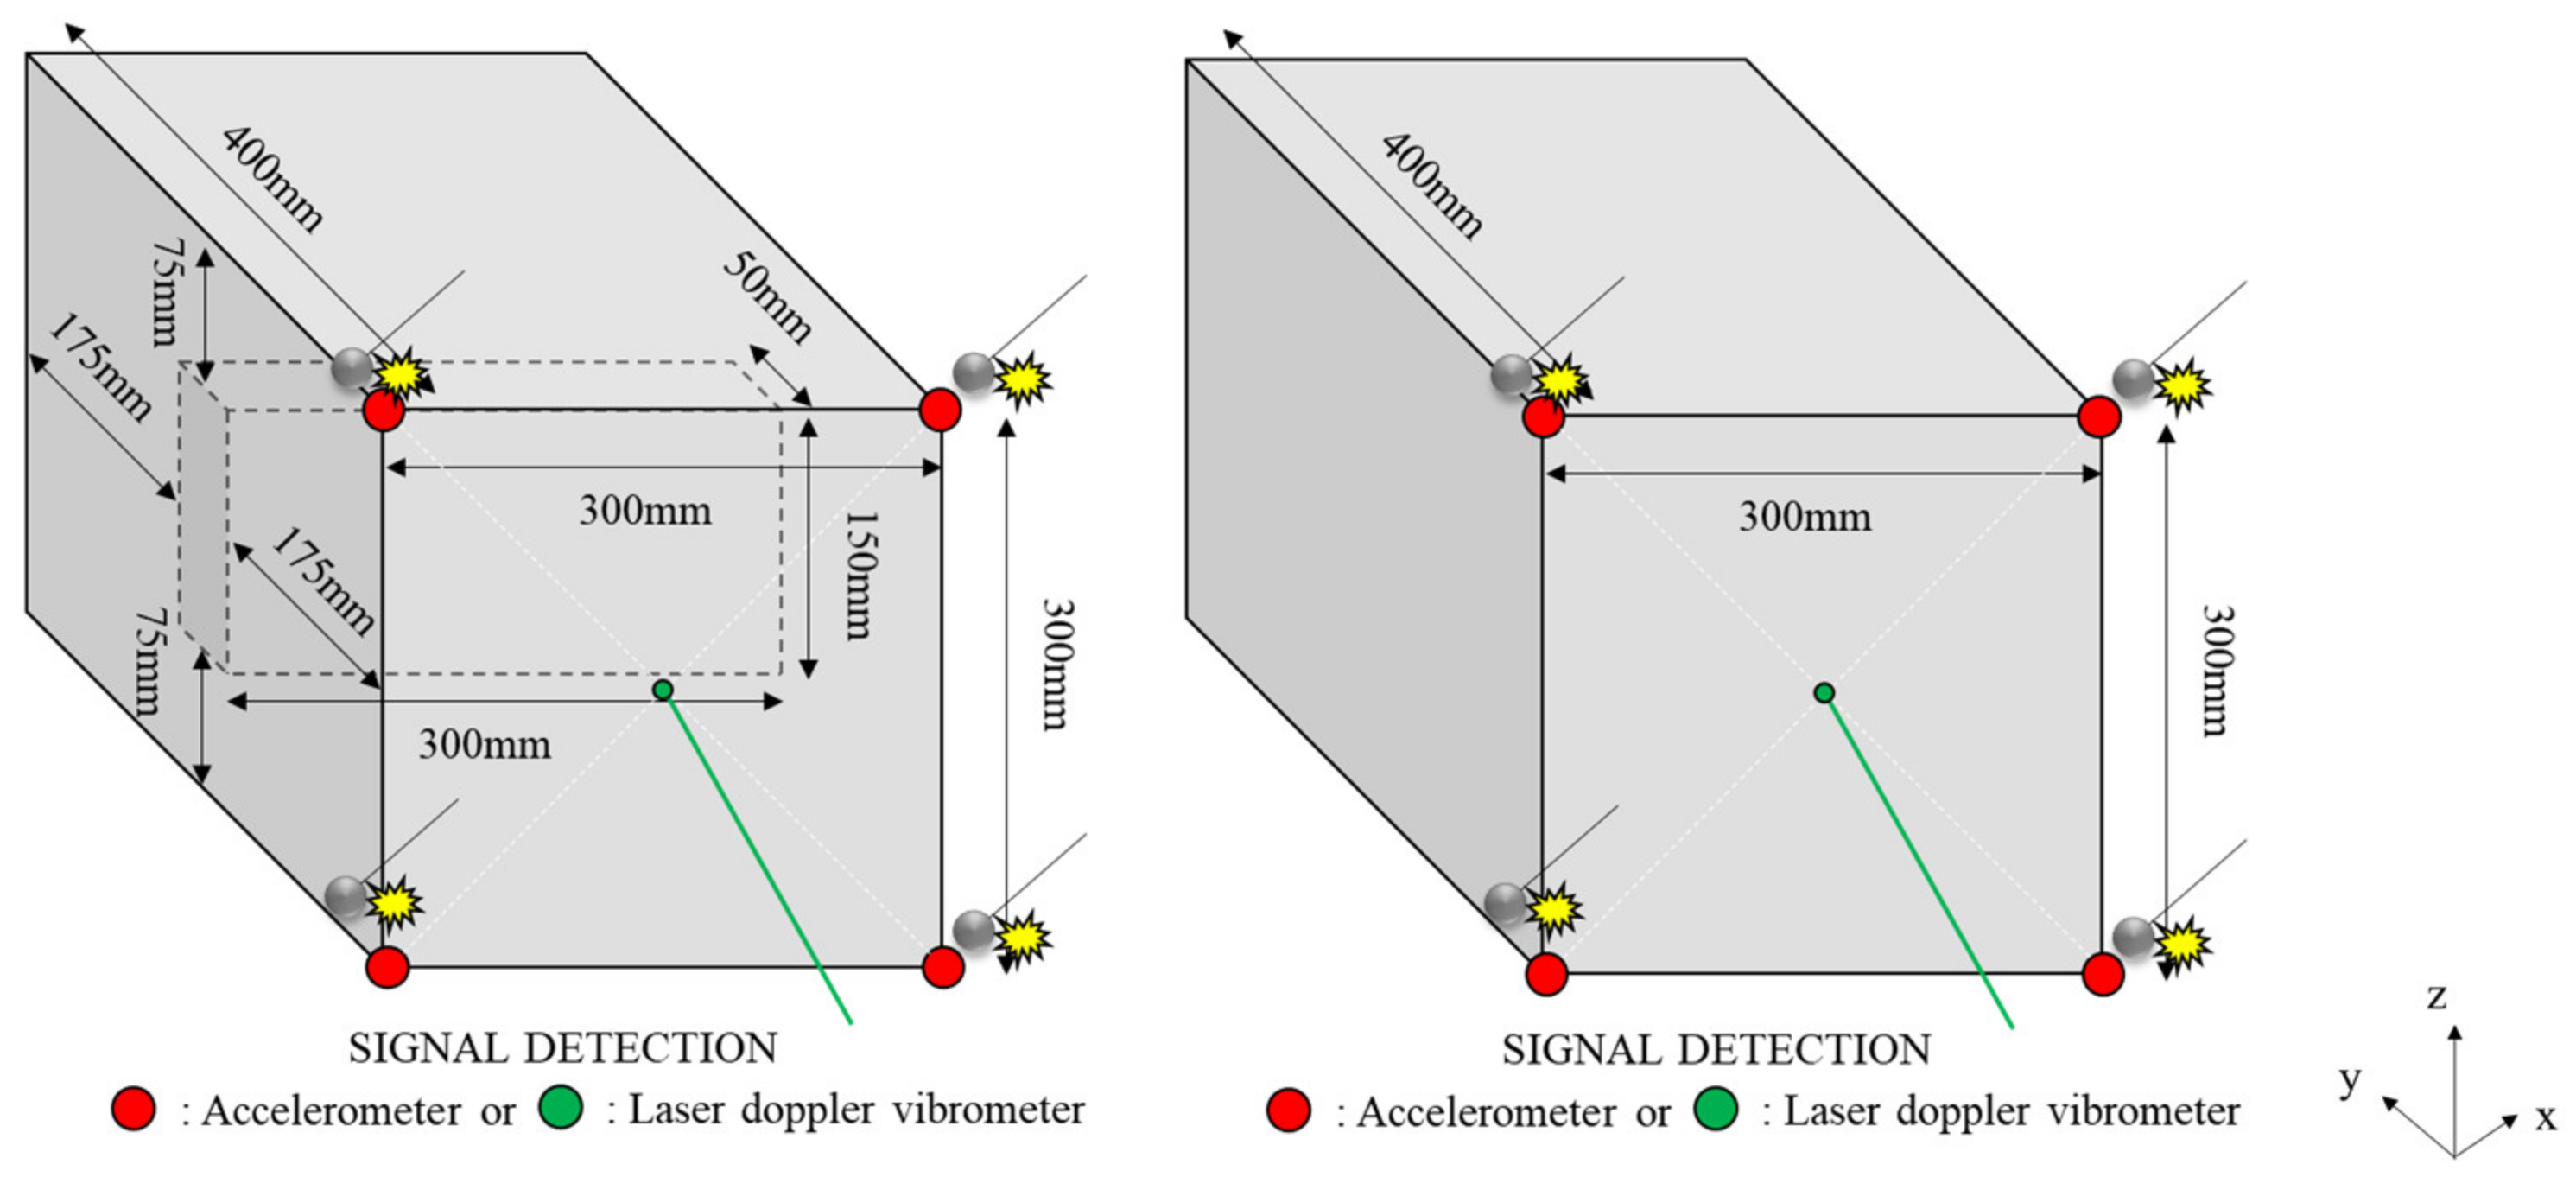
Figure 14.
Result of 3D SIBIE procedure for damage-simulated concrete specimen.

Figure 15.
Result of 3D SIBIE procedure for intact concrete specimen.
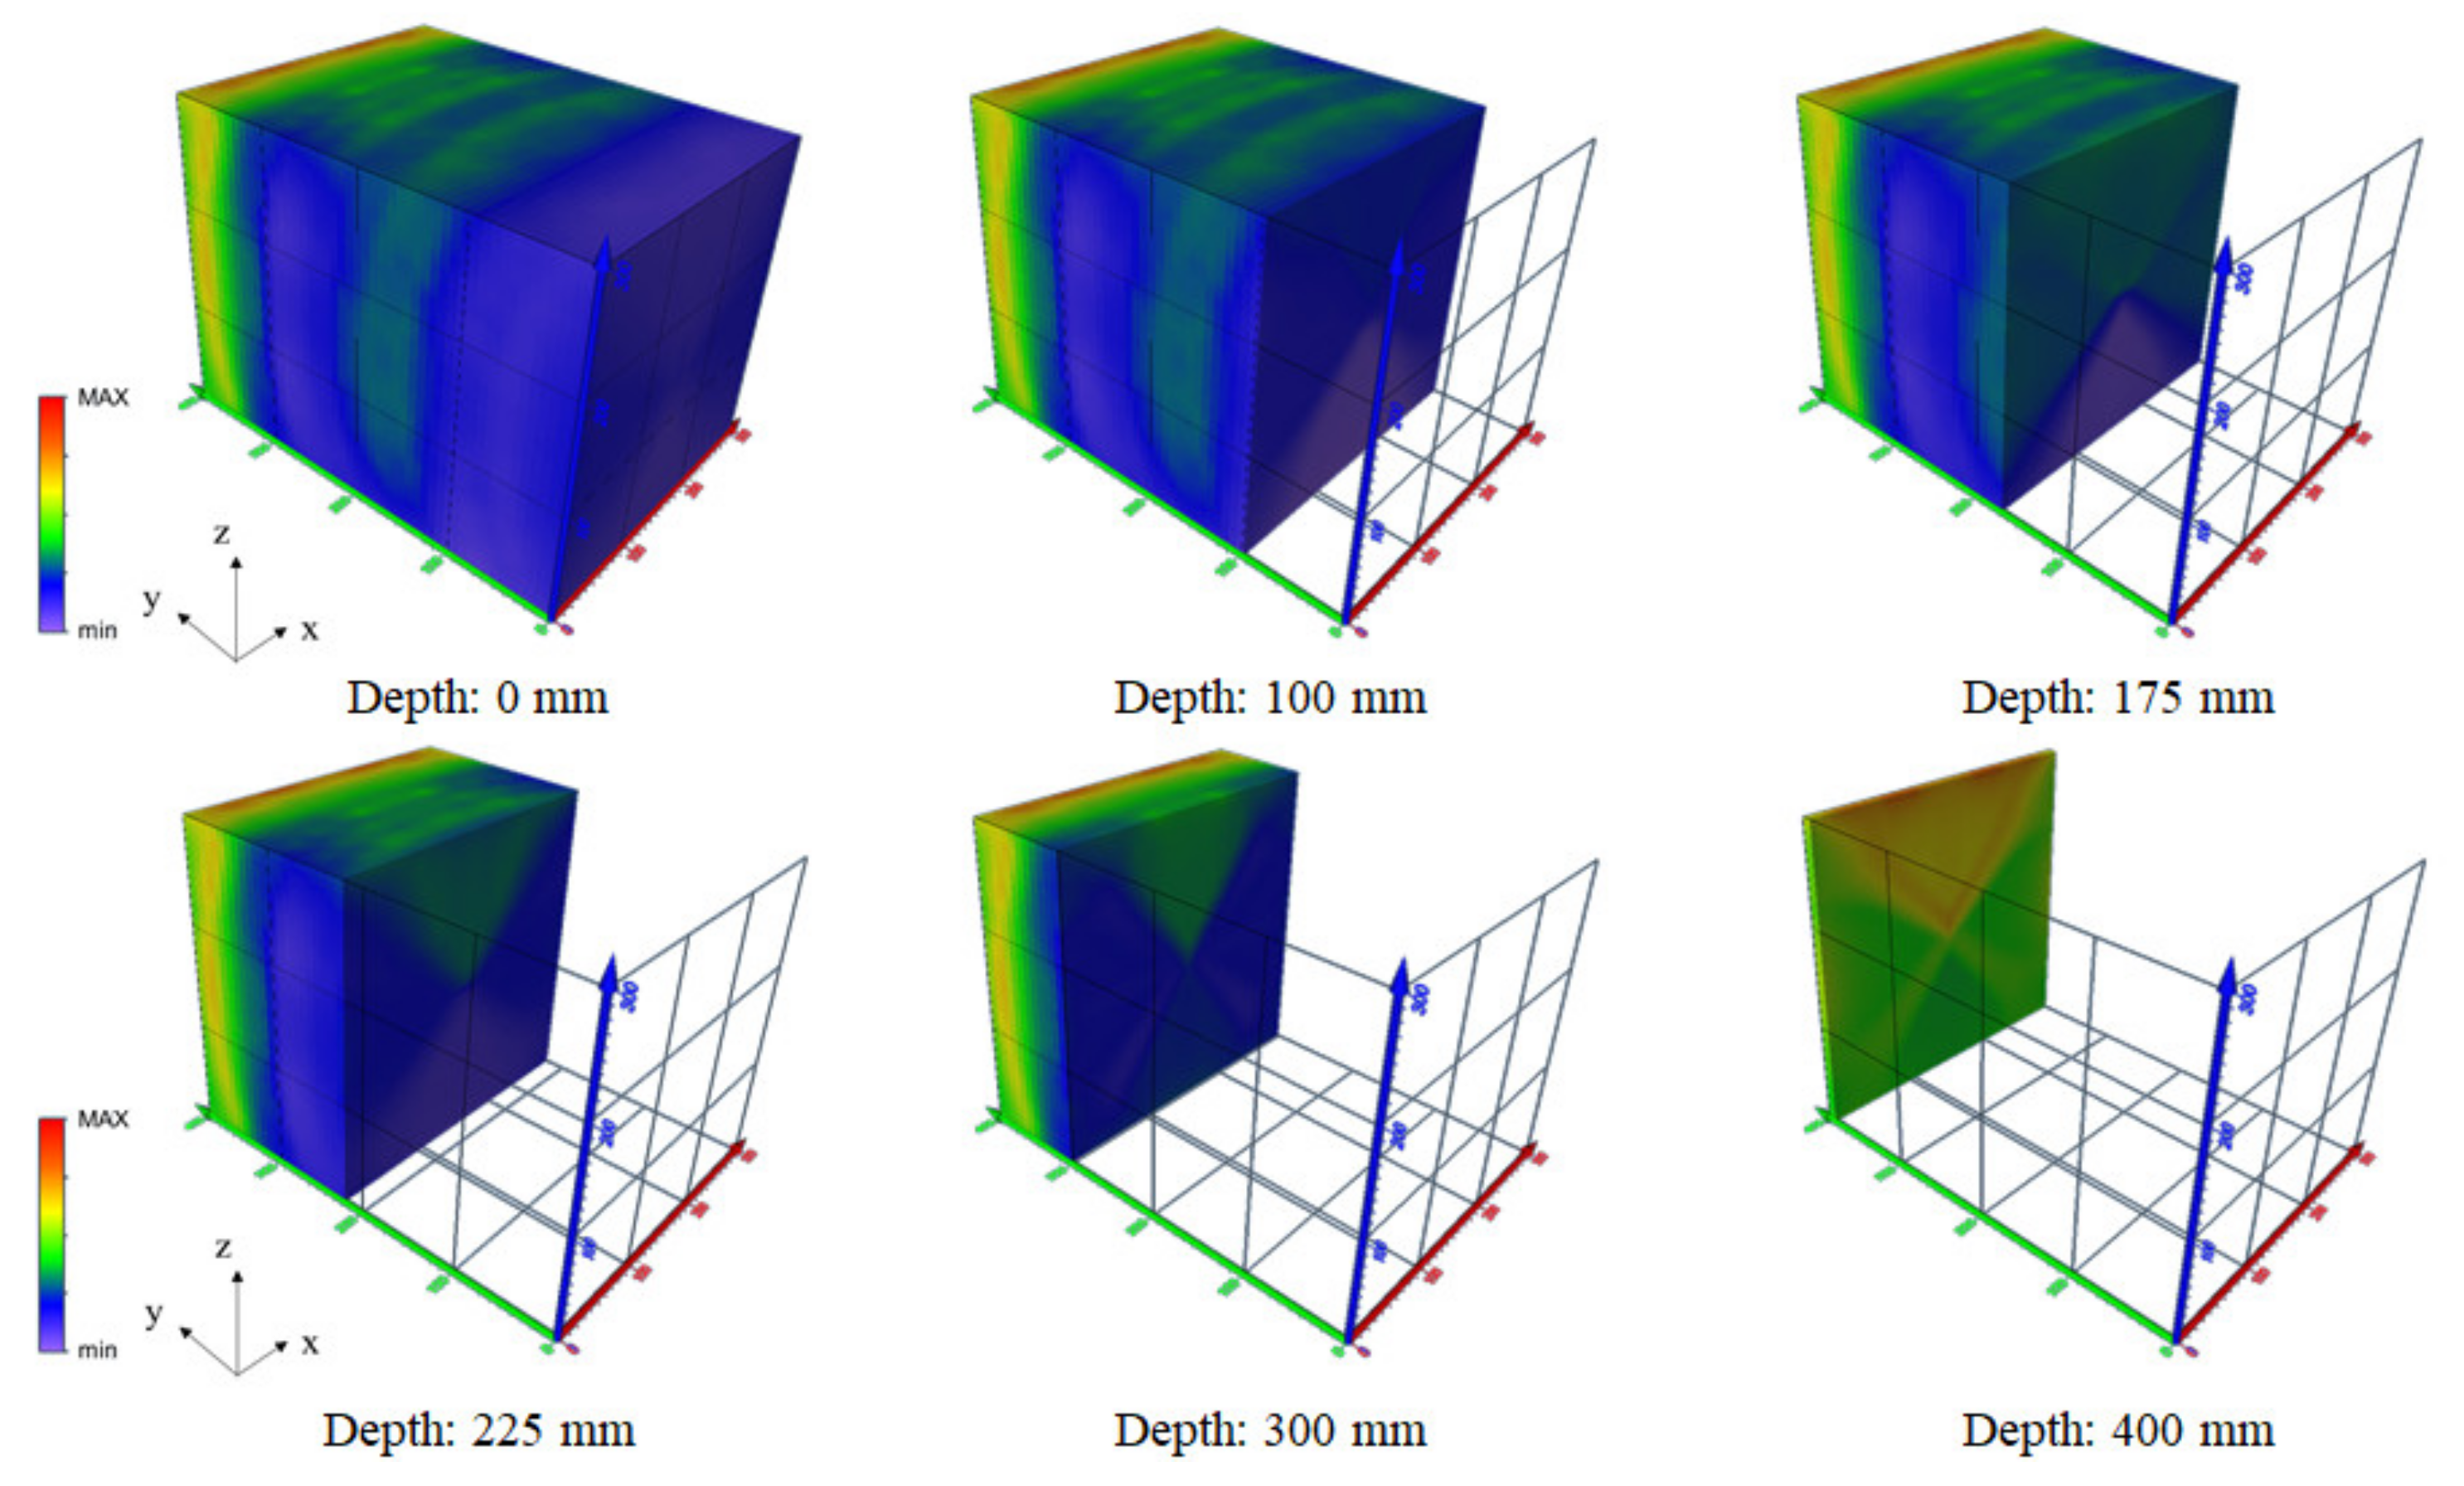
Figure 16.
3D SIBIE result with LDV (Laser Doppler Vibrometer) signal detection for damage-simulated concrete specimen.
Figure 16.
3D SIBIE result with LDV (Laser Doppler Vibrometer) signal detection for damage-simulated concrete specimen.
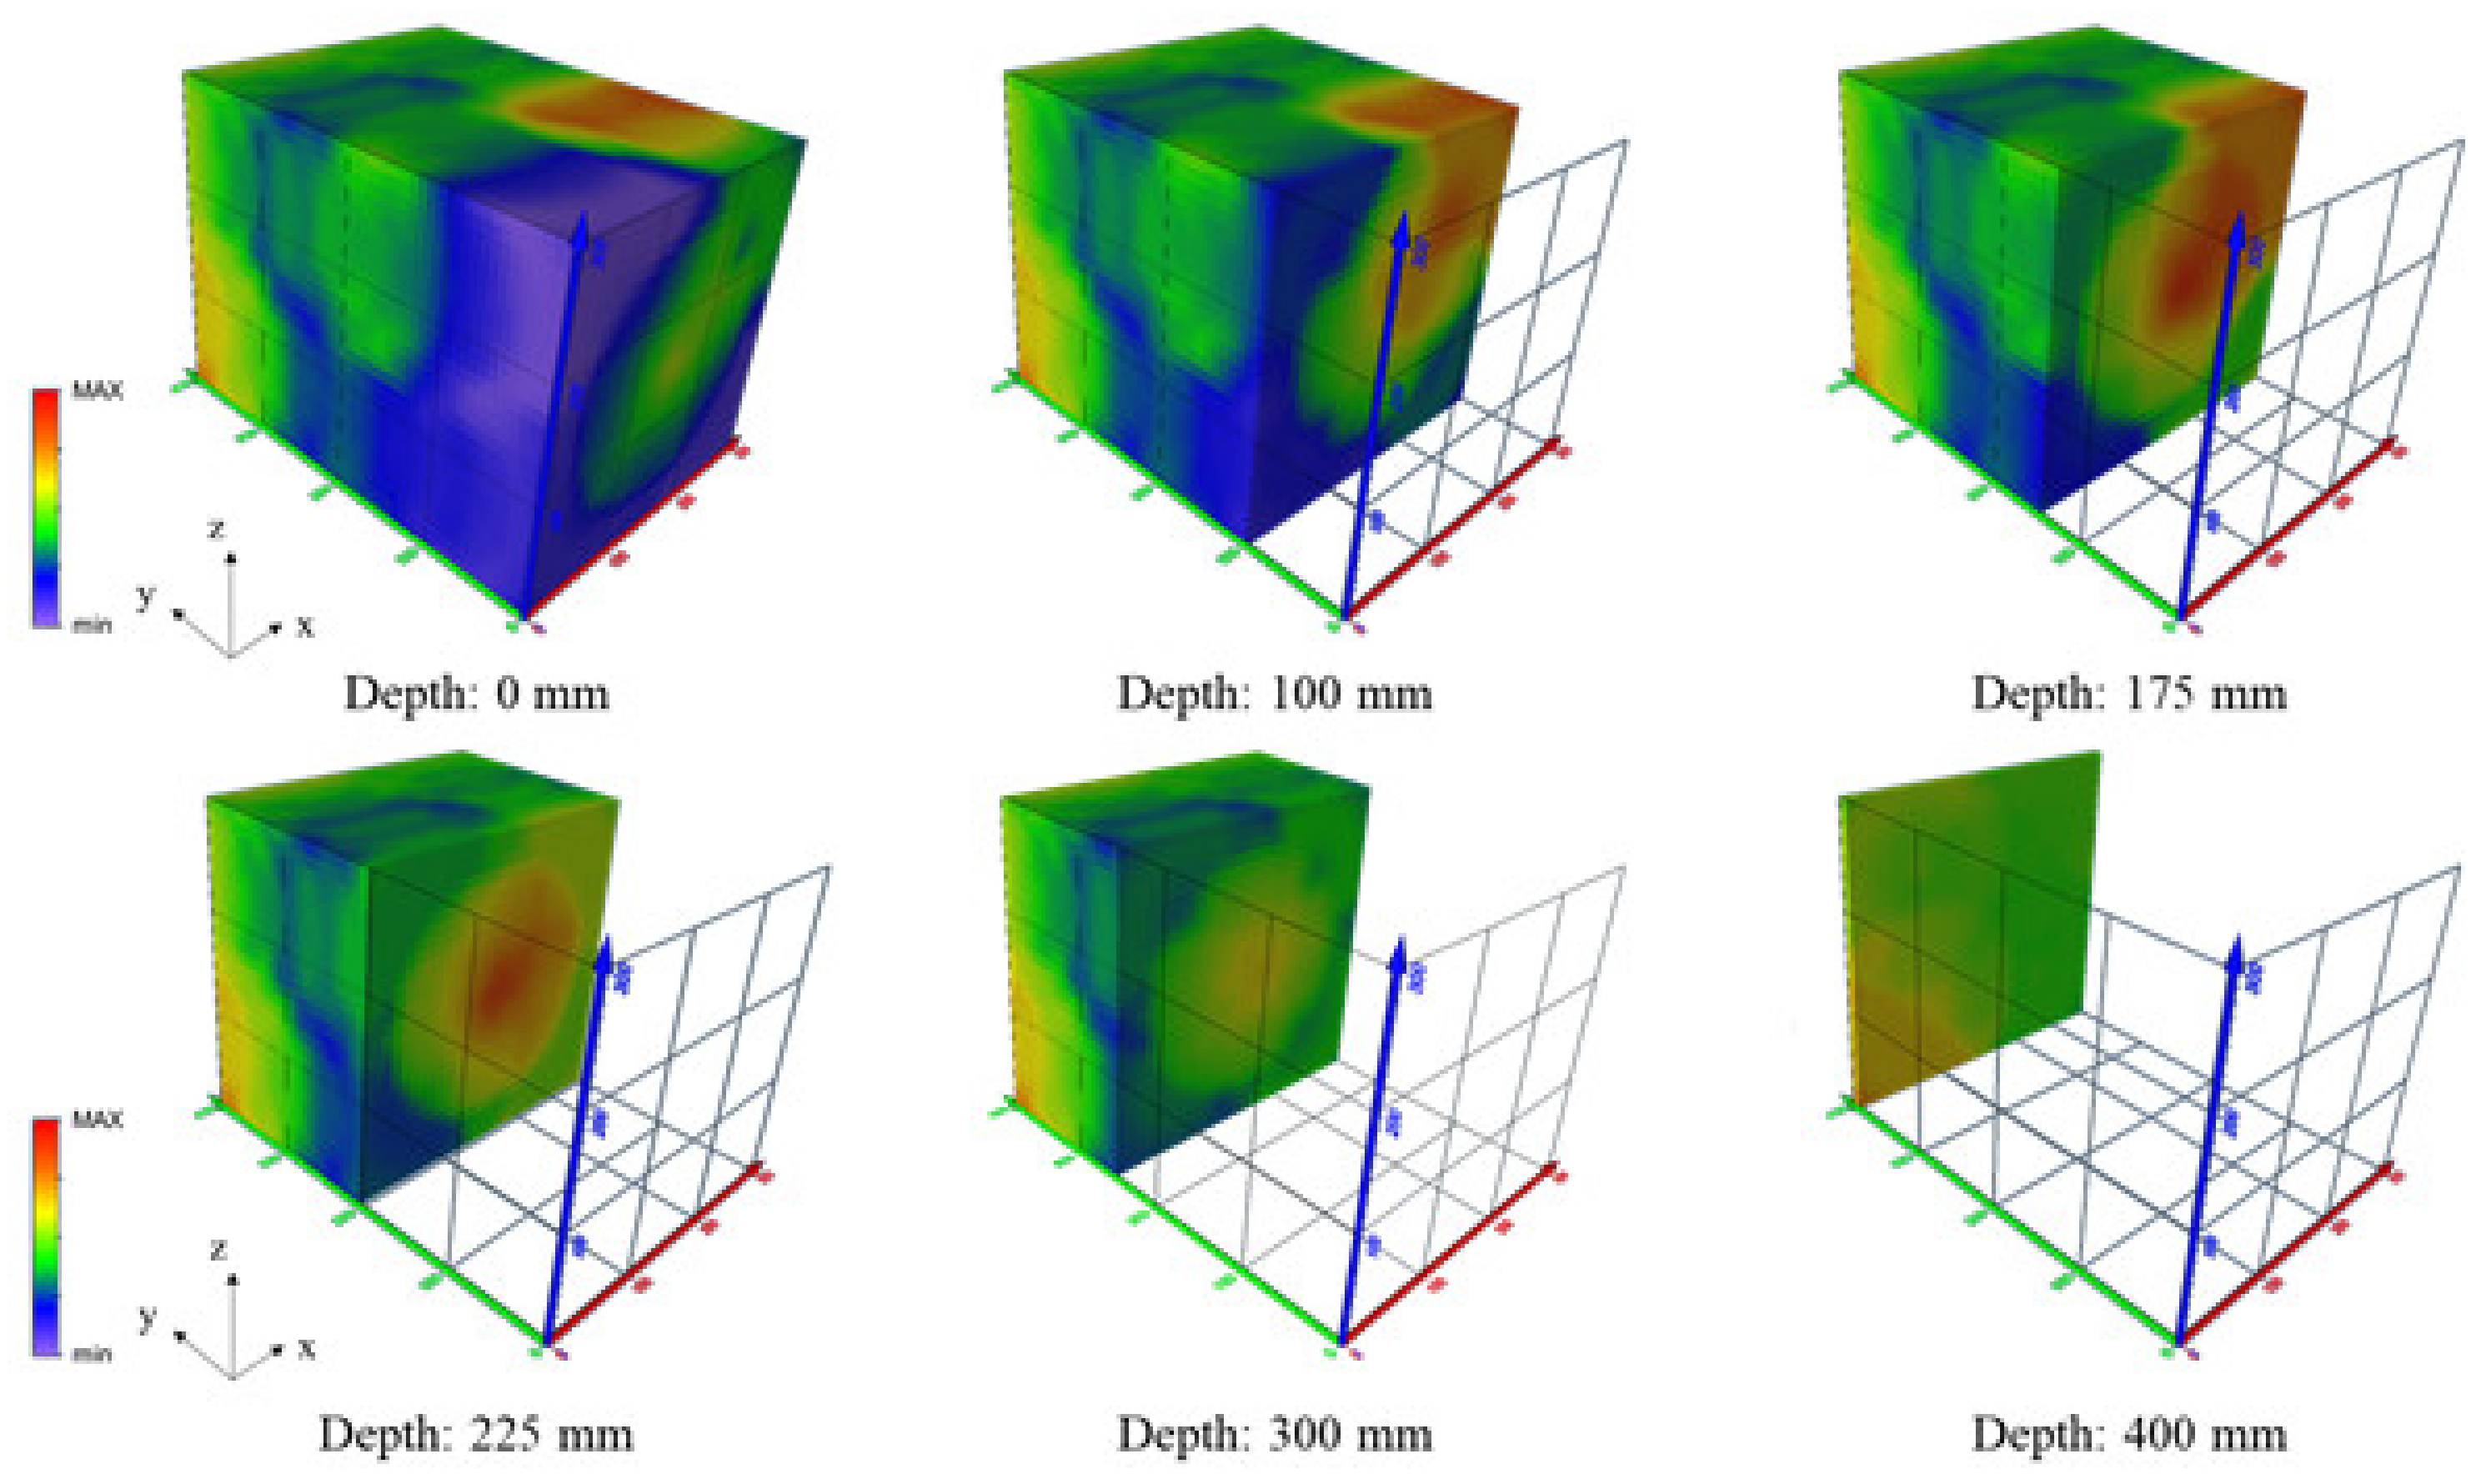
Figure 17.
3D SIBIE result with LDV signal detection for intact concrete specimen.
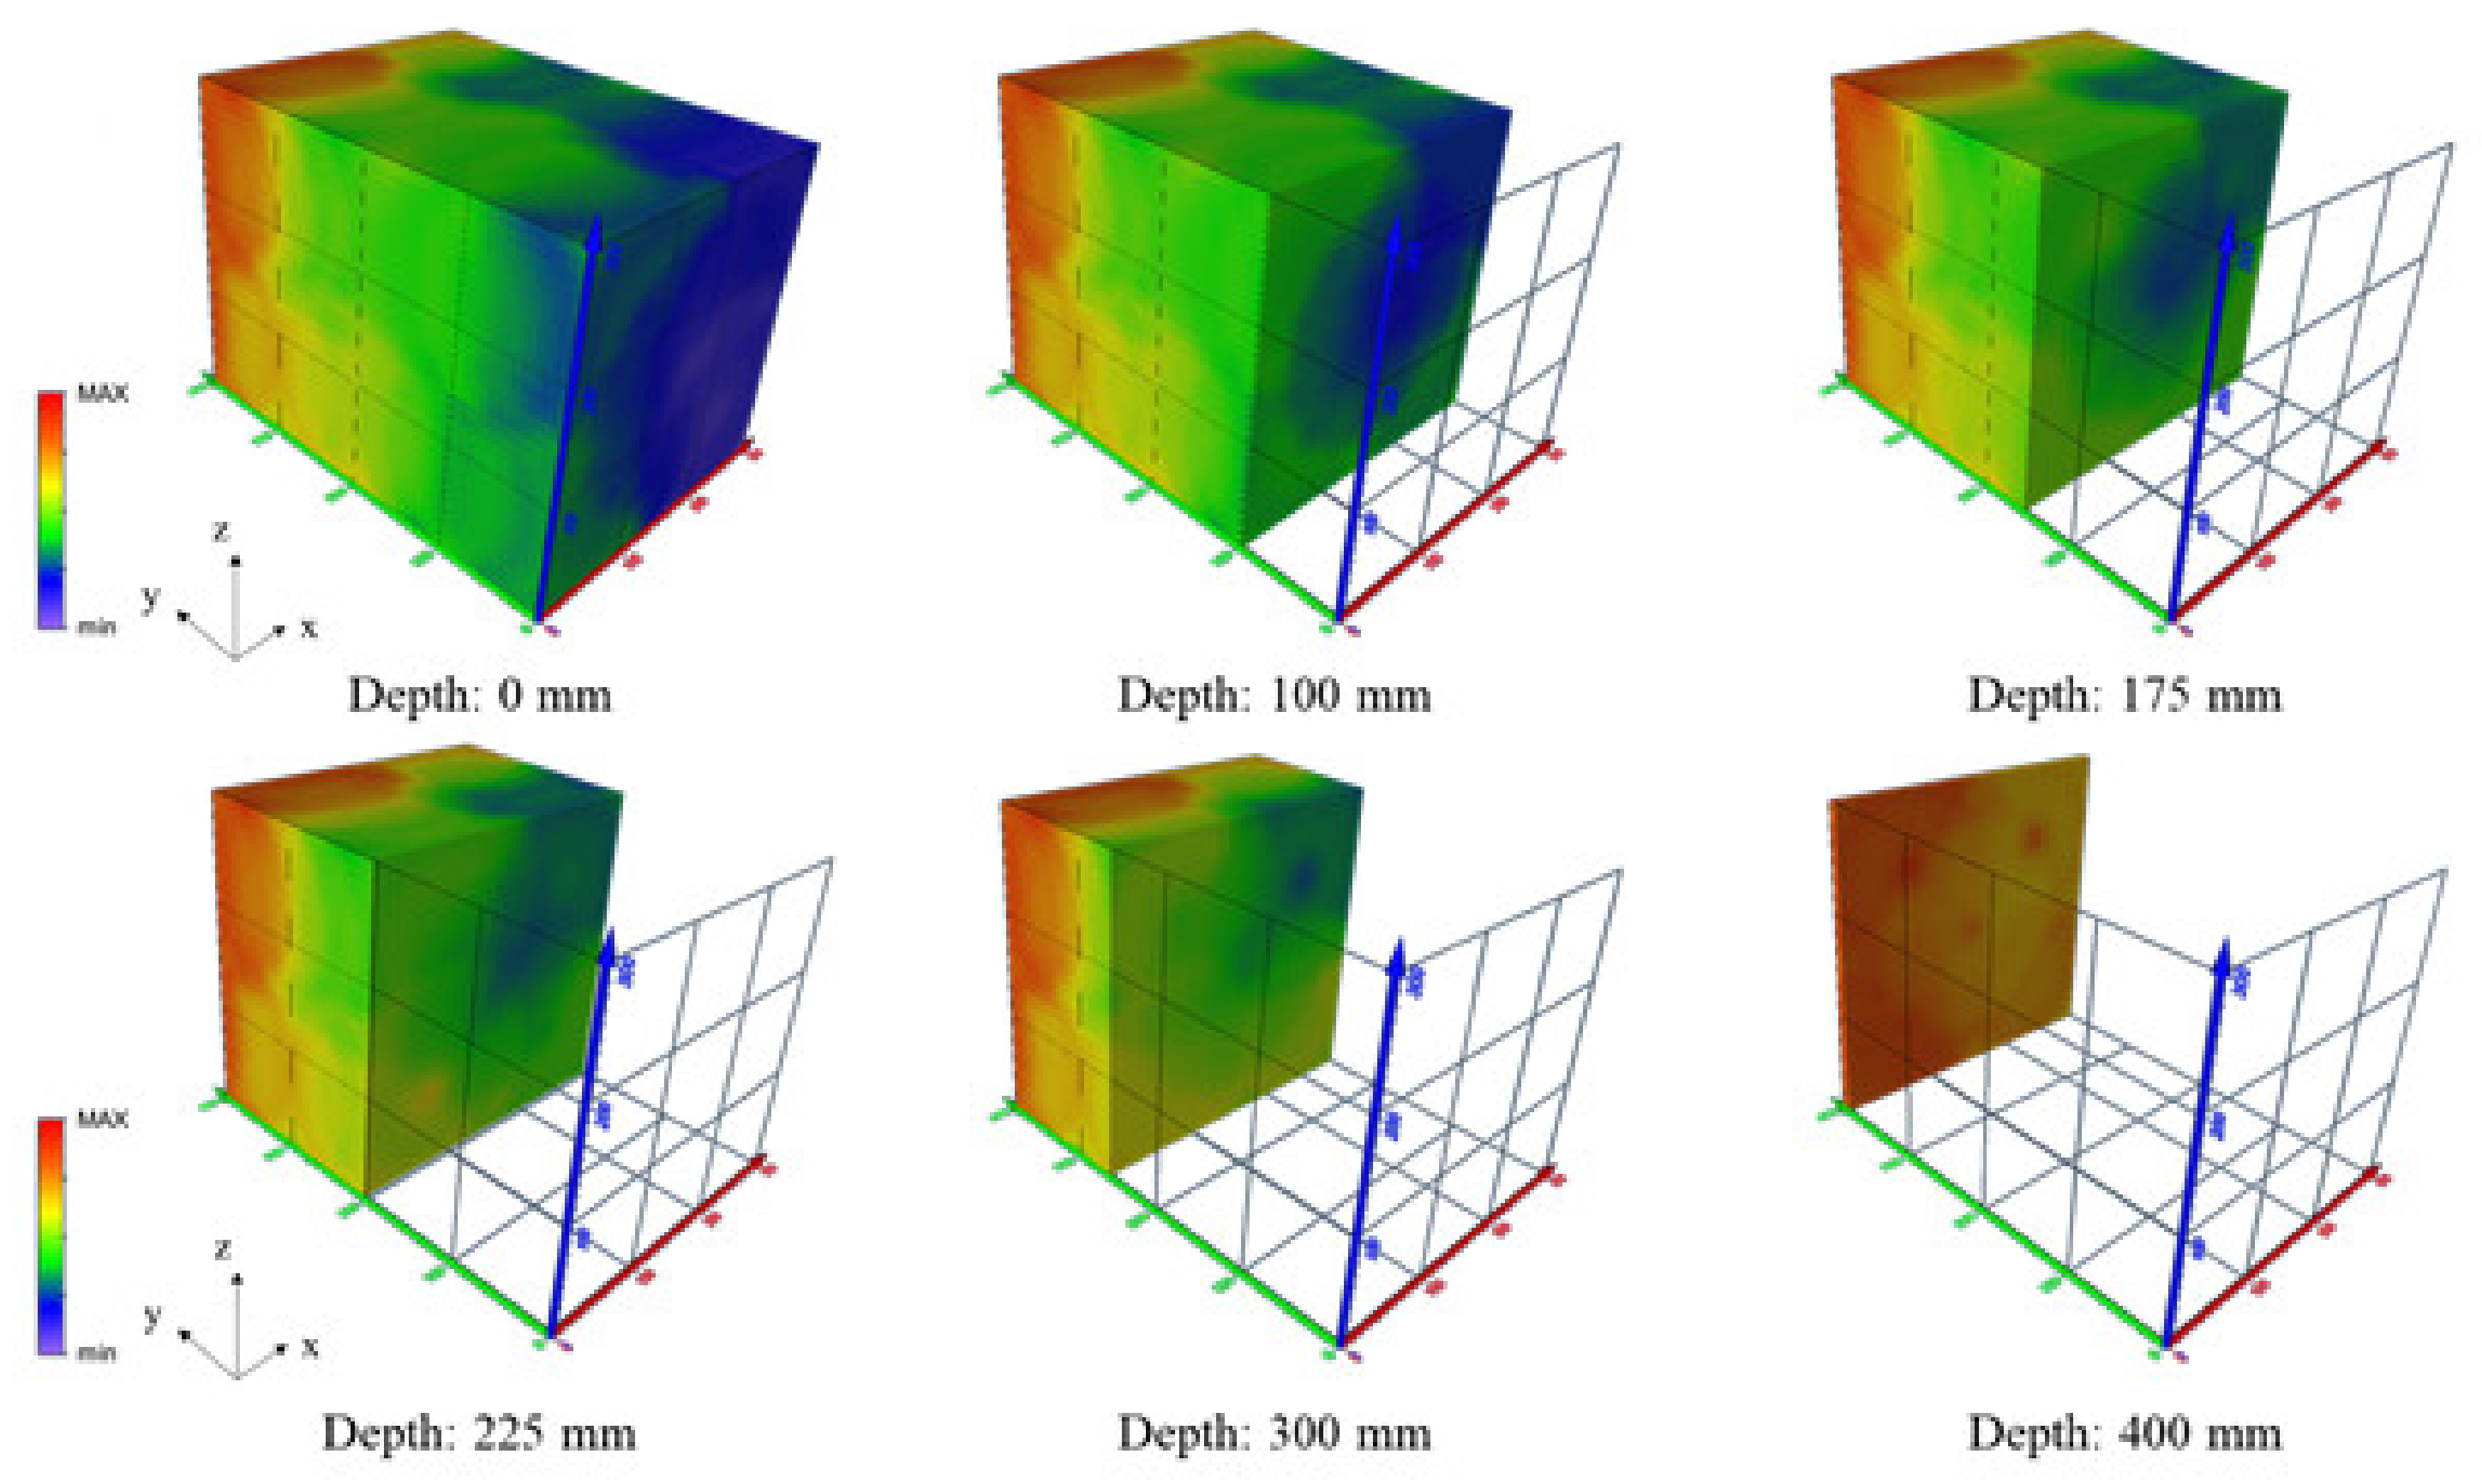
Figure 18.
Principle of PIT (Pile Integrity Test).
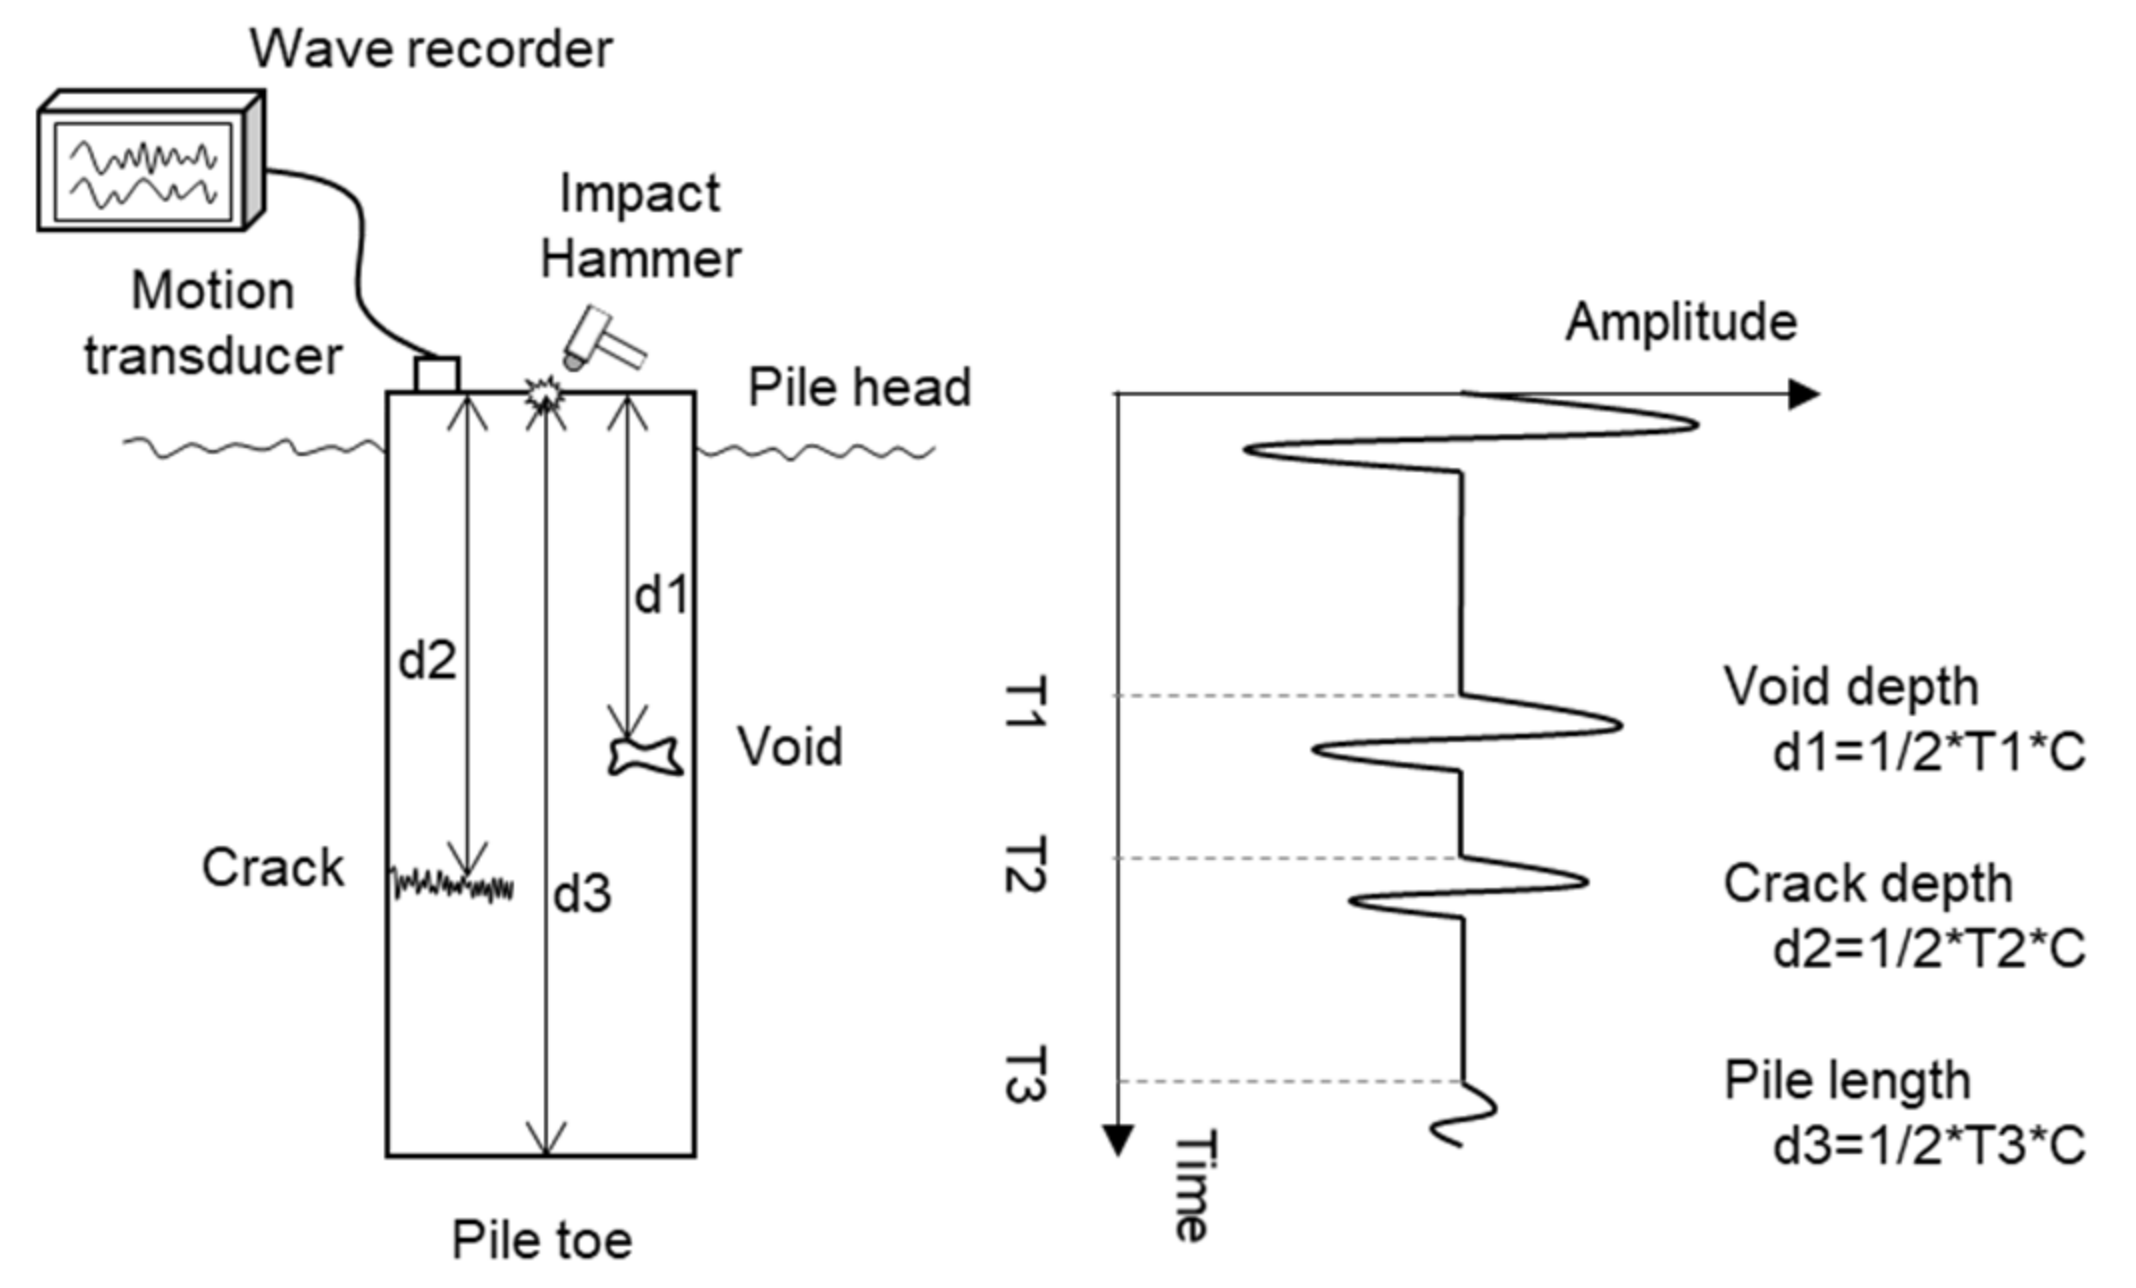
Figure 19.
Detected signals at accelerometers with a hammer strike.
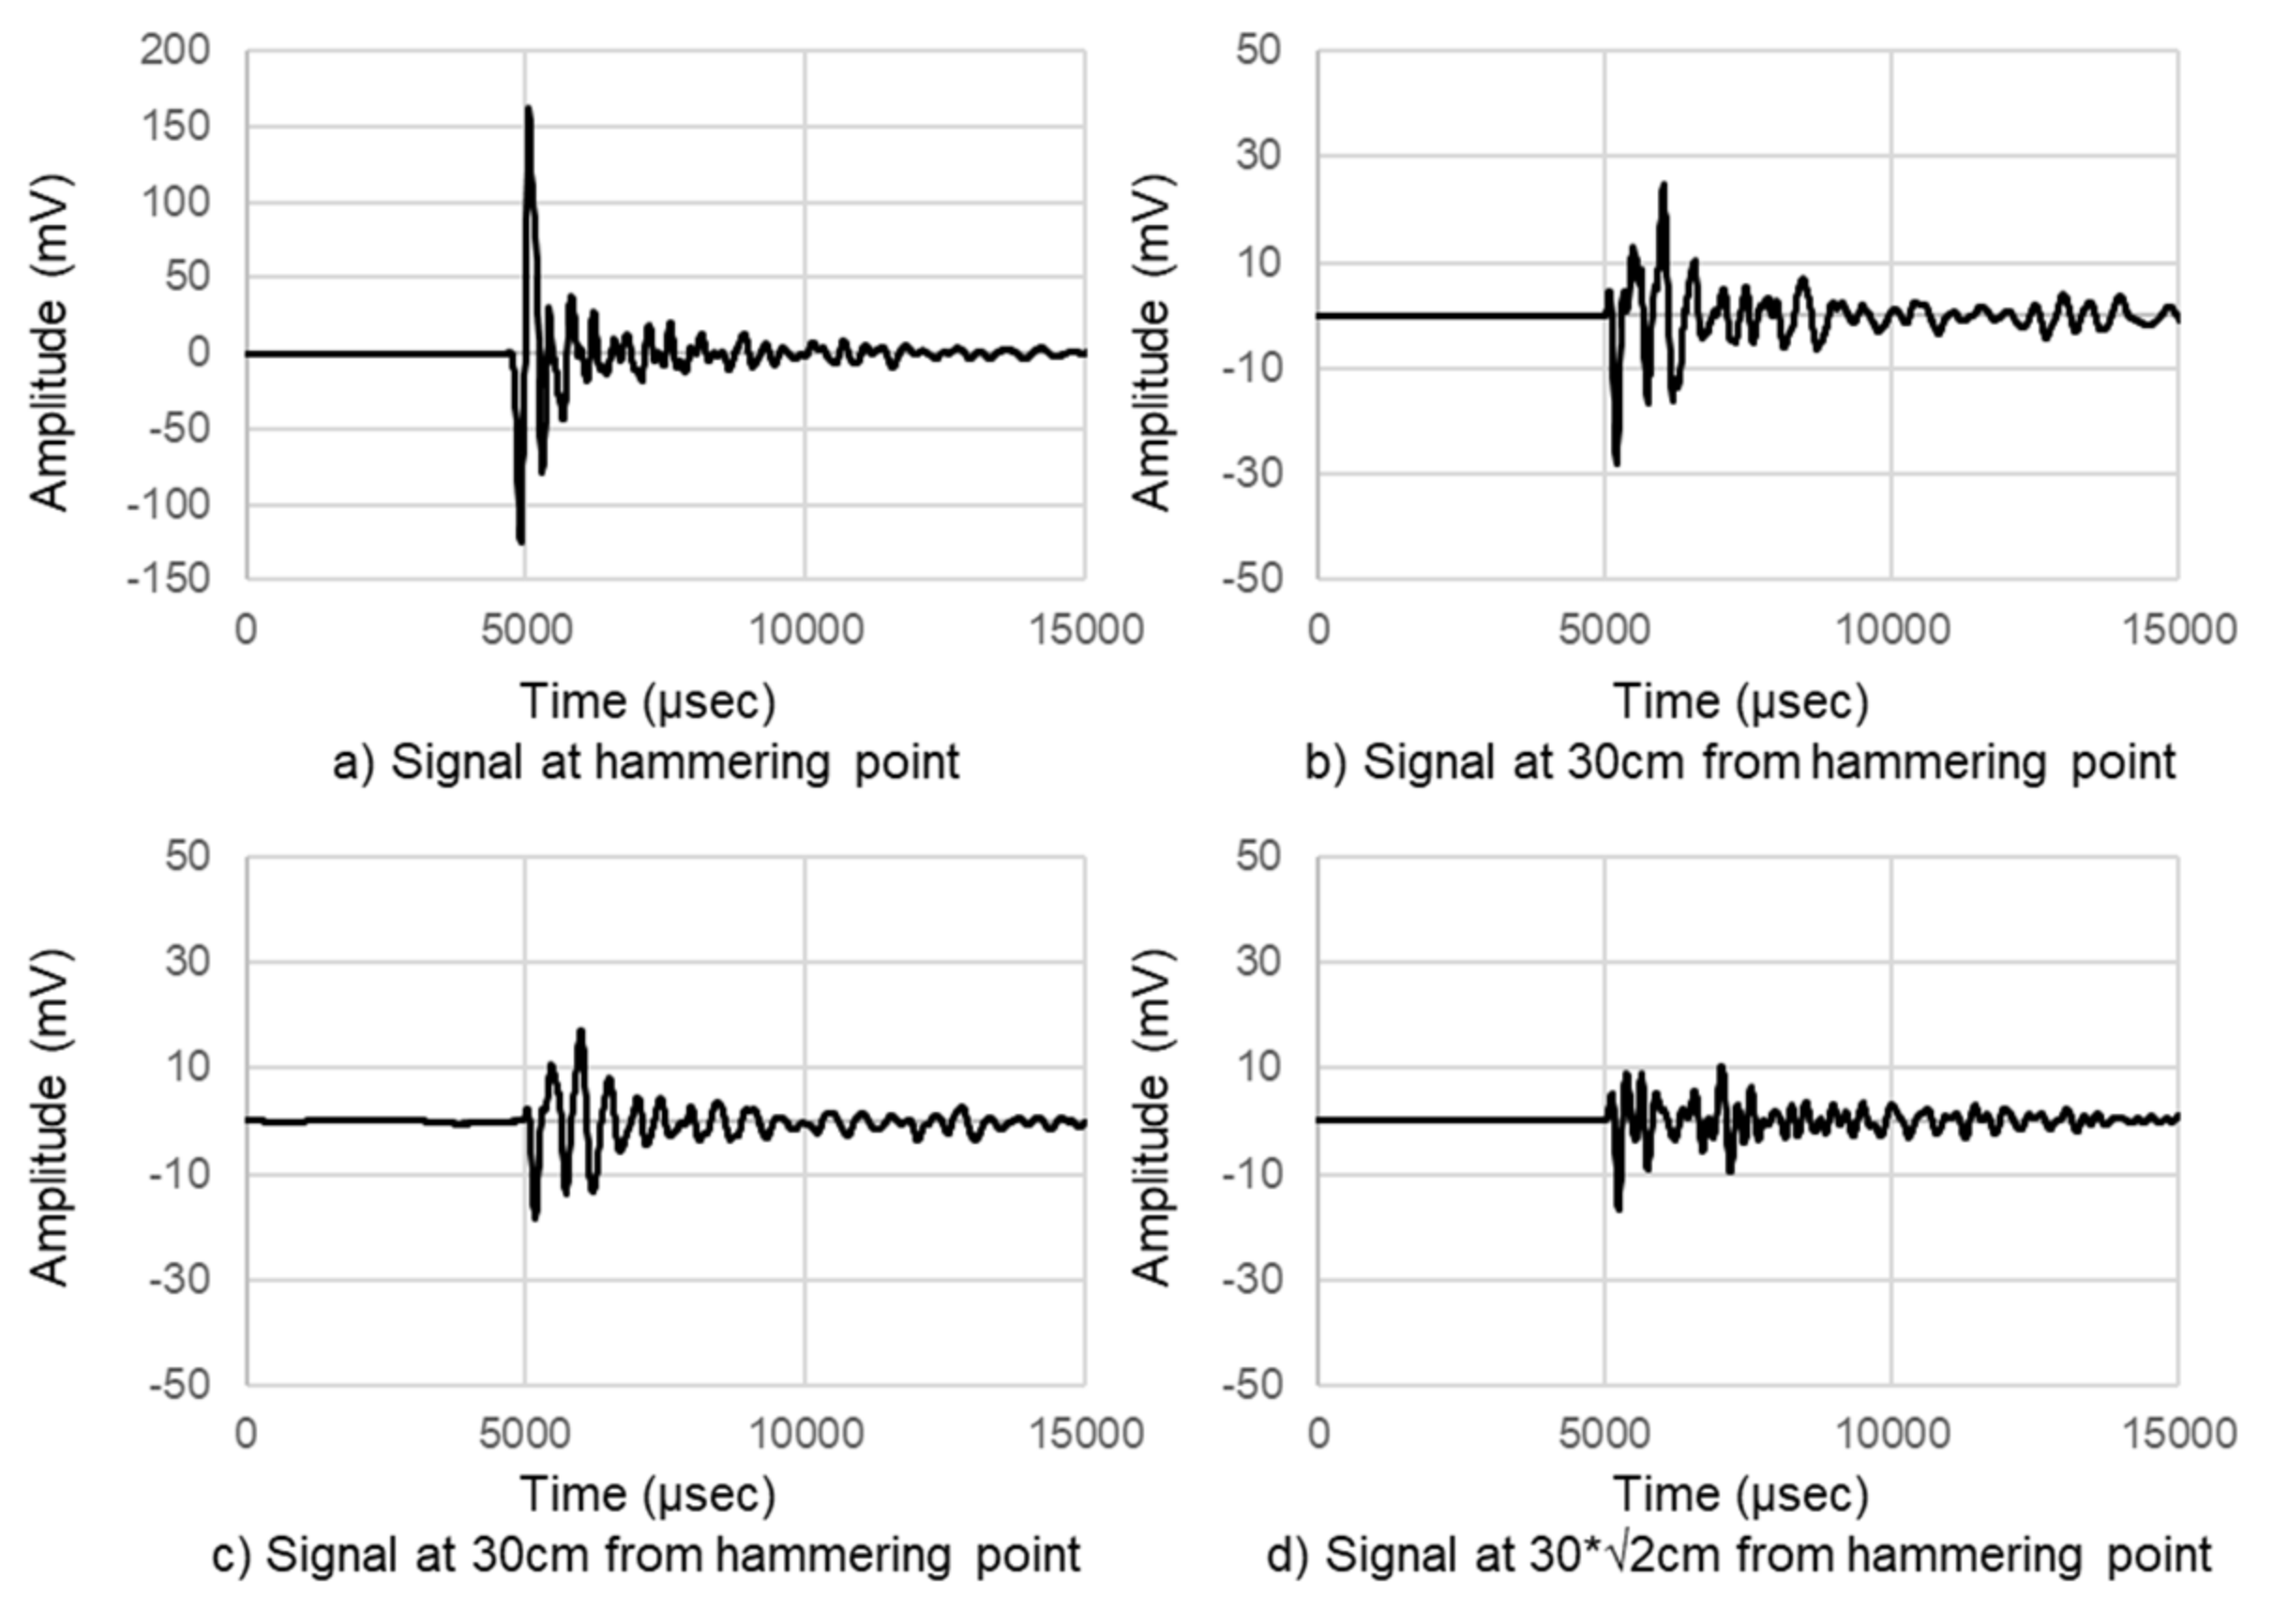
Figure 20.
Signal attenuation along wave propagation in sensor distance.
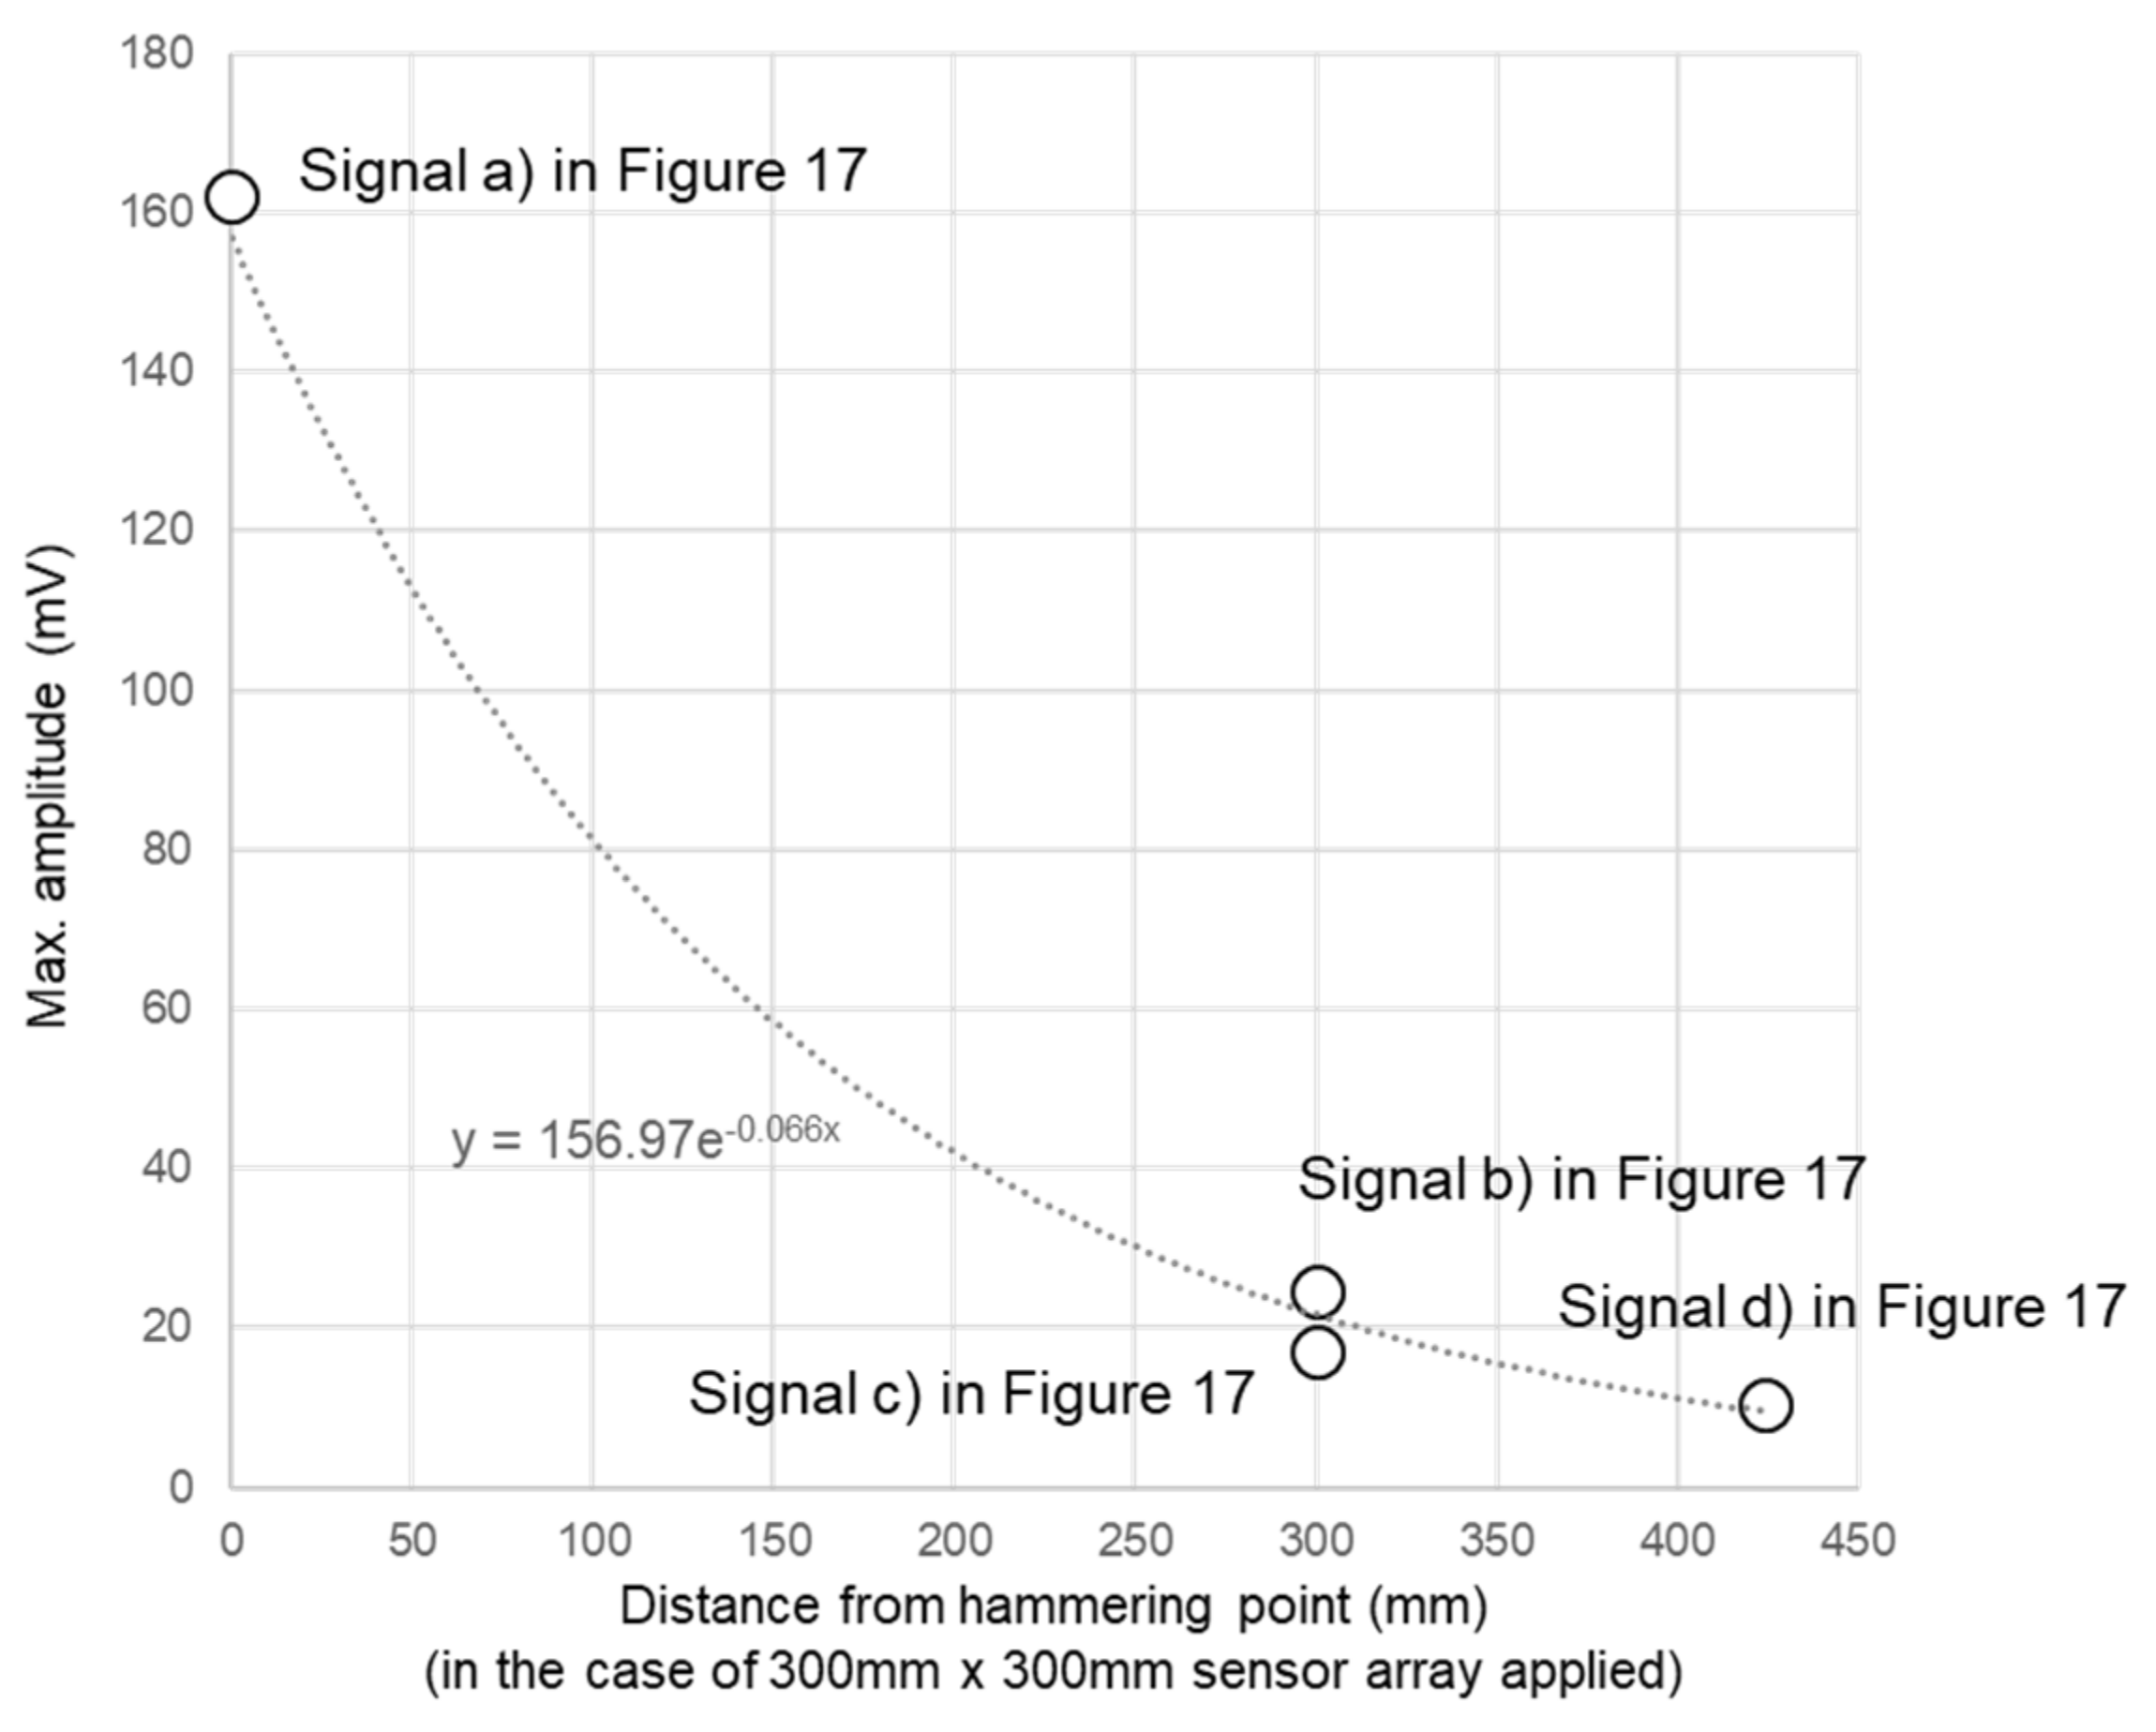
Figure 21.
Improved 3D SIBIE results for damage-simulated concrete specimen.
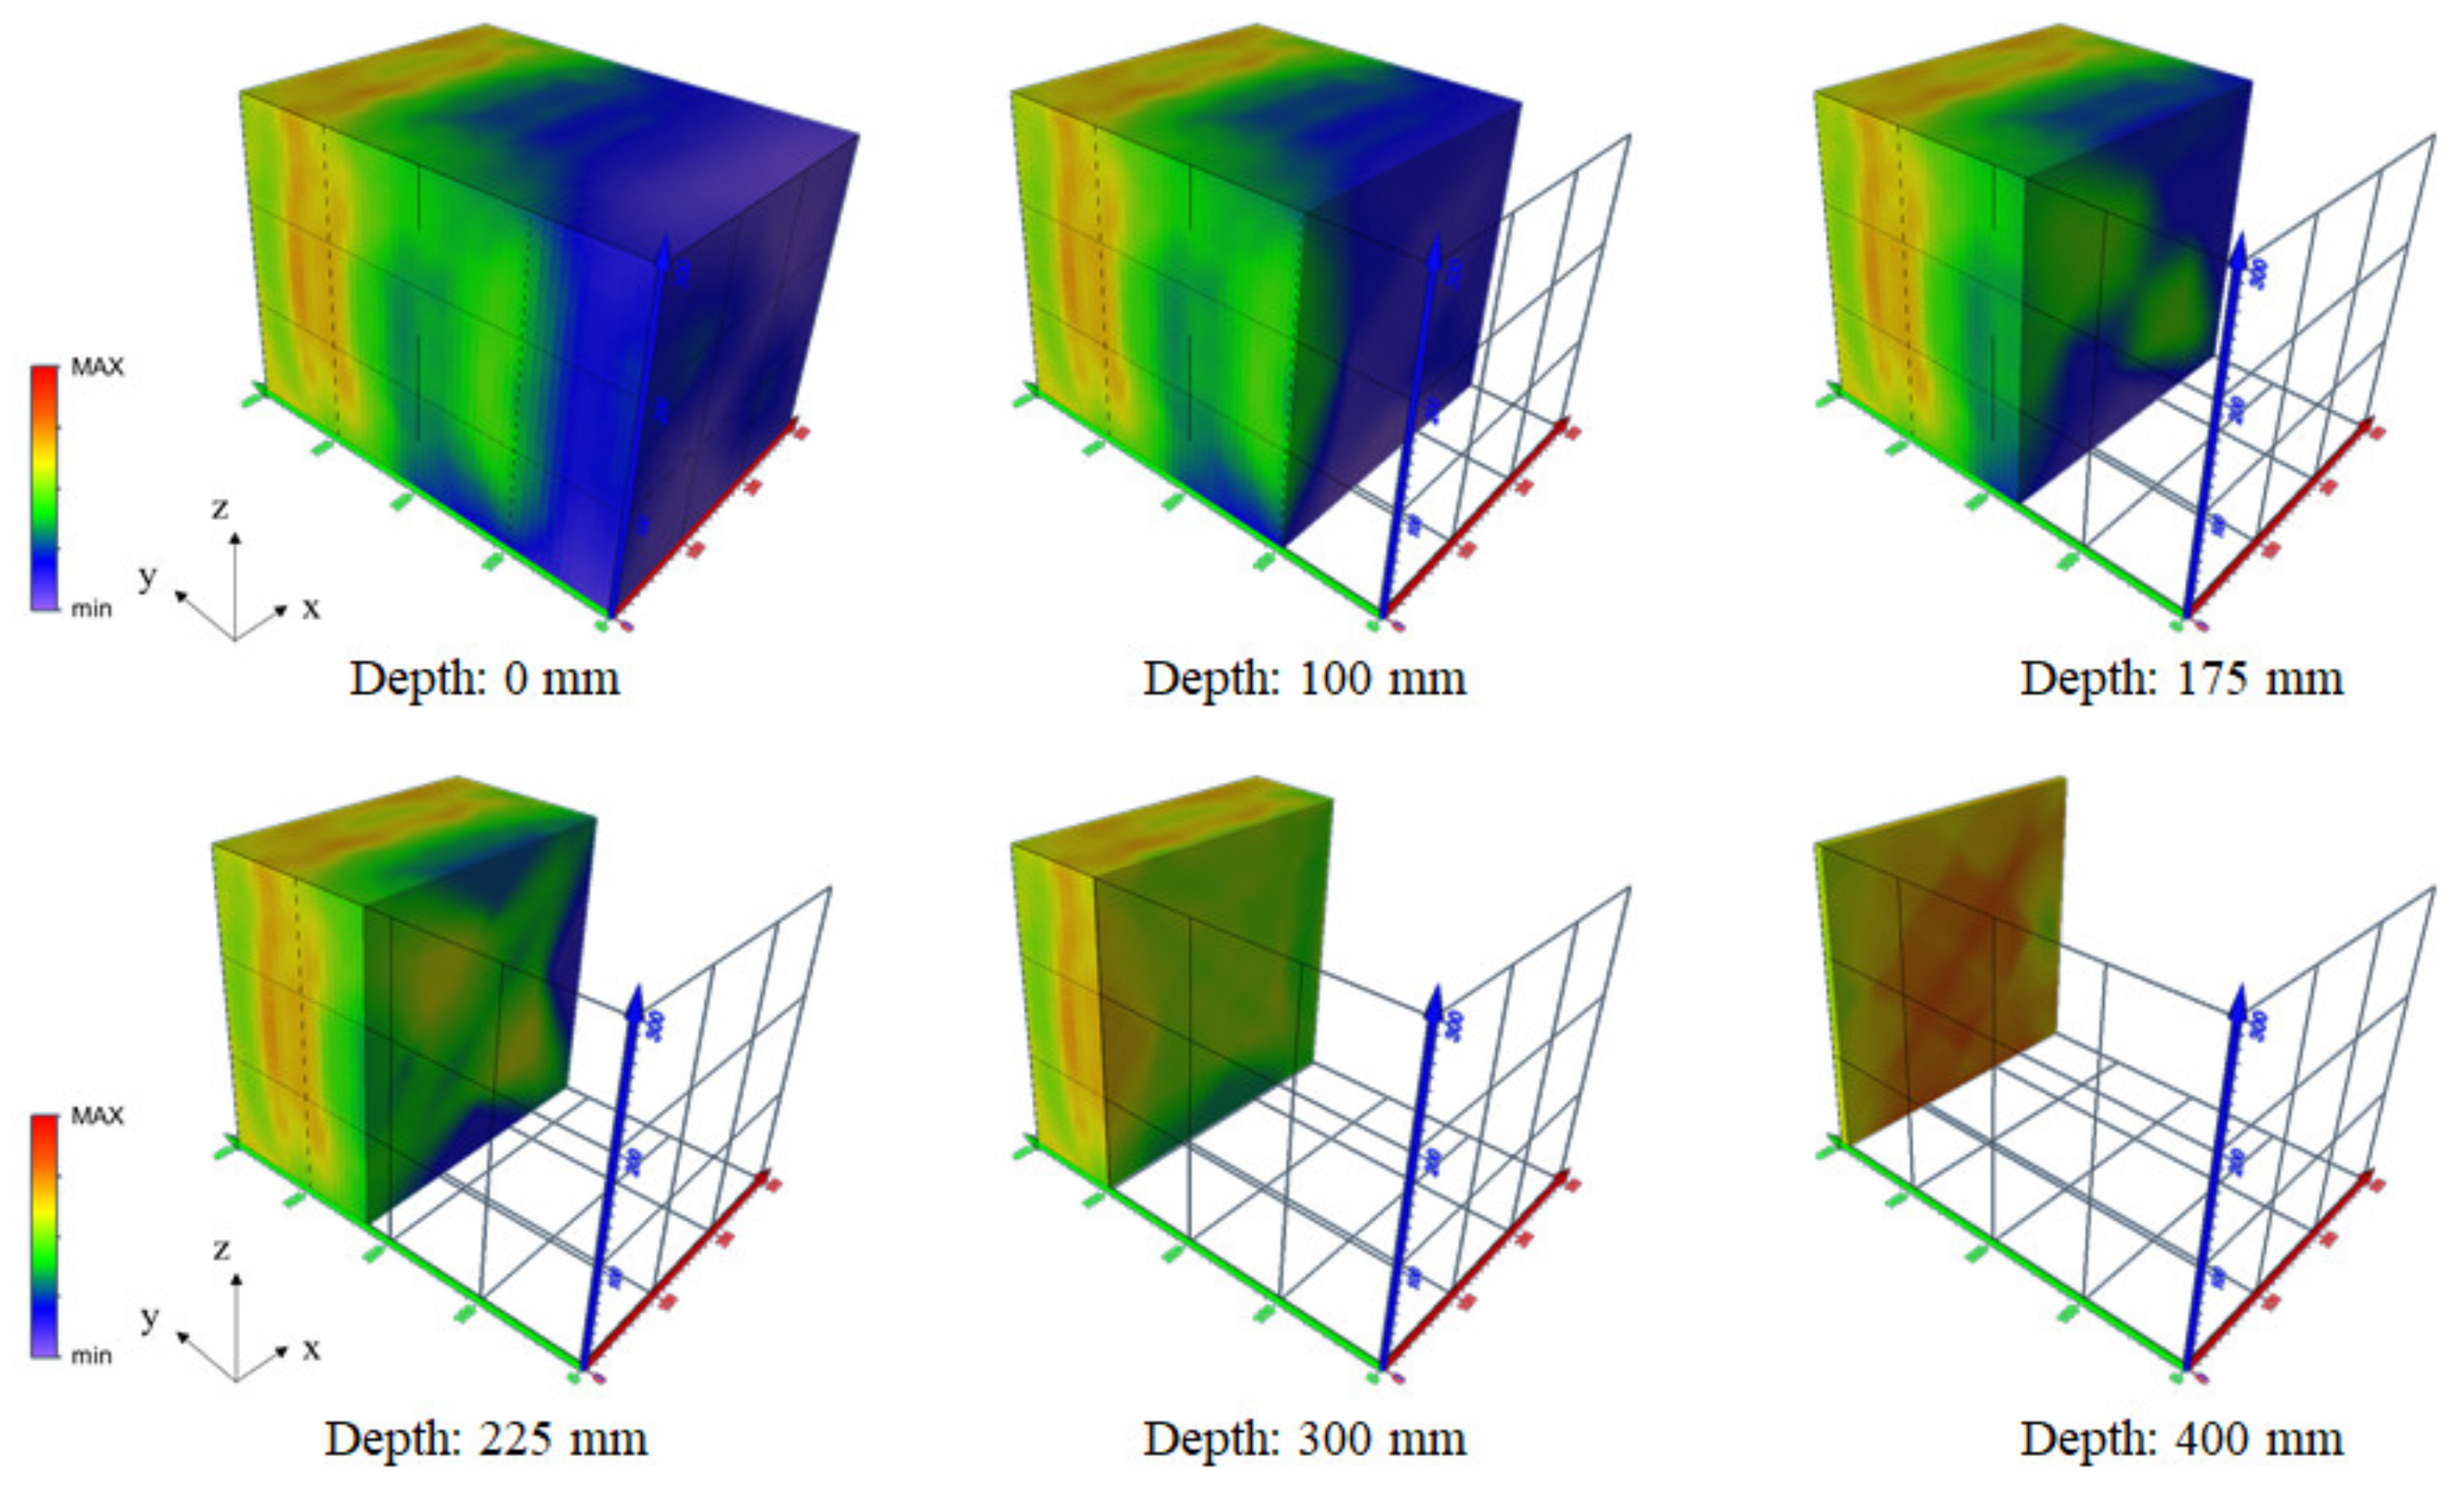
Figure 22.
Improved 3D SIBIE results for intact concrete specimen.
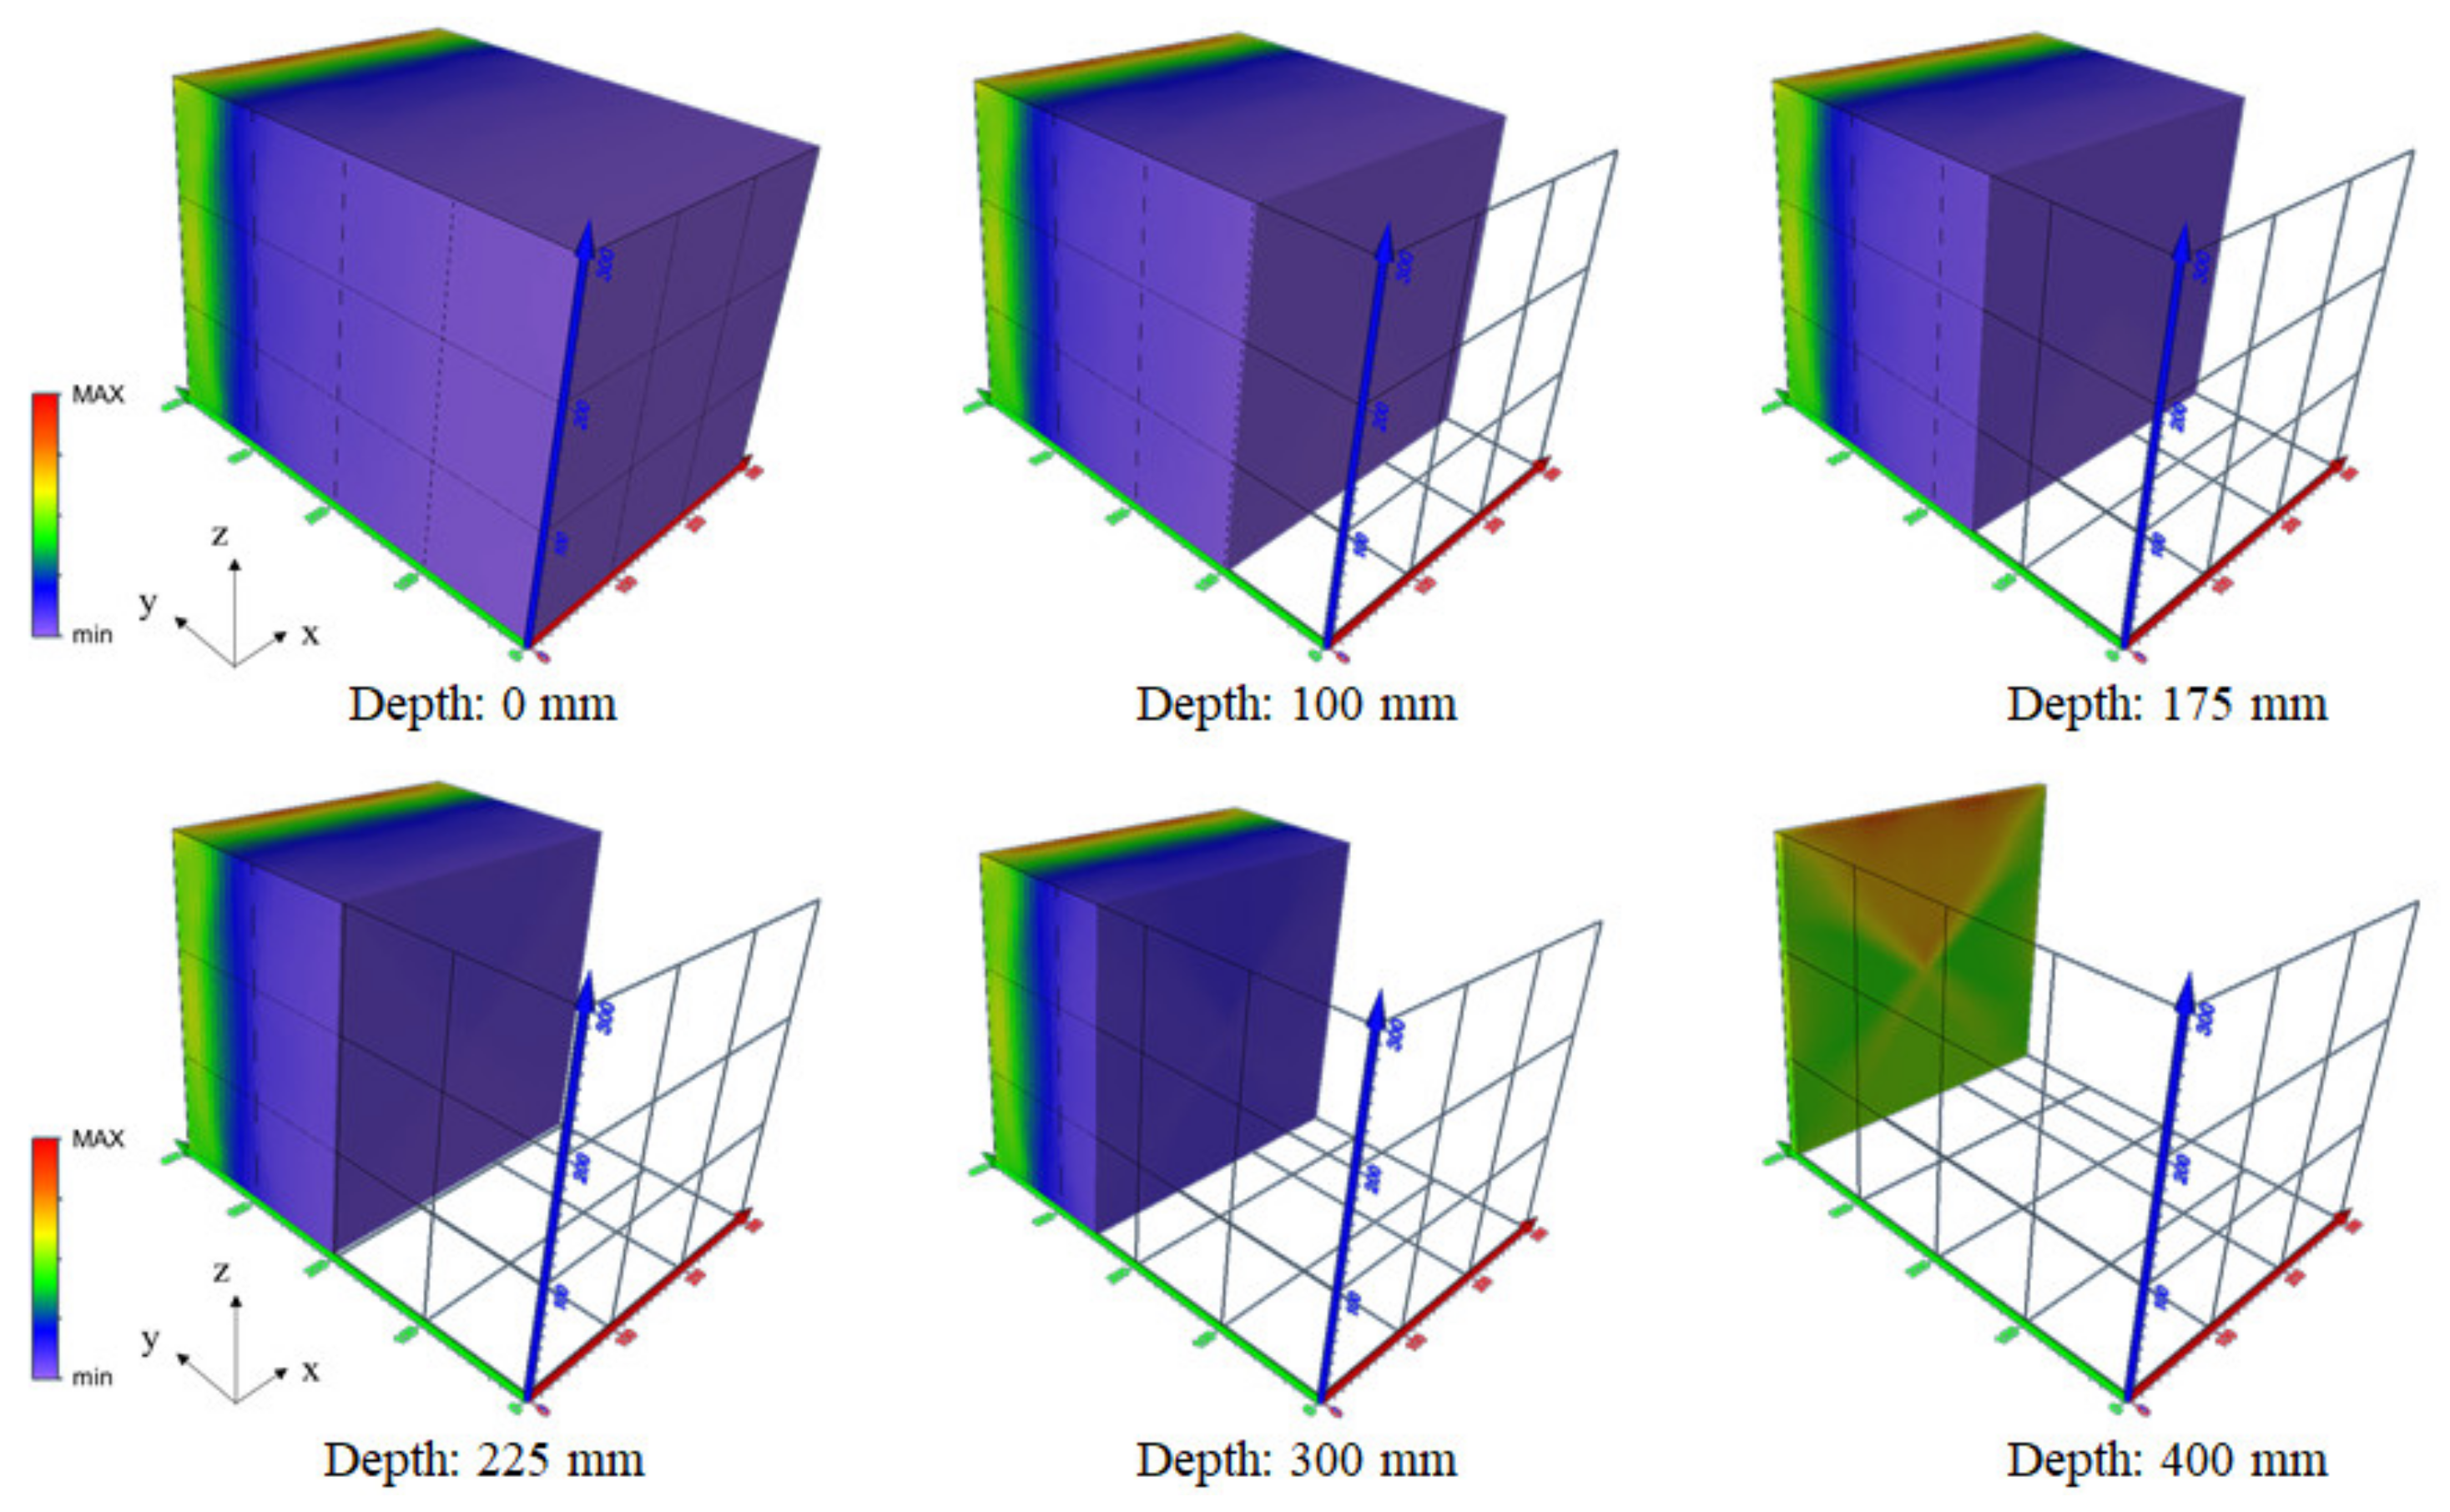
Figure 23.
3D SIBIE result with LDV signal detection for damage-simulated concrete specimen.
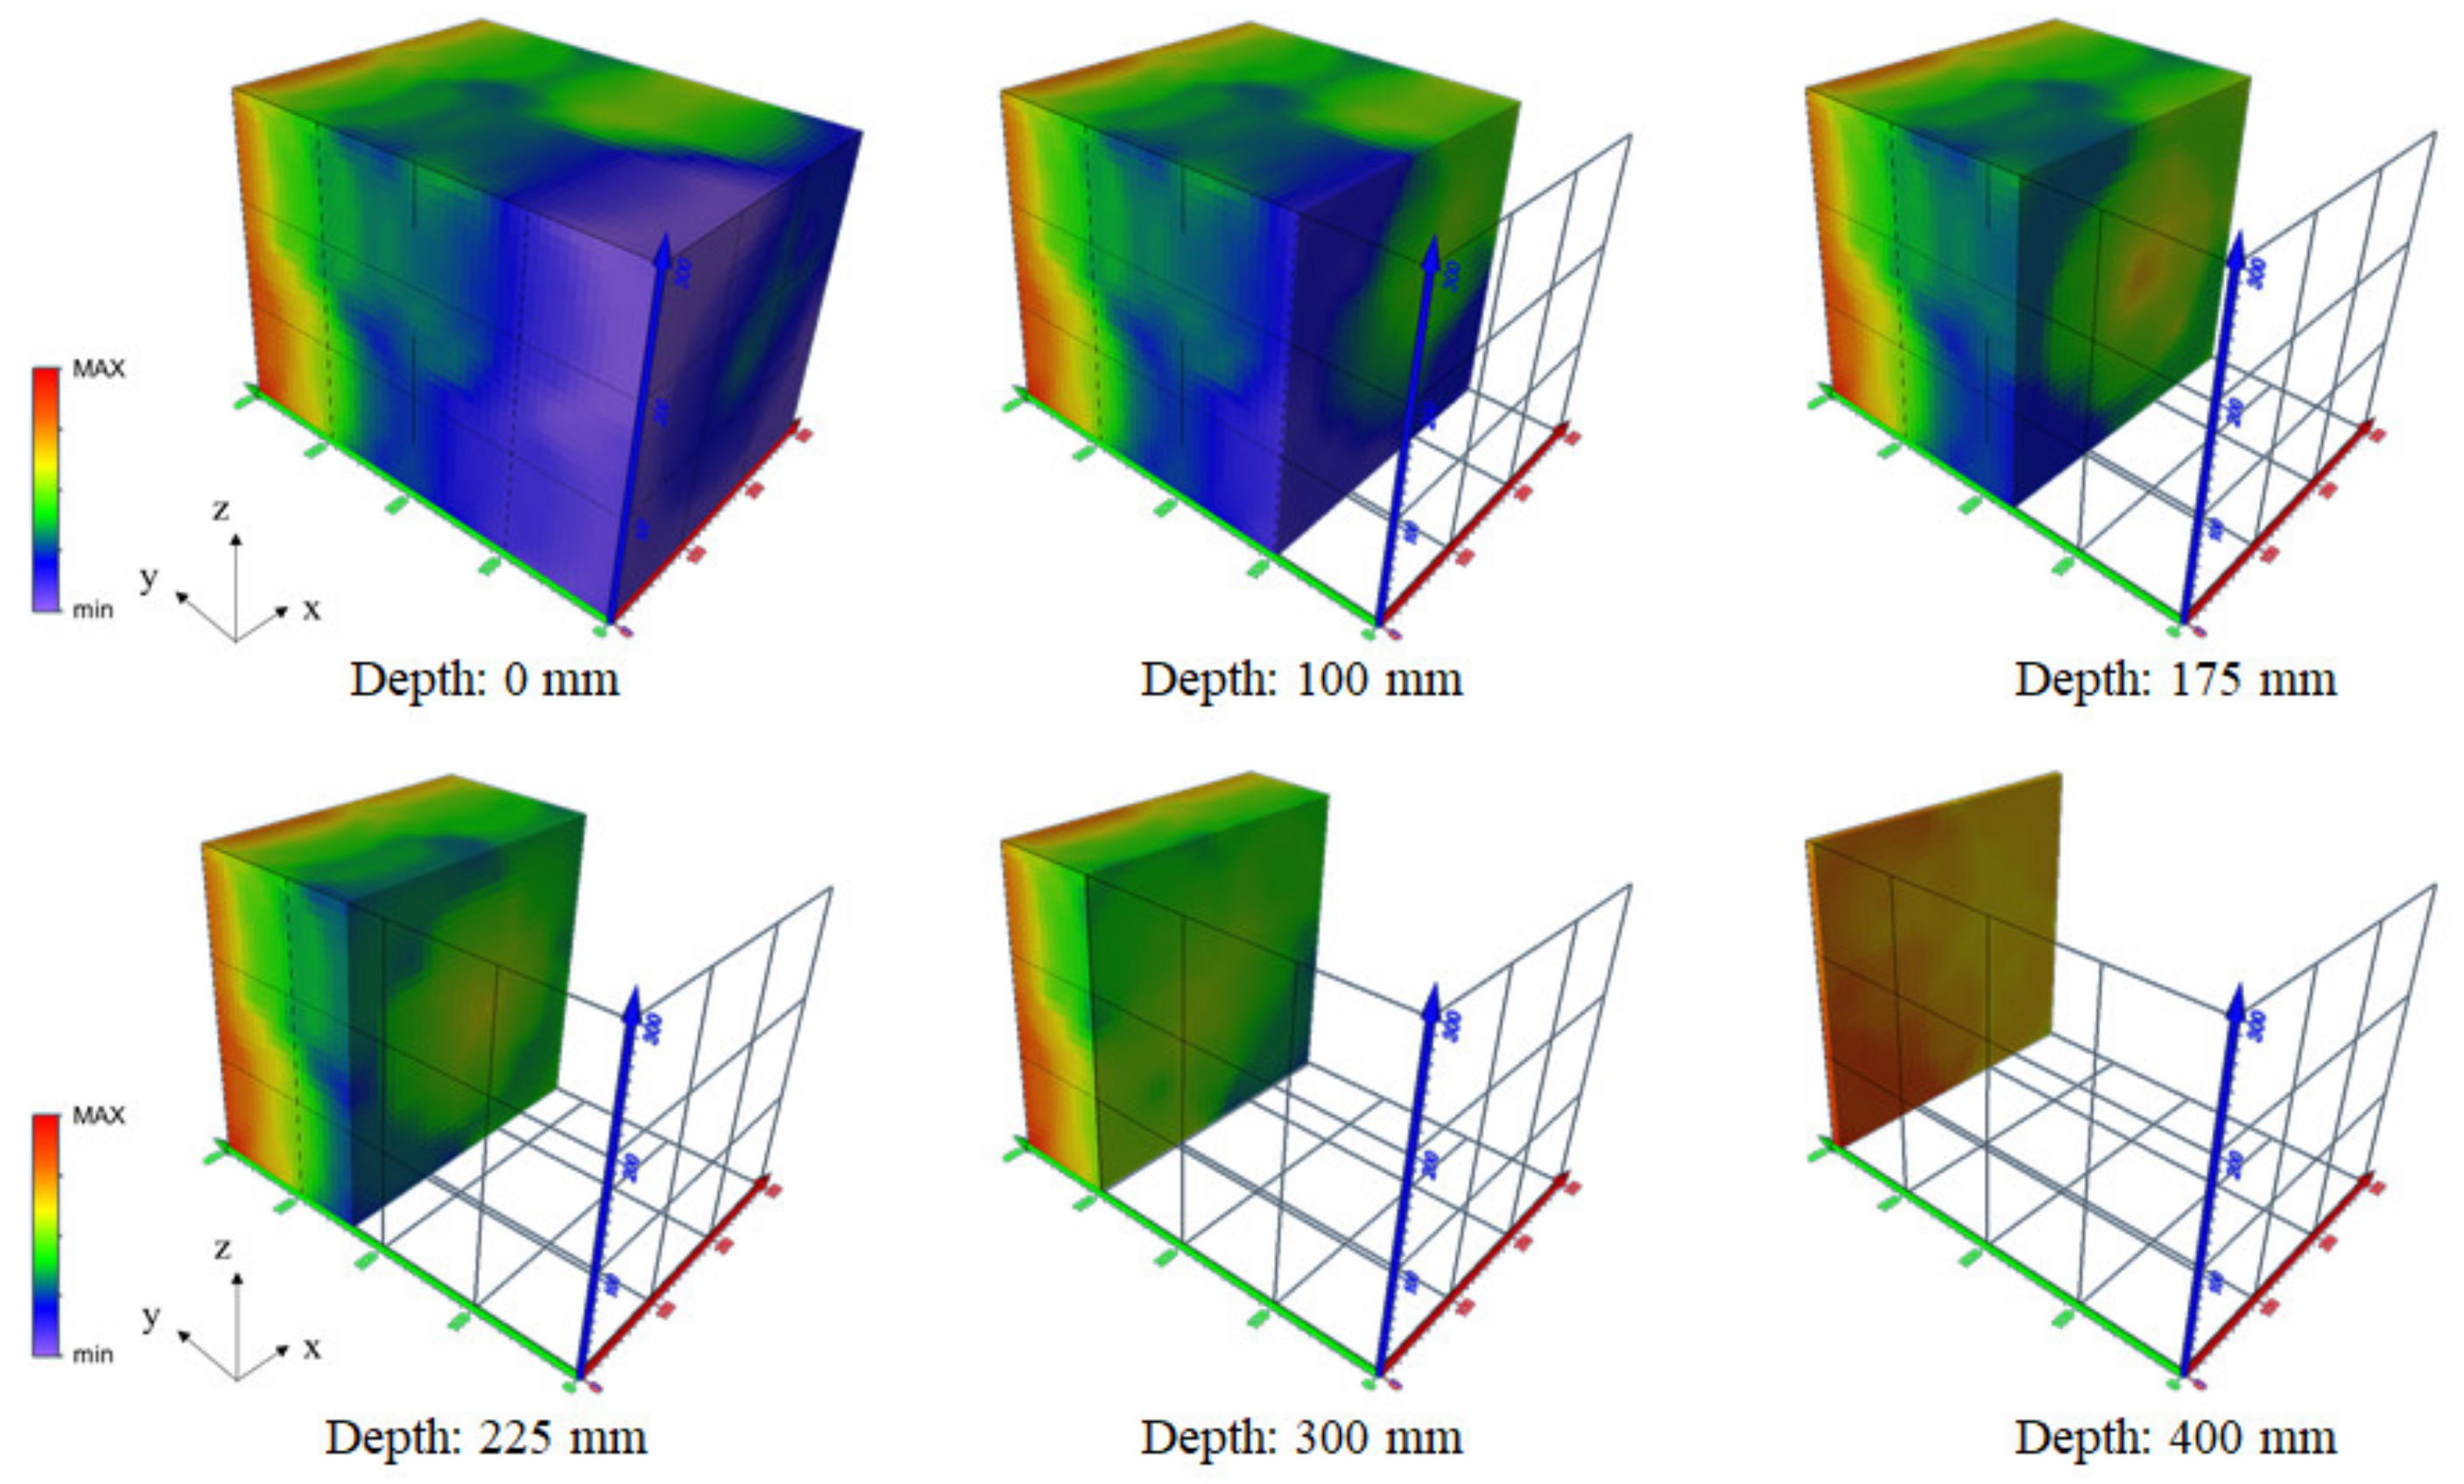
Figure 24.
3D SIBIE result with LDV signal detection for intact concrete specimen.
© 2020 by the authors. Licensee MDPI, Basel, Switzerland. This article is an open access article distributed under the terms and conditions of the Creative Commons Attribution (CC BY) license (http://creativecommons.org/licenses/by/4.0/).
Share and Cite
MDPI and ACS Style
Hashimoto, K.; Shiotani, T.; Ohtsu, M. Application of Impact-Echo Method to 3D SIBIE Procedure for Damage Detection in Concrete. Appl. Sci. 2020, 10, 2729. https://doi.org/10.3390/app10082729
AMA Style
Hashimoto K, Shiotani T, Ohtsu M. Application of Impact-Echo Method to 3D SIBIE Procedure for Damage Detection in Concrete. Applied Sciences. 2020; 10(8):2729. https://doi.org/10.3390/app10082729
Chicago/Turabian StyleHashimoto, Katsufumi, Tomoki Shiotani, and Masayasu Ohtsu. 2020. "Application of Impact-Echo Method to 3D SIBIE Procedure for Damage Detection in Concrete" Applied Sciences 10, no. 8: 2729. https://doi.org/10.3390/app10082729
Note that from the first issue of 2016, this journal uses article numbers instead of page numbers. See further details here.