Automatic 2D Floorplan CAD Generation from 3D Point Clouds


Department of Computer Science and Engineering, Seoul National University of Science and Technology, 232, Gongneung-ro, Nowon-gu, Seoul 01811, Korea
*
Author to whom correspondence should be addressed.
Appl. Sci. 2020, 10(8), 2817; https://doi.org/10.3390/app10082817
Submission received: 24 March 2020
/
Revised: 13 April 2020
/
Accepted: 16 April 2020
/
Published: 19 April 2020
(This article belongs to the Section Computing and Artificial Intelligence)
Abstract
:In the architecture, engineering, and construction (AEC) industry, creating an indoor model of existing buildings has been a challenging task since the introduction of building information modeling (BIM). Because the process of BIM is primarily manual and implies a high possibility of error, the automated creation of indoor models remains an ongoing research. In this paper, we propose a fully automated method to generate 2D floorplan computer-aided designs (CADs) from 3D point clouds. The proposed method consists of two main parts. The first is to detect planes in buildings, such as walls, floors, and ceilings, from unstructured 3D point clouds and to classify them based on the Manhattan-World (MW) assumption. The second is to generate 3D BIM in the industry foundation classes (IFC) format and a 2D floorplan CAD using the proposed line-detection algorithm. We experimented the proposed method on 3D point cloud data from a university building, residential houses, and apartments and evaluated the geometric quality of a wall reconstruction. We also offer the source code for the proposed method on GitHub.
1. Introduction
The creation of 2D floorplan computer-aided designs (CADs) of the existing buildings is a challenging task in the architecture, engineering, and construction (AEC) industry, as the as-built condition of buildings can differ from original plans due to undocumented renovations. The creation of an indoor model from existing building has been widely researched with building information modeling (BIM) and has been increasingly requested in various applications [1]. Currently, BIM processes are well established for new buildings, but most existing buildings are not maintained, refurbished, or deconstructed with BIM [2]. The advantage of the implementation of BIM in existing buildings is significant, especially for restoration, documentation, maintenance, quality control, and energy/space management.
Thus, the most important aspect is the creation of BIM without a prior model, as existing buildings usually do not have a model. To create BIM for existing buildings, 3D reconstruction is required, and a key aspect of 3D reconstruction is wall geometry modeling because it forms the basis for other elements of buildings. Currently, these objects are created manually based on large unstructured 3D point clouds acquired from the built structure. However, this process is labor-intensive and is prone to human error. Another challenge related to automated reconstruction is that 3D point clouds contain various types of clutter, such as furniture, and 3D point clouds lack semantic information [3].
In order to resolve these issues, we propose a fully automated method to create 2D floorplan CADs from 3D point clouds without a prior model. In the proposed method, we generate 3D reconstruction model of walls based on assumption of Manhattan-World (MW) buildings, which assumes that most man-made structures can be approximated by planar surfaces that are parallel to one of the three principal planes of a common orthogonal coordinate system [4].
We then generate a 2D floorplan CAD based on the 3D reconstruction of the elements. In detail, to reconstruct the wall geometry, the proposed algorithm initially detects planes from 3D point clouds and classifies them as belonging to floors, ceilings, or walls. A 2D image which contains only wall candidate points is then created and wall lines are detected. There are several line-detection algorithms, such as RANSAC [5], the Hough transform [6], and the least-square (LS) method [7]. In this paper, we propose an efficient line-detection algorithm for wall detection.
This paper is organized as follows. In Section 2, the background and related works are presented. Section 3 presents the proposed method, including the steps of data preprocessing, floor segmentation, wall detection, and 2D floorplan CAD generation. In Section 4, experimental results are discussed, including the evaluation metrics and datasets used. Finally, the concluding remarks follow in Section 5.
2. Backgrounds and Related Works
The main process when generating a 2D floorplan from unstructured 3D point clouds is to create BIM objects from 3D point clouds. This process can be divided into two steps, i.e., 3D reconstruction and conversion into a BIM format such as the industry foundation classes (IFC) format.
3D reconstruction commonly consists of three parts after the acquisition of the point cloud: data preprocessing, plane segmentation, and plane classification. First, the 3D point cloud data are preprocessed to create structured data in order to save time during the process and achieve more efficient results. In 2D methods, the point cloud is represented as a set of images consisting of a slice of points or other information [8,9]. In 3D methods, the point cloud is restructured as a voxel octree which allows efficient neighborhood searches [10]. Subsequently, the point cloud is segmented. Typically, lines are used for point cloud segmentation in 2D methods such as RANSAC based [8,11,12] and Hough transform based [13,14,15] methods, while planes are used for point cloud segmentation in 3D methods [10,16,17]. Finally, the segments are classified into categories such as floors and walls by using heuristics or machine learning techniques [18,19,20,21].
After 3D reconstruction, wall geometry modeling is the most important part of the next step. There have been several studies of the reconstruction of wall geometries. Xiong et al. and Adan and Huber reconstructed planar wall boundaries and openings based on machine learning [18,22]. Michailidis and Pajarola reconstructed severely occluded wall surfaces using Bayesian graph-cut optimization based on cell complex decomposition [23].
The relationship between elements in a building leads at the end to the BIM establishment. Additionally, element topology can serve to describe building elements. Topological data assign spatial relationship information, whereas the dimensions and locations of elements are represented by geometrical data. Types of elements and relationships with other elements are associated with these processes. Several proposed models determine topological relationships among objects automatically. Nguyen et al. presented an approach that automatically analyzes the topological relationships of building elements [24]. Belsky et al. implemented a prototype system for the semantic improvement of prior factual model files [25]. In their system, shared and slab collection concepts were acknowledged and topological, geometric, and other generic operators were used in collections of rule sets. Anagnostopoulos et al. presented a semi-automatic algorithm which calculated the boundaries and adjacency of objects in 3D point clouds [26]. It generated depictions of objects in the IFC format.
3. Proposed Method
The input to our method consists of unstructured 3D point clouds, and the output is the 2D floorplan CAD having topological relationships between the walls. The proposed method is composed of the 3D reconstruction and 2D floorplan CAD generation parts. In the first part, walls are detected as follows:
- 3D point cloud data preprocessing
- Floor segmentation based on horizontal planes
- Wall proposals based on vertical planes for each floor
- Wall detection using the horizontal projection of wall proposals
- IFC file generation from the detected wall points
In the second part, we create structural elements from the IFC file, after which, based on this information, we generate the 2D floorplan CAD. Our approach is fully automated and implemented using the PCL (point cloud library) the most popular library that works with 3D point clouds [27]. Figure 1 shows the overall flow of the proposed method. The code for the proposed method is available at https://github.com/joyjo/to-generate-2D-floorplan-CAD-from-3D-point-clouds.
3.1. Data Pre-Processing
We used unstructured 3D point clouds as an input data from LIDAR scanners. Therefore, our algorithm requires preprocessing of the 3D point clouds in order to save time during the process and to gain more insight for meaningful element extractions, such as for floors and walls. For data preprocessing, 3D point clouds are spatially re-sampled at 1 cm and rotated to follow the proper orientation for a wall detection algorithm.
3.2. Floor Segmentation
After data preprocessing, floor segmentation is performed. We consider the assumption that floors and ceilings are horizontal and parallel to the x–y plane. Therefore, the largest horizontal planes are extracted using a parallel model of the RANSAC algorithm because the floor and ceilings would contain the highest points in every possible horizontal plane. Then, detected planes are ordered by z-coordinate and analyzed with floor altitude threshold. Each plane is identified as a floor or a ceiling based on the altitude threshold and the 3D points of floors and ceilings are then removed to detect walls. The ceilings may contain clutters such as lamps, air conditioning, or ventilation openings, but these clutters are considered as a part of ceiling and removed with ceilings together.
3.3. Wall Detection
Detecting walls is a more complex process than detecting floors and ceilings. After removing floors and ceilings, 3D point clouds contain points belonging to walls as well as points belonging to clutter, such as furniture (e.g., desks, chairs and bookshelves). Detecting a wall is highly sensitive in cluttered data. In order to solve this problem, wall proposals are conducted by removing most of the clutter from the 3D point clouds. As shown in Figure 2, wall proposals, , are calculated based on the assumption that walls are vertical and parallel to y–z or x–z planes. Therefore, all possible planes are extracted using a parallel model of the RANSAC algorithm. Then, our proposed algorithm retains the planes with altitudes higher than a threshold, as follows:
Here, is the height of the i-th plane, thres is a constant value that describes the minimum plane height, is the minimum point of the z-axis for a ceiling, is the maximum point of the z-axis for the floor. Therefore, becomes the height of the current floor.
After the wall proposals, walls are detected with two steps. In the first step, we create depth image based on points of wall proposal planes that are projected onto the x–y plane using Algorithm 1. The expected result is described in Figure 3a. Algorithm 1 works as follows:
- -
- Inputs are 3D point clouds of wall proposals and the grid size (default value for the grid size: 0.01 m).
- -
- 3D point clouds are projected into the x–y plane (lines 1 and 3), meaning we set all z-axis points to zero.
- -
- Create a grid structure from projected 3D point clouds (lines between 4 and 12). The projected 3D point clouds are initially sliced on the x-coordinate with range [i, i+gridSize] and then on the y-coordinate with range [j, j+gridSize], where i is an x-coordinate value of i-th point and j is a y-coordinate value of the j-th point. Then, the point density of each grid cell is then saved in a grid.
- -
- Create an empty image with the height and width of the grid (line 13).
- -
- Calculate the image intensity based on the described grid (line 14). In an image, intensity defines the pixel value; i.e., the pixel can have a value from 0 to 255 in a grayscale image.
| Algorithm 1: Create Depth Image from 3D Point Clouds. |
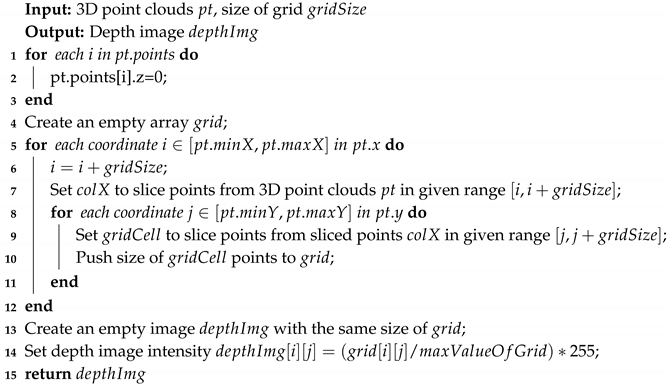 |
In the second step, walls are detected using the created depth image with Algorithm 2. To solve the problem of missing 3D points when the building is scanned by a LIDAR, we propose an efficient line-detection algorithm from the created depth image. The proposed algorithm finds all horizontal and vertical lines in the depth image if a line contains at least one point. All possible wall candidates are defined in each horizontal and vertical line, as presented in Figure 3b. We then detect actual walls from the wall candidate lines. The expected result is presented in Figure 3c. Algorithm 2 has the following steps:
- -
- Inputs are the depth image that results from Algorithm 1 and the thresholds, i.e., minimum points for the wall line, ; minimum length of the wall line, ; and determined area, .
- -
- Define the wall candidate lines, (lines between 1 and 6). If a pixel, , has an intensity value greater than 0, i.e., the pixel is not black, then the pixel is a part of the wall candidate lines. Therefore, the horizontal and vertical lines that pass the pixel are drawn. In detail, the horizontal and vertical lines are described by two points: and , and and . This process is repeatedly done for all pixels in .
- -
- Define actual wall lines from wall candidate lines (lines between 7 and 20). First, we check the pixels in each wall candidate line, . If there are points around the pixel within the predefined area threshold (the default value is 50 pixels), it means that the pixel can be a part of the wall line. We set an area threshold value because there are some missing points and noise from the LIDAR sensor. We set to 1 if the i-th pixel satisfies the condition, and set it to 0 otherwise. As a result, we obtain the vector, which is a sequence of 0 and 1 for each wall candidate line. The size of the vector is equal to the width and height of the depth image for the horizontal and vertical wall candidate lines, respectively. Based on the vector, we determine the actual wall lines using the thresholds, i.e., minimum points on the wall line, , and minimum length of the wall line, . For example, if = {1, 1, 1, 1, 1, 1, 0, 0, 0, 1, 1, 1, 1, 1}, we can see two sequences of ones. If these two sequences meet the threshold condition, they are determined to be actual wall lines.
| Algorithm 2: Detect Wall Lines from Wall Candidate Lines. |
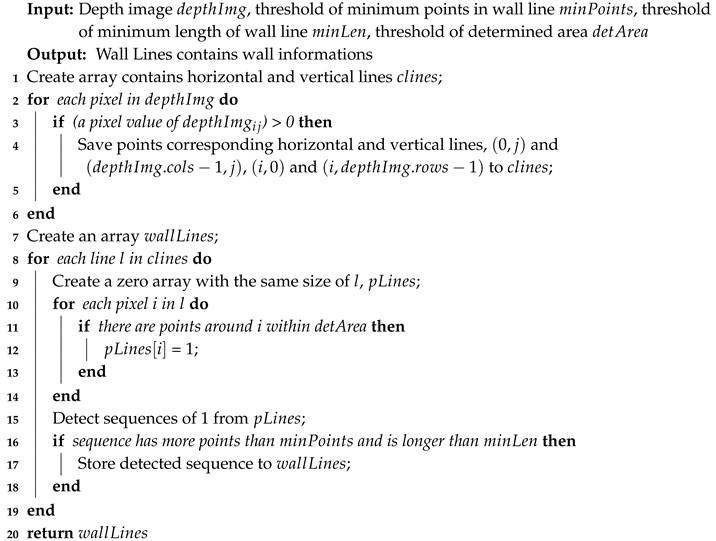 |
3.4. IFC File and 2D Floorplan CAD Generation
Using the proposed method, walls are identified successfully with information that includes the position, direction and altitudes, but they are still in the form of 3D point clouds. Therefore, 3D reconstruction of the structural elements of the building must be performed. There are two necessary steps when reconstructing walls and exporting the result into a BIM format. In the first step, we describe the 3D geometry of the elements based on information for which the wall is described as either a volume composed of eight points and six facets or as a surface composed four points and one facet. The second step consists of translating the 3D geometry of the elements into an IFC file. The elements describe what is expected in the building information model. A conversion phase is thus necessary to be able to integrate the results in BIM software. The IFC format is chosen as the format for the output in this approach. The IFC format is a standardized object-based file format used by the AEC industry to facilitate interoperability between building actors. Both elements and relationships between elements are described in this type of file. In order to generate a file in the IFC format from a 3D geometry of structural elements, we use the open-source library IfcOpenShell [28].
After creating the IFC format, a 2D floorplan CAD file, such as an SVG format file, is generated using the IfcConvert method in an IfcOpenShell library. The IfcConvert method converts IFC files into various output formats, which include geometrical models and which are tessellated and easy to understand.
4. Experiments
The proposed method was experimented on university building, residential houses, and apartment data. We evaluated the wall geometry quality using the recall and precision metric. This section explains the experimental environment and results.
4.1. Experimental Environment
We developed our method focused on the data of the seventh floor of the Robot Convergence Building of Korea University collected by a handheld laser scanner (ZEB-REVO). This data consists of multiple rooms with various types of clutter such as desks, chairs, and sofas as presented in Figure 4a. Therefore, we experimented on another three datasets, as presented in Figure 4b–d, to prove that the proposed method works robustly even for unseen data which were collected by different scanners. The data in Figure 4b are the second floor of the residential house collected by LIDAR (Velodyne HDL-32E), and this 3D point cloud data are very noisy and contain multiple rooms, clutters, and highly missed points in walls. The data in Figure 4c,d are residential house and apartment which are from research that Liu et al. created a benchmark for a new vector-graphics reconstruction problem [29]. They provide 155 scans collected by Google Tango phones (Lenovo Phab 2 Pro and Asus ZenFone AR). We selected two pieces of residential data from these datasets that have multiple rooms, little clutter, and the highly missed point in walls. In this paper, we referenced these two datasets as “Tango Scan-1” and “Tango Scan-2”. The details of each data are presented in Table 1. The proposed algorithm used all 3D point clouds as an input, as presented in Figure 4. In the preprocessing step, we decreased by nearly 30% of number of input point clouds and conducted structuring in voxels with a leaf size of 0.01m in order to save time and retrieve more structural data.
We evaluated the position and length of the detected walls by means of precision and recall, as used in pattern recognition, information retrieval, and classification. The main concept of these methods is the fraction of relevant instances among the retrieved instances. We computed these metrics based on the overlap between the areas of the ground truth and detected walls. We evaluated true-positive, false-positive, and false-negative cases. True-positive () refers to the area of a detected wall that is a wall in the ground truth, false-positive () refers to the area of a detected wall that is not a wall in the ground truth, and false-negative () is the area that is a wall in the ground truth but is not detected as a wall by the proposed algorithm. Based on , , and , we calculated the precision and recall as follows:
We defined thresholds by considering common buildings. During the wall detection process, = 0.9; in Algorithm 1, = 0.01 m; and in Algorithm 2, = 50 pixels which is identical at 50 cm because is 0.01 m, = 2500, and = 100 cm.
4.2. Experiment Results
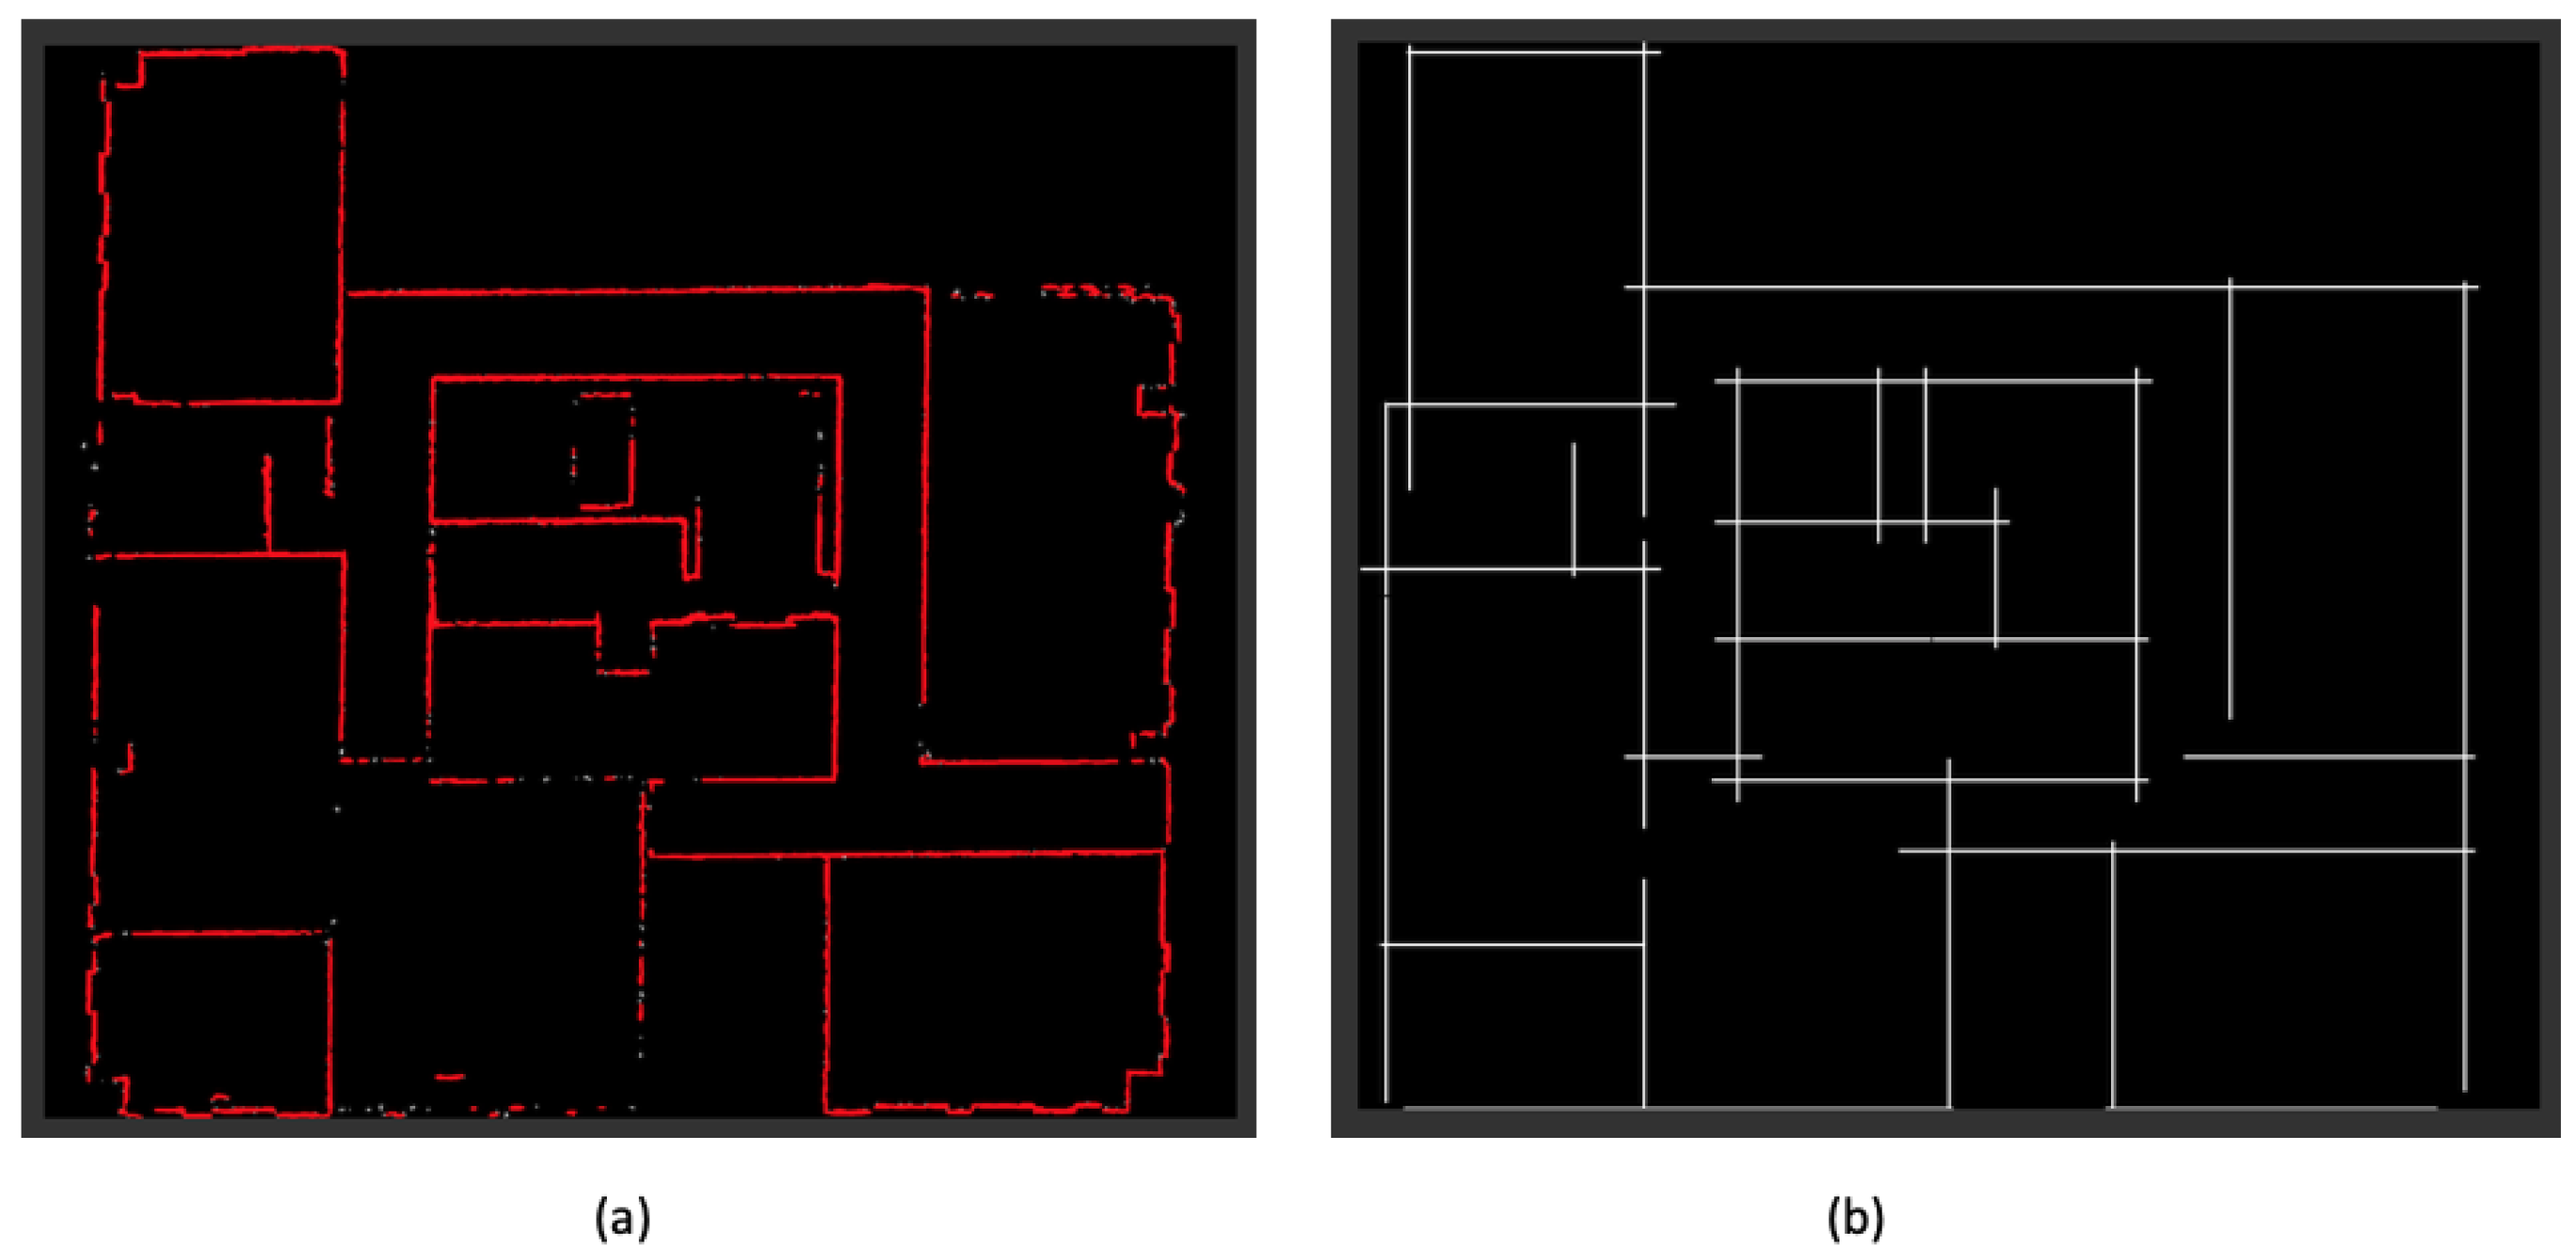
During the overall wall detection process, we initially removed the floor and ceiling from the input 3D point clouds. Figure 5 shows the detected floor and ceiling point clouds of the seventh floor of the Robot Convergence Building of Korea University. Then, using Algorithms 1 and 2, we detected lines from point clouds. We proposed an efficient line-detection algorithm by considering missing 3D points and noise from sensor input. The proposed algorithm is more efficient than existing algorithms such as the faster line detection and Hough transform algorithms. Furthermore, the proposed algorithm does not require any post-processing such as the Hough transform. Figure 6 shows the comparison results of line-detection algorithms on the seventh floor of the Robot Convergence Building of Korea University and Table 2 shows the processing time for each algorithm using an Intel i7-7800X and 64 GB of memory.
5. Conclusions and Future Work
Here, we proposed a fully automated algorithm for generating 2D floorplan CADs from 3D point clouds. First, the proposed algorithm automatically detected walls. We proposed an efficient line-detection algorithm in the wall detection section. The advantages of the proposed algorithm compared to others are it does not require any post-processing and only needs certain predefined thresholds. Second, the proposed algorithm reconstructed detected walls in the BIM format, which can be edited in CAD programs. Finally, a 2D floorplan was generated using IfcOpenShell. We experimentally tested the proposed algorithm on the 3D point cloud data gathered from the seventh floor of the Robot Convergence Building of Korea University using LIDAR and second floor of residential house using LIDAR and open source residential house using Google Tango phone. More than 97% of the walls in the ground truth were detected, and the 2D floorplan was generated successfully. However, the proposed method had limitations in input data because it was more sensitive to data that have missing points in the wall. Our line detection algorithm solved this issue but still if more than approximately 55% of wall points per each wall were missed that wall was not detected as a wall line correctly. In the future, we will develop an algorithm that considers stairs and openings in buildings, such as doors and windows.
Author Contributions
Conceptualization, U.G.; methodology, U.G.; investigation, U.G.; writing—original draft preparation, U.G.; writing—review and editing, J.-H.H.; project administration, J.-H.H.; funding acquisition, J.-H.H. All authors have read and agreed to the published version of the manuscript.
Funding
This work was supported by a grant from the National Research Foundation of Korea (NRF) funded by the Korean government (MSIT) (No. 2018R1A4A1026027).
Conflicts of Interest
The authors declare no conflict of interest.
References
- Wang, C.; Yong, K.; Kim, C. Automatic BIM component extraction from point clouds of existing buildings for sustainability applications. Autom. Constr. 2015, 56, 1–13. [Google Scholar] [CrossRef]
- Volk, R.; Stengel, J.; Schultmann, F. Building Information Modeling (BIM) for existing buildings—Literature review and future needs. Autom. Constr. 2014, 38, 109–127. [Google Scholar] [CrossRef] [Green Version]
- Previtali, M.; Díaz-Vilariño, L.; Scaioni, M. Indoor Building Reconstruction from Occluded Point Clouds Using Graph-Cut and Ray-Tracing. Appl. Sci. 2018, 8, 1529. [Google Scholar] [CrossRef] [Green Version]
- Coughlan, J.; Yuille, A. Manhattan world: Compass direction from a single image by Bayesian inference. IEEE ICCV 1999, 2, 941–947. [Google Scholar]
- Fischler, M.A.; Bolles, R.C. Random Sample Consensus: A Paradigm for Model Fitting with Applications to Image Analysis and Automated Cartography. Commun. ACM 1981, 24, 381–395. [Google Scholar] [CrossRef]
- Duda, R.O.; Hart, P.E. Use of the Hough Transformation to Detect Lines and Curves in Pictures. Commun. ACM 1972, 15, 11–15. [Google Scholar] [CrossRef]
- Peter, M.; Jafri, S.; Vosselman, G. Line segmentation of 2d laser scanner point clouds for indoor slam based on a range of residuals. ISPRS Ann. Photogramm. Remote Sens. Spat. Inf. Sci 2017, IV-2/W4, 363–369. [Google Scholar] [CrossRef] [Green Version]
- Anagnostopoulos, I.; Patraucean, V.; Brilakis, I.; Vela, P. Detection of walls, floors and ceilings in point cloud data. In Proceedings of the Construction Research Congress 2016, San Juan, Puerto Rico, 31 May 2016. [Google Scholar]
- Landrieu, L.; Mallet, C.; Weinmann, M. Comparison of belief propagation and graph-cut approaches for contextual classification of 3D lidar point cloud data. In Proceedings of the IGARSS2017, Fort Worth, TX, USA, 23 July 2017. [Google Scholar]
- Vo, A.V.; Truong-Hong, L.; Laefer, D.F.; Bertolotto, M. Octree-based region growing for point cloud segmentation. ISPRS J. Photogramm. Remote Sens. 2015, 104, 88–100. [Google Scholar] [CrossRef]
- Schnabel, R.; Wahl, R.; Klein, R. Efficient RANSAC for Point-Cloud Shape Detection. Comput. Graph. 2007, 26, 214–226. [Google Scholar] [CrossRef]
- Ochmann, S.; Vock, R.; Wessel, R.; Tamke, M.; Klein, R. Automatic generation of structural building descriptions from 3D point cloud scans. In Proceedings of the 2014 International Conference on Computer Graphics Theory and Applications (GRAPP), Lisbon, Portugal, 5–8 January 2014; pp. 1–8. [Google Scholar]
- Borrmann, D.; Elseberg, J.; Kai, L.; Nüchter, A. The 3D Hough Transform for plane detection in point clouds: A review and a new accumulator design. 3D Res. 2011, 2, 3. [Google Scholar] [CrossRef]
- Okorn, B.; Xiong, X.; Akinci, B.; Huber, D. Toward Automated Modeling of Floor Plans. 2010. Available online: https://ri.cmu.edu/pub_files/2010/5/20093DPVTplanviewmodelingv13(resubmitted).pdf (accessed on 31 December 2019).
- Oesau, S.; Lafarge, F.; Alliez, P. Indoor scene reconstruction using feature sensitive primitive extraction and graph-cut. ISPRS J. Photogramm. Remote Sens. 2014, 90, 68–82. [Google Scholar] [CrossRef] [Green Version]
- Fan, Y.; Wang, M.; Geng, N.; He, D.; Chang, J.; Zhang, J.J. A self-adaptive segmentation method for a point cloud. Vis. Comput. 2018, 34, 659–673. [Google Scholar] [CrossRef]
- Vosselman, G.; Rottensteiner, F. Contextual segment based classification of airborne laser scanner data. ISPRS J. Photogram. Remote Sens. 2017, 128, 354–371. [Google Scholar] [CrossRef]
- Xiong, X.; Adan, A.; Akinci, B.; Huber, D. Automatic creation of semantically rich 3D building models from laser scanner data. Autom. Constr. 2013, 31, 325–337. [Google Scholar] [CrossRef] [Green Version]
- Wolf, D.; Prankl, J.; Vincze, M. Fast Semantic Segmentation of 3D Point Clouds using a Dense CRF with Learned Parameters. In Proceedings of the IEEE International Conference on Robotics and Automation (ICRA), Seattle, WA, USA, 26 May 2015. [Google Scholar]
- Bassier, M.; Vergauwen, M.; Van Genechten, B. Automated Semantic Labelling of 3D Vector Models for Scan-to-BIM. In Proceedings of the 4th Annual International Conference on Architecture and Civil Engineering (ACE 2016), Singapore, 26 April 2016; pp. 93–100. [Google Scholar]
- Nikoohemat, S.; Peter, M.; Oude Elberink, S.; Vosselman, G. Exploiting Indoor Mobile Laser Scanner Trajectories for Semantic Interpretation of Point Clouds. ISPRS Ann. Photogram. Remote Sens. Spat. Inf. Sci. 2017, 355–362. [Google Scholar] [CrossRef] [Green Version]
- Adan, A.; Huber, D. 3D Reconstruction of Interior Wall Surfaces under Occlusion and Clutter. In Proceedings of the 2011 International Conference on 3D Imaging, Modeling, Processing, Visualization and Transmission, Hangzhou, China, 16–19 May 2011; pp. 275–281. [Google Scholar]
- Michailidis, G.T.; Pajarola, R. Bayesian graph-cut optimization for wall surfaces reconstruction in indoor environments. Vis. Comput. 2017, 33, 1347–1355. [Google Scholar] [CrossRef] [Green Version]
- Nguyen, T.; Oloufa, A.; Nassar, K. Algorithms for automated deduction of topological information. Autom. Constr. 2005, 14, 59–70. [Google Scholar] [CrossRef]
- Belsky, M.; Sacks, R.; Brilakis, I. Semantic Enrichment for Building Information Modeling. Comput. Aided Civ. Inf. 2016, 31, 261–274. [Google Scholar] [CrossRef]
- Anagnostopoulos, I.; Belsky, M.; Brilakis, I. Object Boundaries and Room Detection in As-Is BIM Models from Point Cloud Data. In Proceedings of the 16th International Conference on Computing in Civil and Building Engineering, Osaka, Japan, 6–8 July 2016. [Google Scholar]
- Rusu, R.B.; Cousins, S. 3D is here: Point Cloud Library (PCL). In Proceedings of the IEEE International Conference on Robotics and Automation (ICRA), Shanghai, China, 13 May 2011. [Google Scholar]
- Ifcopenshell Team. The Open Source IFC Toolkit and Geometry Engine. Available online: http://ifcopenshell.org/ (accessed on 31 December 2019).
- Liu, C.; Wu, J.; Furukawa, Y. FloorNet: A Unified Framework for Floorplan Reconstruction from 3D Scans. Lect. Notes Comput. Sci. 2018, 203–219. [Google Scholar] [CrossRef] [Green Version]
Figure 1.
Overview of the proposed method that automatically creates a 2D floorplan CAD from unstructured 3D point clouds.
Figure 1.
Overview of the proposed method that automatically creates a 2D floorplan CAD from unstructured 3D point clouds.
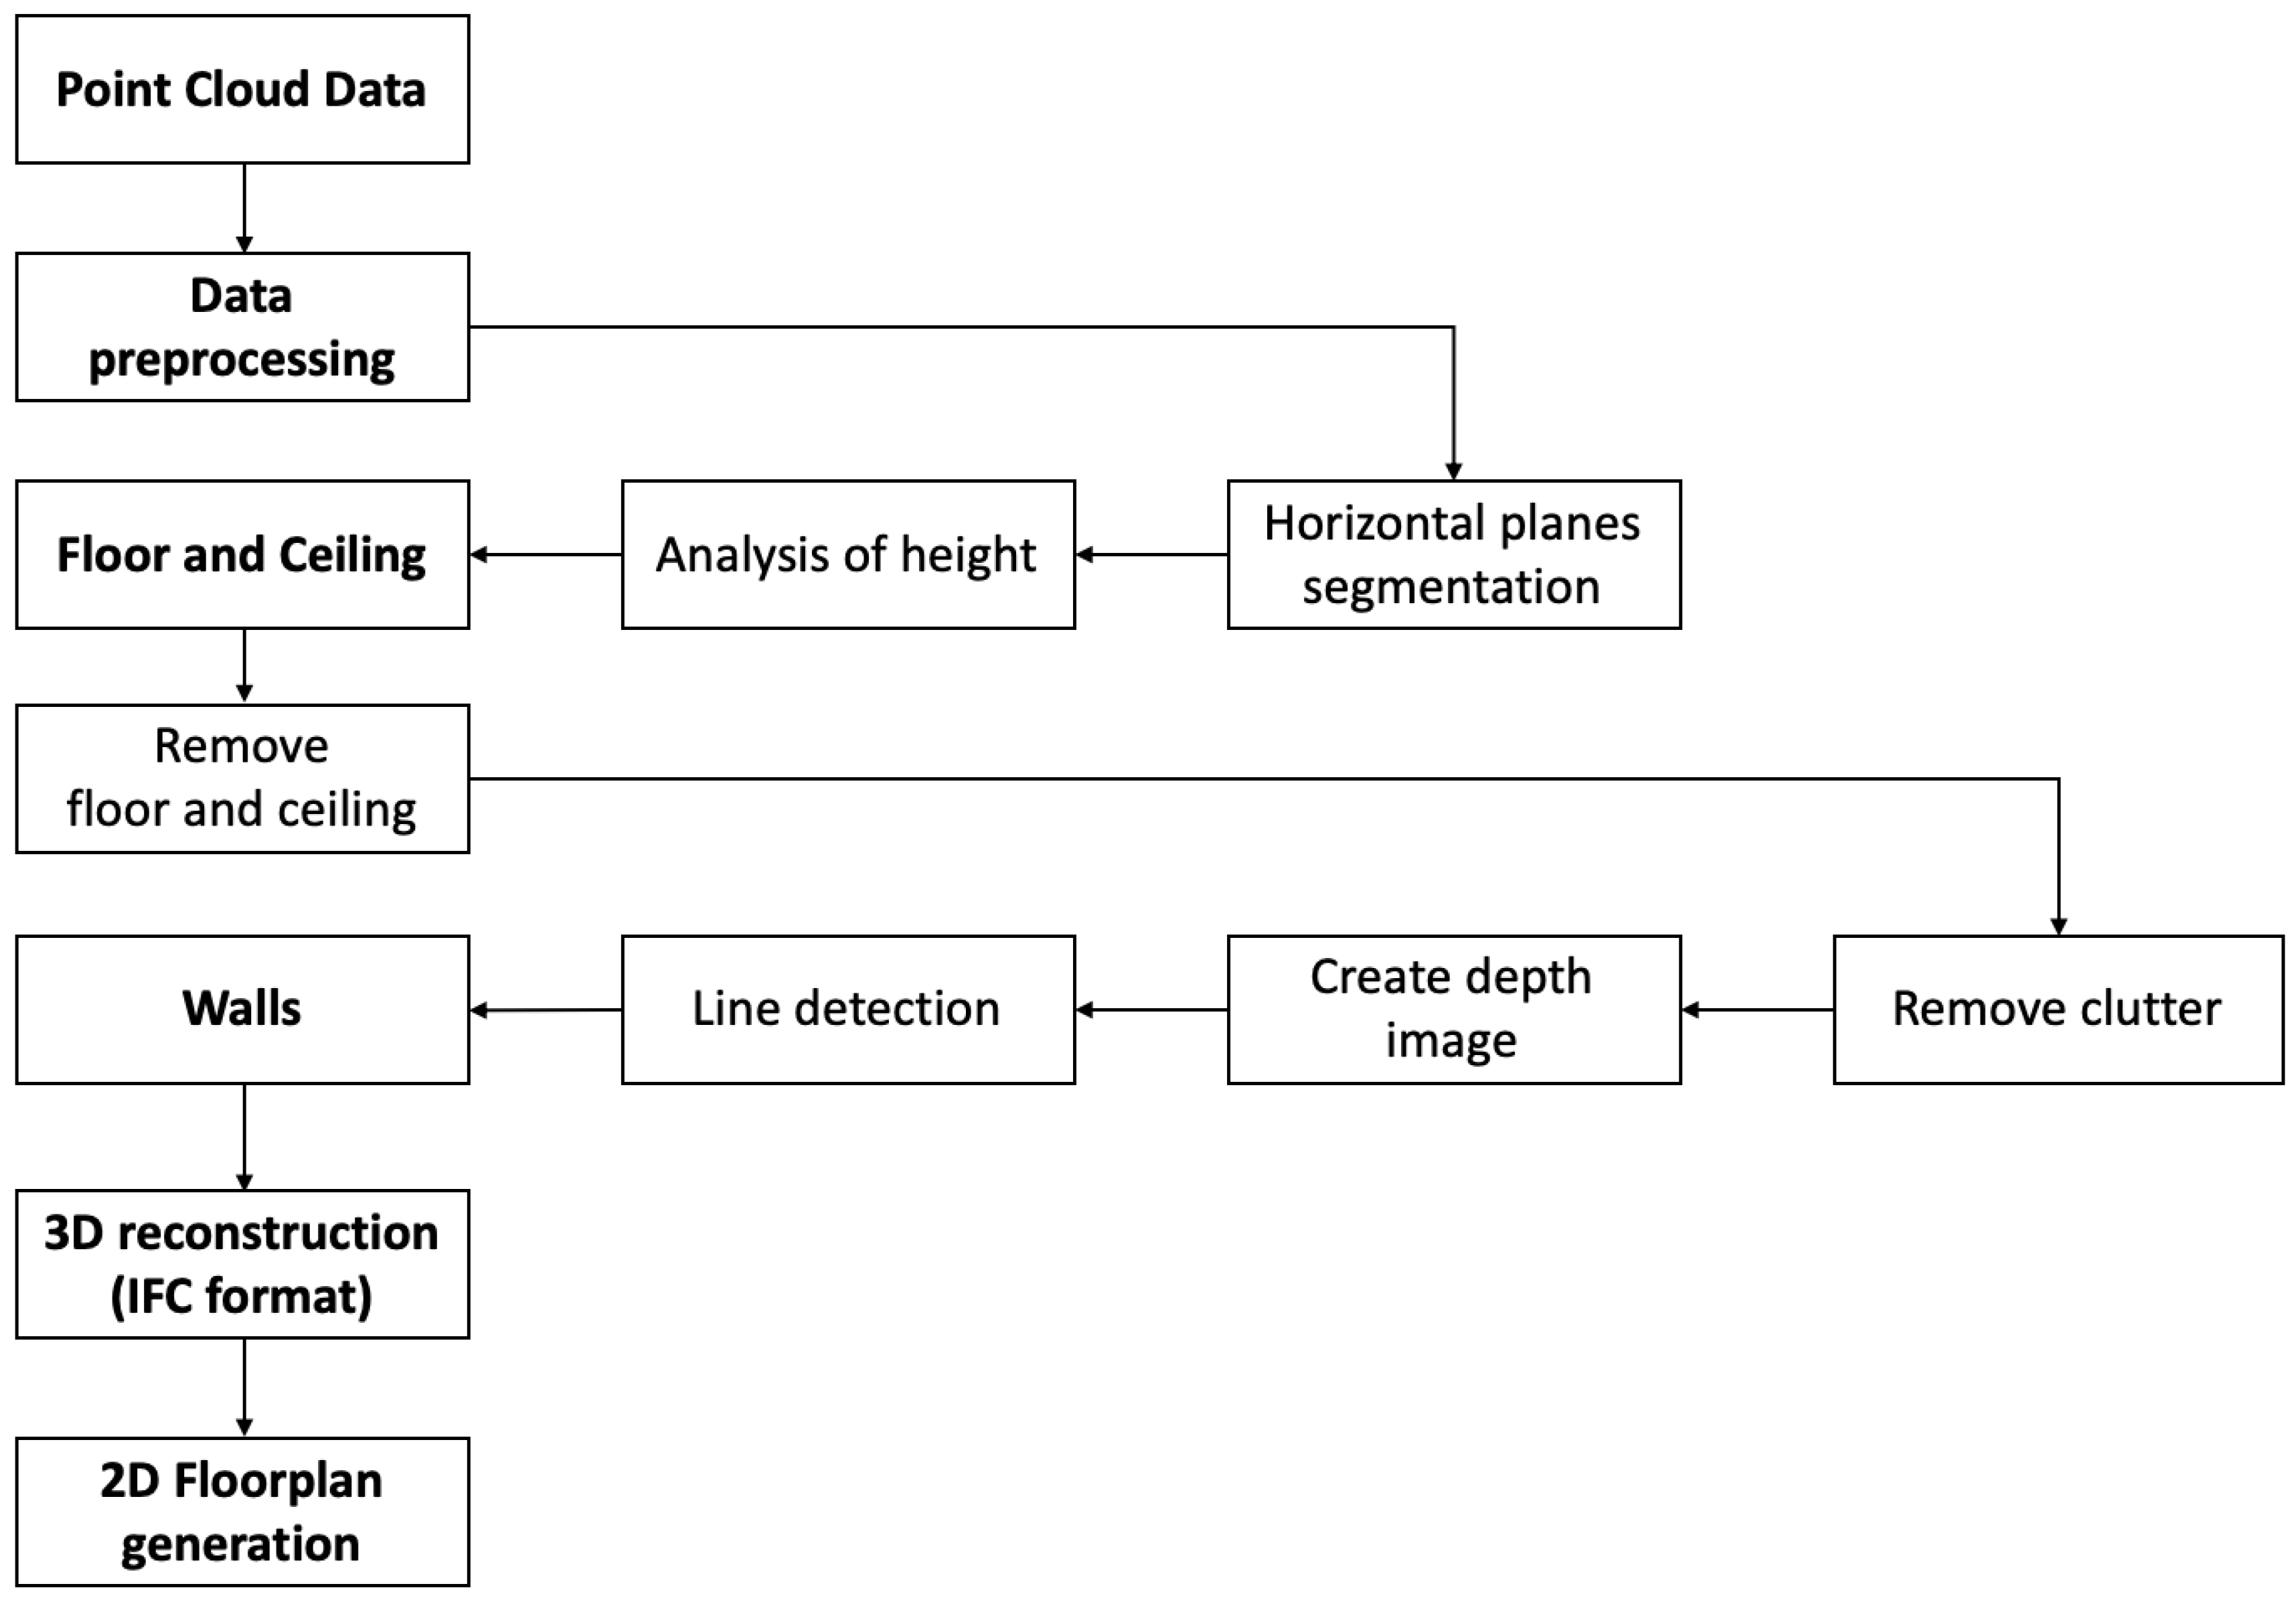
Figure 2.
Result of wall proposal for seventh floor of the Robot Convergence Building at Korea University: (a) 3D point clouds after removing the floor and ceiling, and (b) 3D point clouds of wall proposal planes.
Figure 2.
Result of wall proposal for seventh floor of the Robot Convergence Building at Korea University: (a) 3D point clouds after removing the floor and ceiling, and (b) 3D point clouds of wall proposal planes.
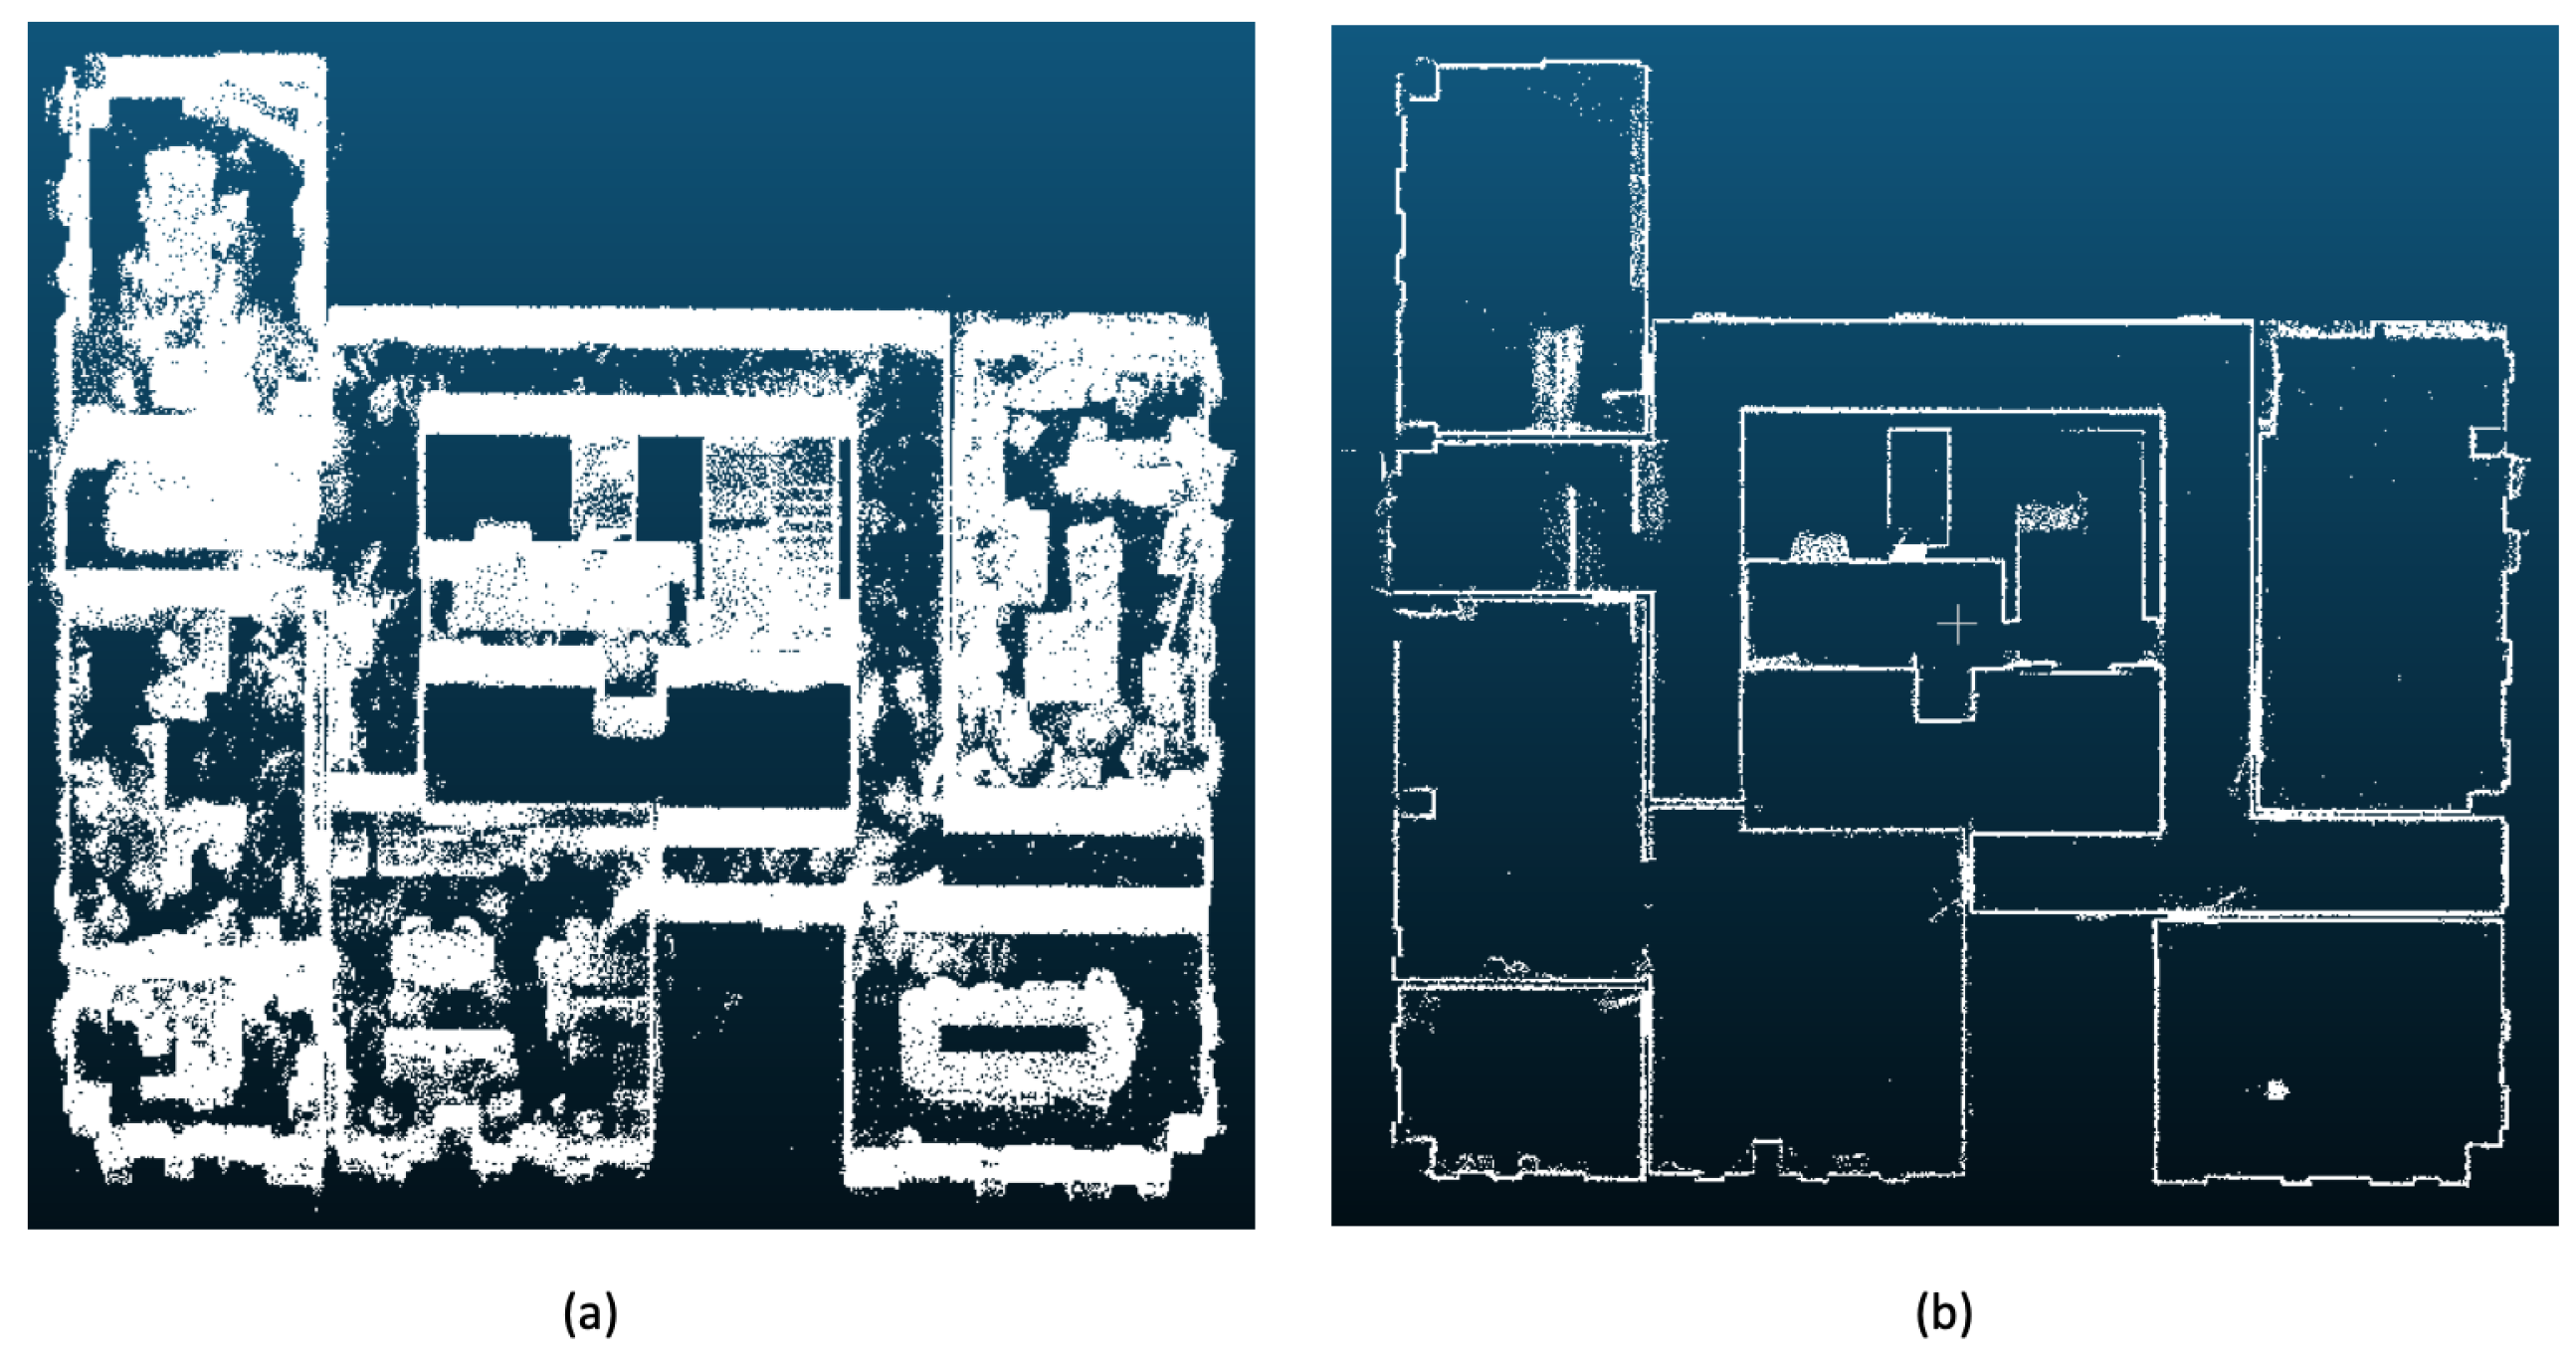
Figure 3.
Result of the wall detection process for seventh floor of the Robot Convergence Building at Korea University: (a) result of the depth image, (b) results of horizontal and vertical lines, and (c) results of walls.
Figure 3.
Result of the wall detection process for seventh floor of the Robot Convergence Building at Korea University: (a) result of the depth image, (b) results of horizontal and vertical lines, and (c) results of walls.
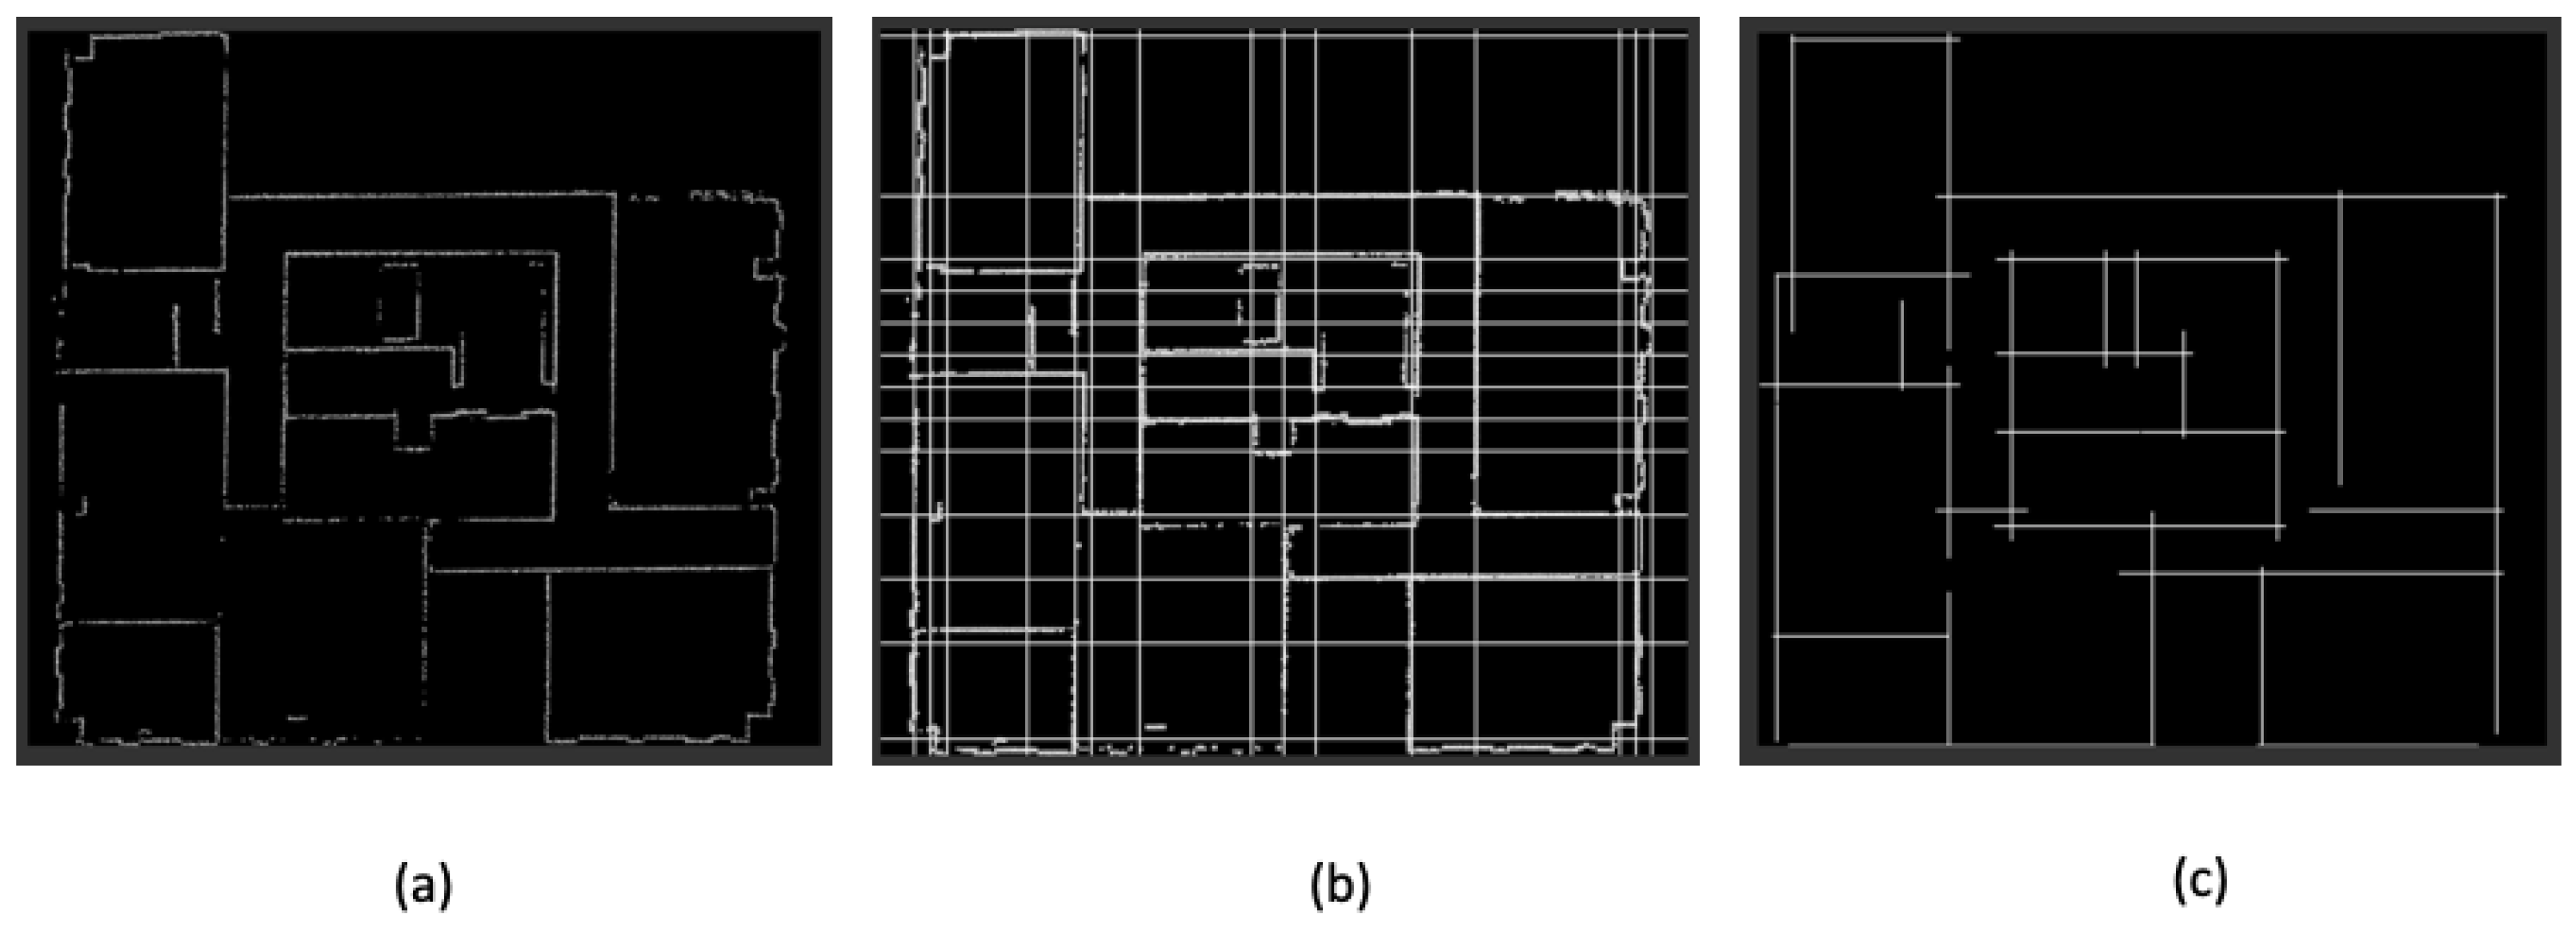
Figure 4.
Input 3D point clouds: (a) seventh floor of the Robot Convergence Building at Korea University, (b) second floor of residential house, (c) Tango Scan-1 and (d) Tango Scan-2.
Figure 4.
Input 3D point clouds: (a) seventh floor of the Robot Convergence Building at Korea University, (b) second floor of residential house, (c) Tango Scan-1 and (d) Tango Scan-2.
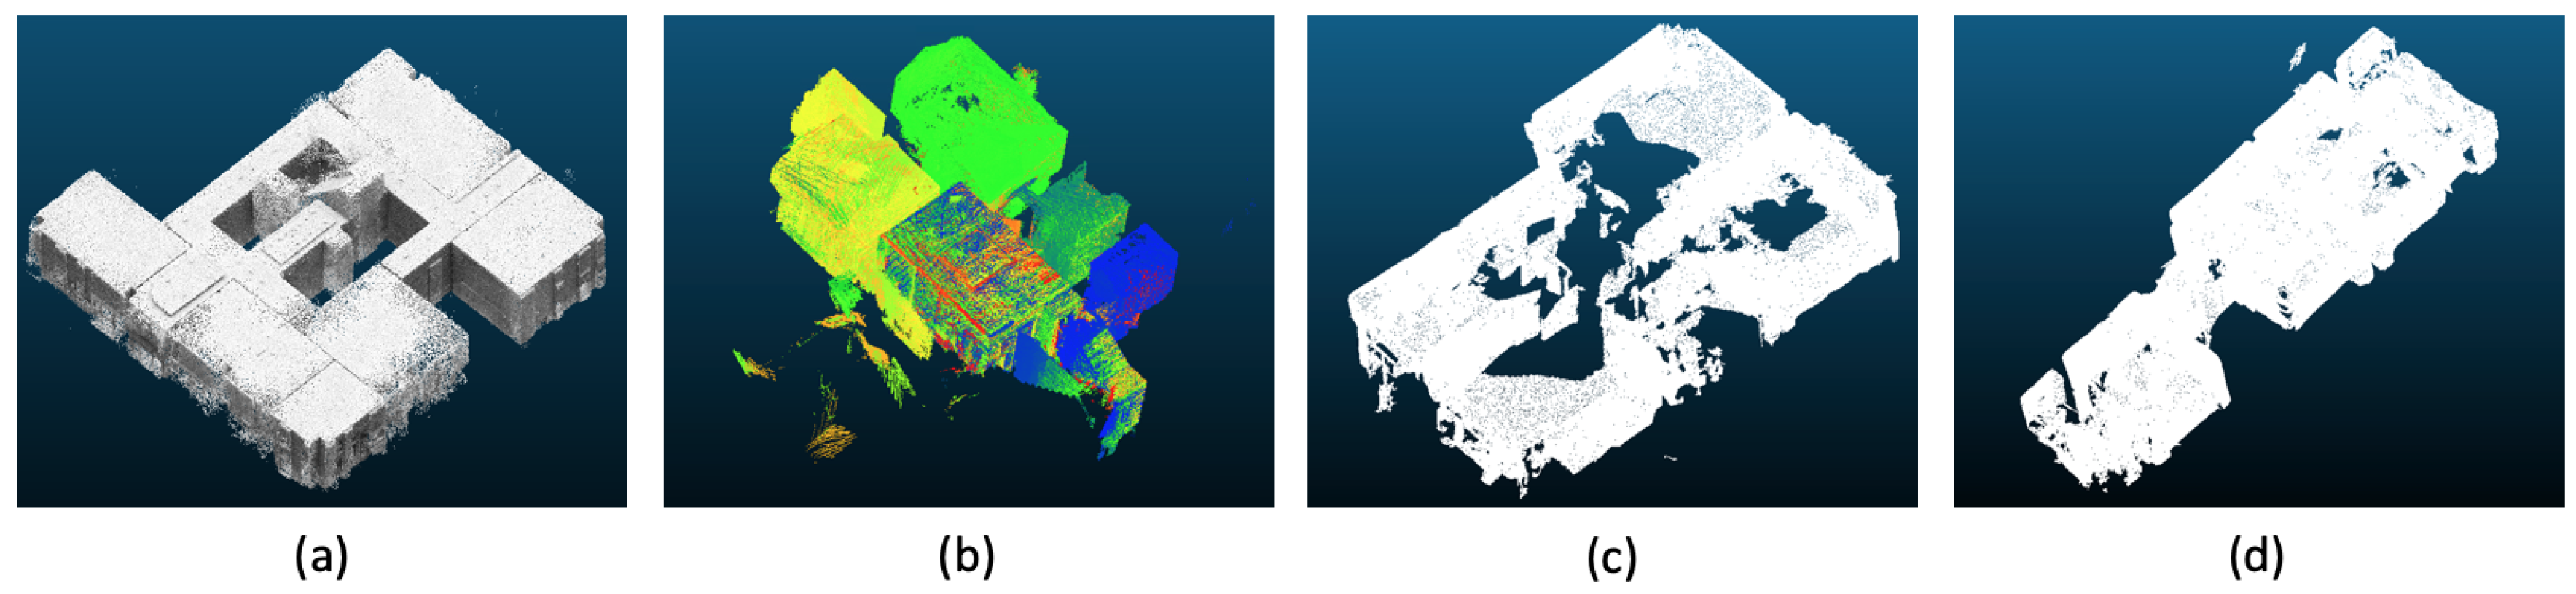
Figure 5.
Result of detected 3D point clouds of the floor and ceiling: (a) floor, and (b) ceiling. Experimented on the seventh floor of the Robot Convergence Building of Korea University dataset.
Figure 5.
Result of detected 3D point clouds of the floor and ceiling: (a) floor, and (b) ceiling. Experimented on the seventh floor of the Robot Convergence Building of Korea University dataset.

Figure 6.
Comparison result of the line-detection algorithms: (a) Hough transform algorithm with post-processing, and (b) the proposed algorithm.
Figure 6.
Comparison result of the line-detection algorithms: (a) Hough transform algorithm with post-processing, and (b) the proposed algorithm.

Table 1.
Details of datasets.
| Dataset | Scanner | # of Rooms | # of Points | Floor Size | Degree of Clutter | Degree of Missing Points |
|---|---|---|---|---|---|---|
| Seventh floor of the Robot Convergence Building of Korea University | ZEB-REVO | 7 | 1,969,106 | 300 m | High | Low |
| Second floor of residential house | Velodyne HDL-32E | 5 | 14,756,398 | 66.6 m | High | High |
| Tango Scan-1 | Google Tango phones | 4 | 1,000,193 | - | Medium | High |
| Tango Scan-2 | Google Tango phones | 5 | 1,000,077 | - | Low | High |
Table 2.
Results of the processing time using the proposed algorithm and the Hough transform algorithm when detecting walls.
Table 2.
Results of the processing time using the proposed algorithm and the Hough transform algorithm when detecting walls.
| Processing Time (s) | |
|---|---|
| Hough transform | 15.7166 |
| Proposed algorithm | 15.6943 |
Table 3.
Wall detection evaluation results.
| Seventh Floor of the Robot Convergence Building of Korea University | Second Floor of Residential House | Tango Scan-1 | Tango Scan-2 | |
|---|---|---|---|---|
| TP | 92.8% | 91% | 92.2% | 97.5% |
| FT | 5.8% | 7.1% | 5.5% | 1.6% |
| FN | 2% | 2.3% | 2.2% | 0.08% |
| Precision | 94% | 92.7% | 94.3% | 98.3% |
| Recall | 97.8% | 97.5% | 97.6% | 99.1% |
Table 4.
Result of the proposed method.
| Dataset | 3D Reconstruction BIM | 2D Floorplan CAD [SVG] |
|---|---|---|
| Seventh floor of the Robot Convergence Building of Korea University |  |  |
| Second floor of residential house | 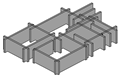 | 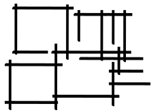 |
| Tango Scan-1 |  |  |
| Tango Scan-2 | 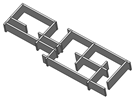 | 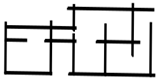 |
© 2020 by the authors. Licensee MDPI, Basel, Switzerland. This article is an open access article distributed under the terms and conditions of the Creative Commons Attribution (CC BY) license (http://creativecommons.org/licenses/by/4.0/).
Share and Cite
MDPI and ACS Style
Gankhuyag, U.; Han, J.-H. Automatic 2D Floorplan CAD Generation from 3D Point Clouds. Appl. Sci. 2020, 10, 2817. https://doi.org/10.3390/app10082817
AMA Style
Gankhuyag U, Han J-H. Automatic 2D Floorplan CAD Generation from 3D Point Clouds. Applied Sciences. 2020; 10(8):2817. https://doi.org/10.3390/app10082817
Chicago/Turabian StyleGankhuyag, Uuganbayar, and Ji-Hyeong Han. 2020. "Automatic 2D Floorplan CAD Generation from 3D Point Clouds" Applied Sciences 10, no. 8: 2817. https://doi.org/10.3390/app10082817
Note that from the first issue of 2016, this journal uses article numbers instead of page numbers. See further details here.