Characteristics of Battery SOC According to Drive Output and Battery Capacity of Parallel Hybrid Electric Vehicle


1
Department of Mechanical Engineering, Graduate School, Soongsil University, Seoul 06978, Korea
2
School of Mechanical Engineering, Soongsil University, Seoul 06978, Korea
*
Author to whom correspondence should be addressed.
Appl. Sci. 2020, 10(8), 2833; https://doi.org/10.3390/app10082833
Submission received: 23 February 2020
/
Revised: 7 April 2020
/
Accepted: 16 April 2020
/
Published: 19 April 2020
(This article belongs to the Special Issue Energy Management Control and Optimization for Hybrid Electric Vehicles)
Abstract
:To mitigate global warming caused by vehicles, emission regulations have been implemented for all automobiles. Hybrid electric vehicles (HEVs) are being designed to meet consumer demand for eco-friendly vehicles that offer increased power and improved fuel efficiency. HEVs are powered by an internal combustion engine (ICE) in combination with one or more electric motors that use electrical energy stored in a secondary battery, which is typically a lithium-based battery. With the use of such a hybrid drivetrain system, the fuel efficiency can be improved over that of conventional ICE vehicles. In this study, we conducted a vehicle-driving experiment to evaluate a transmission-mounted electric device (TMED) type parallel HEV using a chassis dynamometer and on-board diagnostics (OBD) signal-measuring equipment. In addition, we performed a numerical analysis using the CRUISE vehicle simulation code with experimental data. In our analysis, the engine output, which affects the torque of the drive motor, and the capacity (energy density) of the lithium-ion polymer battery were set as variables that affect the fuel-economy performance. As a result of this numerical analysis, a hybrid power-drivetrain model based on CRUISE was developed, and the current balance was evaluated according to the change in the battery capacity. We found that the battery state of charge (SOC) dropped because of a decrease in battery capacity. Thus, we predicted that the lithium-ion battery capacity would be reduced.
1. Introduction
Countries worldwide have begun to impose stringent environmental regulations to mitigate global warming due to greenhouse gases (GHG) such as CO2. In the industrial sector, emissions of pollutants due to road traffic are significant contributors to global warming [1]. Therefore, reducing the fossil fuels consumed by cars is a fundamental solution to overcome the problem of air pollution.
According to a comprehensive assessment report by the Intergovernmental Panel on Climate Change (IPCC), the rate of climate change is expected to accelerate. Studies have indicated that the complete stoppage of fossil-fuel consumption by 2100 is necessary to ensure that the rise in global temperature does not exceed 2 °C [2].
However, despite the imposition of stricter environmental regulations, the control of air pollution in large cities (e.g., Seoul, Beijing, Shanghai, Delhi, Paris, and London) has been inadequate, and governments worldwide have proposed several countermeasures to address this challenge [3].
After the 2015 Paris Agreement, several countries established regulations for average vehicle fuel consumption and CO2 emissions, which are expected to be stringently applied by 2021. Several nations are expected to expand their electric-vehicle (EV) market to strengthen the fuel economy, comply with CO2 regulations, and utilize mandatory new energy vehicle credits [4].
According to IHS Markit, the share of internal combustion engine (ICE) vehicles equipped with pure ICEs or idle stop-and-go (ISG) systems is expected to be less than 50% of the vehicle market by 2031 [5].
In South Korea, the Ministry of Environment has set the goal of having 1 million green vehicles on the road by 2020, including hybrid cars (800,000), electric cars (200,000), and hydrogen-fuel cell vehicles (500) [6]. Therefore, it has become imperative to develop eco-friendly vehicles that meet the consumer demand for increased power and fuel efficiency; such vehicles include hybrid, electric, solar, and hydrogen-fuel cell vehicles, and vehicles that satisfy the emission standards specified by the Ministry of Trade, Industry and Energy (MOTIE) of Korea [7].
Hybrid electric vehicles (HEVs) provide driving power by combining the output of an engine and a motor. The HEV operates under motor power only during starts and low-speed driving. During wheel braking, a secondary-cell battery is charged by regenerative braking, where the motor is transformed into a generator that generates a decelerating load to recover electrical energy. Using a regenerative braking system, the fuel economy can be 40% or more relative to conventional ICE vehicles, and emissions are reduced. At high loads (e.g., during climbing), the engine and motor can operate together to generate high power, achieve high acceleration, and facilitate smooth driving.
The vehicle used in this study is a transmission mounted electric device (TMED)-type parallel HEV in which an electric motor for driving and generating power is installed in front of an automatic transmission without a torque converter. A clutch controls the power between the engine and motor, and the HEV operates in one of the following modes, depending on driving conditions. The “engine-only mode” operates when the state of charge (SOC) of the battery is low or during high-speed driving. In this mode, the energy for vehicle driving is supplied by engine output completely. The “mixed mode” operates during rapid acceleration or with maximum load. In this mode, the internal combustion engine and the electric motor supply driving power to the vehicle simultaneously. The “fixed charging mode” operates when the SOC of the battery is low. In this mode, the engine is used to charge the battery and maintain a constant charge. The “regenerative braking mode” is activated when the vehicle is braking. A portion of the braking force is recovered as electrical energy using the magnetic resistance of the electric motor.
The TMED hybrid vehicle has a mechanical structure with a drive motor built into the transmission, and is independent from the inertial load of the engine when operating in EV mode compared to other full-type hybrids. Therefore, there is a feature in which the driving characteristics of each mode are displayed. As a reference to this study, Shiau et al. [8] constructed a plug-in hybrid electric vehicle (PHEV) simulation model to study the effect of additional batteries on fuel consumption, cost, and GHG emissions at various charge times. Liao et al. [9] proposed a driving motor size for optimal fuel efficiency of two mild HEVs and three strong HEVs in front-wheel drive vehicles. Hofer et al. [10] proposed an analytical solution to find the optimal weight reduction for battery electric vehicles.
Therefore, the full-type hybrid vehicle has been studied in the direction of increasing the battery capacity like the plug-in hybrid vehicle, but the downsizing of the battery capacity for optimization of the full-type hybrid vehicle has not been studied.
The purpose of this study was to analyze the effects of the driving torque and capacity (energy density) of the lithium-ion battery on the fuel economy of a TMED-type parallel hybrid vehicle. Therefore, we first identified the basic characteristics of a HEV operating in an IM240 mode using a chassis dynamometer and signal measuring equipment to collect vehicle data. Subsequently, an analytic model was developed using the CRUISE vehicle simulation code, and a numerical analysis was conducted on the SOC characteristics and current balance according to the driving torque and battery capacity of the HEV.
Related Previous Research
Among studies on HEV rechargeable batteries and their SOC, Cheng et al. [11] investigated a nonlinear-model based on predictive control of the power-management system of a power-split type HEV to improve the fuel efficiency. Zhou et al. [12] studied the effects of lithium-ion battery (LIB) aging on various driving cycles. Moreover, Pilley et al. [13] designed a small, lightweight, and inexpensive battery pack using the design-for-assembly approach. Uddin and Ku [14] proposed a design for an air-cooled battery thermal-management system to predict the temperature distribution in the battery module of mild hybrid vehicles. Zhang and Filipi [15] developed an electrochemical aging model of lithium iron phosphate/graphite (LiFePO4) graphite batteries based on a single particle model. Xu et al. [16] studied charging strategies to evaluate the charging time, effective full-charge capacity, and charging-energy efficiency of LiFePO4 batteries based on the battery internal mechanisms and operating conditions. Feng et al. [17] researched the application of model predictive-control algorithms to improve the fuel economy of power split-type hybrid vehicles. Zhou et al. [18] investigated the effect of SOC limitation on the aging and fuel economy of LIBs. Khan et al. [19] proposed a method for estimating the SOC and state of health (SOH) of LIBs by integrating the current, voltage conversion, and ampere-hour throughput. Sriniwas et al. [20] conducted an experimental study on the development of a state-estimation algorithm for a lead-acid battery. Sharma et al. [21] studied the high-voltage battery-charge state of parallel hybrids using an intelligent predictive-control strategy with path topography. Minarcin and Rask [22] investigated the problems and potential of energy-state estimation, which is directly related to vehicle energy efficiency.
2. Experimental Apparatus and Setup
The HEV driving test was conducted in the IM240 mode. From Figure 1, we note that the IM240 mode was set as the default mode in the experiment. Figure 2 shows the chassis dynamometer (eddy-current dynamometer, Jastec, Sungnam, Korea) and hybrid electric vehicle (2011 YF Sonata HEV, Hyundai Motors) used in the vehicle driving experiment. A PicoScope oscilloscope (Pico Technology, Cambridgeshire, UK) and an on-board diagnostics (OBD)-II monitoring system (Cantalker, D & K Information Communication Technology, Sungnam, Korea) were used to measure the charge and discharge current. Table 1 lists the specifications of the HEV used in the present study.
To measure the current in the LIB available for the hybrid drive motor in real-time, we performed current measurements using high-power battery ammeter clamps (9287 Universal Clamp-on CT, Hioki Co., Japan), as shown in Figure 3a. The ammeter clamps were installed on the wires that connect the high-voltage battery and drive motor. The measured current data were stored in the PicoScope (Pico Technology), shown in Figure 3b, and the charge and discharge statuses were analyzed using the measured data. The OBD signals (engine torque, motor torque, current, gear stage, SOC, and engine speed) were acquired using the Cantalker, which is shown in Figure 3c. Figure 4 shows the overall schematic of the experimental setup employed in this study.
3. Numerical Modeling and Verification
The numerical model for the vehicle in CRUISE software (AVL) used the specifications of a TMED-type HEV, and the reliability of the model was verified by detailed calibration based on the experimental data. Figure 5 shows the numerical model of the TMED-type hybrid vehicle developed for this study. The main components include the lithium-ion battery, gasoline engine, electric motor, and auto transmission module. The voltage of the Li-ion battery was 270V, and its capacity was 1.431 kW·h. The initial SOC value was set to 50% upon considering the control target value of the battery of the TMED-type HEV. The gasoline engine was considered to operate based on the Miller cycle, and the maximum torque was approximately 180 N·m. The drive motor and hybrid starter and generator (HSG) were each operated at 270 V, and the maximum torque values of the motor and HSG were 205 N·m and 43.2 N·m, respectively. The rotational speed of the HSG was 2.4 times the gasoline engine speed.
Table 2 shows the main elements of the HEV model used for the numerical analysis. The curb weight and gross weight of the actual vehicle were entered into the hybrid vehicle model. The elements of the hybrid system controller were from the basic model provided by the CRUISE program. In the data bus, the signals of the driving motor and the generator were modified to be suitable for a TMED-type hybrid vehicle, as shown in Table 3. The specifications of the engine were applied as the actual vehicle values. The engine torque and drive motor elements were applied with correction diagrams, considering the experimental values measured by the dynamometer. The torque values for the engine and the motor were corrected by considering the experimental values.
The torque of the engine and the motor was corrected in consideration of the torque and the rotation speed of the actual experiment obtained in the engine-only mode, EV mode, and hybrid-mixed mode. The gear ratio was adjusted based on the engine torque and RPM data collected in the experiment after entering the specifications of the vehicle.
Figure 6a shows a comparison of the results of the vehicle test in IM240 mode and the numerical simulation in terms of the engine torque. A higher torque was observed in the medium- and high-speed regimes. In addition, the analysis indicates that the torque increases when the engine operation enters the idling stage. We note here that even when the engine clutch disconnected the transmission of power between the engine and motor, the experimental data was collected by disconnection of the signal in the OBD system.
Figure 6b compares the experimental and simulation results in terms of the drive-motor torque. A torque error is observed in specific modes, such as the engine mode. However, a similar pattern is seen in the experiment and simulation throughout the driving process in the IM240 mode. Figure 6c shows the battery SOC throughout the vehicle test in the IM240-mode, and the simulation results are consistent with the experimental results for up to 100 seconds. Subsequently, an error is observed, but the overall SOC charging and discharging trends are similar.
Figure 7 shows a comparison of engine torque and the duration of fuel-injection as functions of engine speed between simulation and experimental results. Torques below 10 Nm near 1600 rpm did not occur due to the setting of the analytical model. By comparing the patterns of the main output required for vehicle driving, the most frequent output was seen at 1600 rpm, and the torque distribution was similar over the range of 800 to 3200 rpm. This comparison indicated that the analysis model was reliable because the engine in the vehicle and the analysis model performed similarly.
Based on the difference in the torque between the 2000-cc and 1600-cc engines, engine outputs that were reduced by 10% and 20% were used as variables in the numerical model. A comparison between the torques of the 1600-cc and 2000-cc engines and the driving-test vehicle torque from the same manufacturer revealed a difference of approximately 20%. The lithium-ion battery capacity is another analysis variable that affects fuel efficiency, and was also reduced by 10% and 20%. These driving torque and battery capacity variables were applied to the numerical analysis, and the scenarios are listed in Table 4 and Table 5.
4. Results and Discussion
4.1. Experiment Results of Power Distribution with Two Driving Modes for TMED-Type Hybrid Vehicle
To understand the driving characteristics of the TMED hybrid vehicle, a driving experiment was performed in the chassis dynamometer with three driving modes, and the results of engine torque, motor torque, and SOC changes are shown in Figure 8. The FTP-75 mode has a longer travel time than the HWFET mode and has various characteristics ranging from low speed to high speed as shown in Figure 8a. The power source of the vehicle is generated by the motor at low speed, and by engine operation or mixed operation of the engine and motor at high speed driving. In this driving condition, the charging of the battery is active due to the harmonious operation of the engine and the motor, thus providing the characteristics of the universally expected full-type hybrid vehicle.
The HWFET mode shown in Figure 8 simulates highway driving. At the beginning of driving, the driving motor operates only up to about 50 s, which is an acceleration section, and when entering the high-speed section, the output of the internal combustion engine plays a major role in driving the vehicle. Since the driving force is supplied to the vehicle by the output of the engine throughout the driving, the extra output to be charged by the regenerative braking of the motor during driving is insignificant, and only the surplus energy due to deceleration during coasting driving is recovered. After all, when driving at a medium speed or higher with a full-type hybrid vehicle, the capacity of the battery and the electric motor are only elements of resistance that hinder the driving of the vehicle.
4.2. Numerical Analysis of Characteristic of SOC and Current Balance with IM240 Mode
Driving torque and battery capacity were applied as variables to the CRUISE model developed in this study. The numerical analysis under the IM240 driving mode yielded the following results for SOC characteristics and current balance.
Figure 9a shows the SOC drop between Phase 1 and Phase 2 for the three engine-torque cases listed in Table 4. This figure illustrates the difference in the battery SOC values between Phase 1 and Phase 2 in the IM240 mode. We note that during Phase 1, the SOC drop is lower than that during Phase 2. During Phase 1, the maximum speed does not reach 60 km/h, and speeds between 30 and 40 km/h account for approximately half of Phase 1. Therefore, the influence of motor driving is dominant, and the effect of reduced engine power is considered to be insignificant compared to that during Phase 2. At low speeds, engine operation is negligible, and the motor operates primarily. The difference in SOC drop was not significantly caused by the energy recovered by the regenerative braking of the drive motor and the advantage of the motor, which is more efficient than the engine.
In Phase 2, the proportion of high-speed driving is higher than in Phase 1, and the engine-operating period is longer. The SOC difference is large at the end of the driving mode due to the increased amount of charging current under the high-torque condition of the engine. The driving force is generated by the motor at speeds up to 30 km/h, but at higher speeds, the engine is also used as a power source. In Case 1, the torque of the engine is relatively high, so the amount of electric energy charged by the engine is higher than in other conditions. The lower the engine torque, the lower the amount of power generated, the lower the charging, and the SOC drop gradually decreases.
Figure 9b shows the SOC drop for the three cases of battery-capacity listed in Table 5 for Phase 1 and Phase 2 in the IM240 mode. As the battery capacity decreases, the SOC drop gradually increases. In particular, Phase 2 consists of a high proportion of high-speed driving, and the increase in SOC drop is larger than in Phase 1. As the engine torque decreases, the SOC drop increase compared to Case 1. As a result, the difference in SOC drop gradually increases due to the reduction in engine torque during Phase 2, which is greatly affected by engine torque. When the capacity of the battery is high, the electrical energy generated by the engine can be smoothly charged to 50% SOC. For efficient battery use, the SOC is charged to near 50%. Therefore, if the battery capacity is small, it is charged to 50% quickly, and the extra electricity cannot be charged. For this reason, the difference in SOC drop during Phase 2 occurs because the change in torque is more significant than the change in battery capacity.
Figure 10a shows the SOC drop after completing of the entire driving cycle in the IM240 and FTP-75 modes. The FTP-75 mode has a longer driving time (approximately eight times longer) and a higher proportion of high-speed driving than the IM240 mode. Consequently, the load of the drive motor increases as engine power decreases, which increases the consumption of electrical energy. Therefore, the SOC drop is very sharp during the FTP-75 mode. The amount of electrical energy charged with lower levels of engine torque is predicted to decrease, and the SOC drop is more likely to occur as mileage increases. To maintain a constant SOC under conditions when the engine torque is decreasing, the fuel efficiency can be improved by applying a strategy of artificially operating the engine at optimum efficiency. The SOC drop due to a reduction in engine torque is expected to increase as mileage increases. To maintain the battery SOC constant, the length of time when the engine operates as a generator must be increased.
Figure 10b shows the SOC drop due to a reduction in the lithium-ion battery capacity during the IM240 and FTP-75 modes. The observed differences in SOC drop between the two modes were less than those observed when engine torque was reduced. When the battery capacity decreases by 20%, the difference in the SOC drop between the IM240 and FTP-75 modes is approximately 2.66%. In other words, because the test modes correspond to shorter distances than would be driven in practice, this difference in SOC drop may be remarkable. The differences in SOC drop converge with reduced battery capacity, which suggests the capacity of the LIBs mounted in the test vehicle could be reduced. Additionally, by considering the battery life, if the battery SOC can be higher than 50%, then performance equal to that achieved currently can be realized with lower battery capacity.
Figure 11 shows the relationship between the current balance and SOC according to the change in engine torque between the IM240 and FTP-75 modes. In the IM240 mode, which corresponds to a relatively short driving period, the results are located in the first quadrant and gradually move closer to the origin as the engine torque decreases. The electrical energy consumption tends to increase gradually.
In the FTP-75 mode, the motor torque rapidly decreases and locates in the third quadrant. The maximum decrease in SOC is approximately −11% relative to the initial SOC because the driving time is relatively long and the frequency of motor use at medium and low speeds increases. Also, because the engine torque decreases as the drive-motor ratio increases, the amount of charge during power generation is reduced, which tends to move in three quarters compared with the IM240 mode significantly. As mentioned above, an intermittent operation is required at the optimum efficiency of the internal combustion engine to maintain a constant SOC.
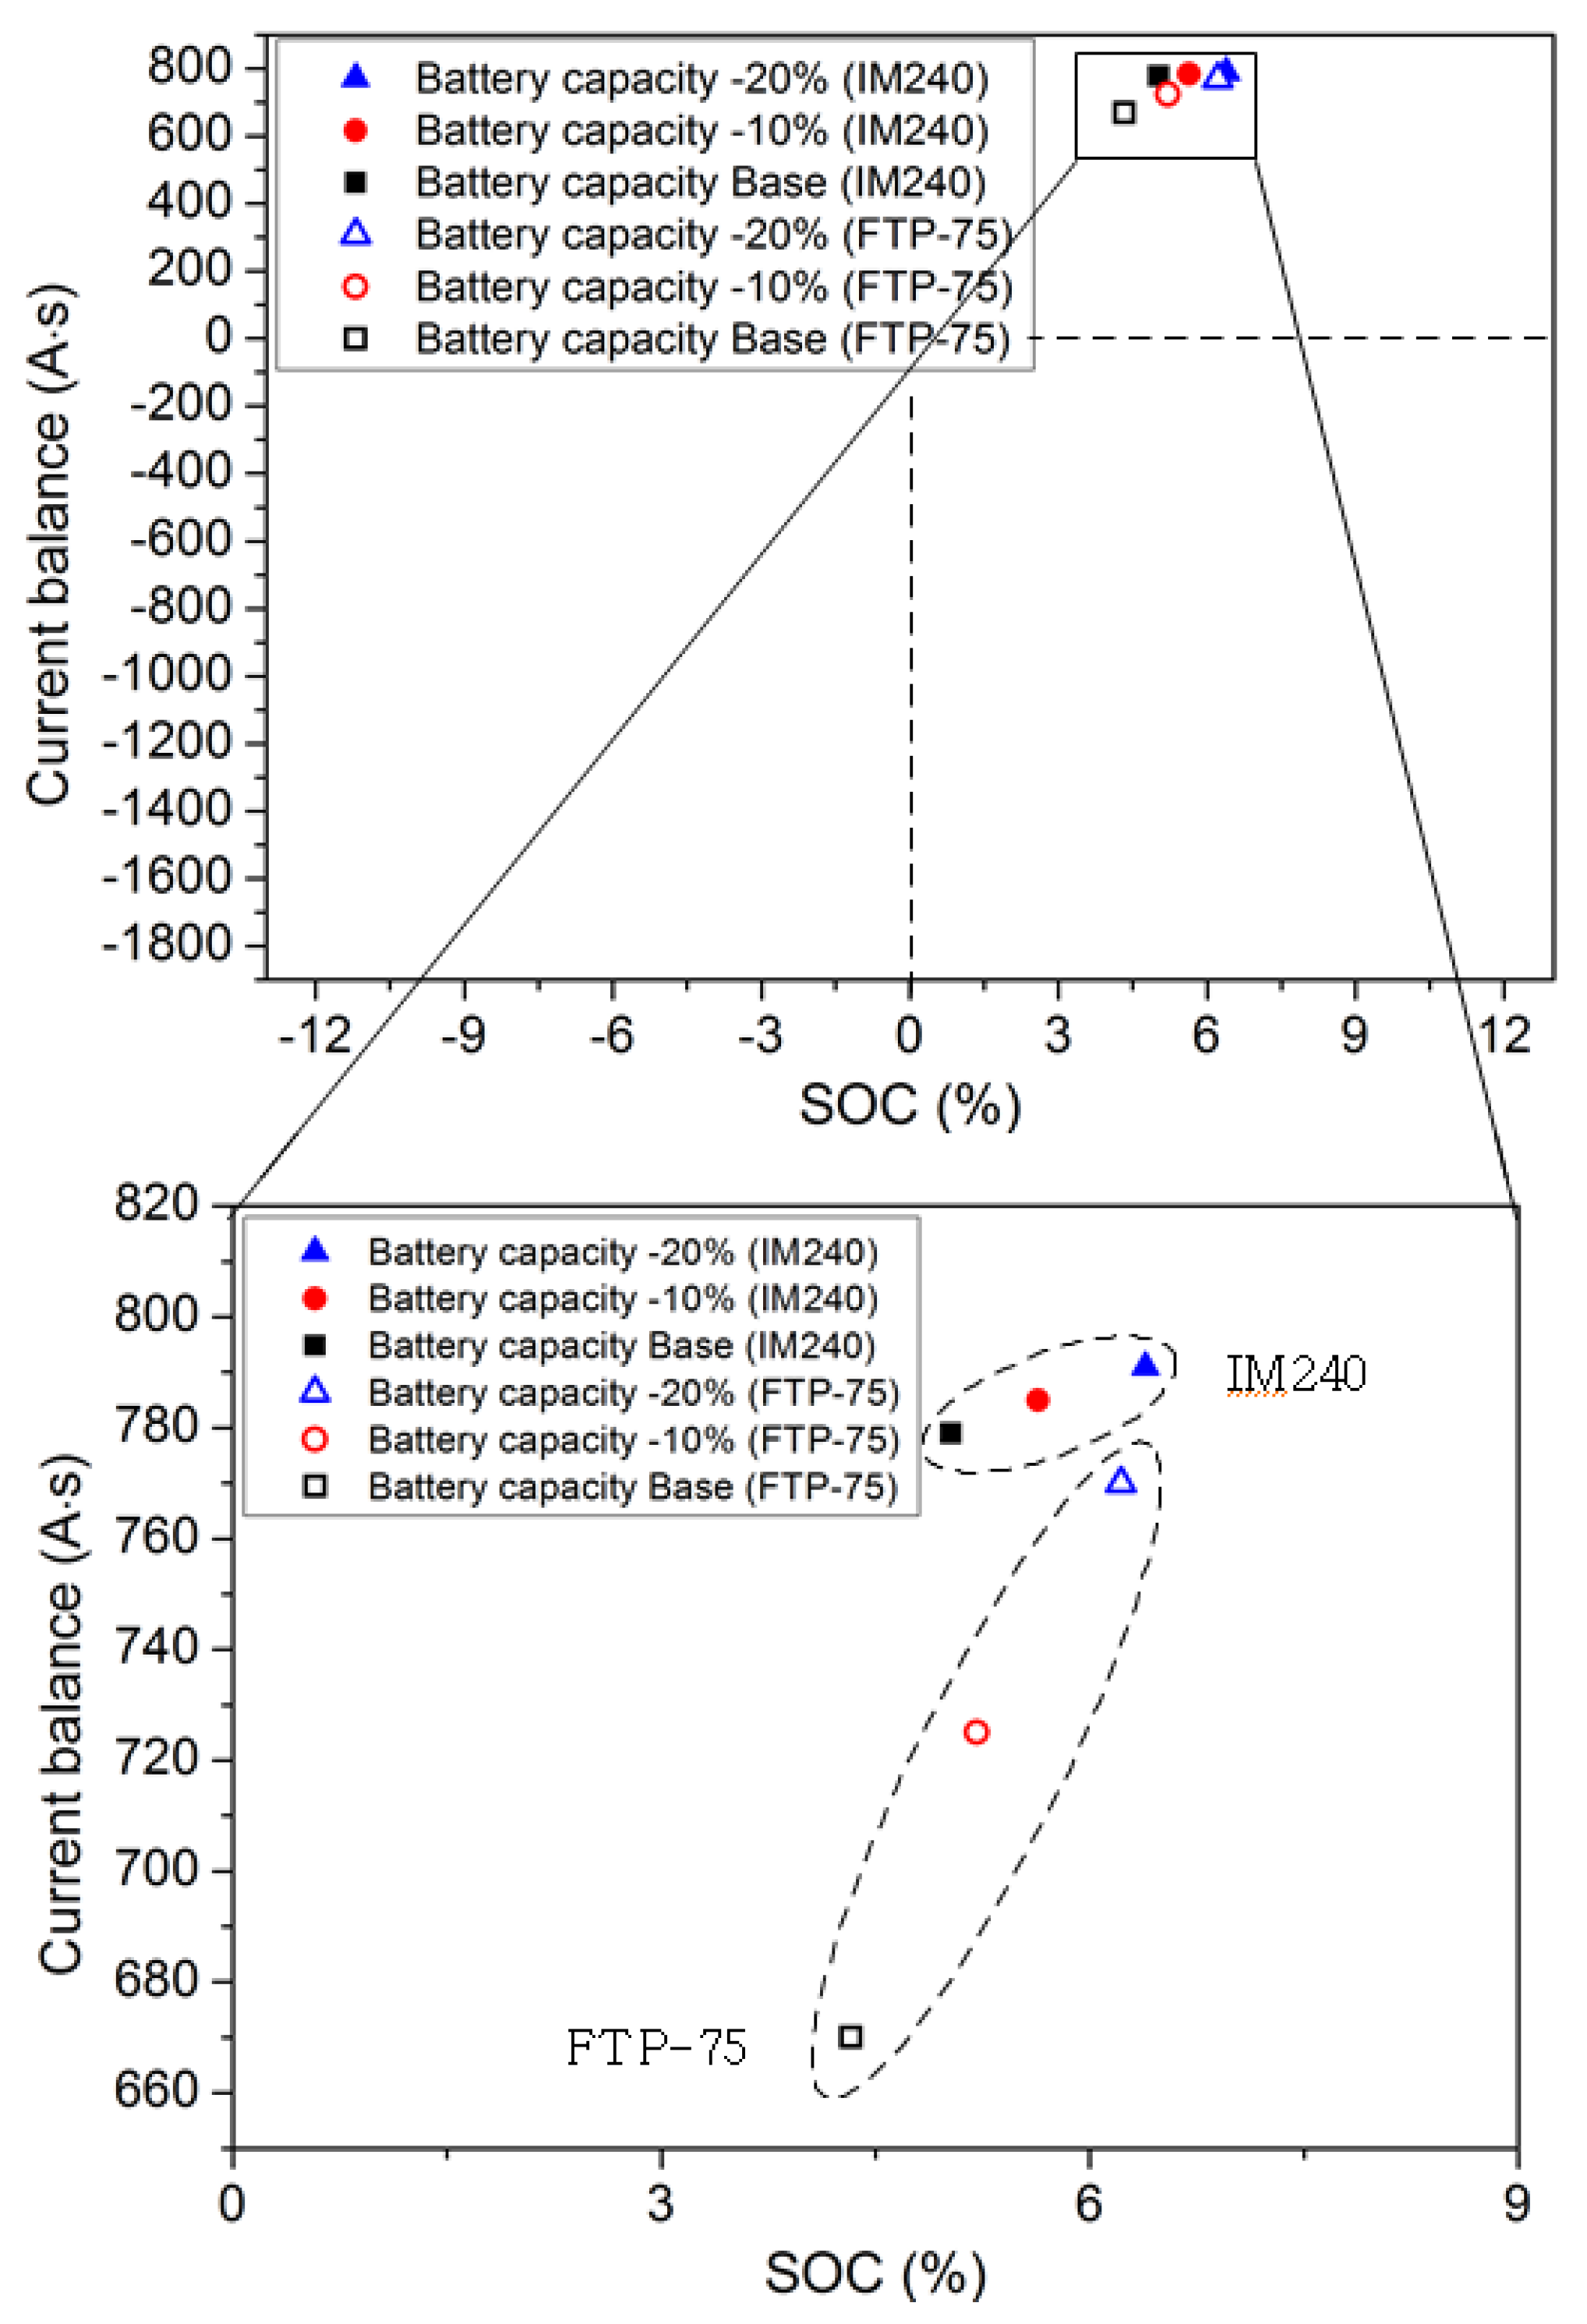
Figure 12 shows the relationship between the current balance and SOC according to changes in the battery capacity during IM240 and FTP-75 modes. For both driving modes, the SOC values are located in the first quadrant, but the trend in current-balance values as the battery capacity changes shows that that the IM240 mode affords a more gradual change in both SOC and current balance. However, we observe that the SOC values are no relatively big difference between modes when the battery capacity is reduced by 20%, and the difference is less than 3%, which corresponds to a relatively low sensitivity to battery capacity. By using a variety of strategies (e.g., downsizing, engine operation mode, limiting, SOC increase) to compensate for the SOC drop, HEVs can be designed to operate at lower battery capacities.
5. Conclusions
The aim of this study was to analyze SOC characteristics by setting the driving output and capacity of the lithium-ion battery as parameters of the TMED-type parallel HEV. We first conducted driving tests on a TMED-type parallel HEV using a chassis dynamometer and signal-measuring equipment. Subsequently, we developed a numerical simulation model using CRUISE vehicle simulation code and the acquired experimental data. The driving torque and capacity (energy density) of the lithium-ion battery, which are factors that influence fuel economy, were set as variables in this model. From our numerical analysis, we drew the following conclusions regarding the SOC characteristics and current balance of the lithium-ion battery.
- At low-speeds, there is negligible engine operation, and the motor operates primarily. The difference in SOC drop was not significantly caused by the energy recovered by the regenerative braking of the drive motor and the advantage of the motor, which is more efficient than the engine.
- For efficient battery use, SOC is charged to near 50%. Therefore, if the battery capacity is small, it is charged to 50% quickly, and the extra electricity cannot be charged. For this reason, the difference in SOC drop occurs because the change in torque is more significant than the change in battery capacity.
- When the battery capacity is reduced by 20%, the SOC between the IM240 and FTP-75 modes differs by 3% only. By using a variety of strategies (e.g., downsizing, engine operation strategy, SOC increase) to compensate for the SOC drop, it will be possible to operate HEVs at lower battery capacities.
Author Contributions
I.C. conducted the HEV vehicle experiment to acquire data, arranged and analyzed the data, and wrote the paper; J.L. supervised the study and provided advice on all aspects of the preparation of this paper. All authors have read and agreed to the published version of the manuscript.
Funding
This research was supported by the R&D project on Industrial Core Technology of MOTIE (Ministry of Trade, Industry and Energy) in the Republic of Korea.
Conflicts of Interest
The authors declare no conflict of interest.
References
- Ministry of Environment. Available online: https://www.me.go.kr/mamo/web/index.do?menuId=590 (accessed on 18 July 2019).
- Ministry of Environment. 2014; Volume 4. Available online: http://www.me.go.kr/home/file/readDownloadFile.do?fileId=110646&fileSeq=1&openYn=Y (accessed on 18 July 2019).
- Won, H.W. The emissions legislation and developments of road transport technology in Europe. J. Korean Soc. Automot. Eng. 2017, 39, 16–20. [Google Scholar]
- Jang, B.H. Available online: www.itfind.or.kr/admin/getFile.htm?identifier=02-004-180503-000008 (accessed on 18 July 2019).
- Wall, M. Automotive Industry Outlook: Managing Volatility and Leveraging Opportunities in a Dynamic Market Environment; IHS Markit: London, UK, 2019. [Google Scholar]
- Ministry of Trade, Industry and Energy. Act on Promotion of Development and Distribution of Environment-Friendly Motor Vehicles; Ministry of Trade, Industry and Energy: Sejong, Korea, 2019.
- Ministry of Environment. 2018. Available online: http://www.me.go.kr/home/web/board/read.do;jsessionid=hy9zwcQQzELS5+kNFYM+T1wd.mehome2?pagerOffset=0&maxPageItems=10&maxIndexPages=10&searchKey=&searchValue=&menuId=10181&orgCd=&boardId=922990&boardMasterId=54&boardCategoryId=&decorator= (accessed on 18 July 2019).
- Shiau, C.; Samaras, C.; Hauffe, R.; Michalek, J. Impact of battery weight and charging patterns on the economic and environmental benefits of plug-in hybrid vehicles. Energy Policy 2009, 37, 2653–2663. [Google Scholar] [CrossRef]
- Liao, Y.; Allen, M.; Quail, J. Traction motor sizing for optimal fuel economy in propulsion hybridization. Open Mech. Eng. J. 2012, 6, 1–11. [Google Scholar] [CrossRef] [Green Version]
- Hofer, J.; Wilhelm, E.; Schenler, W. Optimal light weighting in battery electric vehicles. World Electr. Veh. J. 2012, 5, 751–762. [Google Scholar] [CrossRef] [Green Version]
- Cheng, M.; Feng, L.; Chen, B. Nonlinear Model Predictive Control of a Power-Split Hybrid Electric Vehicle with Electrochemical Battery Model; SAE Technical Paper 2017-01-1252; SAE International: Warrendale, PA, USA, 2017. [Google Scholar]
- Zhou, B.; Burl, J.; Rezaei, A. Hybrid Electric Vehicle Battery Aging Estimation and Economic Analysis Based on Equivalent Consumption Minimization Strategy; SAE Technical Paper 2017-01-1251; SAE International: Warrendale, PA, USA, 2017. [Google Scholar]
- Pilley, S.; Morkos, B.; Alfalahi, M. Integration and Modularity Analysis for Improving Hybrid Vehicles Battery Pack Assembly; SAE Technical Paper 2018-01-0438; SAE International: Warrendale, PA, USA, 2018. [Google Scholar]
- Uddin, A.; Ku, J. Design and Simulation of Lithium-Ion Battery Thermal Management System for Mild Hybrid Vehicle Application; SAE Technical Paper 2015-01-1230; SAE International: Warrendale, PA, USA, 2015. [Google Scholar]
- Zhang, X.; Filipi, Z. Computationally Efficient Li-Ion Battery Aging Model for Hybrid Electric Vehicle Supervisory Control Optimization; SAE Technical Paper 2017-01-0274; SAE International: Warrendale, PA, USA, 2017. [Google Scholar]
- Xu, X.; Wei, X.; Gao, H.; Zhu, J.; Yang, J.; Liu, Y. Research on Charging Strategy of Lithium-Ion Battery; SAE Technical Paper 2015-01-1192; SAE International: Warrendale, PA, USA, 2015. [Google Scholar]
- Feng, L.; Cheng, M.; Chen, B. Predictive Control of a Power-Split HEV with Fuel Consumption and SOC Estimation; SAE Technical Paper 2015-01-1161; SAE International: Warrendale, PA, USA, 2015. [Google Scholar]
- Zhou, B.; Burl, J.; Rezaei, A. Effect of State of Charge Constraints on Fuel Economy and Battery Aging when Using the Equivalent Consumption Minimization Strategy; SAE Technical Paper 2018-01-1002; SAE International: Warrendale, PA, USA, 2018. [Google Scholar]
- Khan, K.; Zhou, B.; Rezaei, A. Real Time Application of Battery State of Charge and State of Health Estimation; SAE Technical Paper 2017-01-1199; SAE International: Warrendale, PA, USA, 2017. [Google Scholar]
- Sriniwas, A.; Katyamandali, H.; Jarubula, P.; Nandagopalan, C.; Prabaharan, P. Experimental Analysis of Lead Acid Batteries for Estimating State of Charge and State of Health; SAE Technical Paper 2013-01-2742; SAE International: Warrendale, PA, USA, 2013. [Google Scholar]
- Sharma, D.; Reghunath, S.; Athreya, A. Dynamic Reserve Energy Storage for Hybrid Vehicle Fuel Economy Improvement; SAE Technical Paper 2015-26-0117; SAE International: Warrendale, PA, USA, 2015. [Google Scholar]
- Minarcin, M.; Rask, E. Considerations in estimating battery energy for hybrid and electric vehicles. SAE Int. J. Alt. Powertrains 2012, 1, 144–159. [Google Scholar] [CrossRef]
Figure 1.
IM240-mode profile.
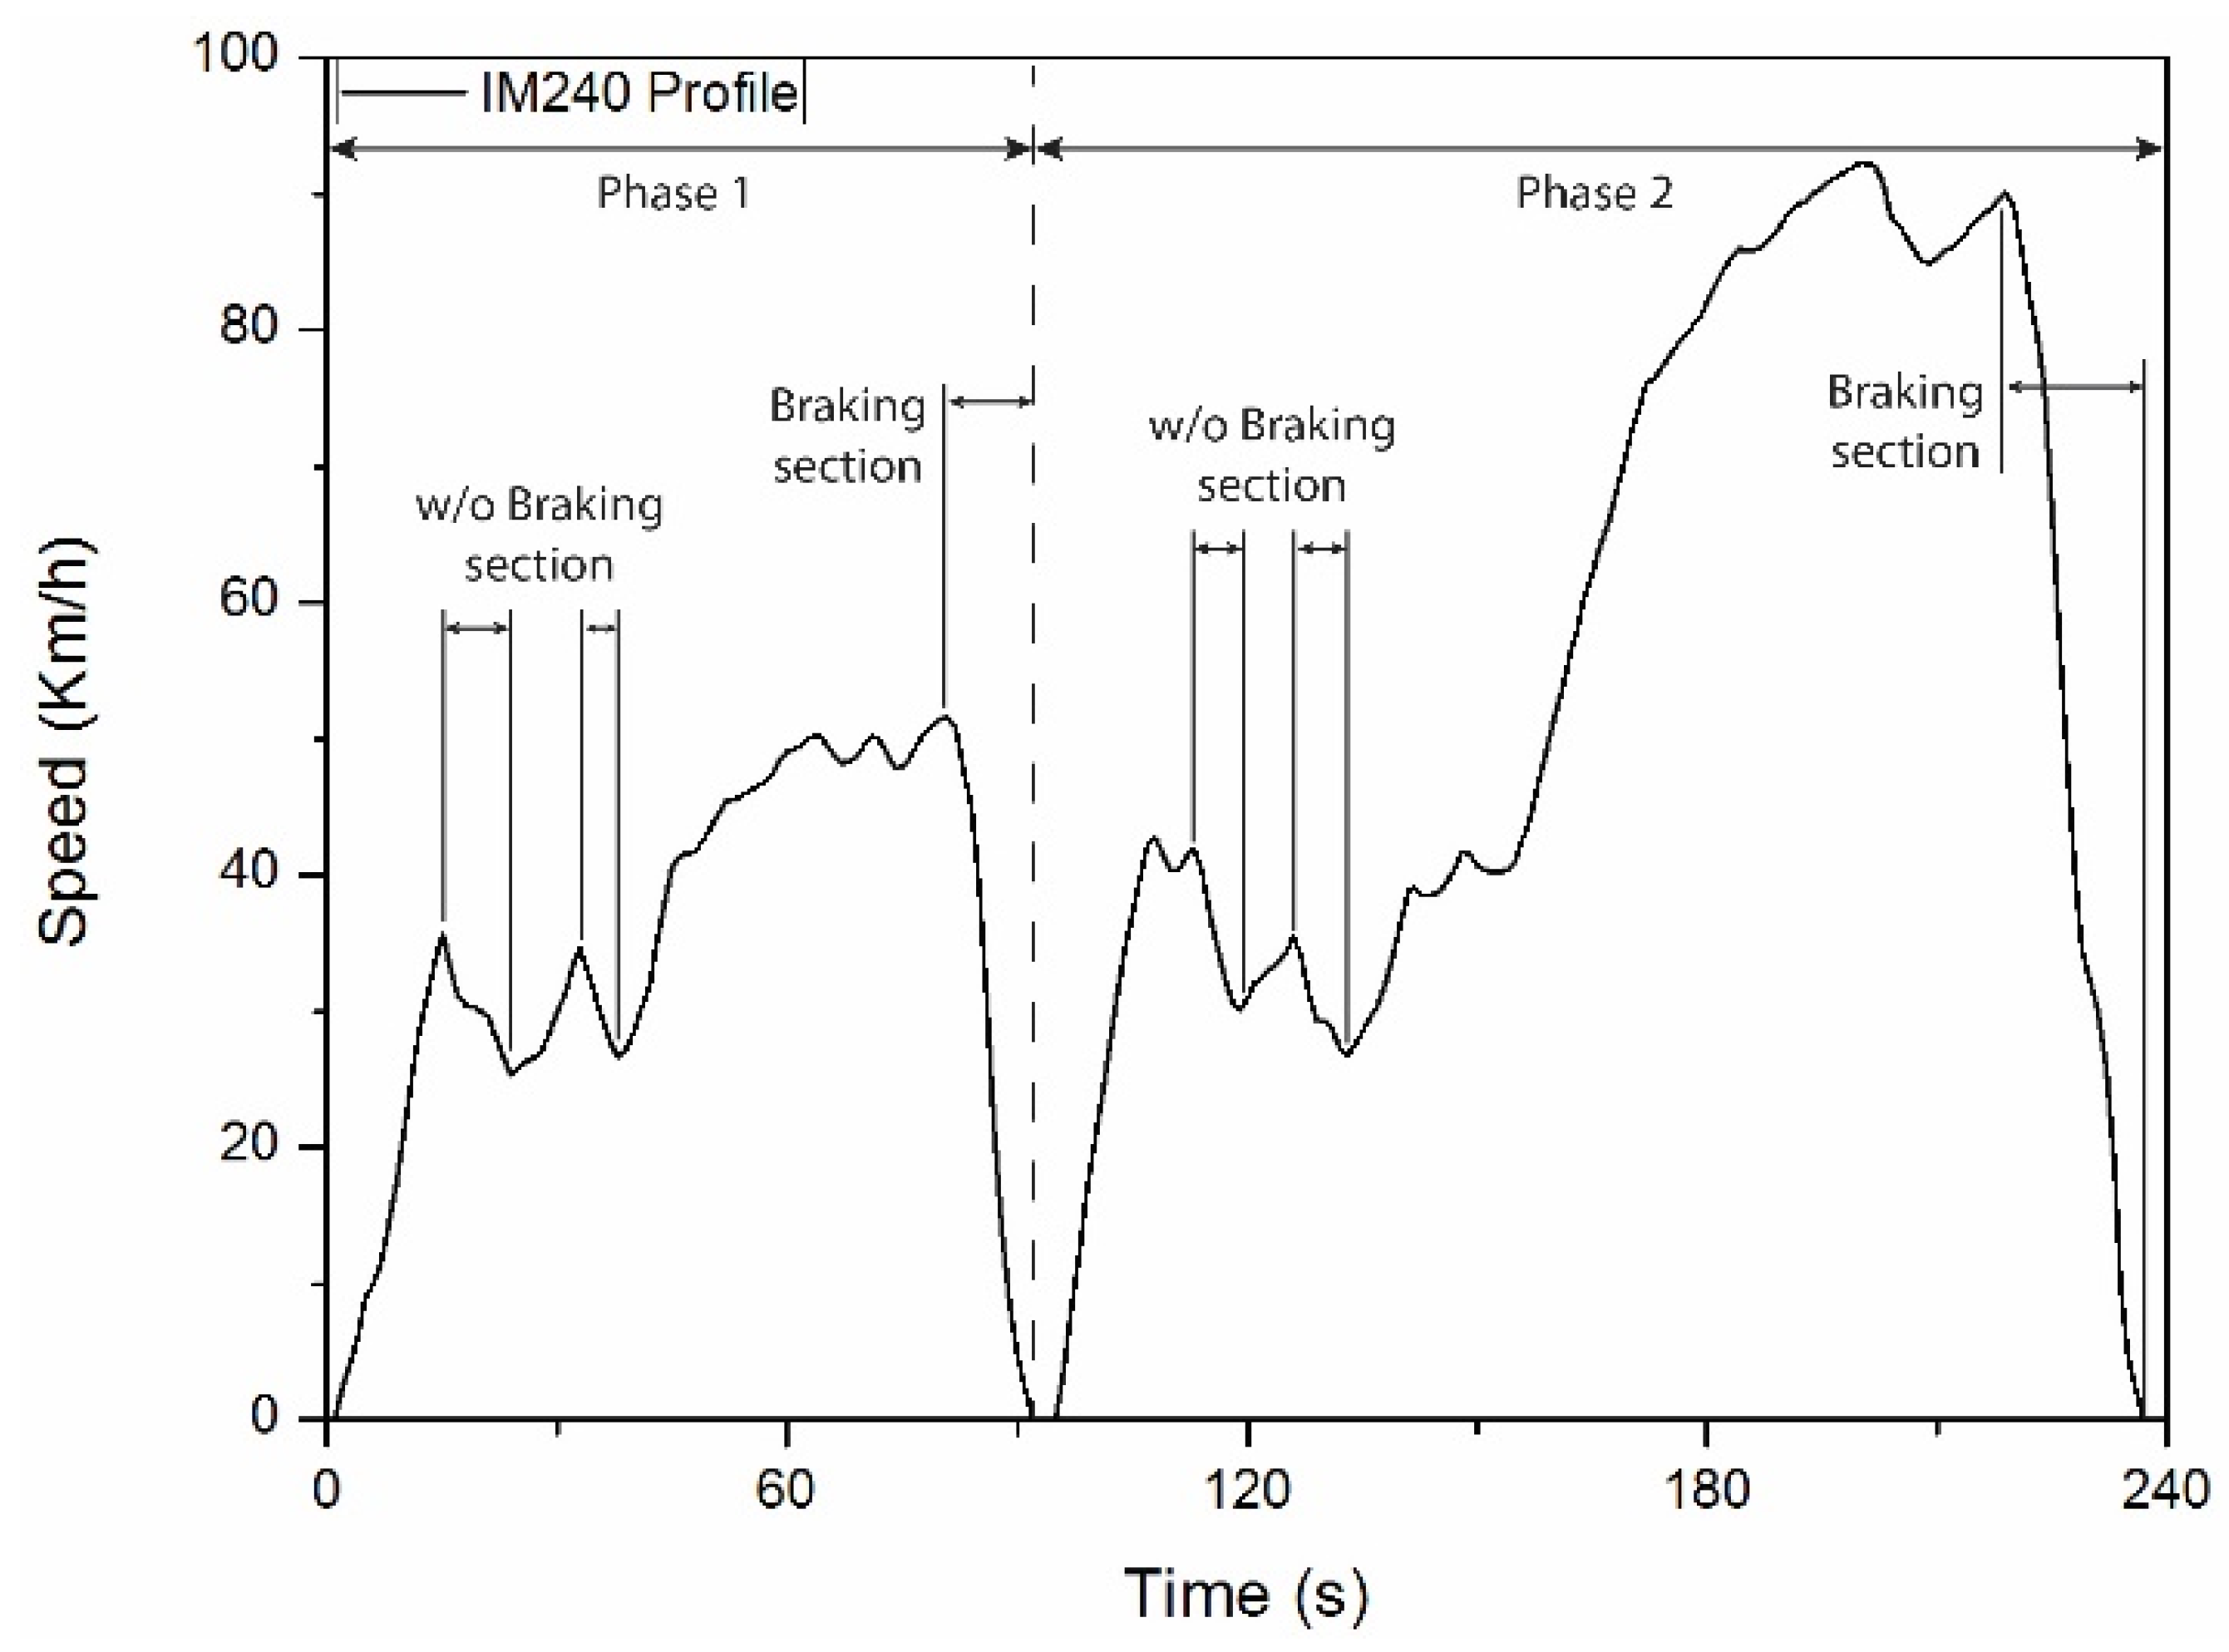
Figure 2.
Parallel type hybrid electric vehicle and chassis dynamometer.

Figure 3.
Data acquisition devices: (a) Ammeter clamp; (b) PicoScope; (c) Cantalker.
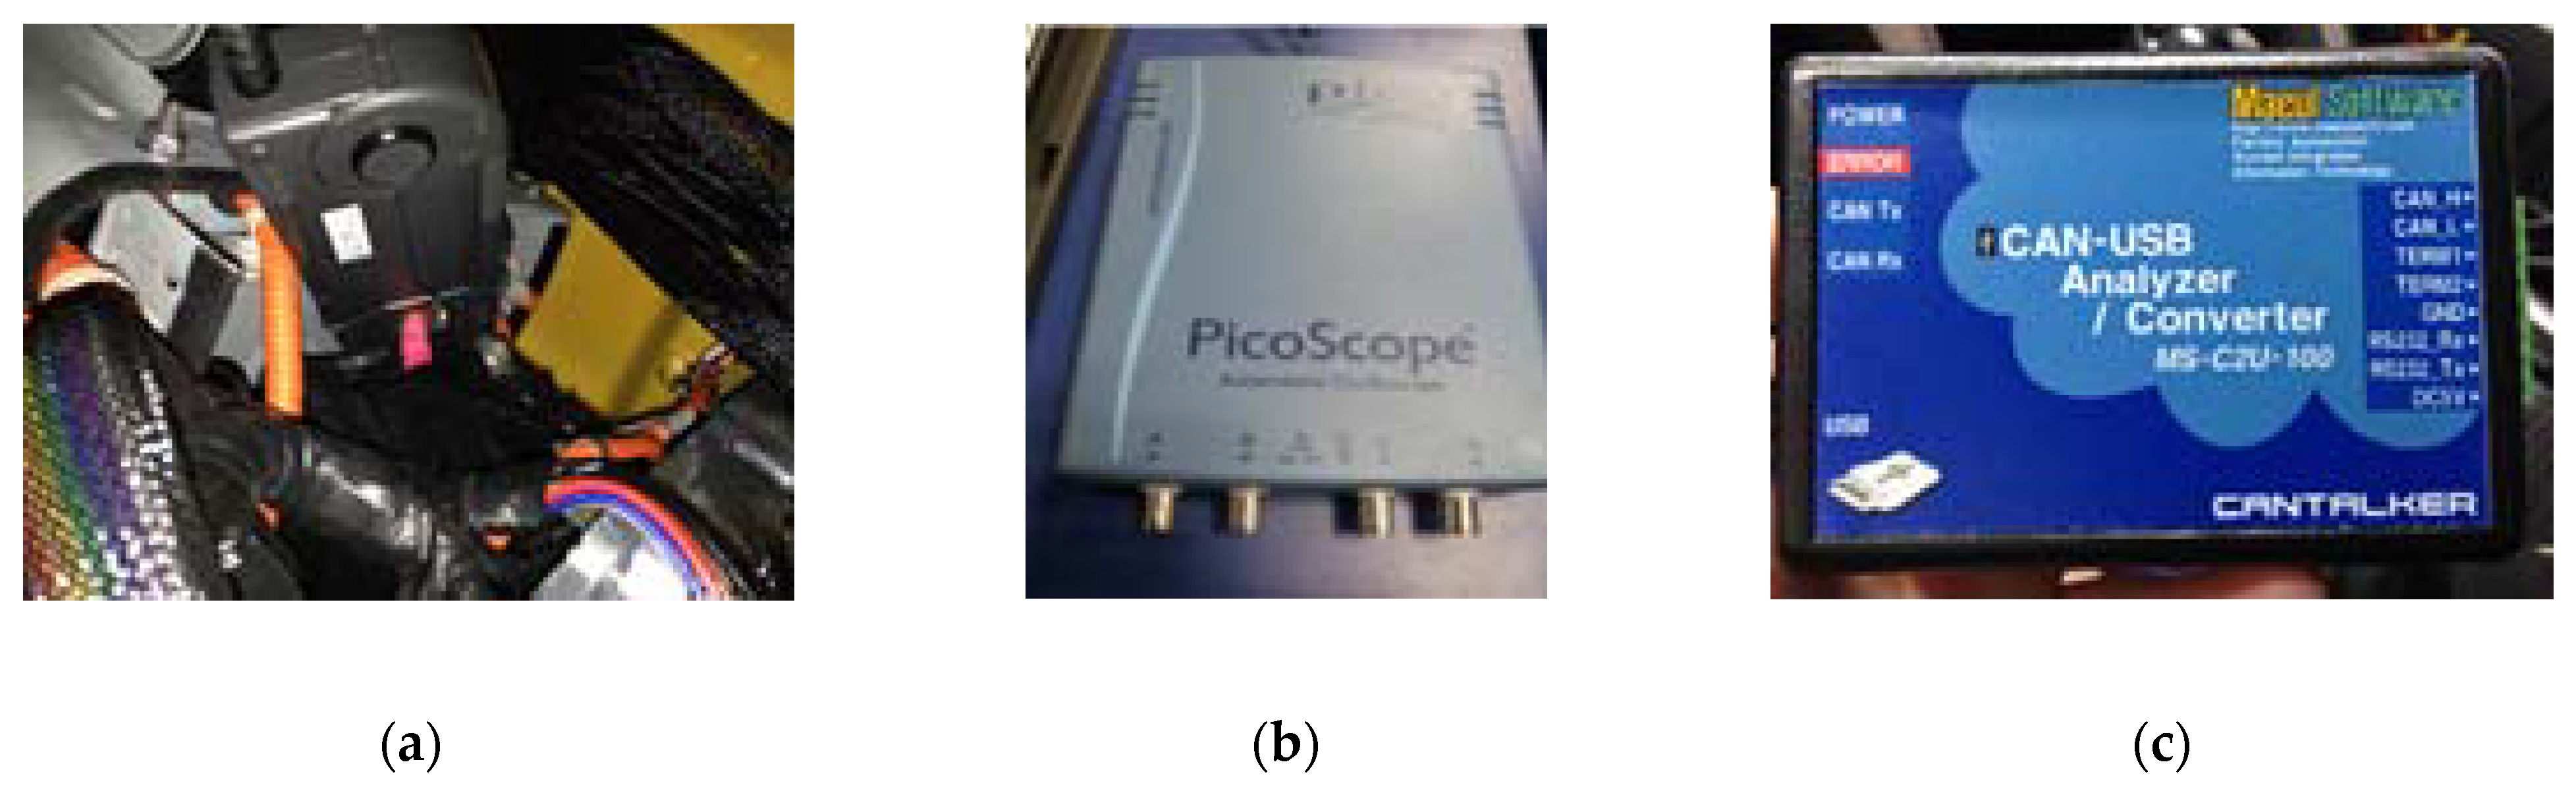
Figure 4.
Schematic of experimental setup.
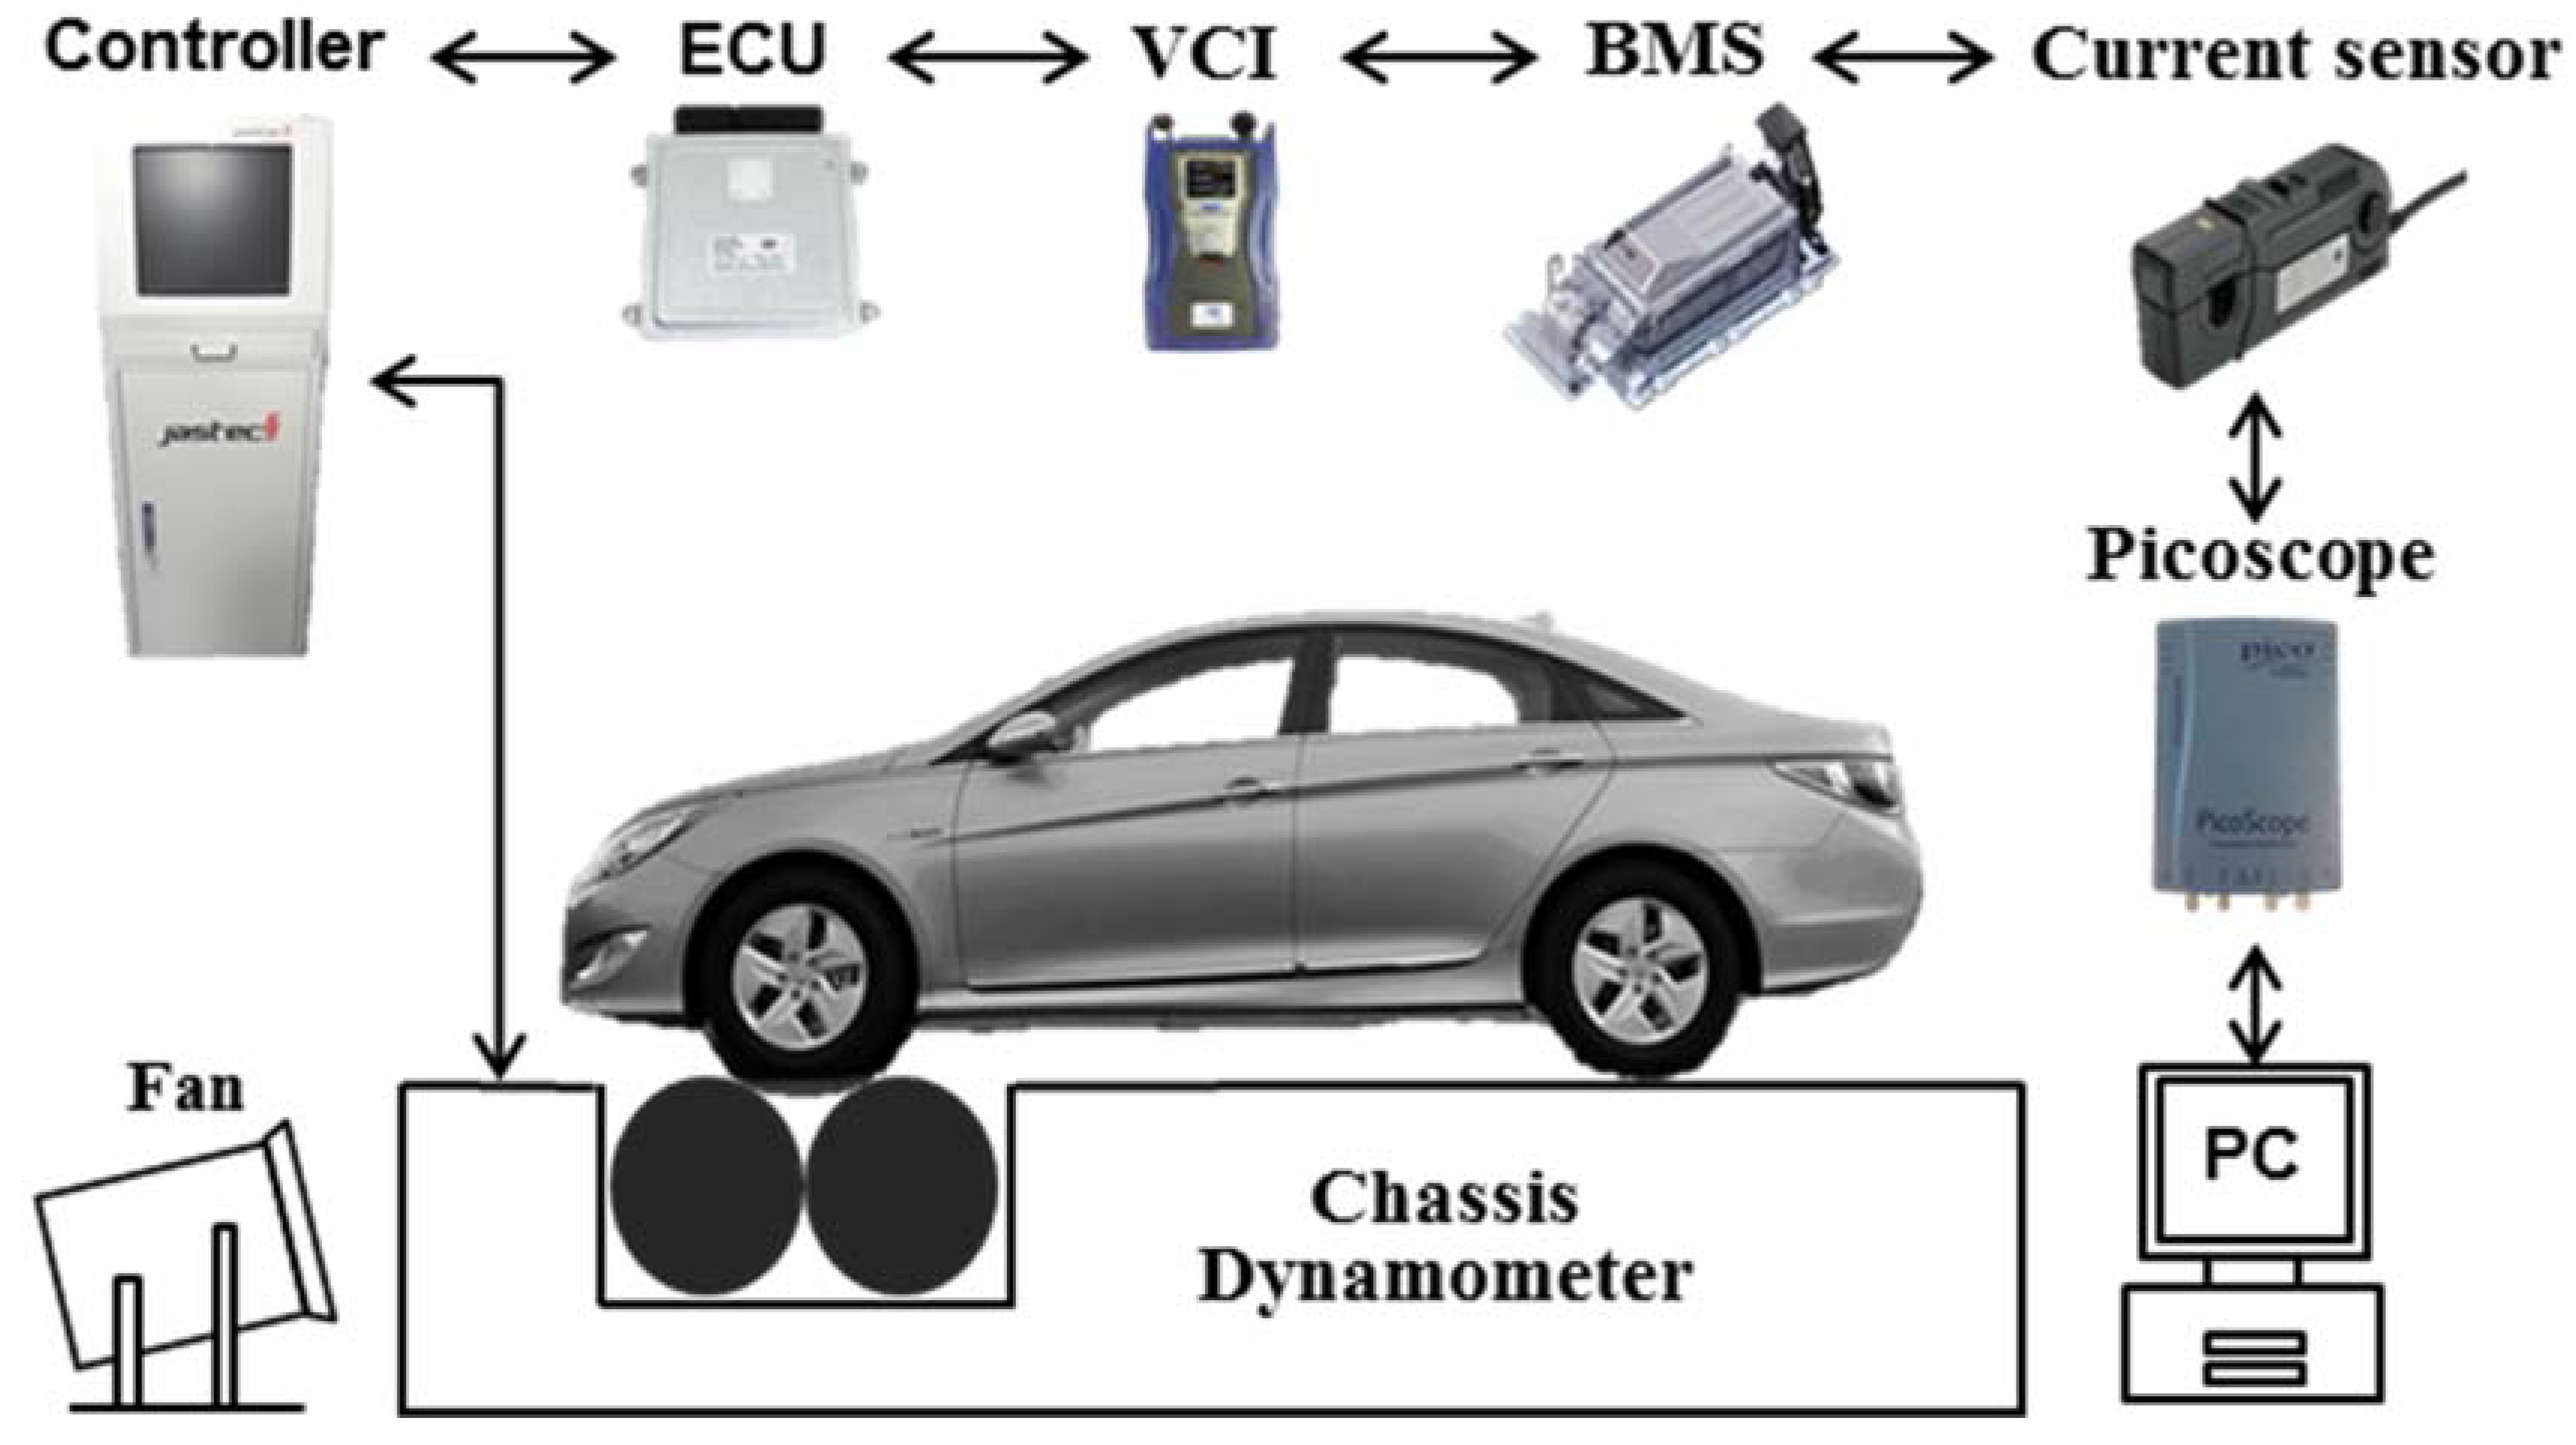
Figure 5.
Full numerical model of TMED-type HEV developed using CRUISE.
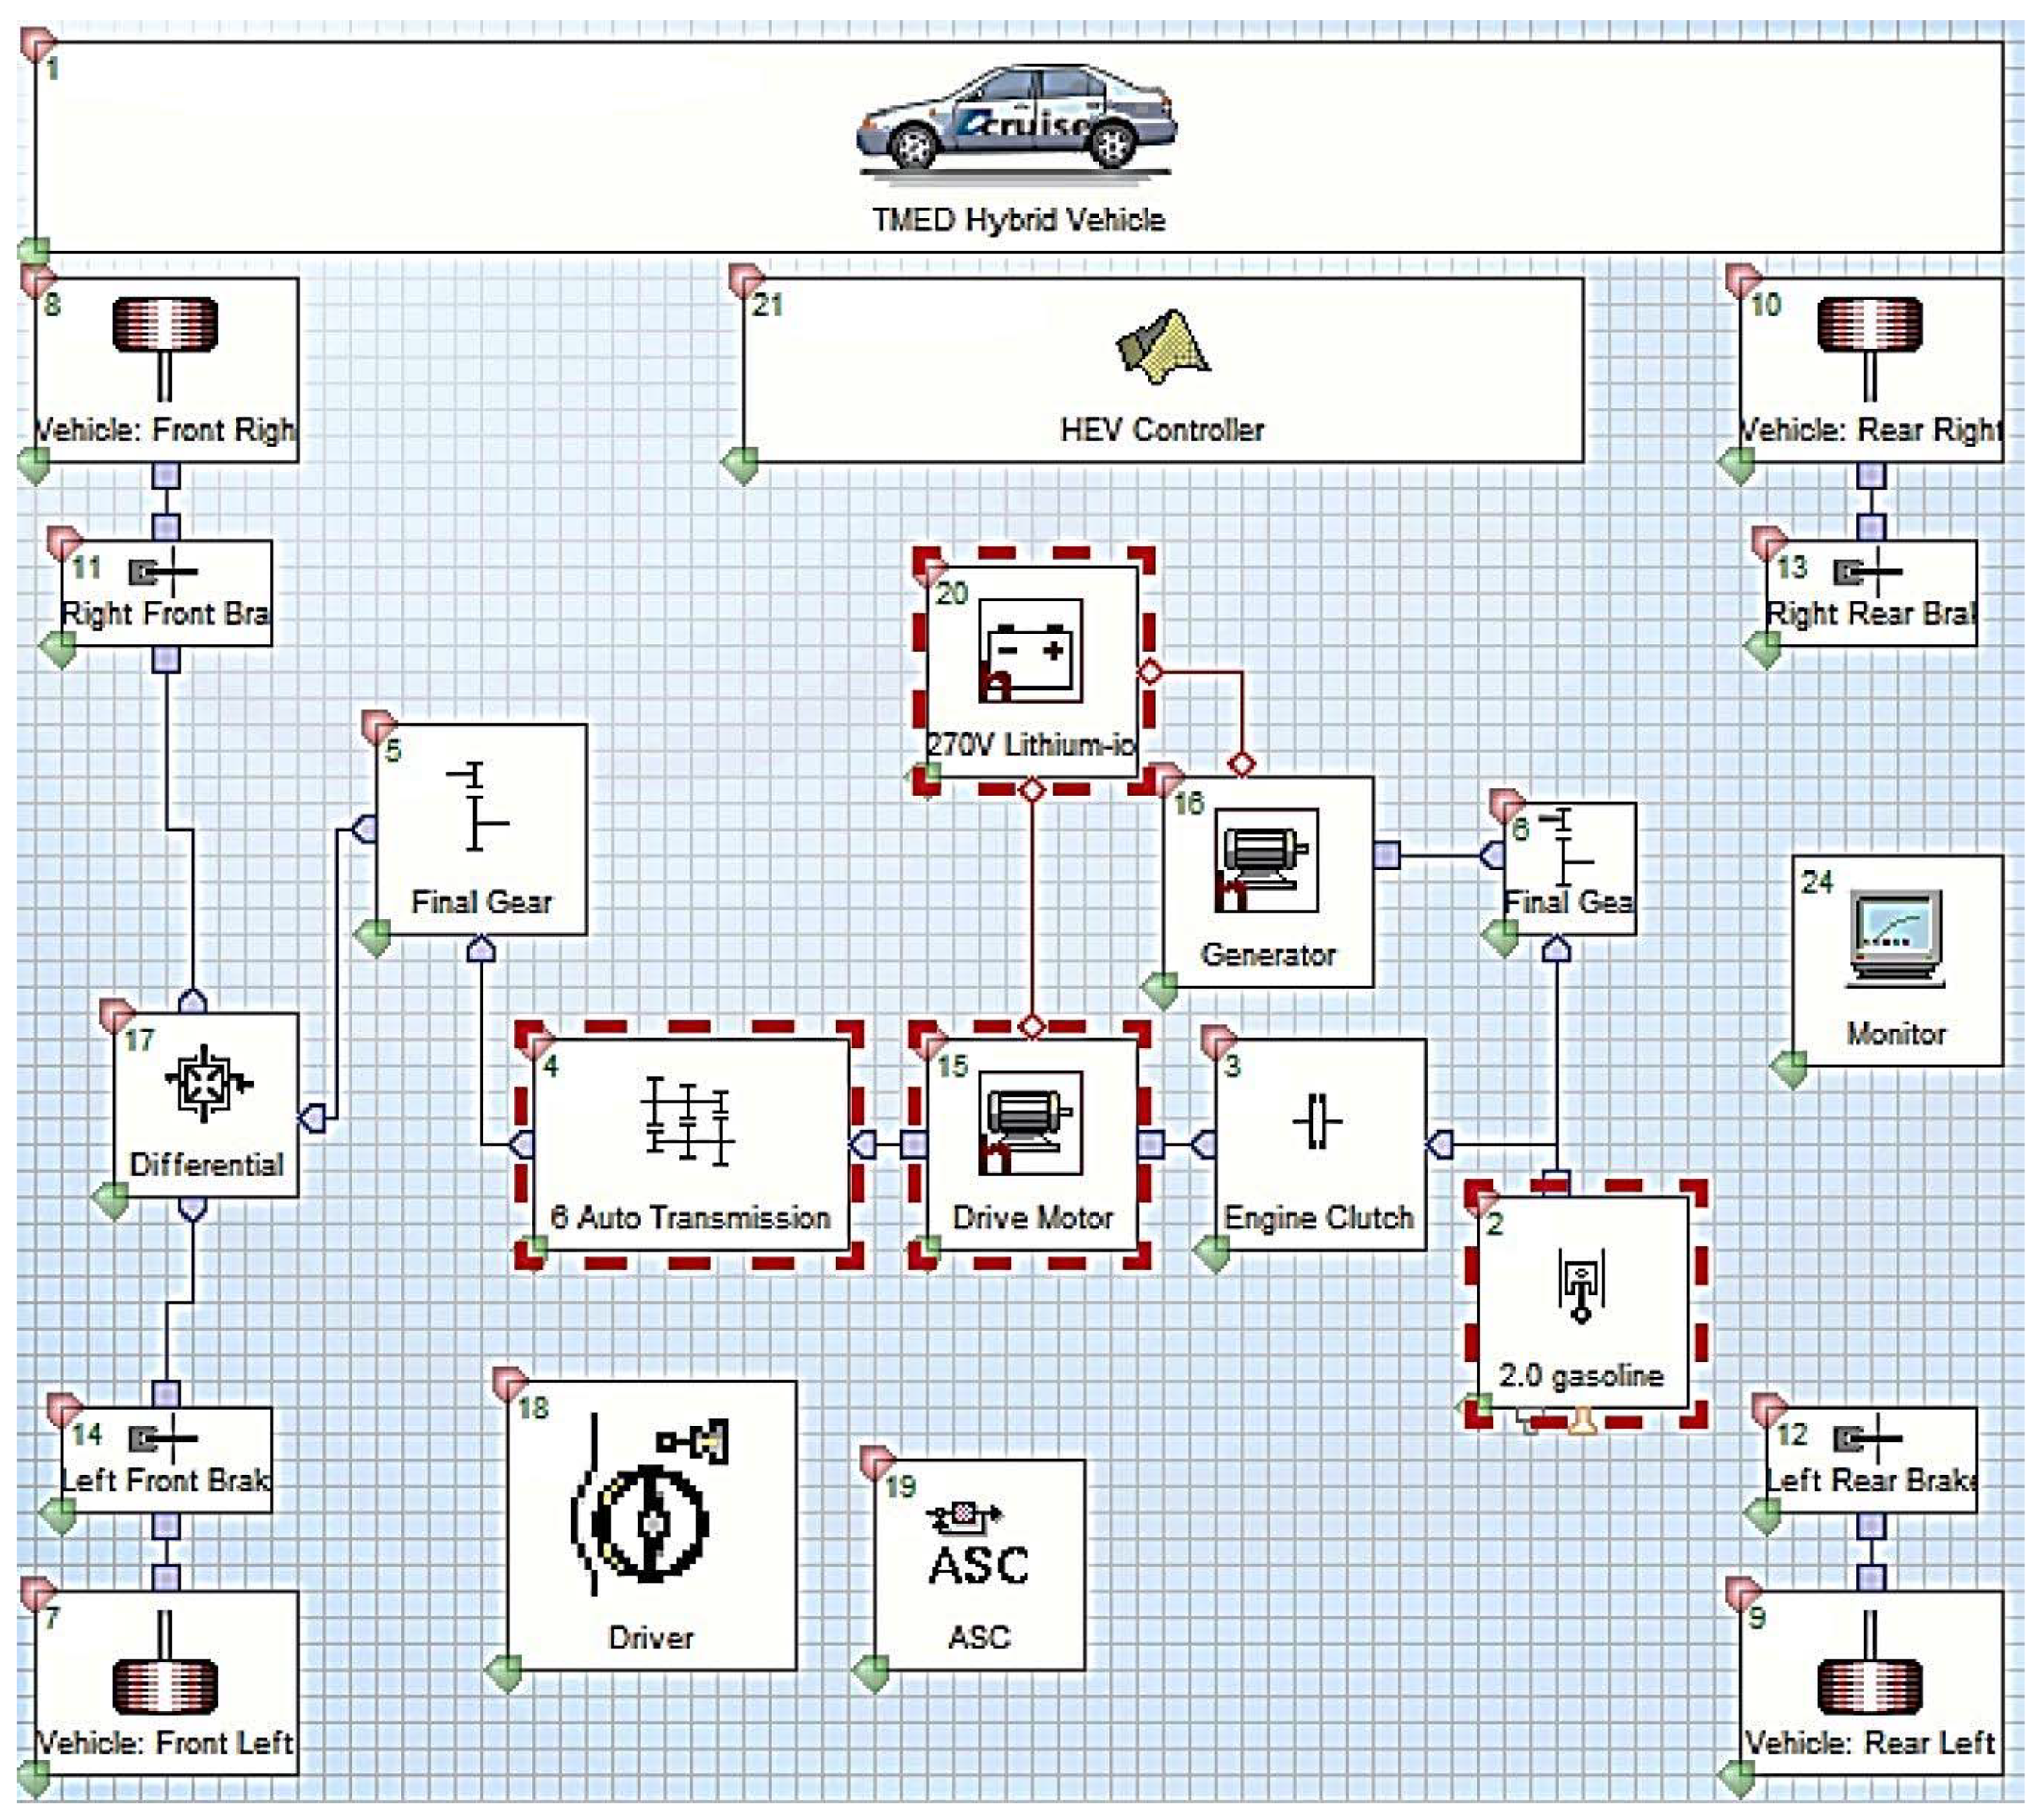
Figure 6.
Comparison of experimental and numerical simulation results under IM240-mode driving: (a) engine torque; (b) driving motor torque; (c) state of charge.
Figure 6.
Comparison of experimental and numerical simulation results under IM240-mode driving: (a) engine torque; (b) driving motor torque; (c) state of charge.
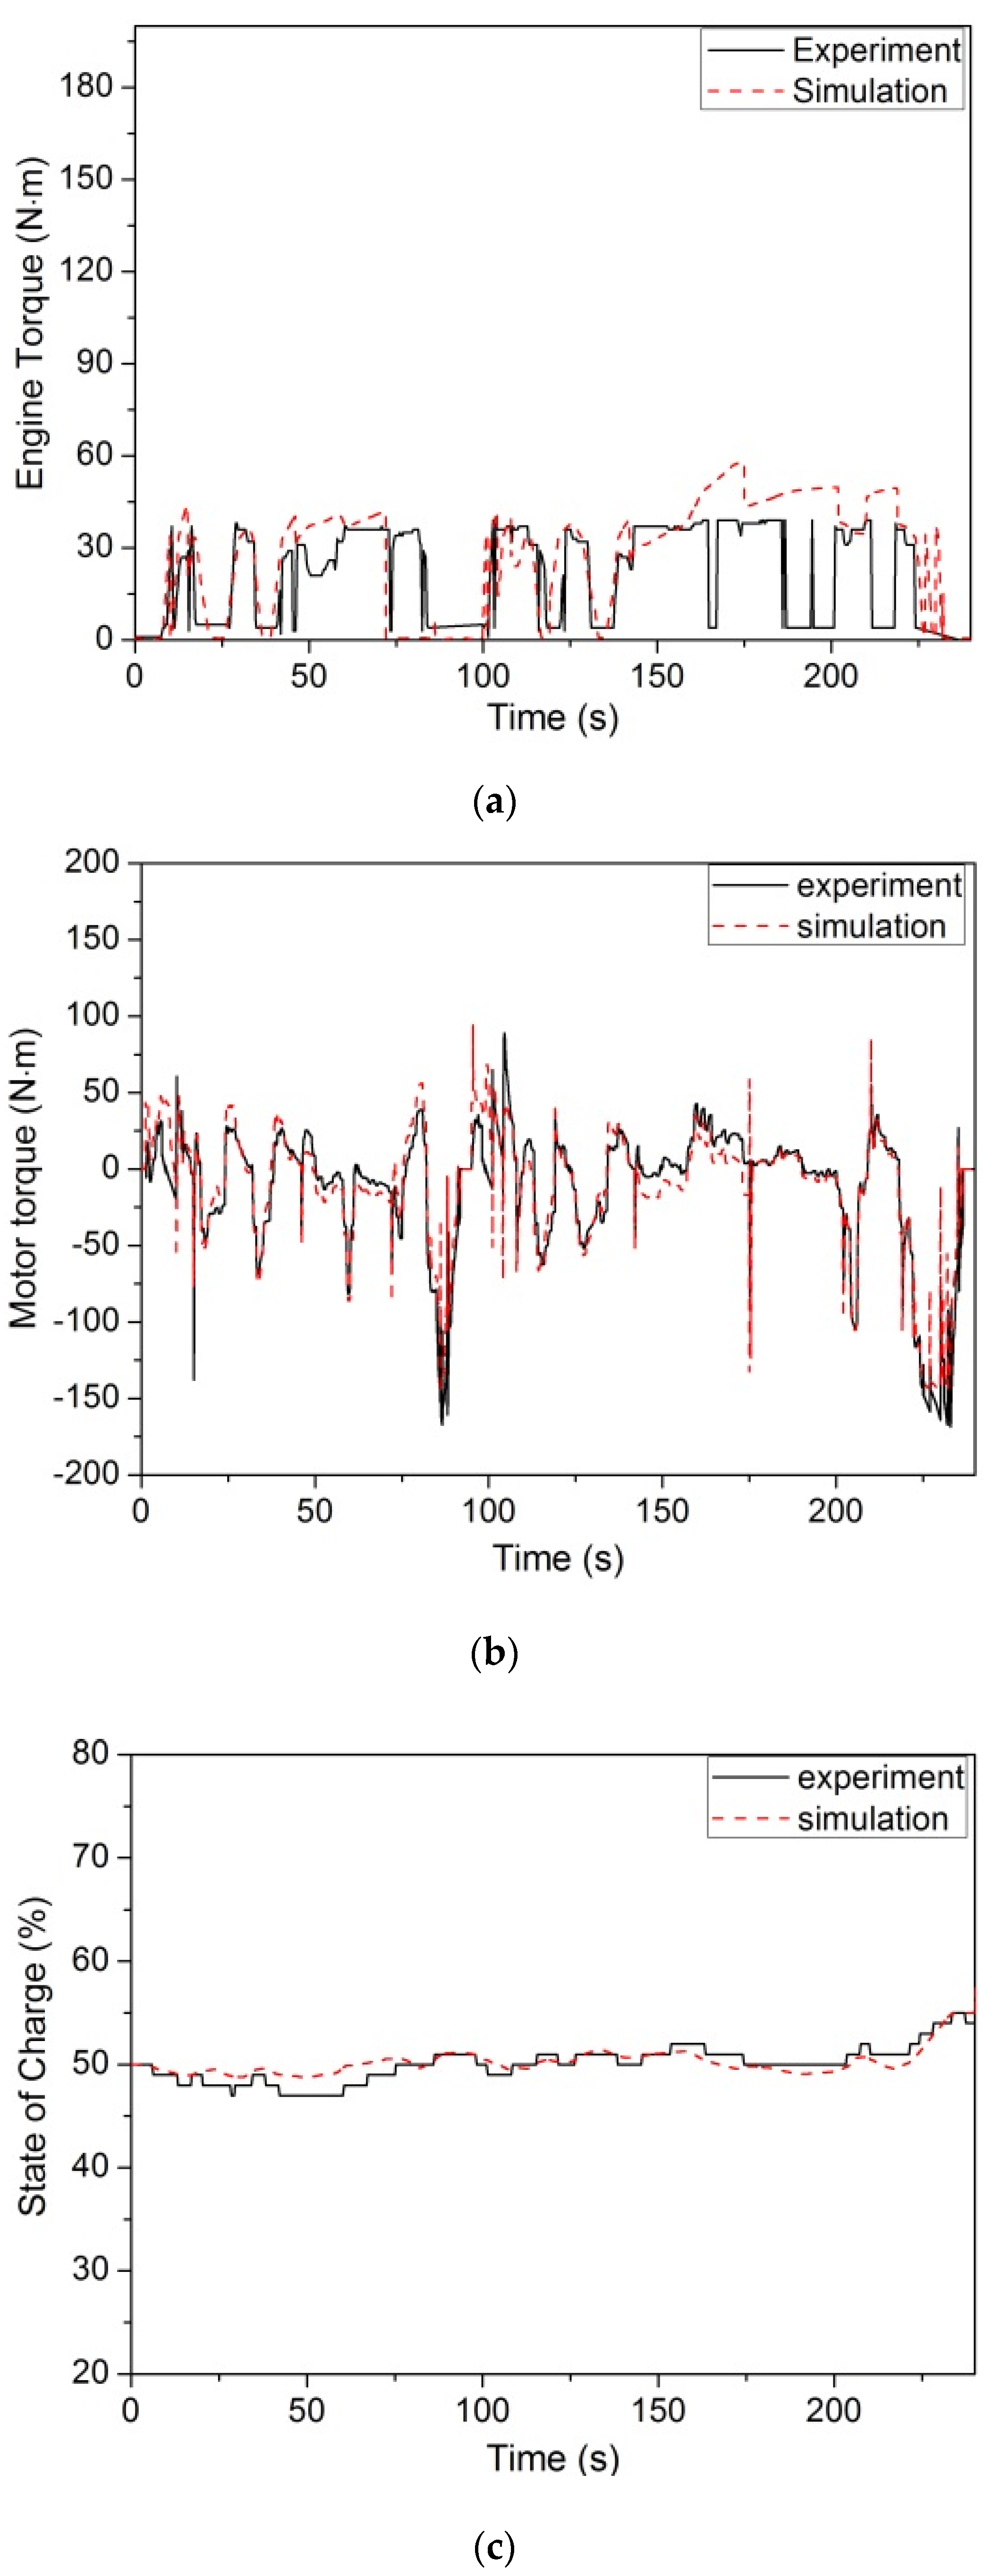
Figure 7.
Comparison of engine torque in the numerical simulation with the fuel-injection duration obtained by experiment: (a) engine torque (CRUISE analysis); (b) fuel-injection duration.
Figure 7.
Comparison of engine torque in the numerical simulation with the fuel-injection duration obtained by experiment: (a) engine torque (CRUISE analysis); (b) fuel-injection duration.
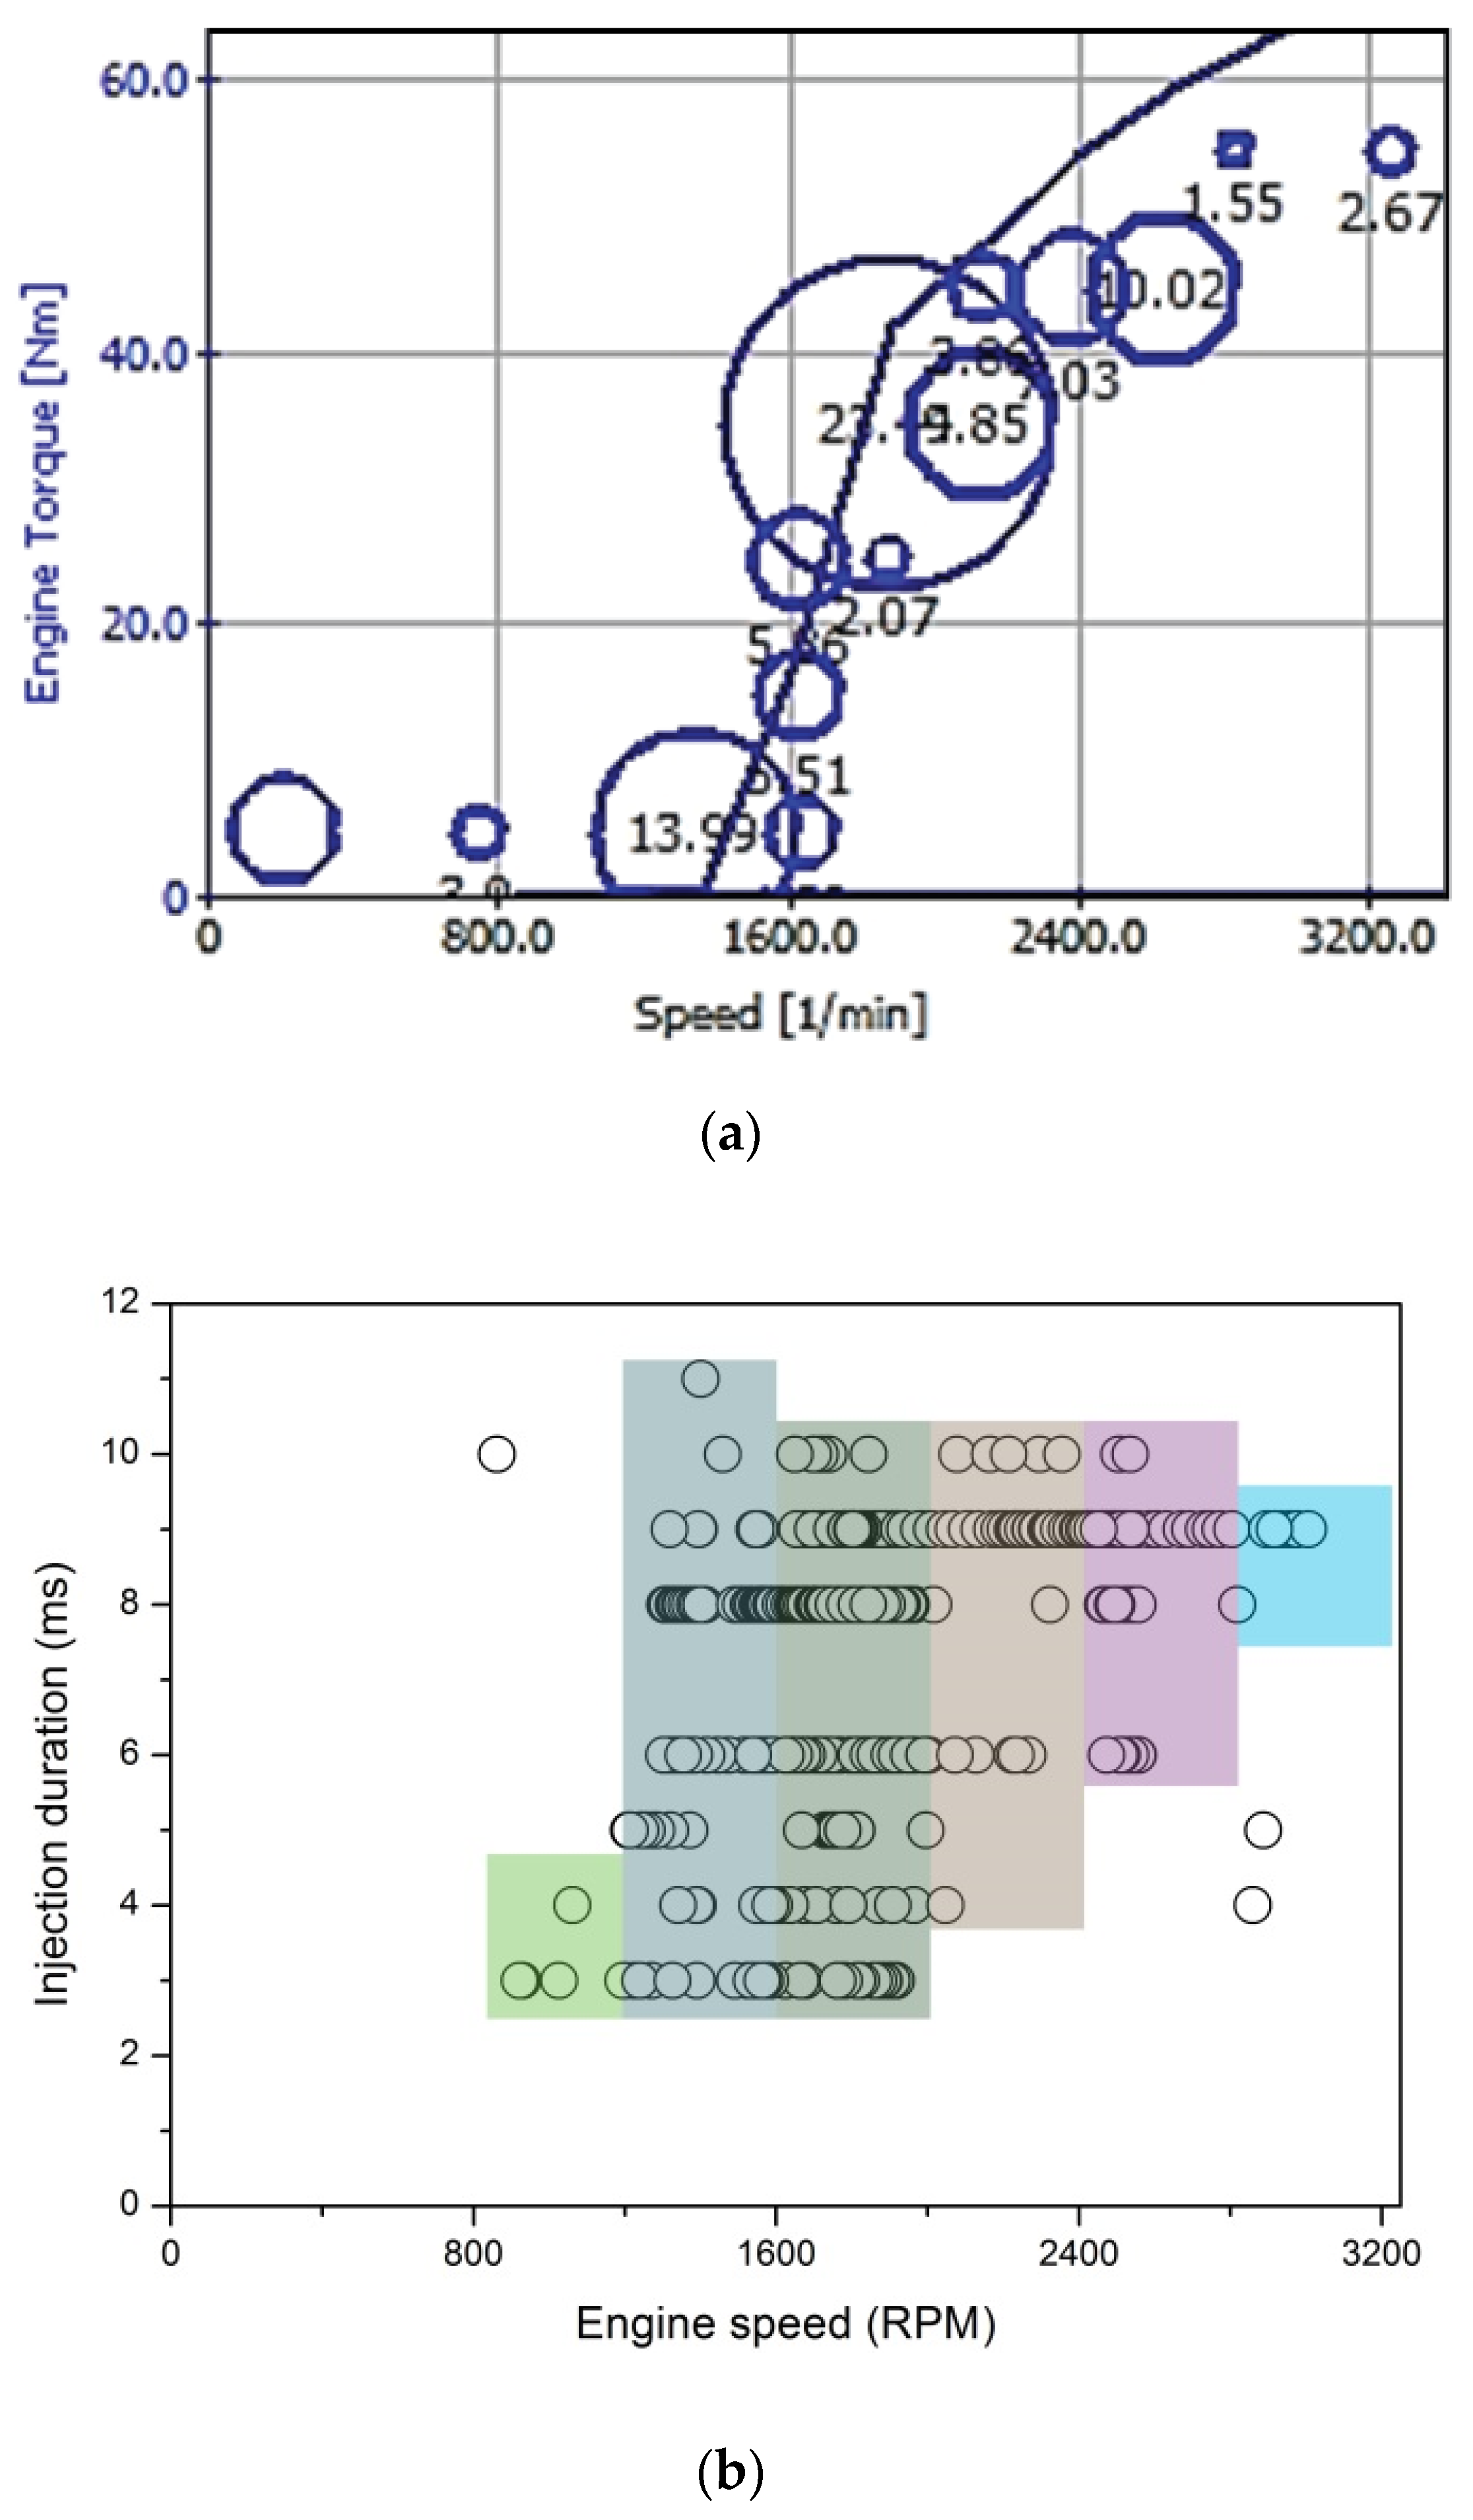
Figure 8.
Characteristic of power distribution with driving: (a) FTP-75; (b) HWFET.

Figure 9.
SOC drop in IM240 mode for Phase 1 and Phase 2: (a) Reduction in engine torque. (b) Reduction in battery capacity.
Figure 9.
SOC drop in IM240 mode for Phase 1 and Phase 2: (a) Reduction in engine torque. (b) Reduction in battery capacity.

Figure 10.
Difference in the SOC drop between IM240 and FTP-75 modes: (a) reduced engine torque; (b) reduced battery capacity.
Figure 10.
Difference in the SOC drop between IM240 and FTP-75 modes: (a) reduced engine torque; (b) reduced battery capacity.
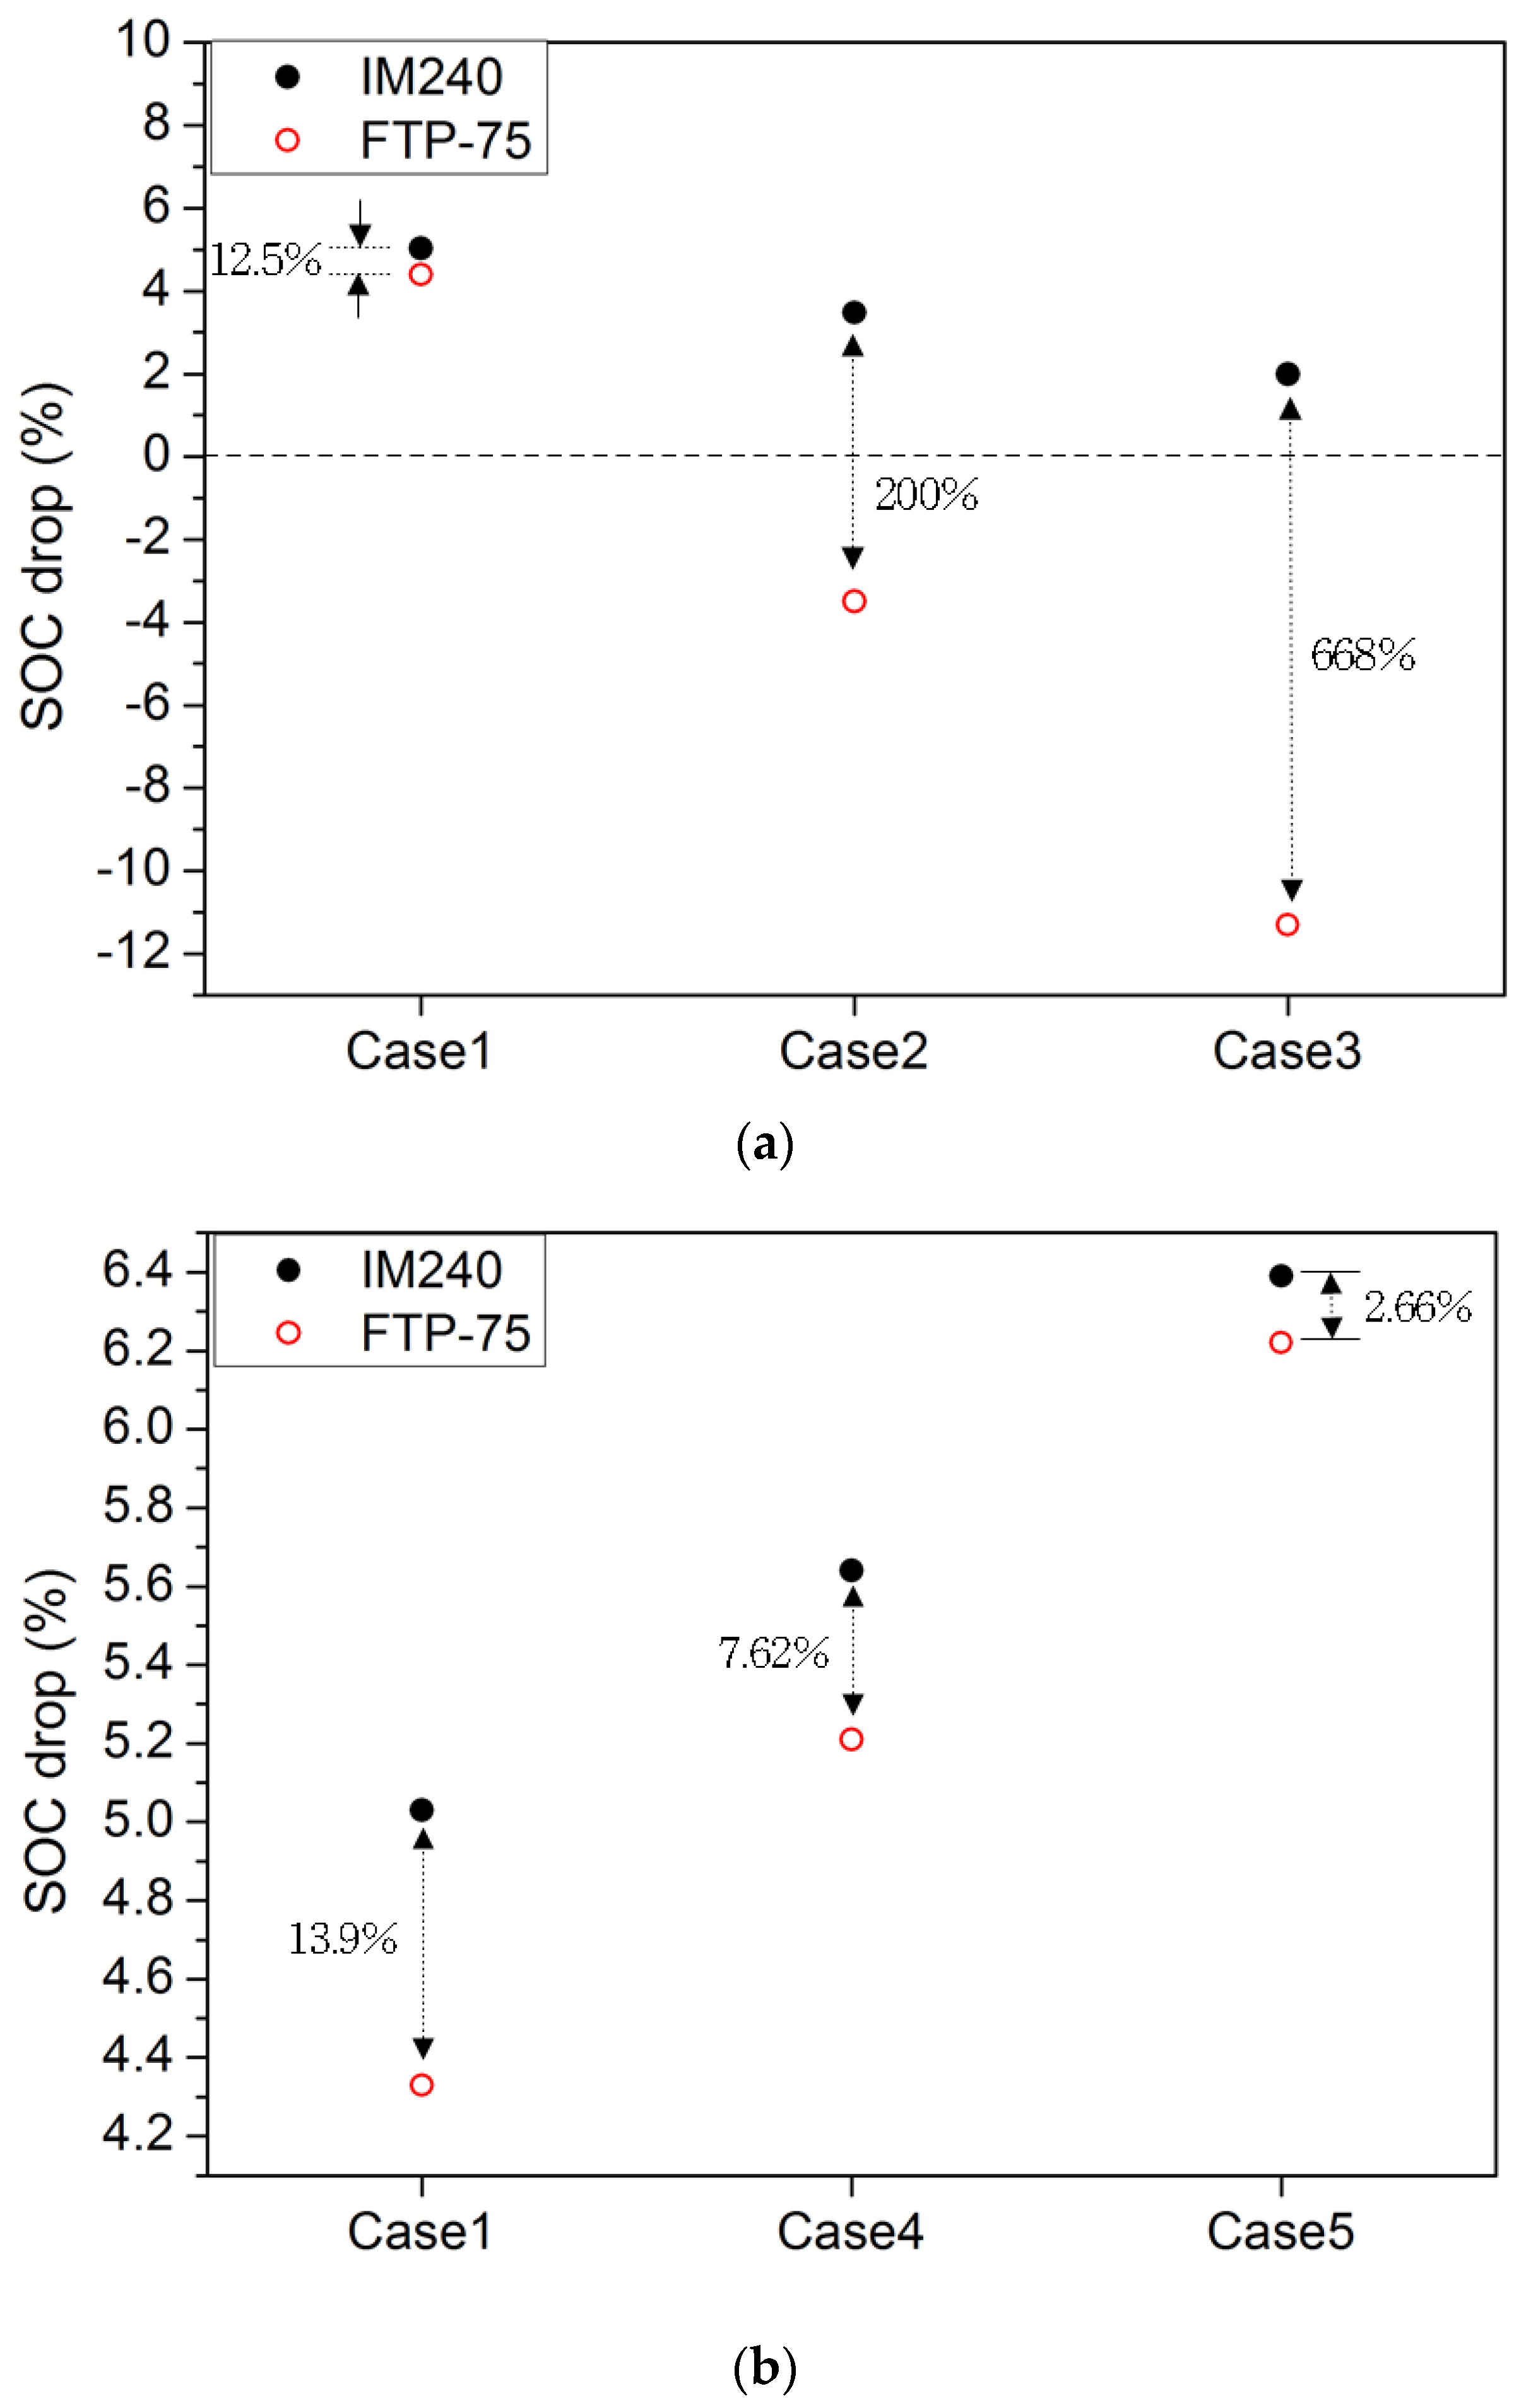
Figure 11.
Current balance during IM240 and FTP-75 modes under conditions of reduced engine-torque.
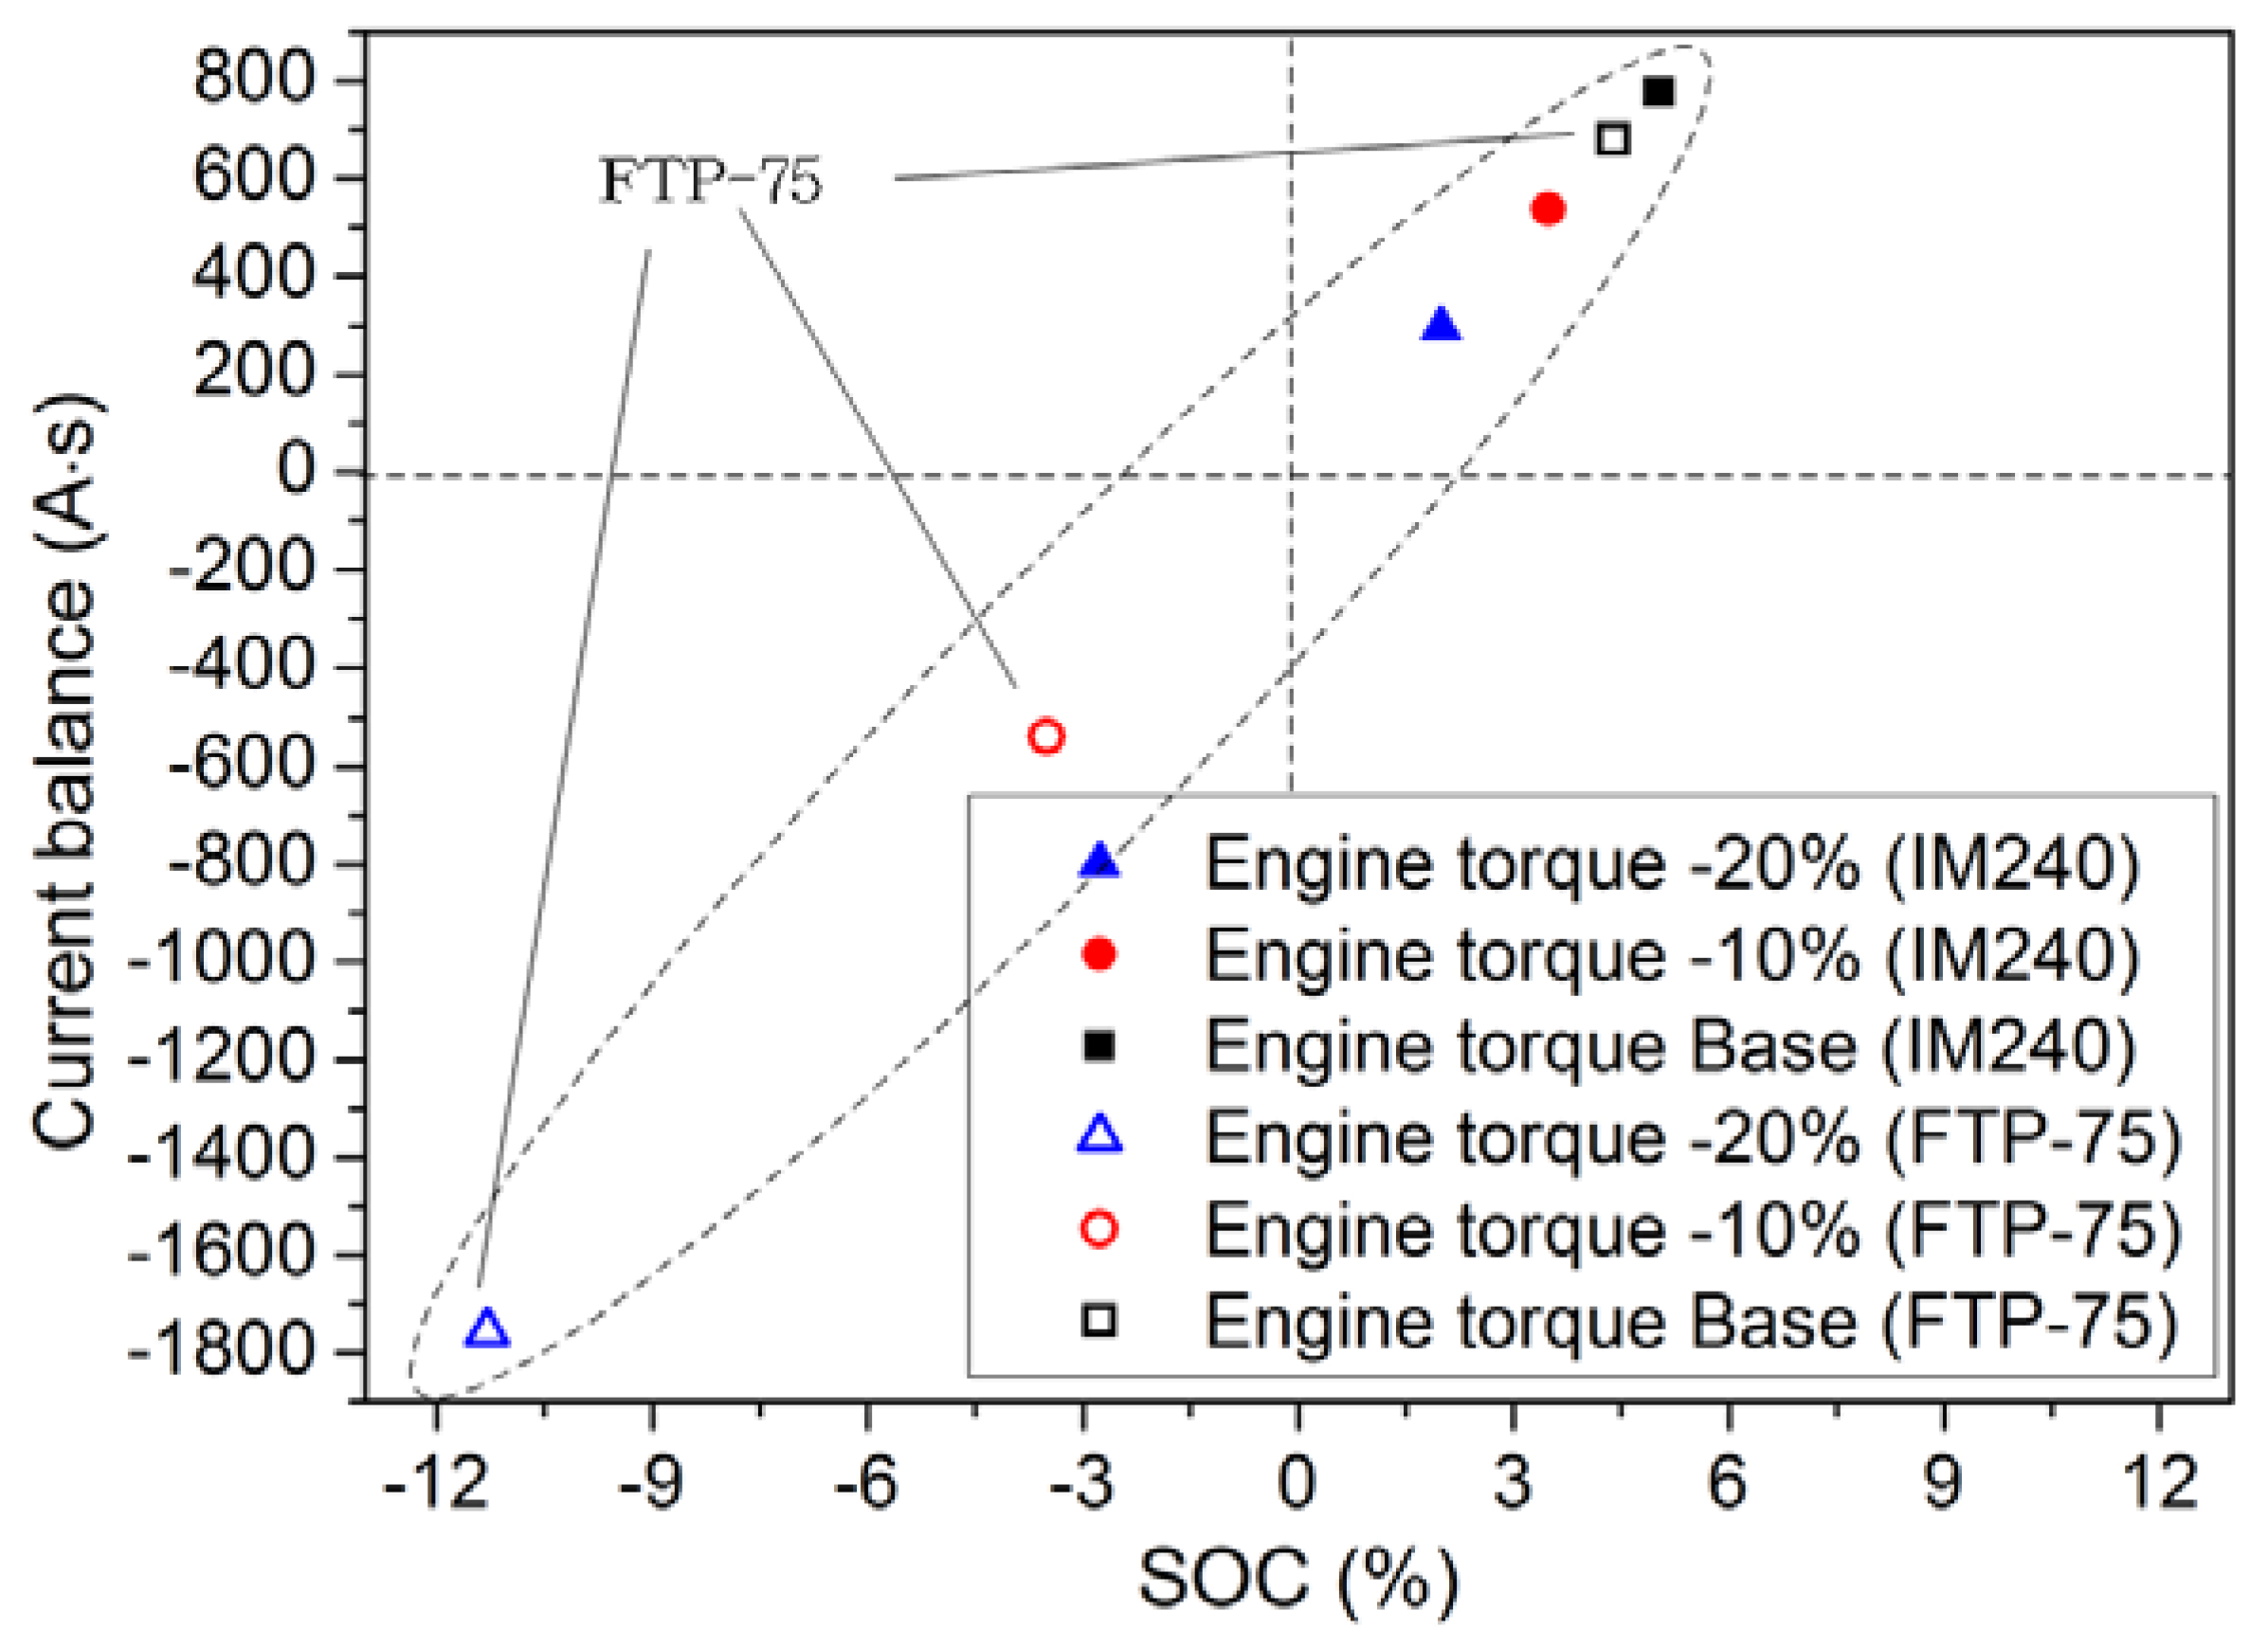
Figure 12.
Current balance during IM240 and FTP-75 modes under conditions of reduced battery capacity.
Figure 12.
Current balance during IM240 and FTP-75 modes under conditions of reduced battery capacity.

Table 1.
Specifications of the HEV used in the current study.
| Item | Unit | Specification |
|---|---|---|
| Engine | - | 2.0 L Atkinson cycle Double overhead cam |
| Max. power | PS | 150 |
| Max. torque | kg·m | 18.3 |
| Motor | - | 30 kW (41 PS)/20.9 kg·m |
| HSG | kW | 8.5 |
| Battery | - | Lithium polymer 5.3 A·h × 270 V = 1.431 kW·h 8 cells × 9 modules (1 cell: 3.75 V) Maximum charge/discharge power: 34 kW, −26 kW Operating voltage range: 200∼310 V Thermo sensor: Thermistor type |
Table 2.
Main elements of a hybrid vehicle model under CRUISE.
| Element | Name | Major Variable |
|---|---|---|
 | Vehicle | 1. Curb weight 2. Gross weight |
 | HEV controller | 1. Controller of hybrid system |
 | Lithium-ion battery | 1. Maximum charge 2. Initial charge 3. Nominal, maximum and minimum voltage 4. Number of battery cells 5. Idle voltage |
 | Gasoline engine | 1. Torque diagram 2. Intake method setting (Charger) 3. Idling speed 4. Maximum speed 5. Engine displacement volume |
 | Electric motor | 1. Nominal voltage 2. Maximum speed 3. Maximum charge/discharge current 4. Torque diagram |
 | Transmission | 1. Gear position 2. Transmission ratios |
Table 3.
Connections between elements on the data bus.
| Component Requiring Input | Input Information | Component Delivering | Output Information |
|---|---|---|---|
| Cockpit driver | Gear indicator | Transmission | Current gear |
| Speed | TMED Hybrid Vehicle | Velocity | |
| Drive motor | Load signal | HEV controller | Electric motor load signal |
| Switch | HEV controller | Electric motor switch | |
| Engine | Load signal | HEV controller | Engine load signal |
| Start switch | HEV controller | Engine start switch | |
| Transmission | Desired gear | Cockpit driver | Desired gear from profile |
| HEV controller | Load signal | Cockpit driver | Load signal |
| Battery status of charge | Lithium-ion battery | Net voltage | |
| Engine torque | Engine | Current brake torque | |
| Battery current | Lithium-ion battery | Current | |
| Battery voltage | Lithium-ion battery | Battery charge |
Table 4.
Scenarios for engine-torque variation with fixed battery capacity in the numerical analysis.
Table 4.
Scenarios for engine-torque variation with fixed battery capacity in the numerical analysis.
| Engine Torque | |||
|---|---|---|---|
| Battery capacity (Base) | Rated torque (Base value) | 10% less than Base value | 20% less than Base value |
| Case 1 | Case 2 | Case 3 | |
Table 5.
Scenarios for battery-capacity variation with fixed engine torque in the numerical analysis.
Table 5.
Scenarios for battery-capacity variation with fixed engine torque in the numerical analysis.
| Battery Capacity | |||
|---|---|---|---|
| Engine torque (Base) | Rated capacity (Base value) | 10% less than Base value | 20% less than Base value |
| Case 1 | Case 4 | Case 5 | |
© 2020 by the authors. Licensee MDPI, Basel, Switzerland. This article is an open access article distributed under the terms and conditions of the Creative Commons Attribution (CC BY) license (http://creativecommons.org/licenses/by/4.0/).
Share and Cite
MDPI and ACS Style
Cho, I.; Lee, J. Characteristics of Battery SOC According to Drive Output and Battery Capacity of Parallel Hybrid Electric Vehicle. Appl. Sci. 2020, 10, 2833. https://doi.org/10.3390/app10082833
AMA Style
Cho I, Lee J. Characteristics of Battery SOC According to Drive Output and Battery Capacity of Parallel Hybrid Electric Vehicle. Applied Sciences. 2020; 10(8):2833. https://doi.org/10.3390/app10082833
Chicago/Turabian StyleCho, Insu, and Jinwook Lee. 2020. "Characteristics of Battery SOC According to Drive Output and Battery Capacity of Parallel Hybrid Electric Vehicle" Applied Sciences 10, no. 8: 2833. https://doi.org/10.3390/app10082833
Note that from the first issue of 2016, this journal uses article numbers instead of page numbers. See further details here.