Analysis of Wear-Resistant Surface with Pangolin Scale Morphology by DEM Simulation


1
School of Physical Education, Quanzhou Normal University, Quanzhou 362000, China
2
Key Laboratory of Bionic Engineering (Ministry of Education, China), Jilin University, Changchun 130022, China
3
College of Mechanical & Electrical Engineering, Nanjing University of Aeronautics & Astronautics, Nanjing 210016, China
*
Authors to whom correspondence should be addressed.
Appl. Sci. 2020, 10(8), 2896; https://doi.org/10.3390/app10082896
Submission received: 14 March 2020
/
Revised: 14 April 2020
/
Accepted: 17 April 2020
/
Published: 22 April 2020
(This article belongs to the Special Issue Advances in Surface Modification of the Materials)
Abstract
:Based on the Discrete Element Method (DEM), an abrasive wear system composed of pangolin scale models and abrasive sand was established. The wear morphology of pangolin scale models under different velocities were simulated by PFC2D®. Their wear behaviors were discussed with regard to the contact bond fields, the contact force chains, the velocity fields and the displacement fields of the abrasive wear system. Moreover, the resistance of the pangolin scale models under different velocities were analyzed. In the DEM simulation, the fracture and debris locomotion on the scale model were observed at a meso-microscopic scale. The results show that the geometrical shape of the pangolin scale is helpful for decreasing the boundary stress, with the wear rate decreasing when the velocity is higher than 0.62 m·s−1. The wear rate is no more than 0.006 g/m under the abrasive sand, with a radius of 0.11–0.20 mm. The wear rates of the pangolin scale model agree with the experimental results, and the DEM provides a new way to study the abrasive wear behavior of this non-smooth biological surface.
1. Introduction
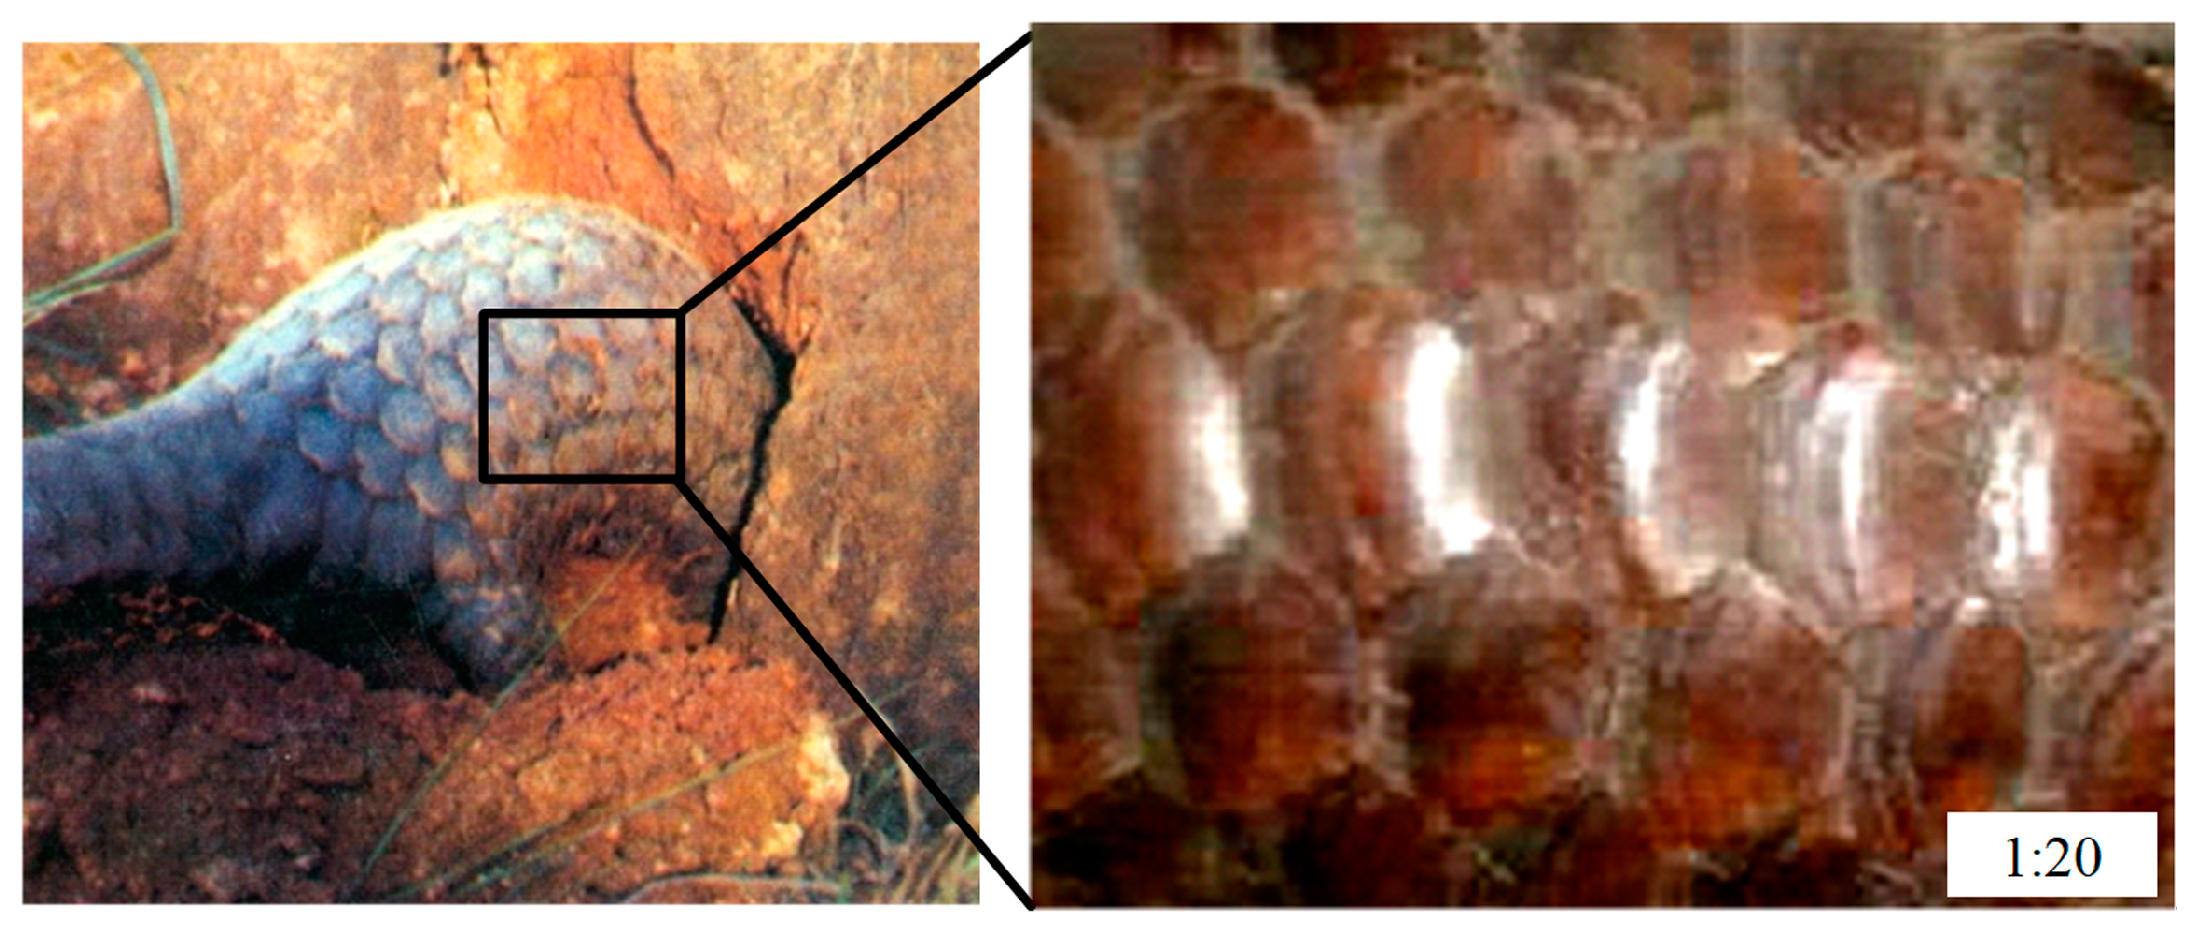
In order to provide a basic theory for the research of a bionic wear-resistant surface and structure, it is important to investigate the wear behavior of typical biological wear-resistant surfaces [1,2,3]. The Malayan pangolin (Manis pentadactyla) is a typical soil animal which often digs and locomotes in sand and soil to feed on prey. Pangolin has a uniquely evolved body surface, which can efficiently resist the abrasion of abrasive sand/soil due to its long period of evolution. The morphology of the pangolin surface is composed of a series of arranged scales [4,5], which are about 3 cm long and 2 cm wide, as shown in Figure 1.
In general, some important wear behaviors that occur at a meso-microscopic scale are difficult to analyze using laboratory experiments [6], such as the breakaway of partial structure and the desquamation of abrasive debris. Meanwhile, the traditional method of numerical simulation, such as the Finite Element Method (FEM), cannot analyze the uneven evolvement of structure or the dynamic fracture and breakaway at the meso-scale [7]. For the nonuniform evaluation of the dynamic wear behaviors of non-smooth biological surfaces, the Discrete Element Method (DEM) can be applied to simulate and analyze injury and failure in the nonuniform area of the continuum at a meso-microscopic scale.
DEM is a numerical simulation method which has been widely used in the non-continuous materials. However, research proves that DEM can also be used to analyze the continuous materials and structures [8]. Furthermore, DEM can reveal the mechanism of the mechanical, physical and even the chemical evaluative process of materials and structures [8]. Therefore, DEM provides a new way to study the wear evolution process of the complex biological non-smooth surface.
In this paper, based on a geometric model of a single pangolin scale, a DEM model of the arranged scales and their wear systems were established using PFC2D®. The abrasive wear behaviors of the pangolin scale model were analyzed through a qualitative analysis of the morphology, contact bond fields, contact force chains, velocity fields, displacement fields under different velocities. Furthermore, the dynamic force and the wear rate of the wear-resistant structure were studied through quantitative analysis. In the simulation, we observed meso-microscopic scale changes due to micro-injury, fractures and debris locomotion, and further revealed the wear behavior of the biological wear-resistant body surfaces. Moreover, our analysis provides a theoretical basis for the research of bionic wear parts, so as to improve the wear performance of traditional parts and develop parts with high wear resistance, which is of great significance for saving energy, manpower and improving machine production efficiency.
2. Materials of Methods
2.1. The Establishment of Models
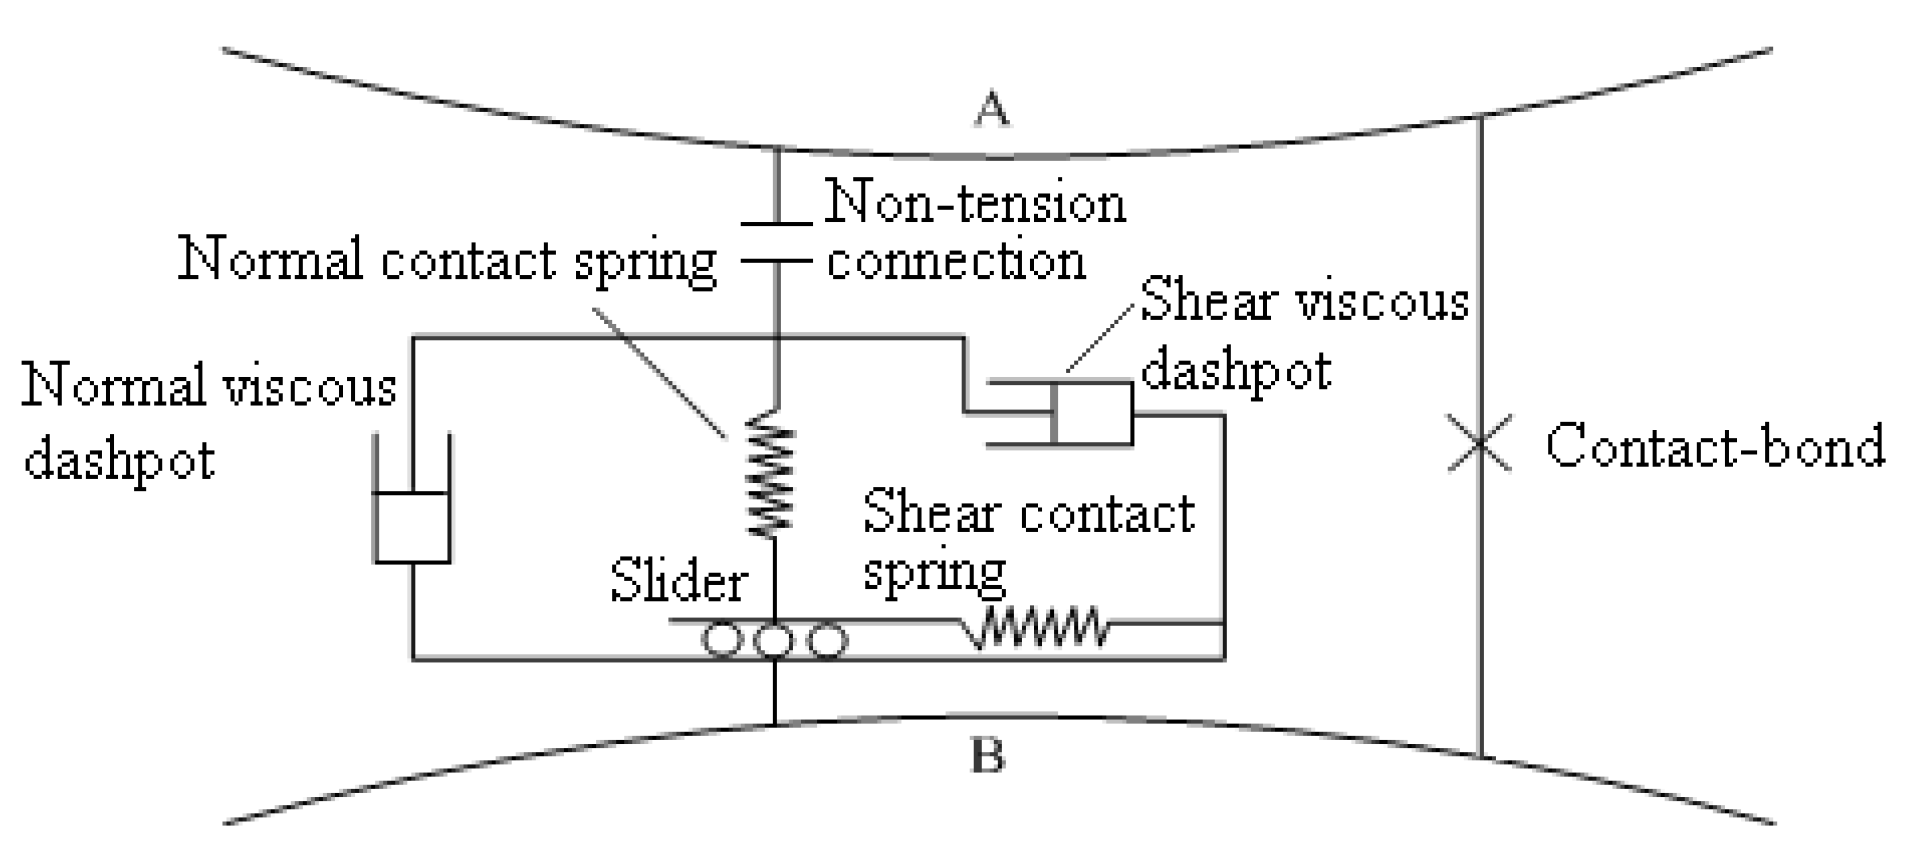
In DEM, the continuous model of materials on a meso-microscopic scale can be established by integrating the contact elements. Based on the mechanical characteristics of pangolin scales, a nonlinear mechanical model of pangolin scales was established, as shown in Figure 2. In the figure, A and B are two contact elements, the normal and the shear contact springs represent the linear contact stiffness model, the slider represents the slip model, the normal and the shear viscous dashpots imitate the effects of viscous damping and the clamp device represents the contact bond model. The bond will break once the value of the normal tensile or shear contact force exceeds the respective strength [9].
Based on the mechanical characteristics and the non-linear mechanical model of pangolin scales, the DEM parameters were obtained. Compared to the pangolin scale model [10], there exists a cohesion between the sand particles, but the model displays weaker contact restraints. The DEM calculation parameters of the pangolin scale model and the sand particles are shown in Table 1 and Table 2 [11,12]. The abrasive wear simulation system is shown in Figure 3.
2.2. The Experimental Method
A JMM rotary disc type tester was used, as shown in Figure 4. The rotary disc rotates to drive the abrasive against the abrading specimen during the tests. A set of four specimens is fixed to the specimen holder at 90° intervals. The specimens are positioned at a depth of about 70 mm inside the abrasive. The impact angle of the tangential direction of the abrasive against the substrate surface of the abrading specimen was 35°. The total sliding distance is 82 m for each specimen. A total of 30%wt of abrasive was substituted with a new abrasive every four specimen tests. The room temperature was 20–23 °C during the tests. Three compacting wheels were kept at a constant height in order to keep the constant density of the abrasive. The abraded mass loss was calculated by weighing the specimens before and after the abrasive tests. Five sets of tests were performed for each type of specimen. Each set includes tests at two different relative velocities of the specimen with regard to the disc [1]. Polyvinylidene difluoride (PVDF) was selected as the material for the tested samples. The abrasive is a kind of quartz sand with diameters ranging from 0.11 mm to 0.20 mm. The sample material played a secondary role in the paper. Moreover, the wear test was focused on obtaining the sample geometry in order to validate the wear behaviors in DEM simulation.
3. Simulation and Analysis
3.1. Qualitative Analysis
Using the dynamic abrasive wear system, the abrasive wear behavior of the arranged pangolin scales subjected to abrasive sand were simulated with velocities of 0.50 m·s−1, 0.62 m·s−1 and 0.74 m·s−1, respectively. Figure 5 shows the morphology of the scales after wearing at 0.05 m and 0.10 m under each velocity. The figure shows that the wear degree of the scales increases continuously with the increase in the number of contacted sand abrasives. After a process of rapid growth, the wear rate and wear extent decrease and reach a stable state. Only the tip part of the scale is worn off by the abrasive sand when the velocity is 0.50 m·s−1. The wear extent increases with the wear velocity, until severe fracture and slip appear at a velocity of 0.62 m·s−1. When the velocity is over this value, the wear extent slows down. It is obvious that the tip of the pangolin scale is worn severely, and the wear part is separated from the pangolin scale. The worn part finally reaches an arc.
Figure 6 shows the dynamic contact bond fields of the pangolin scale under different velocities. The contact bond is the inherent structural strength of the biological surface, which reflects the fracture mechanism; the structural strength will be broken once the acting forces of abrasive sand on the pangolin scale exceed the contact bond strength [13], thereby causing the breakaway of the wearing parts from the pangolin scale, as well as partial fracture and injury. The figure shows that the contact bond of the tip is severely broken. One reason for this is that the total structural force in the tip is less than other parts. Furthermore, greater cohesion in the lower layer of the sand contributes to the fracture of the tip. The contact bond can also be seen when the wearing parts are separated from the pangolin scale. According to the contact bond fields, microscopic injury and deformation were observed. Therefore, the fracture trend at the following moment can be predicted through the contact bond fields.
Figure 7 shows the dynamic contact force chains between the pangolin scale model and the abrasive sand. The contact force contains contact stress and contact tension, which reflects the dynamic force in the simulation system. In Figure 7, the size of the line represents the value of the contact force. The nonuniformly distributed force in the scale is observed from the contact force fields. The size and the direction of the contact forces are the main reasons for the fracture of the pangolin scale. The wear simulation by DEM shows the desquamating behaviors of the wear parts subjected to the abrasive sand. As long as the normal stress is larger than the normal contact bond strength (shown in Table 1) or the tangential stress is larger than the shear contact bond strength (shown in Table 1), wear will appear. The cracks and the injuries were generated by the discrete forces on the scale, and the failure extent intensified when the forces increased. From the dynamic contact force fields, due to the stress concentration, it can be seen that the corners of the pangolin scale suffer severely from stress concentration, where the fracture extent is greater. The fractures occurred because of tensile stress. This indicates that the partial stress on the scale structure is largest under a velocity of 0.62 m/s. When the wear extent becomes stable, the acting forces at the corners of the pangolin scale tend be distributed uniformly.
Figure 8 shows the dynamic velocity fields of the interactions between the pangolin scales and abrasive sand under different velocities. The direction and the length of the arrows represent the direction and the size of the velocity. The velocity field reflects the velocity change for each element at any time. With the pangolin scale moving forward, some particles of abrasive sand are propelled forward, and some others are forced to move up or down due to the resistance of the frontal sand abrasives. The vortex flow of the abrasive sand caused by the moving scale emerges near the scale tip [14]. Correspondingly, due to the abrasive resistance, the element velocity of the scales seems to undergo a nonuniform change. With the velocity increasing, the kinetic energy of the pangolin scale increases greatly. The larger kinetic energy intensifies the motion state of the abrasive sand near the pangolin scale surface, the change frequency of the sand displacement increases and the change range expands. In Figure 8, the nonuniform velocities of the scales, which are caused by the contact force acting on the scales, are shown.
Figure 9 shows the dynamic displacement fields in the abrasive wear system. The direction and the length of arrow represent the direction and the size, respectively. The displacement field reflects the displacement vector change for each element. Therefore, the displacements in the structure reflect the microscopic deflection of the scale structure. In a similar way to the velocity field, the disturbance of the abrasive sand in the partial area is intensified when the velocity increases. Likewise, the element displacement of the scale appears due to the nonuniform change characteristics created by the resistance of the abrasive. The displacement motion of the abrasive sand in the 0.15 m motion had become stable compared of the 0.05 m motion, which indicated that the wear rate of the scale structure led to an invariable constant. From the velocity and the displacement fields of the simulation system, we can see that the scale shape causes the motion of the abrasives to be disturbed by the scale structure during wearing, due to which the abrasive wear trend increases prominently.
3.2. Quantitative Analysis
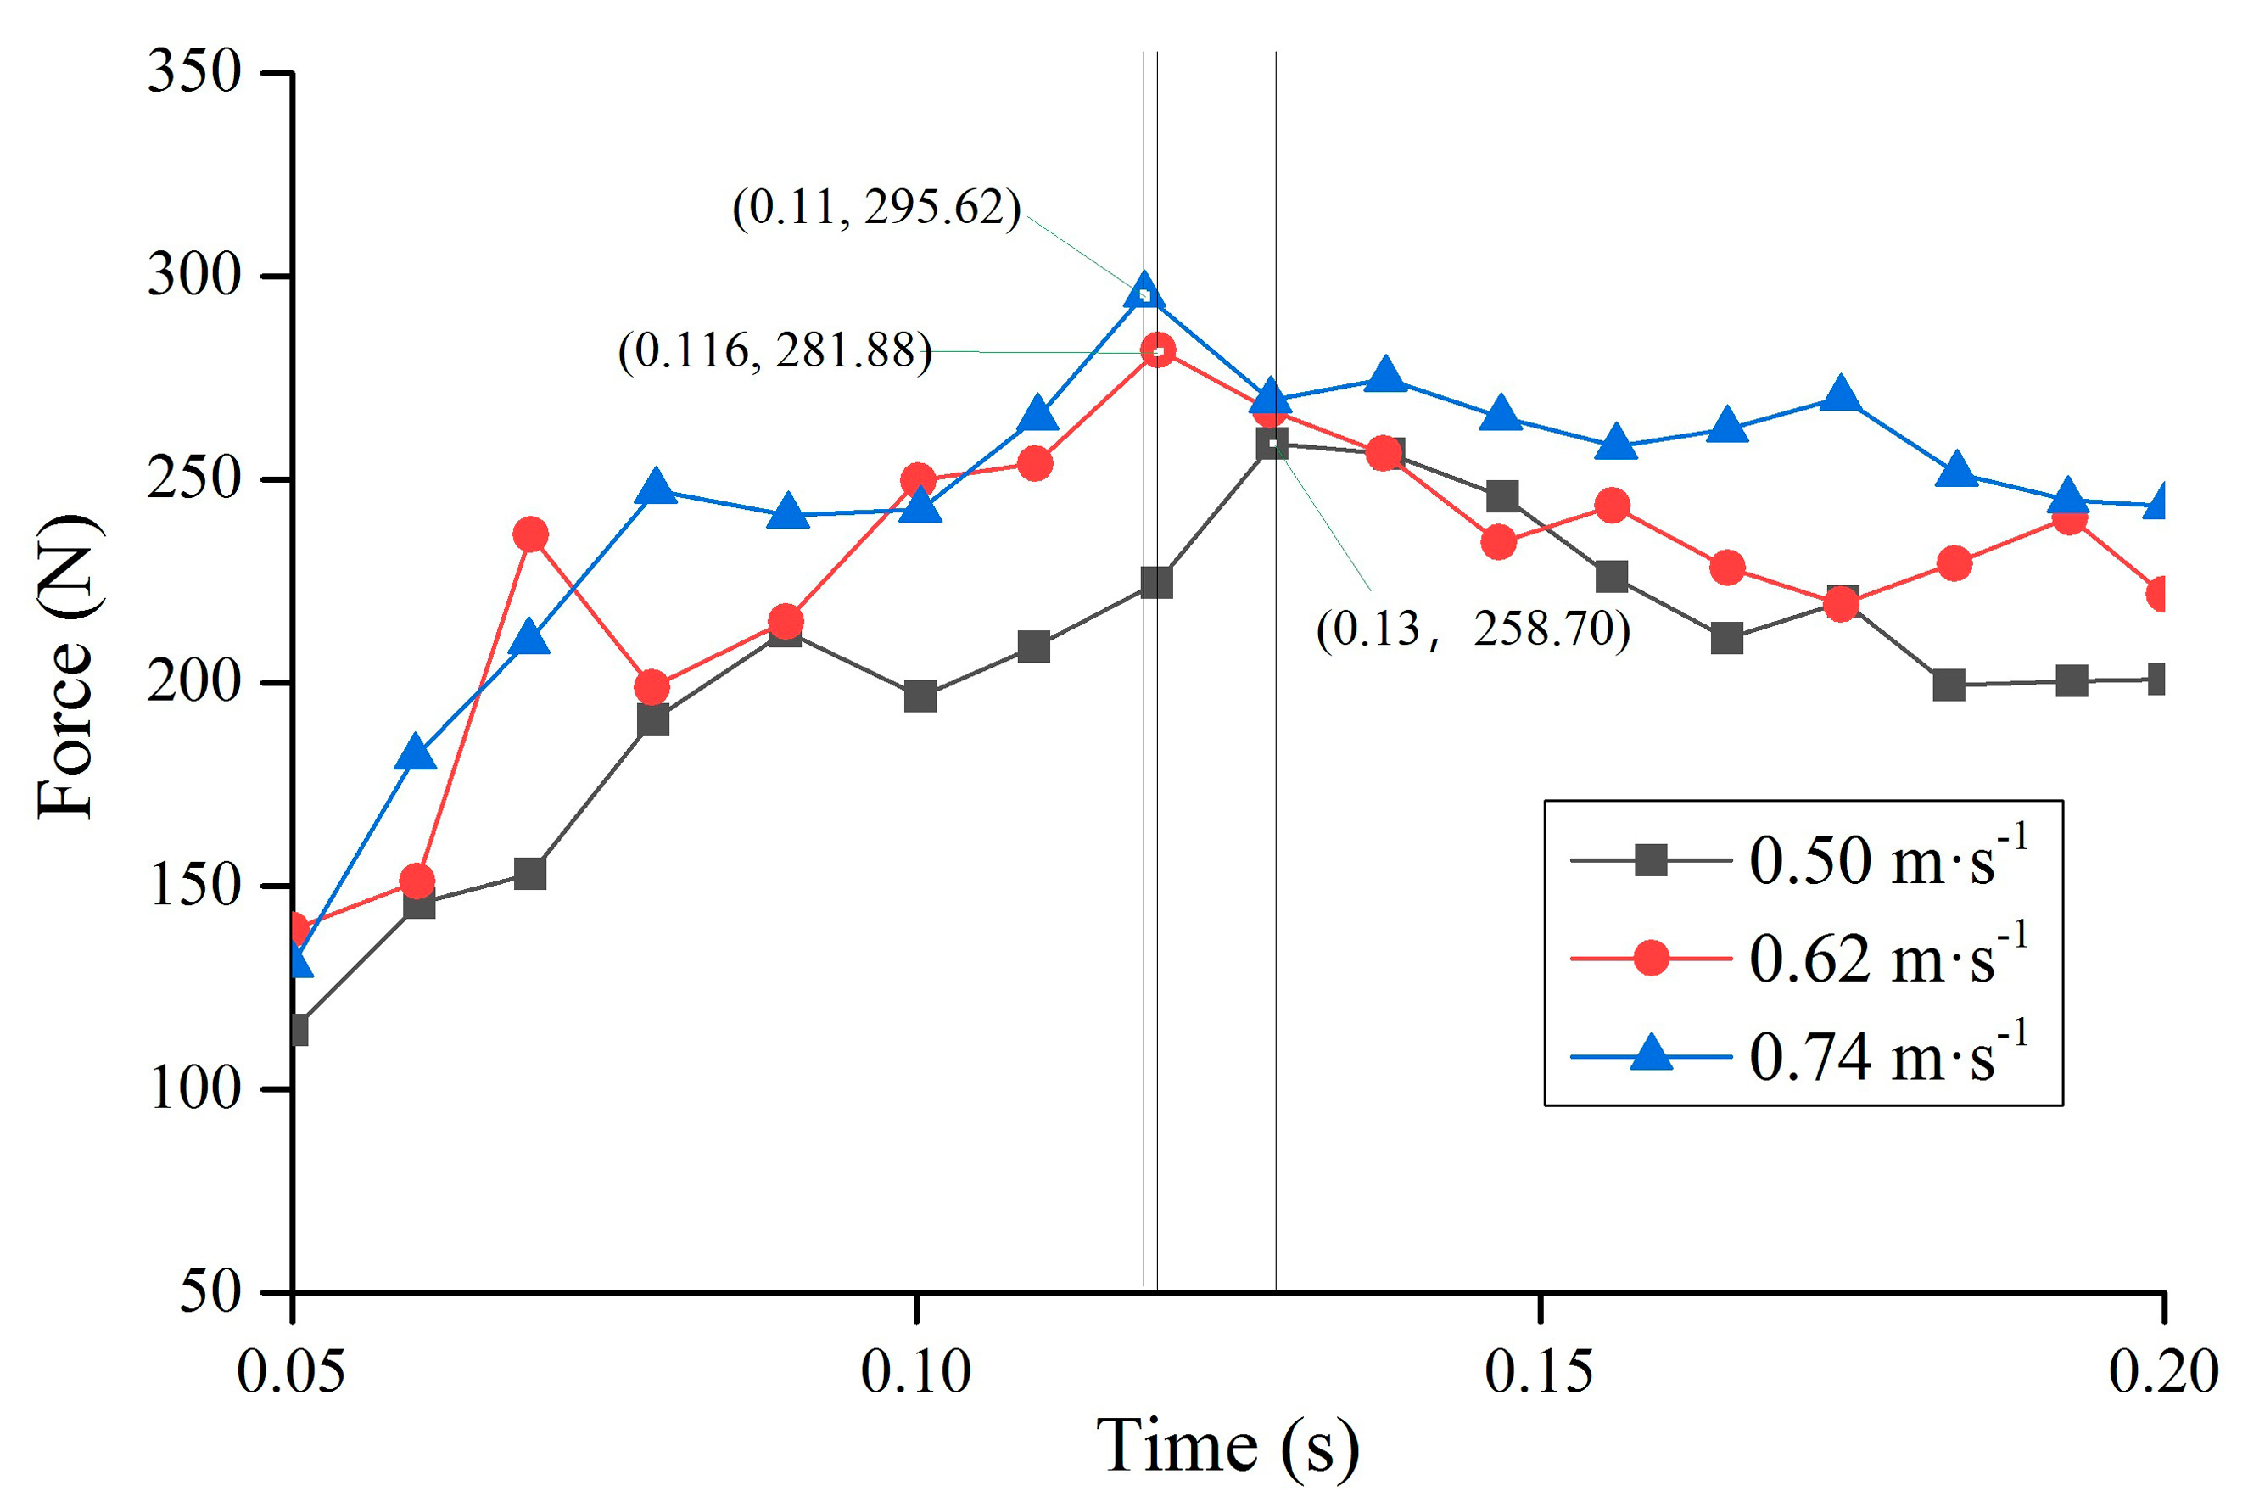
Figure 10 shows the dynamic forces of the pangolin scale surface under different velocities. With the wear time increasing, the dynamic forces increase, and finally reach a stable state. With velocity increasing, the dynamic force increases slightly. The peak in the line represents the concentration stress, which is caused by the cohesion in the abrasive sand and the non-smooth surface of the pangolin scale structure. The dynamic force is about 180~300 N under a velocity of 0.50~0.74 m·s−1. The largest fluctuation in dynamic forces occurred under a velocity of 0.62 m/s during wearing, while the scale structure was severely broken at this velocity.
Figure 11 shows the wear rate of the scale structure between simulations and experiments under different velocities. The wear rate is calculated by the ratio of the wear loss of the scale structure and its displacement. The wear rate is 0.0039 g/m, 0.0056 g/m and 0.0030 g/m at a velocity of 0.50 m·s−1, 0.62 m·s−1 and 0.74 m·s−1, respectively, which is slightly larger than the laboratory test. There are two reasons for this: one is that the contact bonds were added to the sand in case the calculated time of the computer was too long, and the other is that the sample was the aggregate, composed of many discrete particles, which was more easily affected by the abrasive sand in the DEM simulations. However, the comparative abrasive results are that the qualitative wear trends of the curves and the abrasive morphologies in the simulations and experiments are generally consistent with the abrasive results of the experimental and simulation samples at a velocity of 0.62 m·s−1 in Figure 11. Therefore, the wear behavior was clearly obtained from the desquamating behaviors of the wear parts subjected to the abrasive sand by DEM simulation. The change law of the wear rates agrees with that of the laboratory results. The wear loss increases with the increase in velocities in a certain range, and decreases when velocity exceeds this value [15]. In some cases, this is because of the increase in the kinetic energy of the pangolin scales, which is discussed in Section 3.1.
4. Conclusions
Based on DEM theory and the geometrical characteristics of pangolin scales, a DEM dynamic abrasive wear system was established. The abrasive wear behaviors of arranged pangolin scales subjected to abrasive sand were simulated under three different velocities. Based on the dynamic contact bond fields, the dynamic contact force fields, the dynamic velocity fields and the dynamic forces acting on the scales, the dynamic abrasive wear behaviors of the pangolin scale were analyzed.
The wear extent increases with velocity in a certain range. When the velocity exceeds a certain value, the increase in wear extent will slow down. With the kinetic energy increasing, the pangolin scale models cannot make complete contact with the sand abrasives, and the wear extent decreases in some cases. A severe concentration of stress occurs on the scale tip, where the scale is severely worn. The main failure mode is fracture with relative displacements. The wear extent of scale then stress reaches a stable state finally. Lastly, the morphology of the worn part reaches an arc. The vortex flow emerges near the scale tip, caused by the passive movement of abrasive sand particles. The configuration of the pangolin scale is helpful for intensifying the disturbance of the abrasive sand in some areas. The wear rates in the simulations agree with those of the laboratory wear tests. The DEM simulation is helpful to reveal the wear behavior of the pangolin surface. Moreover, it provides a new method for studying the abrasive wear behaviors of biological surfaces.
Author Contributions
In this research activity, all authors (R.Z., H.Y., H.P., G.C., W.T.) were involved in the data collection and preprocessing phase, model constructing, empirical research, results analysis and discussion, and manuscript preparation. All authors have read and agreed to the published version of the manuscript.
Funding
This work is financial support by the National Natural Science Foundations of China (Grant No. 50805064).
Conflicts of Interest
The authors declare no conflict of interest.
References
- Ma, Y.; Wang, H.; Xiao, Y.; Fan, X.; Tong, J.; Guo, L. Friction and wear behaviour of steel with bionic non-smooth surfaces during sliding. Mater. Sci. Technol. 2016, 32, 257–265. [Google Scholar] [CrossRef]
- Ren, L.; Yang, Z.; Han, Z. Non-smooth wearable surfaces of living creatures and their bionic application. Trans. Chin. Soc. Agric. Eng. 2005, 36, 144–147. [Google Scholar]
- Tian, L.; Bu, Z.; Chen, Q.; Li, W.; Li, X. Casting method of rib-like bionic non-smooth surface. Trans. Chin. Soc. Agric. Eng. 2011, 27, 189–194. [Google Scholar]
- Tong, J.; Tie, L.; Ma, Y.; Wang, H.; Ren, L.; Arnell, R.D. Two-body abrasive wear of the surfaces of pangolin scales. J. Bionic Eng. 2007, 4, 77–84. [Google Scholar] [CrossRef]
- Liu, Z.; Jiao, D.; Weng, Z.; Zhang, Z. Structure and mechanical behaviors of protective armored pangolin scales and effects of hydration and orientation. J. Mech. Behav. Biomed. 2016, 56, 165–174. [Google Scholar] [CrossRef] [PubMed]
- Jeronimids, G.; Atkins, A.G. Mechanics of biological materials and structures: Nature’s lessons for the engineer. J. Mech. Eng. Sci. 1995, 209, 221–235. [Google Scholar] [CrossRef]
- Xu, L.; Luo, K.; Zhao, Y. Numerical prediction of wear in SAG mills based on DEM simulations. Powder Technol. 2018, 329, 353–363. [Google Scholar] [CrossRef]
- Tandler, R.; Bohn, N.; Gabbert, U.; Woschke, E. Analytical wear model and its application for the wear simulation in automotive bush chain drive systems. Wear 2020, 446–447, 203193. [Google Scholar] [CrossRef]
- Itasca Consulting Group Inc. PFC2D Manual, Version 4.0; Itasca Consulting Group Inc.: Minneapolis, MN, USA, 2008. [Google Scholar]
- Tong, J.; Mohammad, M.; Zhang, J.; Ma, Y.; Rong, B.; Chen, D.; Menon, C. DEM Numerical Simulation of Abrasive Wear Characteristics of a Bioinspired Ridged Surface. J. Bionic Eng. 2010, 7, 175–181. [Google Scholar] [CrossRef]
- Zhang, R.; Li, J. Simulation on mechanical behavior of cohesive soil by Distinct Element Method. J. Terramech. 2006, 43, 303–316. [Google Scholar] [CrossRef]
- Jureczka, M.; Ochal, A. Numerical analysis and simulations of contact problem with wear. Comput. Math. Appl. 2019, 111, 2980–2988. [Google Scholar] [CrossRef]
- Tong, J.; Ma, Y.; Ren, L.; Li, J. Terminological characteristics of Pangolin scales in dry sliding. J. Mater. Sci. Lett. 2000, 19, 529–532. [Google Scholar] [CrossRef]
- Zhang, R.; Han, D.; He, Y.; Wan, H.; Ma, S.; Li, J. Drag reduction and wear resistance mechanisms of a bionic shovel by discrete element method simulation. Simulation 2019, 3, 231–239. [Google Scholar] [CrossRef]
- Bedolla, P.; Vorlaufer, G.; Rechberger, C.; Bianchi, D.; Pauschitz, A. Combined experimental and numerical simulation of abrasive wear and its application to a tillage machine component. Tribol. Int. 2018, 127, 122–128. [Google Scholar] [CrossRef]
Figure 1.
The scales of pangolin (Manis pentadactyla).

Figure 2.
The non-linear mechanical model of scale structure.

Figure 3.
The DEM simulation system of pangolin scale.

Figure 4.
Abrasive wear tester based on rotary abrasive disc. (a) Photograph of the tester, (b) schematic diagram of the tester. Values 1–3 indicate the compacting wheels; 4 is the scraping plate; 5–8 refer to the test specimens; 9 indicates the subsoiler; 10 is the abrasive rotary disc.
Figure 4.
Abrasive wear tester based on rotary abrasive disc. (a) Photograph of the tester, (b) schematic diagram of the tester. Values 1–3 indicate the compacting wheels; 4 is the scraping plate; 5–8 refer to the test specimens; 9 indicates the subsoiler; 10 is the abrasive rotary disc.

Figure 5.
The abrasive wear morphology of pangolin scale.


Figure 6.
The dynamic contact bond field of the pangolin scale and abrasive sand.

Figure 7.
The dynamic contact force fields of the pangolin scale and abrasive sand.

Figure 8.
The dynamic velocity fields of the pangolin scale and abrasive sand.

Figure 9.
The dynamic displacement fields of the pangolin scale and abrasive sand.

Figure 10.
The dynamic forces of the pangolin scale.

Figure 11.
The wear rates of the scale structure of simulation and laboratory.


Table 1.
The Discrete Element Method (DEM) calculation parameters of scale structure.
| Parameters | Density (kg/m3) | Particle Radius (mm) | Particle-Particle Contact Normal Stiffness (N·m−1) | Particle-Particle Contact Shear Stiffness (N·m−1) | Normal Contact Bond Strength (N) | Shear Contact Bond Strength (N) | Friction Coefficient |
|---|---|---|---|---|---|---|---|
| Value | 1755 | 0.15 | 9.42 × 10⁷ | 1.44 × 10⁷ | 1.10 × 10² | 1.02 × 10² | 0.75 |
Table 2.
The DEM calculation parameters of sand.
| Parameters | Density (kg/m3) | Particle Radius (mm) | Particle-particle Contact Normal Stiffness (N·m−1) | Particle-Particle Contact Shear Stiffness (N·m−1) | Normal Critical Damping Ratio | Shear Critical Damping Ratio | Friction Coefficient |
|---|---|---|---|---|---|---|---|
| Value | 1605 | 0.11–0.20 | 9.25 × 10⁷ | 1.01 × 10⁷ | 0.80 | 0.58 | 0.72 |
© 2020 by the authors. Licensee MDPI, Basel, Switzerland. This article is an open access article distributed under the terms and conditions of the Creative Commons Attribution (CC BY) license (http://creativecommons.org/licenses/by/4.0/).
Share and Cite
MDPI and ACS Style
Zhang, R.; Yu, H.; Pang, H.; Chen, G.; Tai, W. Analysis of Wear-Resistant Surface with Pangolin Scale Morphology by DEM Simulation. Appl. Sci. 2020, 10, 2896. https://doi.org/10.3390/app10082896
AMA Style
Zhang R, Yu H, Pang H, Chen G, Tai W. Analysis of Wear-Resistant Surface with Pangolin Scale Morphology by DEM Simulation. Applied Sciences. 2020; 10(8):2896. https://doi.org/10.3390/app10082896
Chicago/Turabian StyleZhang, Rui, Haibin Yu, Hao Pang, Guangming Chen, and Weihsun Tai. 2020. "Analysis of Wear-Resistant Surface with Pangolin Scale Morphology by DEM Simulation" Applied Sciences 10, no. 8: 2896. https://doi.org/10.3390/app10082896
Note that from the first issue of 2016, this journal uses article numbers instead of page numbers. See further details here.