Article

Front-End Amplifiers for Tuning Forks in Quartz Enhanced PhotoAcoustic Spectroscopy

1
PolySense Lab—Dipartimento Interateneo di Fisica, Politecnico and University of Bari, CNR-IFN, Via Amendola 173, 70126 Bari, Italy
2
Photonics Research Group, Dipartimento di Ingegneria Elettrica e dell’Informazione, Politecnico di Bari, Via Orabona 4, 70126 Bari, Italy
3
Institute of Electronic Systems, Warsaw University of Technology, Nowowiejska 15/19, 00-665 Warsaw, Poland
4
Department of Electrical and Computer Engineering, Rice University, 6100 Main Street, Houston, TX 77005, USA
*
Author to whom correspondence should be addressed.
Appl. Sci. 2020, 10(8), 2947; https://doi.org/10.3390/app10082947
Submission received: 31 March 2020 / Revised: 18 April 2020 / Accepted: 19 April 2020 / Published: 24 April 2020
(This article belongs to the Special Issue Quartz-Enhanced Photoacoustic and Photothermal Spectroscopy)

Abstract

:
A study of the front-end electronics for quartz tuning forks (QTFs) employed as optoacoustic transducers in quartz-enhanced photoacoustic spectroscopy (QEPAS) sensing is reported. Voltage amplifier-based electronics is proposed as an alternative to the transimpedance amplifier commonly employed in QEPAS experiments. The possibility to use differential input/output configurations with respect to a single-ended configuration has also been investigated. Four different architectures have been realized and tested: a single-ended transimpedance amplifier, a differential output transimpedance amplifier, a differential input voltage amplifier and a fully differential voltage amplifier. All of these amplifiers were implemented in a QEPAS sensor operating in the mid-IR spectral range. Water vapor in ambient air has been selected as the target gas species for the amplifiers testing and validation. The signal-to-noise ratio (SNR) measured for the different configurations has been used to compare the performances of the proposed architectures. We demonstrated that the fully differential voltage amplifier allows for a nearly doubled SNR with respect to the typically used single-ended transimpedance amplifier.

1. Introduction

Optical sensors are well established for real-time, in situ and non-invasive trace gas detection [1]. They are widely exploited in different fields, such as breath analysis [2], environmental monitoring [3], industrial control [4] and explosive detection [5]. Among sensors based on optical techniques, quartz-enhanced photoacoustic spectroscopy (QEPAS) sensors have proved their capability to detect low gas concentrations, down to a part-per-trillion in volume [6]. In QEPAS, a laser beam is focused between the prongs of a quartz tuning fork (QTF) [7,8]. If the laser wavelength is resonant with a radiative transition, modulated-intensity light absorption causes the generation of weak acoustic waves via non-radiative relaxation processes. The acoustic wave is then detected by the QTF if the laser modulation frequency matches a QTF resonance frequency. Due to the quartz piezoelectric property, the prongs mechanical strain induced by the acoustic wave on the QTF generates a displacement of charges. Gold electrodes deposited on the QTF surface collect the charges and allow the electrical signal to be acquired [9]. The lowest gas concentration detectable by the sensor is strictly related to the signal-to-noise ratio (SNR). Therefore, the front-end electronics must be designed in order to collect the QTF signal as well as to keep the noise as low as possible. With this aim, several architectures can be studied for enhancing the SNR. The QTF piezo-electric signal can be considered either as a current or as a voltage signal. Thus, the QTF can be represented both as a current source and as a voltage source, each requiring an appropriate way to collect the generated signal. When represented as a current source, the front-end electronics for the QTF is implemented as a transimpedance amplifier, which is the most common configuration for sensitive elements generating current signals when externally stimulated [10,11,12]. In transimpedance amplifiers, the current signal is converted into a voltage signal by an operational amplifier, in which a feedback loop resistor defines the current-to-voltage conversion coefficient (i.e., transimpedance). The higher the value of the feedback loop resistor, the higher the gain and the noise of the amplifier, whereas the bandwidth decreases. In such a single-ended configuration, the resistor thermal noise directly affects the current signal generated by the QTF [13]. Transimpedance amplifiers have been widely employed for studying the performance of QEPAS sensors [14,15,16] and QTFs [17,18]. However, a different approach can also be used. The quartz charge constant, i.e., the electric charges developed per applied stress, is 4.6 pC/N, while the voltage constant, which represents the electric field produced in the quartz per applied stress, results 118 V∙m/N [19,20,21,22]. These parameters characterize the piezoelectric properties of quartz and suggest that the QTF could have a low charge sensitivity but a high voltage sensitivity, and that the front-end electronics to be used is a voltage amplifier.
In [23], a preliminary study on the performances of a transimpedance and a voltage amplifier employed as the QTF front-end electronics was performed by exciting the sensitive element with a speaker. In this work, we propose four different amplifier architectures to collect and amplify the QTF signal when employed in a standard mid-IR QEPAS sensor. A quantum cascade laser (QCL) was used as the excitation source for the QEPAS sensor to detect water vapor in standard air. For all amplifier architectures, the SNR has been calculated as the ratio between the peak values of the normalized QEPAS signal (corresponding to the maximum of the water absorption features) and the standard deviation of the normalized QEPAS signal acquired far from the absorption features.

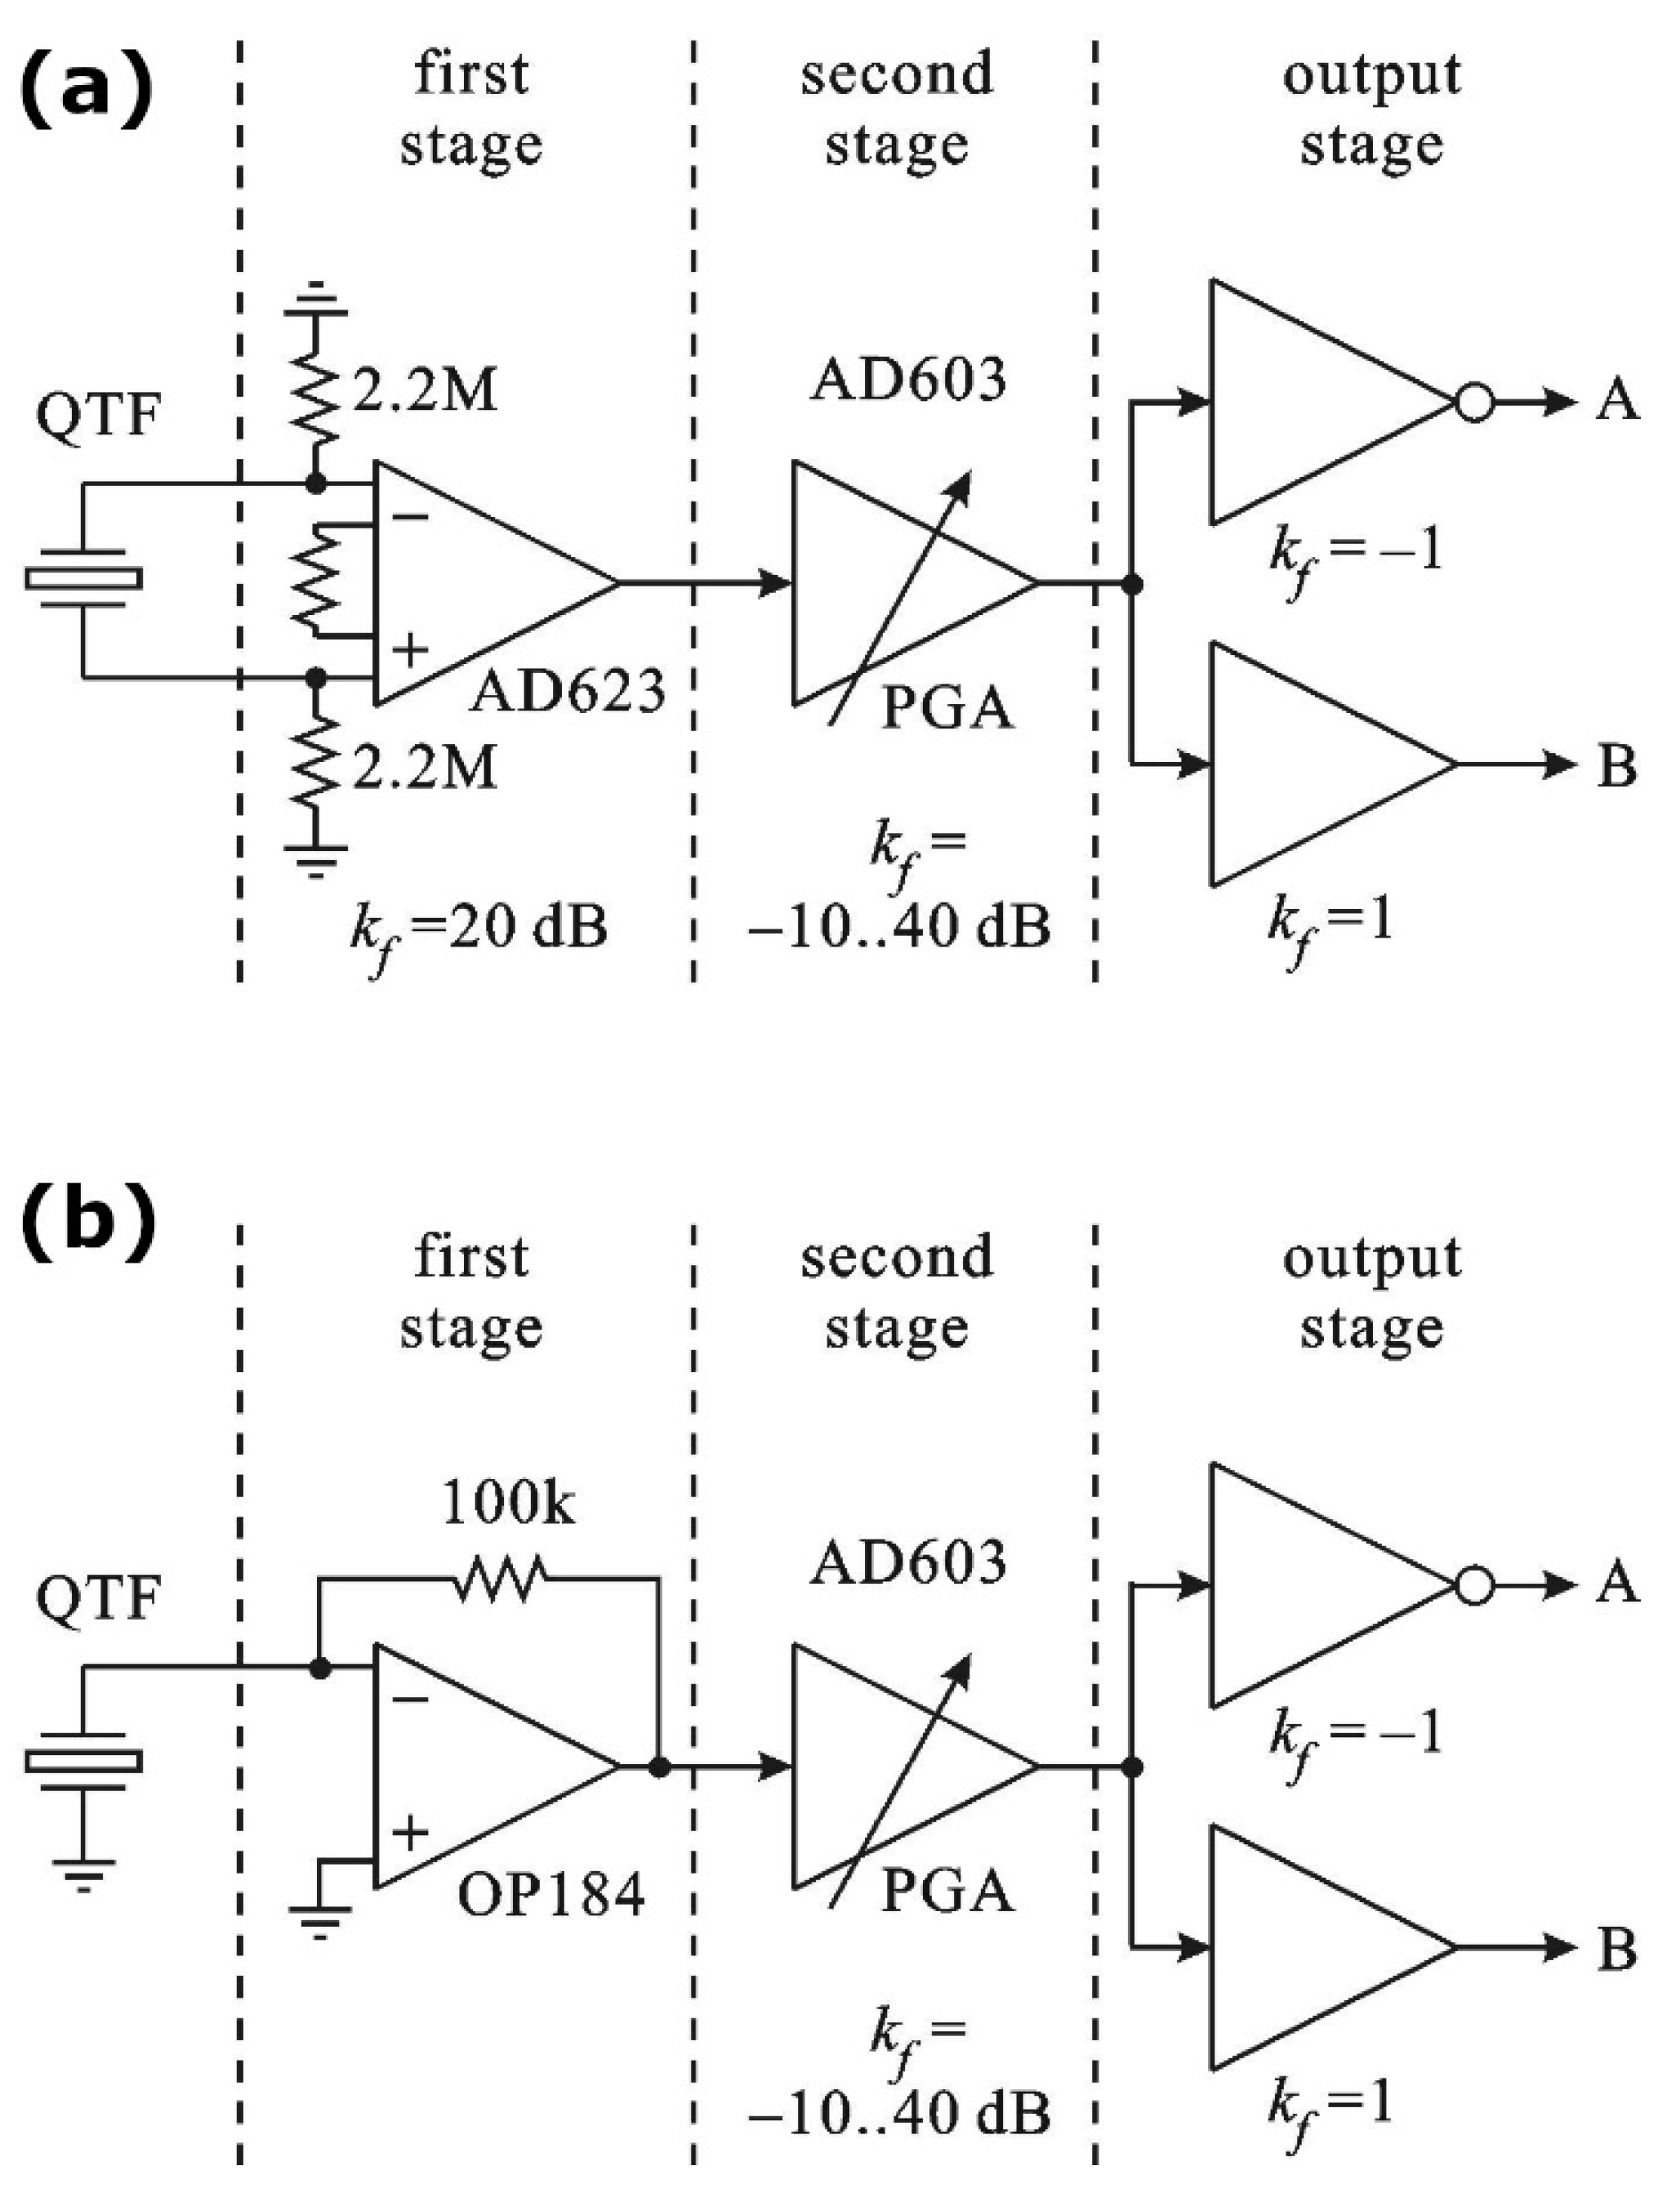
2. Front-End Electronics Architecture

This investigation on representing a quartz tuning fork as a current or a voltage source aims to enhance the performance of the front-end electronics in terms of the collected signal. The SNR can be further improved by designing an amplifier input/output architecture that lowers the signal noise. The most common amplifier architecture employed in QEPAS sensors has a single-ended input configuration, where the voltage signal is referred to ground, as shown in Figure 1a. The noise affecting the QTF signal is a combination of the common-mode and differential-mode noise. This last type of noise is related to the characteristics of the sensitive element (e.g., thermal noise, shot noise) [24]. Once each noise source is characterized, a differential-mode contribution can be lowered by an analog filter. The common-mode noise is mainly related to electromagnetic interferences [25,26] and their contribution can be lowered by using a differential input amplifier (Figure 1b) [27].
In a typical QEPAS set-up, the amplified QTF signal is further demodulated by a lock-in amplifier. An improvement of the SNR can be achieved by employing a differential demodulation of the QTF signal. In this case, an amplifier architecture with a differential output configuration is required. The two outputs of the amplifier are fed into the lock-in amplifier for differential demodulation, as shown in Figure 1c. By combining the advantages provided by a differential input and a differential output configuration, a fully differential amplifier, as depicted in Figure 1d, is expected to yield the highest SNR.
Among the eight possible amplifier architectures obtained by alternating between a transimpedance and voltage amplifier, combined with the four input/output configurations shown in Figure 1, the performances of the four amplifier architectures were investigated and compared: a single-ended transimpedance amplifier, a differential output transimpedance amplifier, a differential input voltage amplifier, and a fully differential voltage amplifier. Circuit diagrams of the tested QTF amplifiers are depicted in Figure 2.
In both cases, the amplifier consists of three stages. The first one contains an input circuit working in a voltage (Figure 2a) or transimpedance (Figure 2b) mode. The use of an instrumentational amplifier (AD623) [28] in the voltage input amplifier (Figure 2a) allows for the implementation of a fully differential input, in which the QTF is placed between the inverting and non-inverting inputs of the amplifier and none of these inputs are tied to the local signal ground of the signal amplifier, (the 2.2 MOhm resistors are used only in order to supply the minimum necessary bias current to both inputs). The separation of both inputs from the ground of the measurement apparatus set-up reduces the influence of the noise (such as electromagnetic parasitic interferences from the environment) that may be induced on the ground plane in the case of a non-differential configuration. The transimpedance input (Figure 2b) is implemented in a standard way. The remaining two stages shown in Figure 2a,b are identical in both amplifiers. The second stage is a programmable gain amplifier (PGA) based on an AD603 voltage gain amplifier (VGA) [29], in which the gain was adjustable with a potentiometer. A PGA was used instead of a fixed gain amplifier to easily adjust the gain, depending on the level of photoacoustic signal obtained in the experiments. The third stage consists of two fixed gain amplifiers which produce the output signals in counter-phase. As a result, we obtained a single-ended output (if only one of the output channels: A or B is used) or a differential output (in such a case both outputs, A and B must be used). Obviously, with such an implementation, the amplitude of the differential output signal was twice the single-ended output signal amplitude.

3. Quartz-Enhanced Photoacoustic Sensor

The QEPAS sensor setup employed to investigate the performance of the proposed amplifiers is depicted in Figure 3.
A single-mode continuous-wave distributed-feedback QCL with a central emission at 7.72 µm was used as the light source. The QCL operates in the 20–30 °C temperature range and in the 140–280 mA injected current range. The laser beam was focused between the prongs of the QTF by using a ZnSe lens with a focal length of 75 mm (L1 in Figure 3). Its transmittance is 95% at the laser wavelength. The employed QTF has prongs spaced by 800 μm in order to minimize possible optical noise due to the light hitting the QTF prongs [17]. The frequency of the fundamental resonance mode is f0 = 12456.16 Hz at atmospheric pressure. The QTF is mounted in an acoustic detection module (ADM) equipped with two ZnSe windows for the laser beam’s entrance and exit. Beyond the ADM, a ZnSe lens (L2 in Figure 3) collects the light on the sensitive element of a power meter for optical alignment. A standard air cylinder and a Nafion humidifier were used to generate a gas mixture with a constant water vapor concentration of 2%. A gas flow controller was used to fix the mixture flow to 30 sccm, while a vacuum pump and a pressure controller were used to fix the gas pressure to 760 Torr. Wavelength modulation spectroscopy with second harmonic demodulation was employed as a detection scheme [30]. Laser wavelength modulation was achieved by dithering the current driver with a sinusoidal wave with a frequency of f = f0/2. A ramp with a frequency of 5 mHz was added to the laser current driver in order to scan the wavelength emission across the absorption line. Both the fast modulation and the ramp were provided by a waveform generator (Tektronix AFG102). The QEPAS sensor architecture allowed for an easy interchange of the QTF front-end amplifiers, without altering the experimental conditions. A National Instrument Data Acquisition (DAQ) card (NI USB-6008) was used to acquire the QTF signal demodulated by a PerkinElmer 7265 lock-in amplifier. The lock-in integration time was set to 100 ms and the signal acquisition time to 300 ms. The reference signal for the lock-in amplifier was provided by the TTL output channel of the waveform generator.
At a laser operating temperature of 20 °C within its current dynamic range, the wavelength emission of the QCL ranges from 1296 to 1298 cm−1. In this spectral range, the HITRAN database was used to simulate the absorption cross-section spectrum of standard air [31] as shown in Figure 4.
For our investigation, we selected the two highest water vapor absorption features, which peaked at 1296.48 and 1296.71 cm−1 with absorption cross-sections of 4.7 × 10⁻²³ and 3.1 × 10⁻²³ cm2/molecule, respectively.

4. Results and Discussion

The performances of the four amplifiers were evaluated and compared by acquiring the QEPAS spectral scans of the water absorption features, as shown in Figure 4. The QEPAS signal was recorded while varying the laser current, i.e., the laser wavenumber. In Figure 5, the normalized QEPAS spectral scans obtained by using the four different architecture amplifiers are reported. Normalization was performed to allow for an easy comparison of the SNRs. Measurements were performed by switching the amplifiers and maintaining the experimental conditions, namely the gas pressure, flow and concentration, as well as the optical alignment and lock-in integration time being fixed. For each spectral scan a current modulation depth of 24 mA was used, thereby maximizing the two QEPAS peaks signals.
In each spectral scan, the two water vapor absorption peaks are clearly distinguishable with a small overlap between the negative lobes of the 2f-waveforms. The range between 1296.1 and 1296.25 cm−1 is free from any absorption feature as also shown by a HITRAN simulation in Figure 4. Hence, this range is suitable for the estimation of the 1σ noise level for the amplifiers under test. Starting from these values, the SNR of the two peaks was calculated for each employed amplifier as the performance parameter to be compared. The noise levels and SNRs for both water vapor peaks are summarized in Table 1 for the four amplifier architectures.
By using a single-ended transimpedance amplifier (Figure 5a), the measured noise is 0.0172, with an SNRST of the strongest water vapor peak of 58. With the differential output transimpedance amplifier (Figure 5b), the QEPAS noise measured is 0.0130 with an SNRDT of 77 for the same water vapor absorption line, 1.3 times higher than the value obtained with the single-ended architecture. This result confirms that the SNR can be enhanced when a differential design is selected. The noise level measured by using a differential input voltage amplifier is 0.0107 (Figure 5c). The calculated SNRDIV is 93, 1.6 times greater than SNRST and 1.22 times greater than SNRDT, suggesting that a voltage amplifier architecture improves the QTF front-end electronics performance. This result is confirmed by the measurements made by using the fully differential voltage amplifier architecture. For a QEPAS noise of 0.00951 (Figure 5d), the achieved SNRFDV for the peak at 1296.48 cm−1 is 105. Combined with a differential output configuration, the voltage amplifier architecture leads to an overall SNR enhancement of nearly double, with respect to the most used single-ended transimpedance amplifier. This demonstrates that a QTF can be more efficiently schematized as a voltage generator rather than a current generator. Similar results have been obtained for the SNRs measured for the water vapor peak falling at 1296.71 cm−1.

5. Conclusions

In this work, four different architectures were tested for the front-end amplifier electronics of a QTF employed as an optoacoustic transducer in a QEPAS sensor. The QEPAS spectra measured for H2O vapor in air show that the differential architecture improves the SNR, with respect to the single-ended configuration for both transimpedance and voltage amplifiers. This confirms that the differential structure allows for an increase in the SNR. Moreover, the performed experiments show that the voltage configuration of the QEPAS preamplifier based on an AD623 instrumentational amplifier has better noise properties with respect to the transimpedance configuration employing with OP184. The AD623-based fully differential voltage amplifier results in a SNRFDV 1.4 times higher than SNRDT measured with a differential output transimpedance amplifier, and 1.8 times higher than SNRST measured with the commonly employed single-ended transimpedance amplifier, both based on the OP184 component. All of these measurements pave the way for designing an application-specific integrated circuit (ASIC). The integrated circuits will allow for a better signal path matching and thus, further enhancing the QEPAS SNR.

Author Contributions

Conceptualization, All; methodology, All; measurements, P.Z.W., T.S., G.M., S.D.R., A.S., M.G.; preamplifiers design, P.Z.W.; investigation, G.M., A.S., P.P., M.G.; data curation, All; writing—original draft preparation, G.M., A.S., M.G.; writing—review and editing, All; supervision, V.S. All authors have read and agree to the published version of the manuscript.

Funding

The authors from Dipartimento Interateneo di Fisica di Bari acknowledge the financial support from the European Union’s Horizon 2020 research and innovation programme under the Marie Skłodowska-Curie project OPTAPHI, grant No. 860808 and from THORLABS GmbH within the joint-research laboratory. The authors from Warsaw University of Technology work acknowledge the financial support granted by the Polish Ministry of Science and Higher Education. Frank K. Tittel acknowledges support by the Robert Welch Foundation (Grant No. C0586).

Conflicts of Interest

The authors declare no conflict of interest.

References

  1. Hodgkinson, J.; Tatam, R.P. Optical gas sensing: A review. Meas. Sci. Technol. 2013, 24, 012004. [Google Scholar] [CrossRef] [Green Version]
  2. Wang, C.; Sahay, P. Breath Analysis Using Laser Spectroscopic Techniques: Breath Biomarkers, Spectral Fingerprints, and Detection Limits. Sensors 2009, 9, 8230–8262. [Google Scholar] [CrossRef] [PubMed]
  3. Fehér, M.; Martin, P.A. Tunable diode laser monitoring of atmospheric trace gas constituents. Spectrochim. Acta A 1995, 51, 1579–1599. [Google Scholar] [CrossRef]
  4. Zhang, L.; Tian, G.; Li, J.; Yu, B. Applications of absorption spectroscopy using quantum cascade lasers. Appl. Spectrosc. 2014, 68, 1095–1107. [Google Scholar] [CrossRef] [PubMed]
  5. Strle, D.; Štefane, B.; Zupanič, E.; Trifkovič, M.; Maček, M.; Jakša, G.; Kvasič, I.; Muševič, I. Sensitivity comparison of vapor trace detection of explosives based on chemo-mechanical sensing with optical detection and capacitive sensing with electronic detection. Sensors 2014, 14, 11467–11491. [Google Scholar] [CrossRef] [PubMed] [Green Version]
  6. Patimisco, P.; Sampaolo, A.; Dong, V.; Tittel, F.K.; Spagnolo, V. Recent advances in quartz enhanced photoacoustic sensing. Appl. Phys. Rev. 2018, 5, 011106. [Google Scholar] [CrossRef]
  7. Friedt, J.-M.; Carry, É. Introduction to the quartz tuning fork. Am. J. Phys. 2007, 75, 415–422. [Google Scholar] [CrossRef] [Green Version]
  8. The Quartz Crystal Model and Its Frequencies. Technical Note 32, Rev. A. Statek. Available online: http://statek.com/wp-content/uploads/2018/03/tn32.pdf (accessed on 25 March 2020).
  9. Patimisco, P.; Sampaolo, A.; Giglio, M.; Mackoviak, V.; Rossmadl, H.; Gross, B.; Cable, A.; Tittel, F.K.; Spagnolo, V. Octupole electrode pattern for tuning forks vibrating at the first overtone mode in quartz-enhanced photoacoustic spectroscopy. Opt. Lett. 2018, 43, 1854–1857. [Google Scholar] [CrossRef]
  10. Lau, K.S.; Tan, C.H.; Ng, B.K.; Li, K.F.; Tozer, R.C.; David, J.P.R.; Rees, G.J. Excess noise measurement in avalanche photodiodes using a transimpedance amplifier front-end. Meas. Sci. Technol. 2006, 17, 1941–1946. [Google Scholar] [CrossRef]
  11. Masunaga, M.; Sato, S.; Kuwana, R.; Sugii, N.; Shima, A. 4H-SiC CMOS Transimpedance Amplifier of Gamma-Irradiation Resistance Over 1 MGy. IEEE Trans. Electron Devices 2020, 67, 224–229. [Google Scholar] [CrossRef]
  12. Demirtaş, M.; Erişmiş, M.A.; Güneş, S. Analysis and design of a transimpedance amplifier based front-end circuit for capacitance measurements. SN Appl. Sci. 2020, 2, 280. [Google Scholar] [CrossRef] [Green Version]
  13. Asparuhova, K.K.; Gadjeva, E.D. Noise analysis of operational amplifier circuits using MATLAB. In Proceedings of the 27th International Spring Seminar on Electronics Technology: Meeting the Challenges of Electronics Technology Progress, Bankya, Bulgaria, 13–16 May 2004. [Google Scholar]
  14. Elefante, A.; Giglio, M.; Sampaolo, A.; Menduni, G.; Patimisco, P.; Passaro, V.M.N.; Wu, H.; Rossmadl, H.; Mackowiak, V.; Cable, A.; et al. Dual-Gas Quartz-Enhanced Photoacoustic Sensor for Simultaneous Detection of Methane/Nitrous Oxide and Water Vapor. Anal. Chem. 2019, 91, 12866–12873. [Google Scholar] [CrossRef] [PubMed]
  15. Sampaolo, A.; Csutak, S.; Patimisco, P.; Giglio, M.; Menduni, G.; Passaro, V.; Tittel, F.K.; Deffenbaugh, M.; Spagnolo, V. Methane, ethane and propane detection using a compact quartz enhanced photoacoustic sensors and a single interband cascade laser. Sens. Act. B Chem. 2019, 282, 952–960. [Google Scholar] [CrossRef]
  16. Giglio, M.; Zifarelli, A.; Sampaolo, A.; Menduni, G.; Elefante, A.; Blanchard, R.; Pfluegl, C.; Witinski, M.F.; Vakhshoori, D.; Wu, H.; et al. Broadband detection of methane and nitrous oxide using a distributed-feedback quantum cascade laser array and quartz-enhanced photoacoustic sensing. Photoacoustics 2020, 17, 100159. [Google Scholar] [CrossRef] [PubMed]
  17. Patimisco, P.; Sampaolo, A.; Giglio, M.; Dello Russo, S.; Mackowiak, V.; Rossmadl, H.; Cable, A.; Tittel, F.K.; Spagnolo, V. Tuning forks with optimized geometries for quartz-enhanced photoacoustic spectroscopy. Opt. Exp. 2019, 27, 1401–1415. [Google Scholar] [CrossRef] [Green Version]
  18. Patimisco, P.; Sampaolo, A.; Zheng, H.; Dong, L.; Tittel, F.K.; Spagnolo, V. Quartz-enhanced photoacoustic spectrophones exploiting custom tuning forks: A review. Adv. Phys. X 2016, 2, 169–187. [Google Scholar] [CrossRef]
  19. Winkowski, M.; Stacewicz, T. Low noise, open-source QEPAS system with instrumentation amplifier. Sci. Rep. 2019, 9, 7–12. [Google Scholar] [CrossRef] [Green Version]
  20. Dosch, J.; Hynd, B. Analysis of electrical noise in piezoelectric sensors. In Proceedings of the Modal Analysis Conference 2007: A Conference and Exposition on Structural Dynamics (IMAC XXV), Orlando, FL, USA, 19–22 February 2007. [Google Scholar]
  21. Tichý, J.; Erhart, J.; Kittinger, E.; Prívratská, J. Principles of Piezoelectricity. In Fundamentals of Piezoelectric Sensorics; Springer: Berlin/Heidelberg, Germany, 2010; pp. 1–14. ISBN 978-3-540-43966-0. [Google Scholar]
  22. Cerda, R.M. Quartz Crystal Characteristics. In Understanding Quartz Crystals and Oscillators; Artech House: Norwood, MA, USA, 2014; pp. 41–74. ISBN 978-1-60807-118-0. [Google Scholar]
  23. Starecki, T.; Wieczorek, P.Z. A High Sensitivity Preamplifier for Quartz Tuning Forks in QEPAS (Quartz Enhanced PhotoAcoustic Spectroscopy) Applications. Sensors 2017, 17, 2528. [Google Scholar] [CrossRef] [Green Version]
  24. Shmaliy, Y.S. One-port noise model of a crystal oscillator. IEEE Trans. Ultrason. Ferroelectr. Freq. Control 2004, 51, 25–32. [Google Scholar] [CrossRef]
  25. Liu, W.; Tsai, C.; Han, T.; Wu, T. An Embedded Common-Mode Suppression Filter for GHz Differential Signals Using Periodic Defected Ground Plane. IEEE Microw. Wirel. Compon. Lett. 2008, 18, 248–250. [Google Scholar]
  26. Wang, S.; Kong, P.; Lee, F.C. Common Mode Noise Reduction for Boost Converters Using General Balance Technique. IEEE Trans. Power Electron. 2007, 22, 1410–1416. [Google Scholar] [CrossRef]
  27. Pallas-Areny, R.; Webster, J.G. Common mode rejection ratio in differential amplifiers. IEEE Trans. Instrum. Meas. 1991, 40, 669–676. [Google Scholar] [CrossRef]
  28. AD623, Single and Dual-Supply, Rail-to-Rail, Low Cost Instrumentation Amplifier. Analog Devices Inc. Available online: https://www.analog.com/media/en/technical-documentation/data-sheets/ad623.pdf (accessed on 25 March 2020).
  29. AD603, Low Noise, 90 MHz Variable Gain Amplifier. Analog Devices Inc. Available online: https://www.analog.com/media/en/technical-documentation/data-sheets/AD603.pdf (accessed on 25 March 2020).
  30. Patimisco, P.; Sampaolo, A.; Bidaux, Y.; Bismuto, A.; Schott, M.; Jiang, J.; Muller, A.; Faist, J.; Tittel, F.K.; Spagnolo, V. Purely wavelength- and amplitude-modulated quartz-enhanced photoacoustic spectroscopy. Opt. Exp. 2016, 24, 25943–25954. [Google Scholar] [CrossRef] [PubMed]
  31. Rothman, L.S.; Gordon, I.E.; Babikov, Y.; Barbe, A.; ChrisBenner, D.; Bernath, P.F.; Birk, M.; Bizzocchi, L.; Boudon, V.; Brown, L.R.; et al. The HITRAN2012 molecular spectroscopic database. J. Quant. Spectrosc. Radiat. Transf. 2013, 130, 4–50. [Google Scholar] [CrossRef]
Figure 1. Schematic of the quartz tuning fork (QTF)/front-end amplifier/lock-in connection for four input/output amplifier configurations: (a) single-ended, (b) differential input, (c) differential output and (d) fully differential.
Applsci 10 02947 g001
Figure 2. Simplified circuit diagrams of the tested QTF signal amplifiers with: (a) voltage amplifier input, (b) transimpedance amplifier input.
Applsci 10 02947 g002
Figure 3. Schematic of the experimental apparatus. ADM—acoustic detection module, QTF—quartz tuning fork, L1, L2—lenses, PC—personal computer.
Applsci 10 02947 g003
Figure 4. Absorption cross-section of standard air at 760 Torr.
Applsci 10 02947 g004
Figure 5. Normalized 2f-QEPAS signals of a mixture containing 2% of water vapor acquired with (a) single-ended transimpedance amplifier, (b) differential output transimpedance amplifier, (c) differential input voltage amplifier and (d) fully differential voltage amplifier. In the insets the enlarged views of the noise fluctuations are shown.
Applsci 10 02947 g005
Table 1. Quartz-enhanced photoacoustic spectroscopy (QEPAS) 1σ noise and signal-to-noise ratio calculated for water vapor absorption features falling at 1296.48 and 1296.71 cm−1 when implementing the four different amplifier architectures.
Amplifier ArchitectureNoise (σ)SNR @ 1296.48 cm−1SNR @ 1296.71 cm−1
Single-Ended Transimpedance0.01725826
Differential Output Transimpedance0.01307734
Differential Input Voltage0.01079341
Fully-Differential Voltage0.0095110549

