Article

A Study on Shock Absorption Characteristics of Honeycomb-Inserted Bollards

1
Department of Mechanical Engineering, Graduate School, Soongsil University, Seoul 06978, Korea
2
Accenture, 100 Peachtree St. Floor 13, Atlanta, GA 30303, USA
3
School of Mechanical Engineering, Soongsil University, Seoul 06978, Korea
*
Author to whom correspondence should be addressed.
Appl. Sci. 2020, 10(9), 3014; https://doi.org/10.3390/app10093014
Submission received: 30 March 2020 / Revised: 21 April 2020 / Accepted: 22 April 2020 / Published: 26 April 2020
(This article belongs to the Special Issue Fracture Mechanics – Theory, Modeling and Applications)

Abstract

:
Lack of shock absorption capability of conventional steel bollards causes significant vehicle damage and, consequently, high repair costs. This research studies a solution to reduce vehicle damage by inserting polylactic acid (PLA) honeycomb structures. A honeycomb-inserted bollard was designed based on numerical simulations using LS-DYNA, which yielded the bollard designed for actual vehicle-bollard collision experiments. Simulation efforts were focused on calculating the acceleration characteristics when a vehicle collides with steel and honeycomb-inserted bollards. Compared to the simulated steel bollards, 20 MPa yield-strength honeycomb-inserted bollard showed 0.017 s delay in the maximum acceleration occurrence time, reduction of the maximum acceleration of 37.4% of that of steel bollards, and a 13.1% reduction in the B-pillar maximum acceleration. Actual vehicle-bollard collision experiments, with a gyro-sensor installed at the test vehicle front bumper frame, also proved improved shock absorption characteristics of the honeycomb-inserted bollards. An experiment with honeycomb-inserted bollard showed a 0.783 s delay in the maximum acceleration occurrence time, a significant delay when compared to steel bollards. The maximum acceleration measured by the gyro-sensor was 0.35 × 10³ m/s2 when the simulation predicted it to be 0.388 × 10³ m/s2, proving the similarity in the simulations and experiments. Thus, this study of shock absorption characteristics promised reduced damage to vehicles and lower repair cost.

1. Introduction

Bollard is a road safety structure that separates sidewalks from streets to prevent vehicles from entering into sidewalks [1,2,3]. In South Korea, stone or steel bollards were widely used until the “Act on Promotion of the Transportation Convenience of Mobility Disadvantaged Persons” was passed in 2019 [4]. This act mandated all bollards to be manufactured with either steel pipes or stainless coated with materials such as polyurethane for the improved safety of the physically-challenged (especially the blinded). Either stone or steel bollards are being used throughout the world as well. The recently increased use of anti-ram bollards to counter the increased vehicle-ramming events, suicide bombings, and other terrorist activities prompted research on their shock absorption and safety protection capabilities. These research papers, however, were mostly focused on reducing or distributing collision shocks to the bollards, instead of to the vehicle [5,6]. This paper, thus, not only focused on the reduced shocks to the bollards but also to the colliding vehicles.
Vehicle-bollard collisions cause significant damages on the colliding vehicles and consequent repair costs. Automobile manufacturers of today are either fully or partially replacing steel materials with lighter ones such as ultra-high-strength steel sheets, aluminum, magnesium, and/or carbon fibers. Additionally, the increased use of various sensors and electronic devices yields higher automobile prices, thus increased repair cost from vehicle-bollard collisions [7,8,9,10,11].
As one of diverse shock absorption schemes, cellular honeycomb structure has higher shock absorption capability due to its higher-strength hexagonal shape when compared to the foam or tube structure [11,12,13,14,15]. It is known to absorb impact energy with its gradual plastic collapsing and high load-carrying abilities and to allow diverse structural designs by adjusting geometric parameters. Its lower prices compared to hydraulic or electromagnetic energy absorption devices further motivates its broader applications in aerospace, mechanical, and civil engineering [16,17].
Therefore, this research started with designing and testing of the honeycomb structure specimen to be inserted into bollards, simulating vehicle-bollard collisions with LS-DYNA, a general-purpose finite element program capable of simulating real world problems, to calculate the shock absorption characteristics of vehicle front bumper frame when colliding into both steel and honeycomb-inserted bollards.
Thus, the LS-DYNA numerical simulations provided data for the honeycomb structure designs, which were three-dimensionally (3D)-printed and inserted inside the bollard cover (“in-plane” insertion). These “in-plane” honeycomb-inserted bollards, along with a conventional steel bollard, were used in the actual vehicle-bollard collision experiments. These experiments allowed a comparison of simulated and measured acceleration characteristics of vehicle front bumper frames during collisions and qualitative observations of the damage done to the vehicle by both steel and honeycomb-inserted bollards.

2. Design and Tests of In-Plane Honeycomb

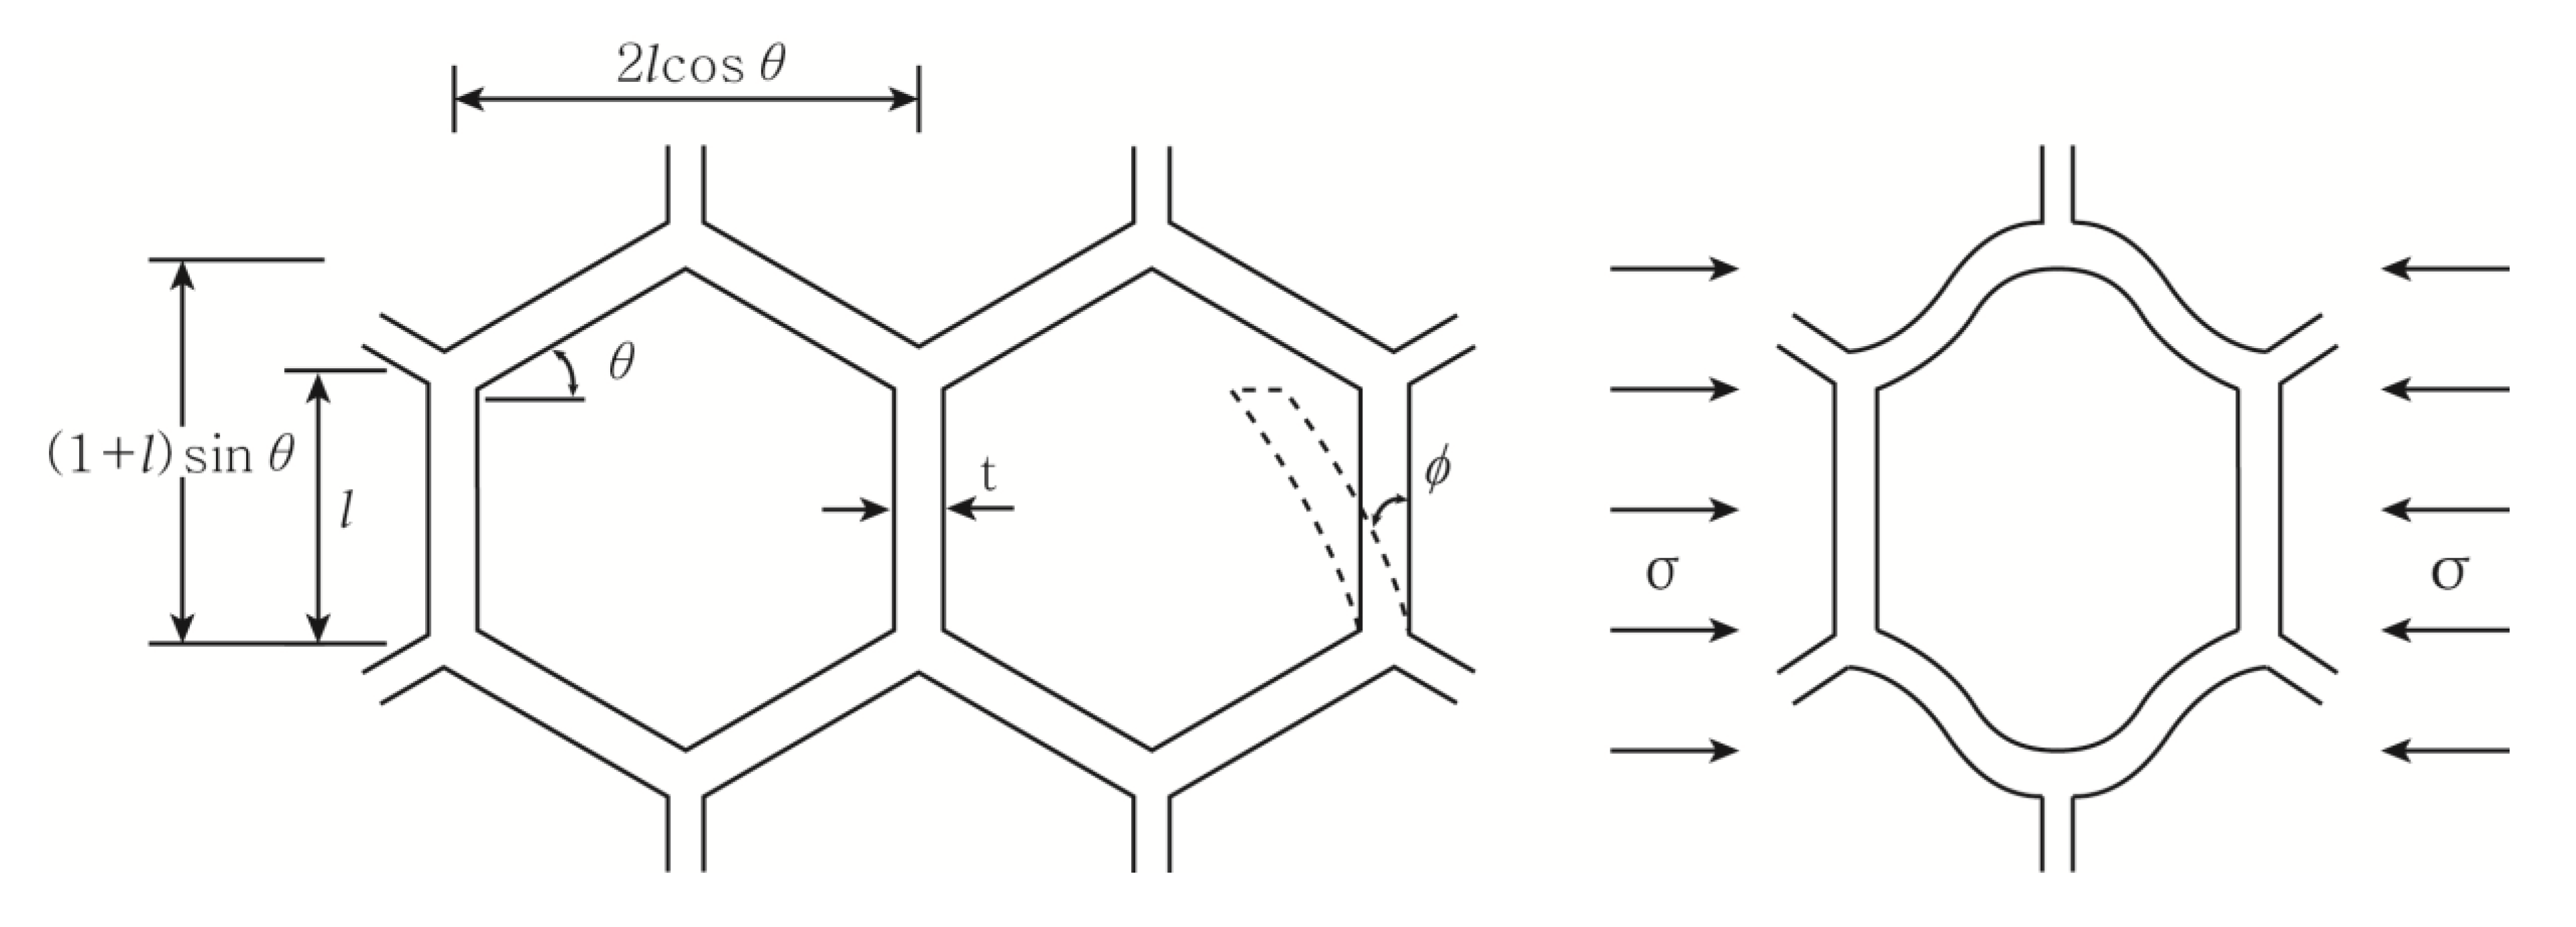
2.1. Theoretical Background

Honeycombs are known to plastically collapse when the bending moment ( M p ) exceeds the maximum plastic deformation moment. The normal force under in-plane (P) of the regular hexagonal honeycombs, as illustrated in Figure 1, can be expressed by Equation (1) [18]:
P = σ ( 1 + s i n θ ) l b
where σ is stress, θ is the inner angle as shown in Figure 1, l is honeycomb cell wall length, and b is the axial length of the honeycomb. The plastic rotation angle of the hinge (ϕ) under normal pressure can be described by Equations (2) and (3):
4 M p 2 σ b ( 1 + sin θ ) ϕ l 2 sin θ
M p = 1 4 σ y s b t 2
where t is the honeycomb cell wall thickness. The ratio of plastic collapse stress ( σ p l ) to yield stress ( σ y s ) is given by Equation (4):
σ p l σ y s = ( t l ) 2 1 2 ( 1 + s i n θ ) s i n θ  

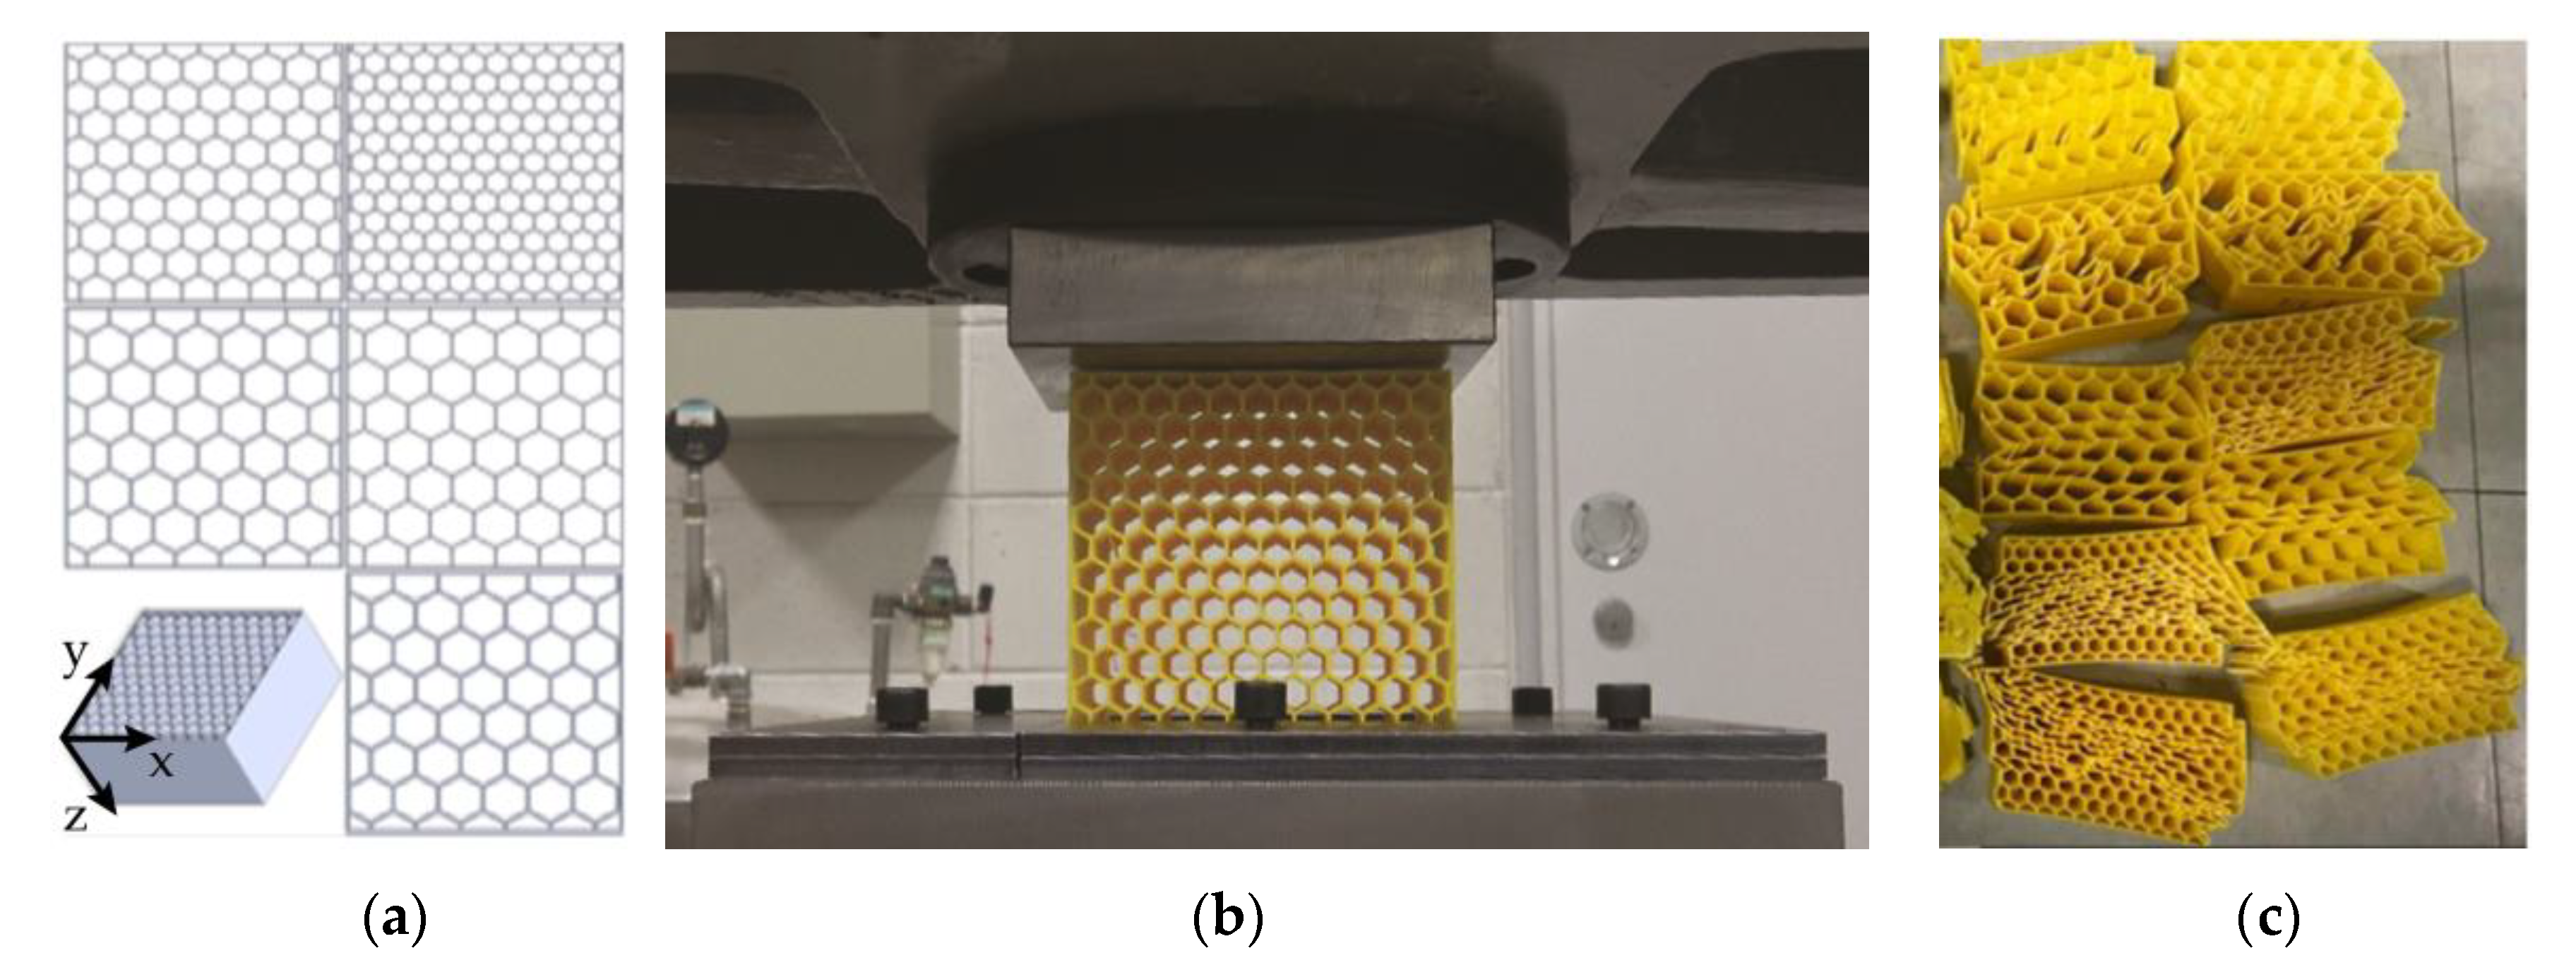
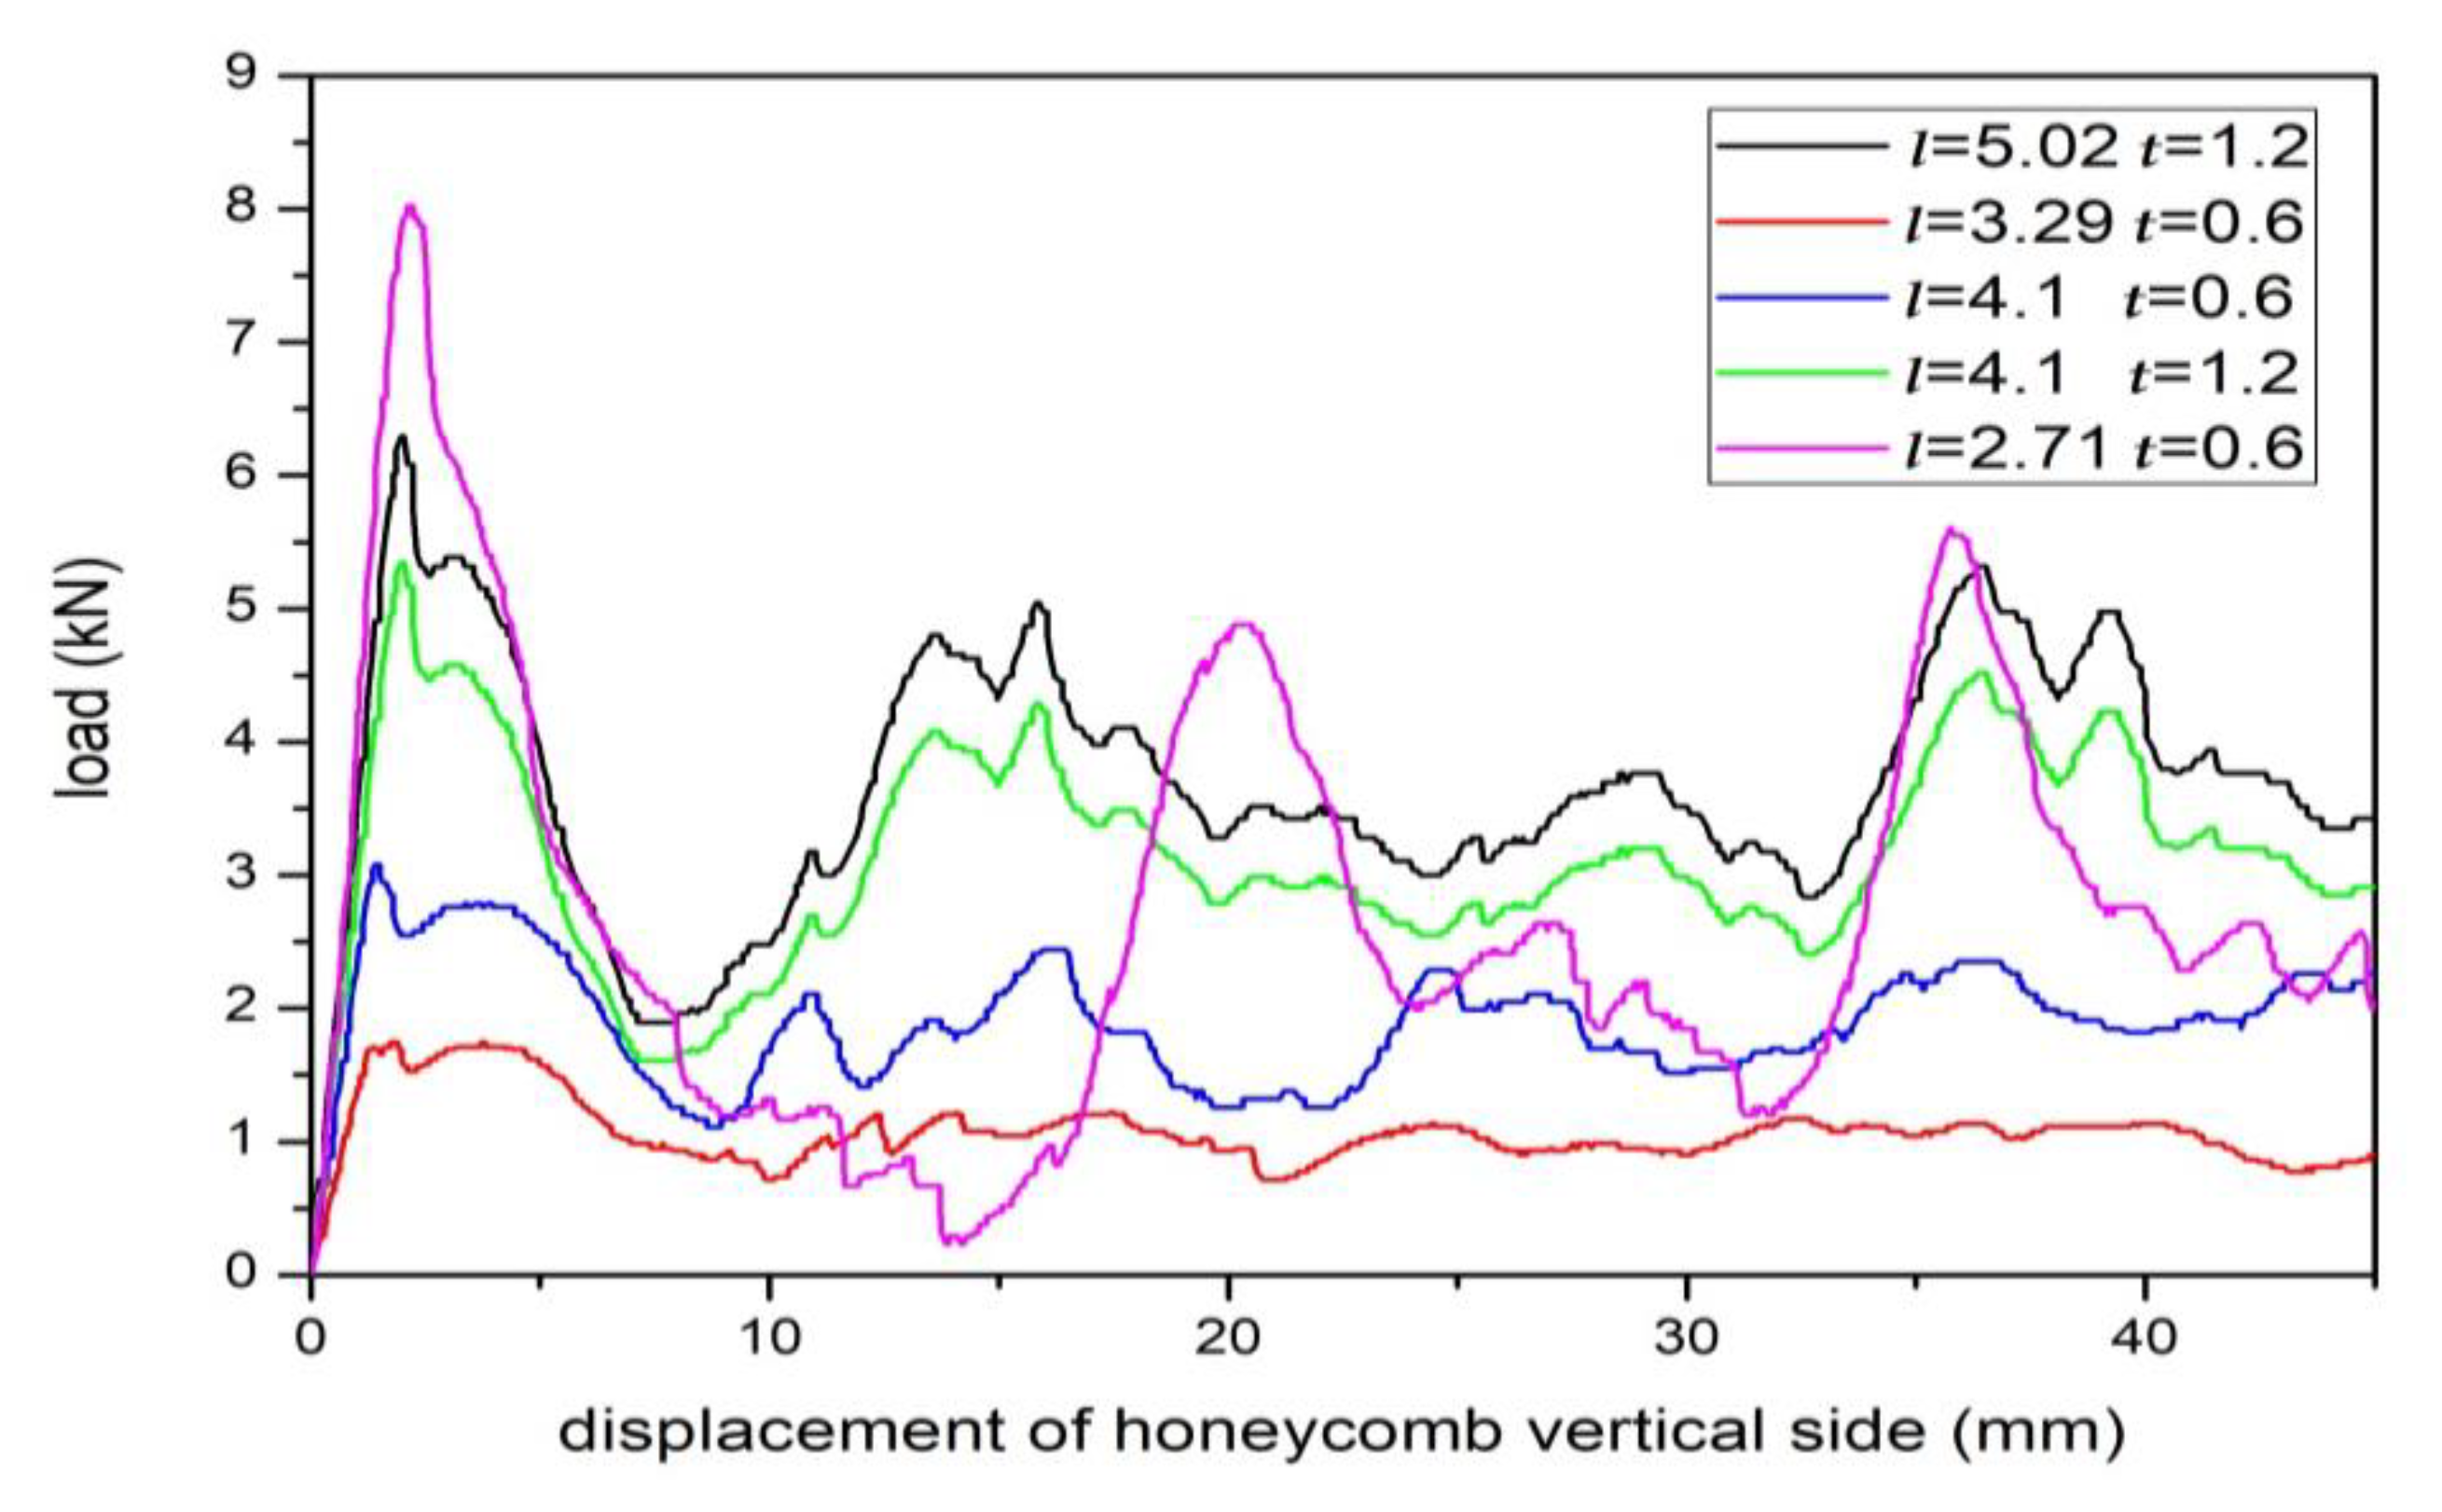
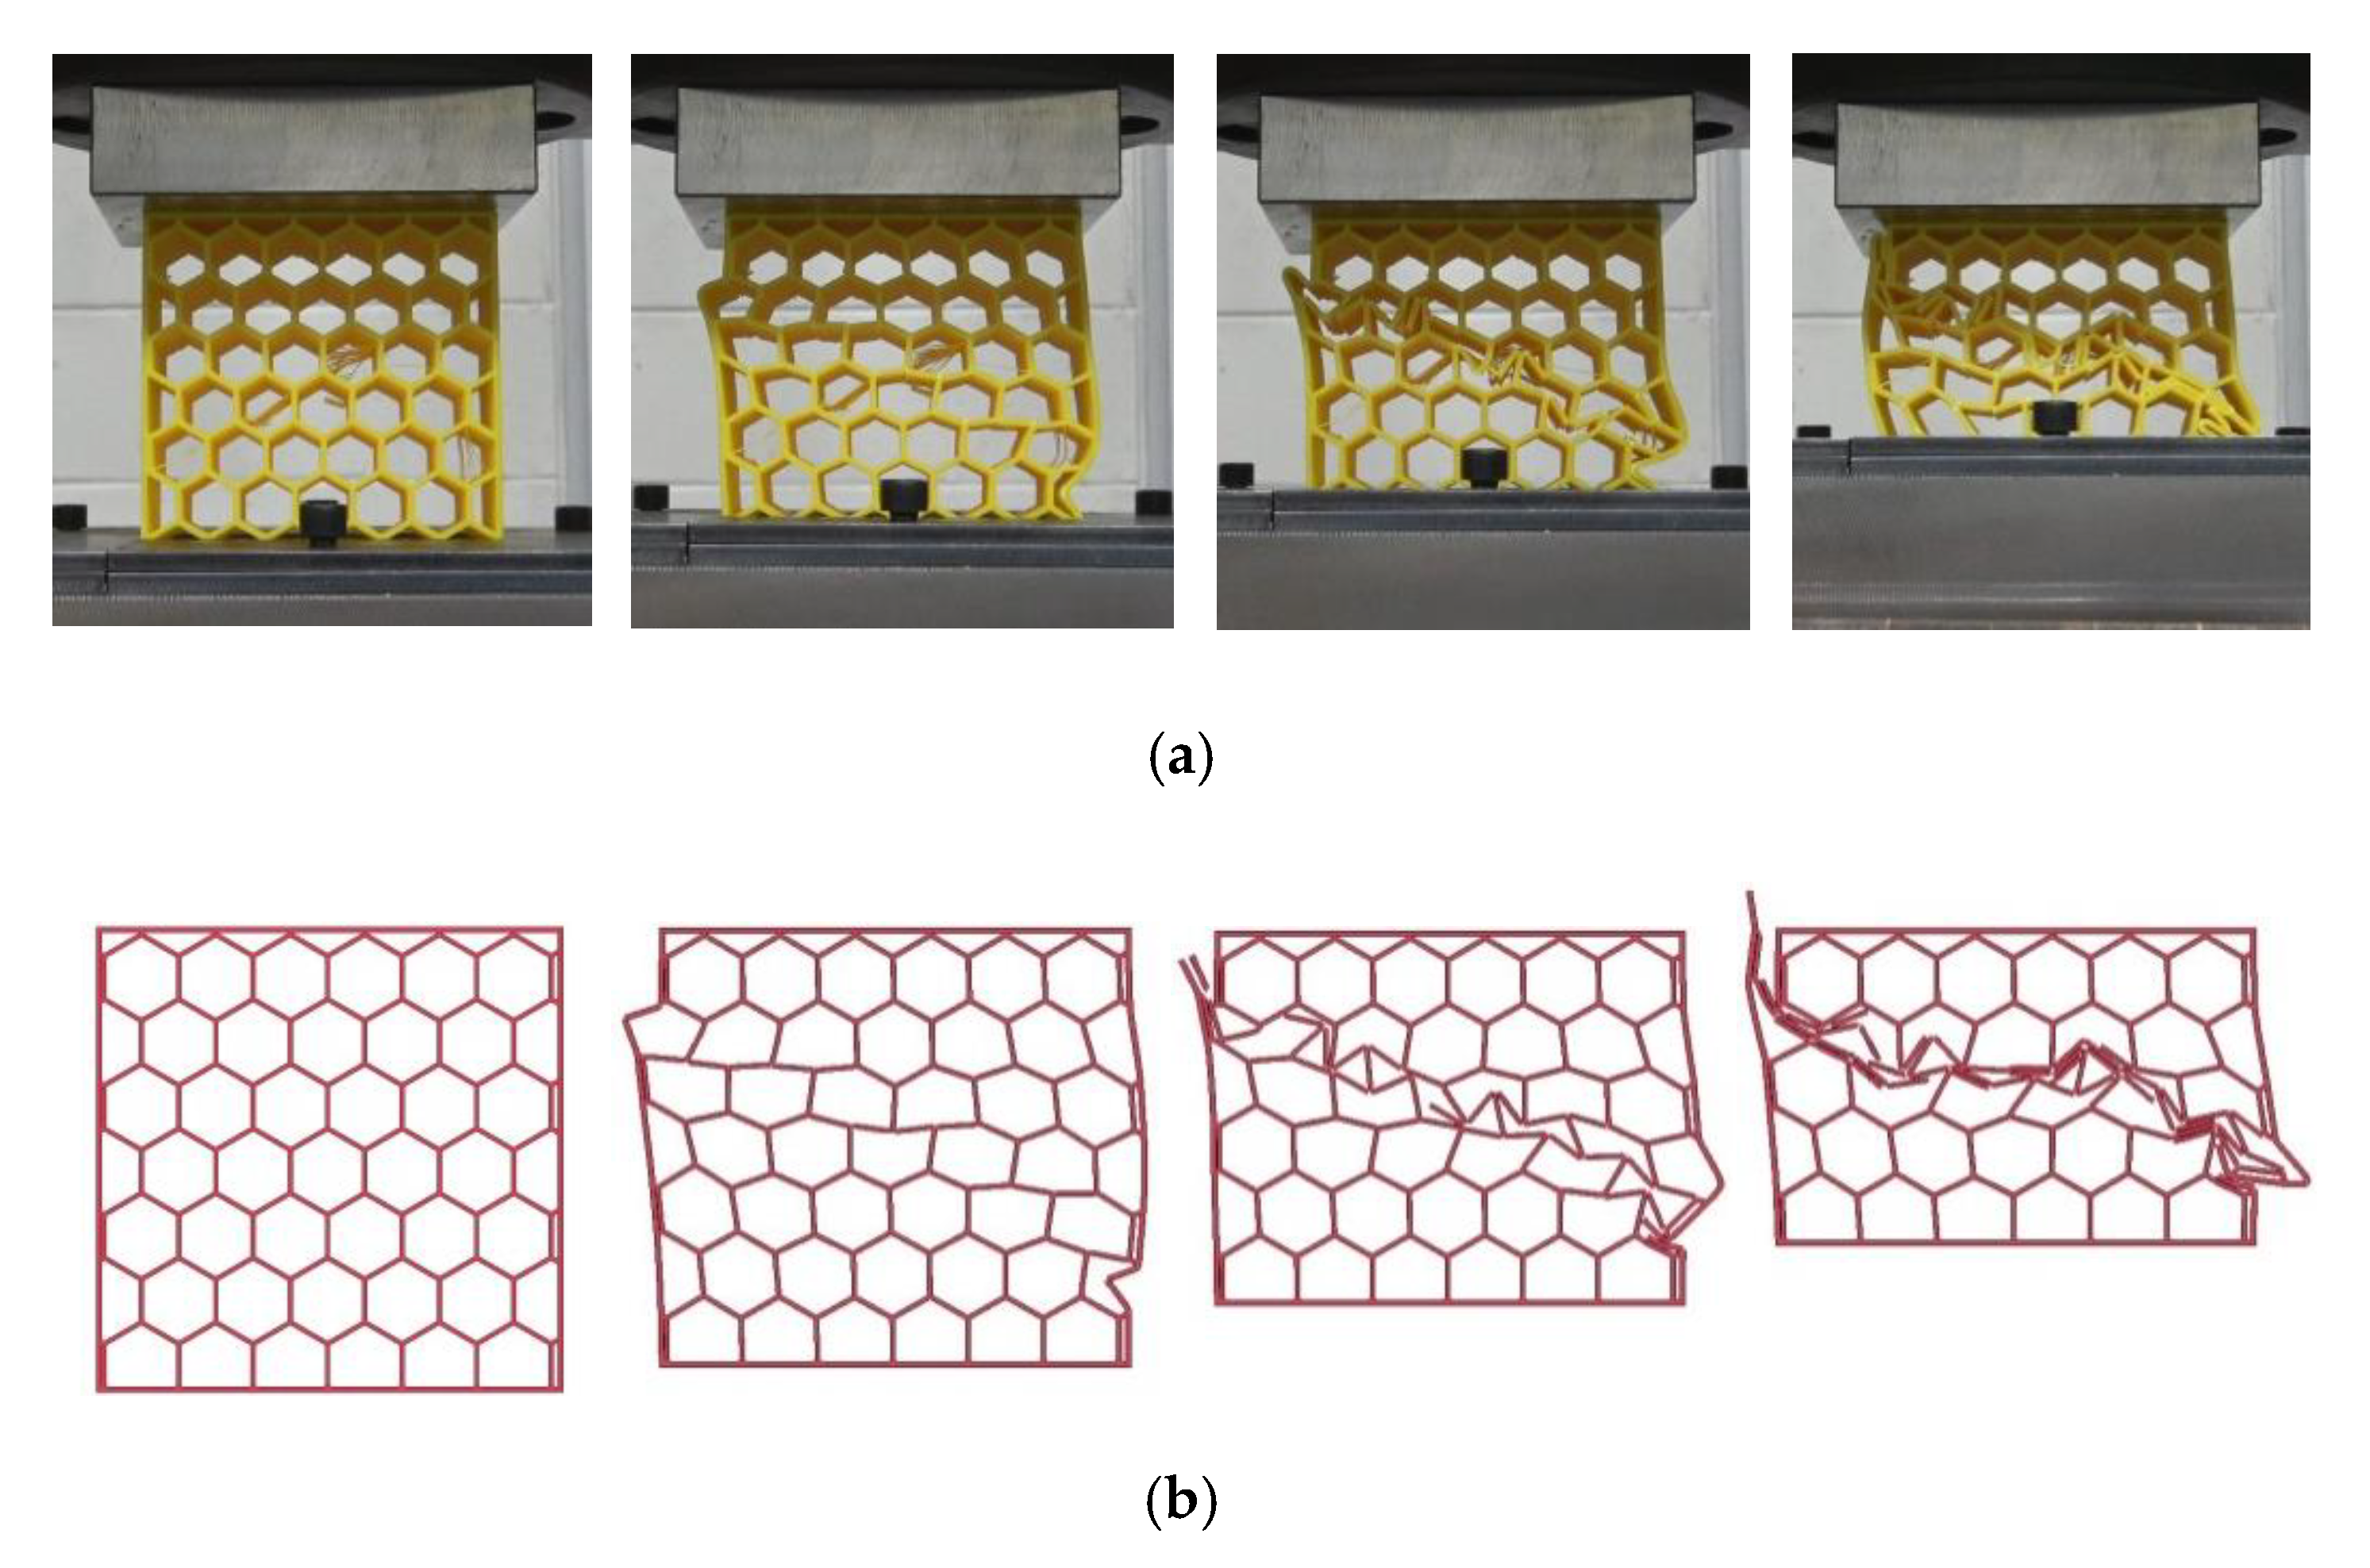
2.2. In-Plane Honeycomb Compression Test

Compression tests were done on the 3D-printed honeycomb unit specimen to select the one for actual vehicle-bollard collision experiments. All honeycomb units are designed to have 100 mm horizontal side length(x), 100 mm vertical side length(y), and 50 mm thickness(z). However, by varying l from 2.3 to 5.3 mm and t from 0.6 to 1.2 mm, five units with different honeycomb cellular structures were designed, with more detailed lengths shown in Figure 2a. Using PLA (Polylactic acid) materials and a 3D printer, three sets of each design were manufactured. Using a universal testing machine, all manufactured honeycomb units were compressed from their in-plane direction, as shown in Figure 2b, to collect their load-displacement data. All compression tests were done at 20 mm/min speed, which is commonly used for honeycomb tests [19,20,21], and for three-minute duration. Specimens were fixed at the bottom, the x-y plane in Figure 2a, by a jig as shown in Figure 2b, so that no deformation occurred in the x-y plane. Figure 2c shows the deformed honeycomb specimen and the load displacement curves are plotted in Figure 3 for various l and t. The displacement values (x-axis values in Figure 3) are the displacements of the honeycomb vertical sides (the y-axis in Figure 2a).
According to the compression test results, maximum load decreases as the honeycomb cell wall length increases and maximum stress increases as the cell wall thickness (t) increases. As indicated in Equation (4), yield stress increases proportional to t2, while inversely proportional to l2. This, however, decreased to its 70% level if 0.2 offset (0.2% OYS, 0.2% proof stress, RP0.2, RP0,2) methods were used.
The data collected from the honeycomb unit compression tests were used as inputs to the LS-DYNA simulations with the honeycomb property set as Mat 24 (Piecewise Linear Plasticity). The simulations allowed compressions along the y-axis only. With the honeycomb property in the simulations closely calibrated to the compression test specimen and cell failures simulated as well, both tests and simulations show qualitatively-similar results as presented in Figure 4. All compression simulations were run for a 90.0 s duration with the minimum mesh size and time steps set at 0.24 mm and 100 ns, respectively. Cells were considered to fail when the strain rate of the material exceed 10% since 5% to 10% criteria are typically adopted in PLA compression tests [22].

3. Numerical Simulations

3.1. Bollard Design

In the event of a vehicle-bollard collision, the impact energy needs to be dissipated through plastic deformations—such as bending, fracture, or localized crushing—of both objects in collision [23]. For conventional bollards typically made of steel pipe and polyurethane cover, the impact energy is mostly absorbed through local bending of the near-ground portion of the bollard, thus still delivering a significant amount of concentrated impact energy to the local contact area of the vehicle. This research, therefore, proposes a modification to the conventional steel bollards to insert honeycomb units between the steel pipe and its cover, which is called “in-plane honeycomb” in this paper, to minimize or distribute the impact energy on the colliding vehicle. Figure 5 illustrates the difference in design between conventional steel bollard and in-plane honeycomb bollard.
In-plane honeycomb bollards are designed to serve the conventional purpose of protecting pedestrians while reducing the damage to the vehicle. For this purpose, the proposed new design has the same outer diameter as the conventional steel bollard but its inner steel pipe thickness is increased from 3 to 5.5 mm, as shown in Figure 5, to compensate for the reduced bollard stiffness.
Production of the honeycomb units will be done through the extruding process using PE (Polyethylene) material. Extruding is known to be ideal for mass production of identical structures with simple designs [24]. If structural design gets complicated as the hexagonal cell structures in the in-plane honeycomb units, defect rates can be high. It is expected that the product defect rate will be significantly high when the cell wall length (l) is below 3 mm [25]. Thus, for all honeycomb units used for this research, both in simulations and in collision experiments, the cell wall lengths were set to be minimum 4.1 mm to minimize the defect rate.

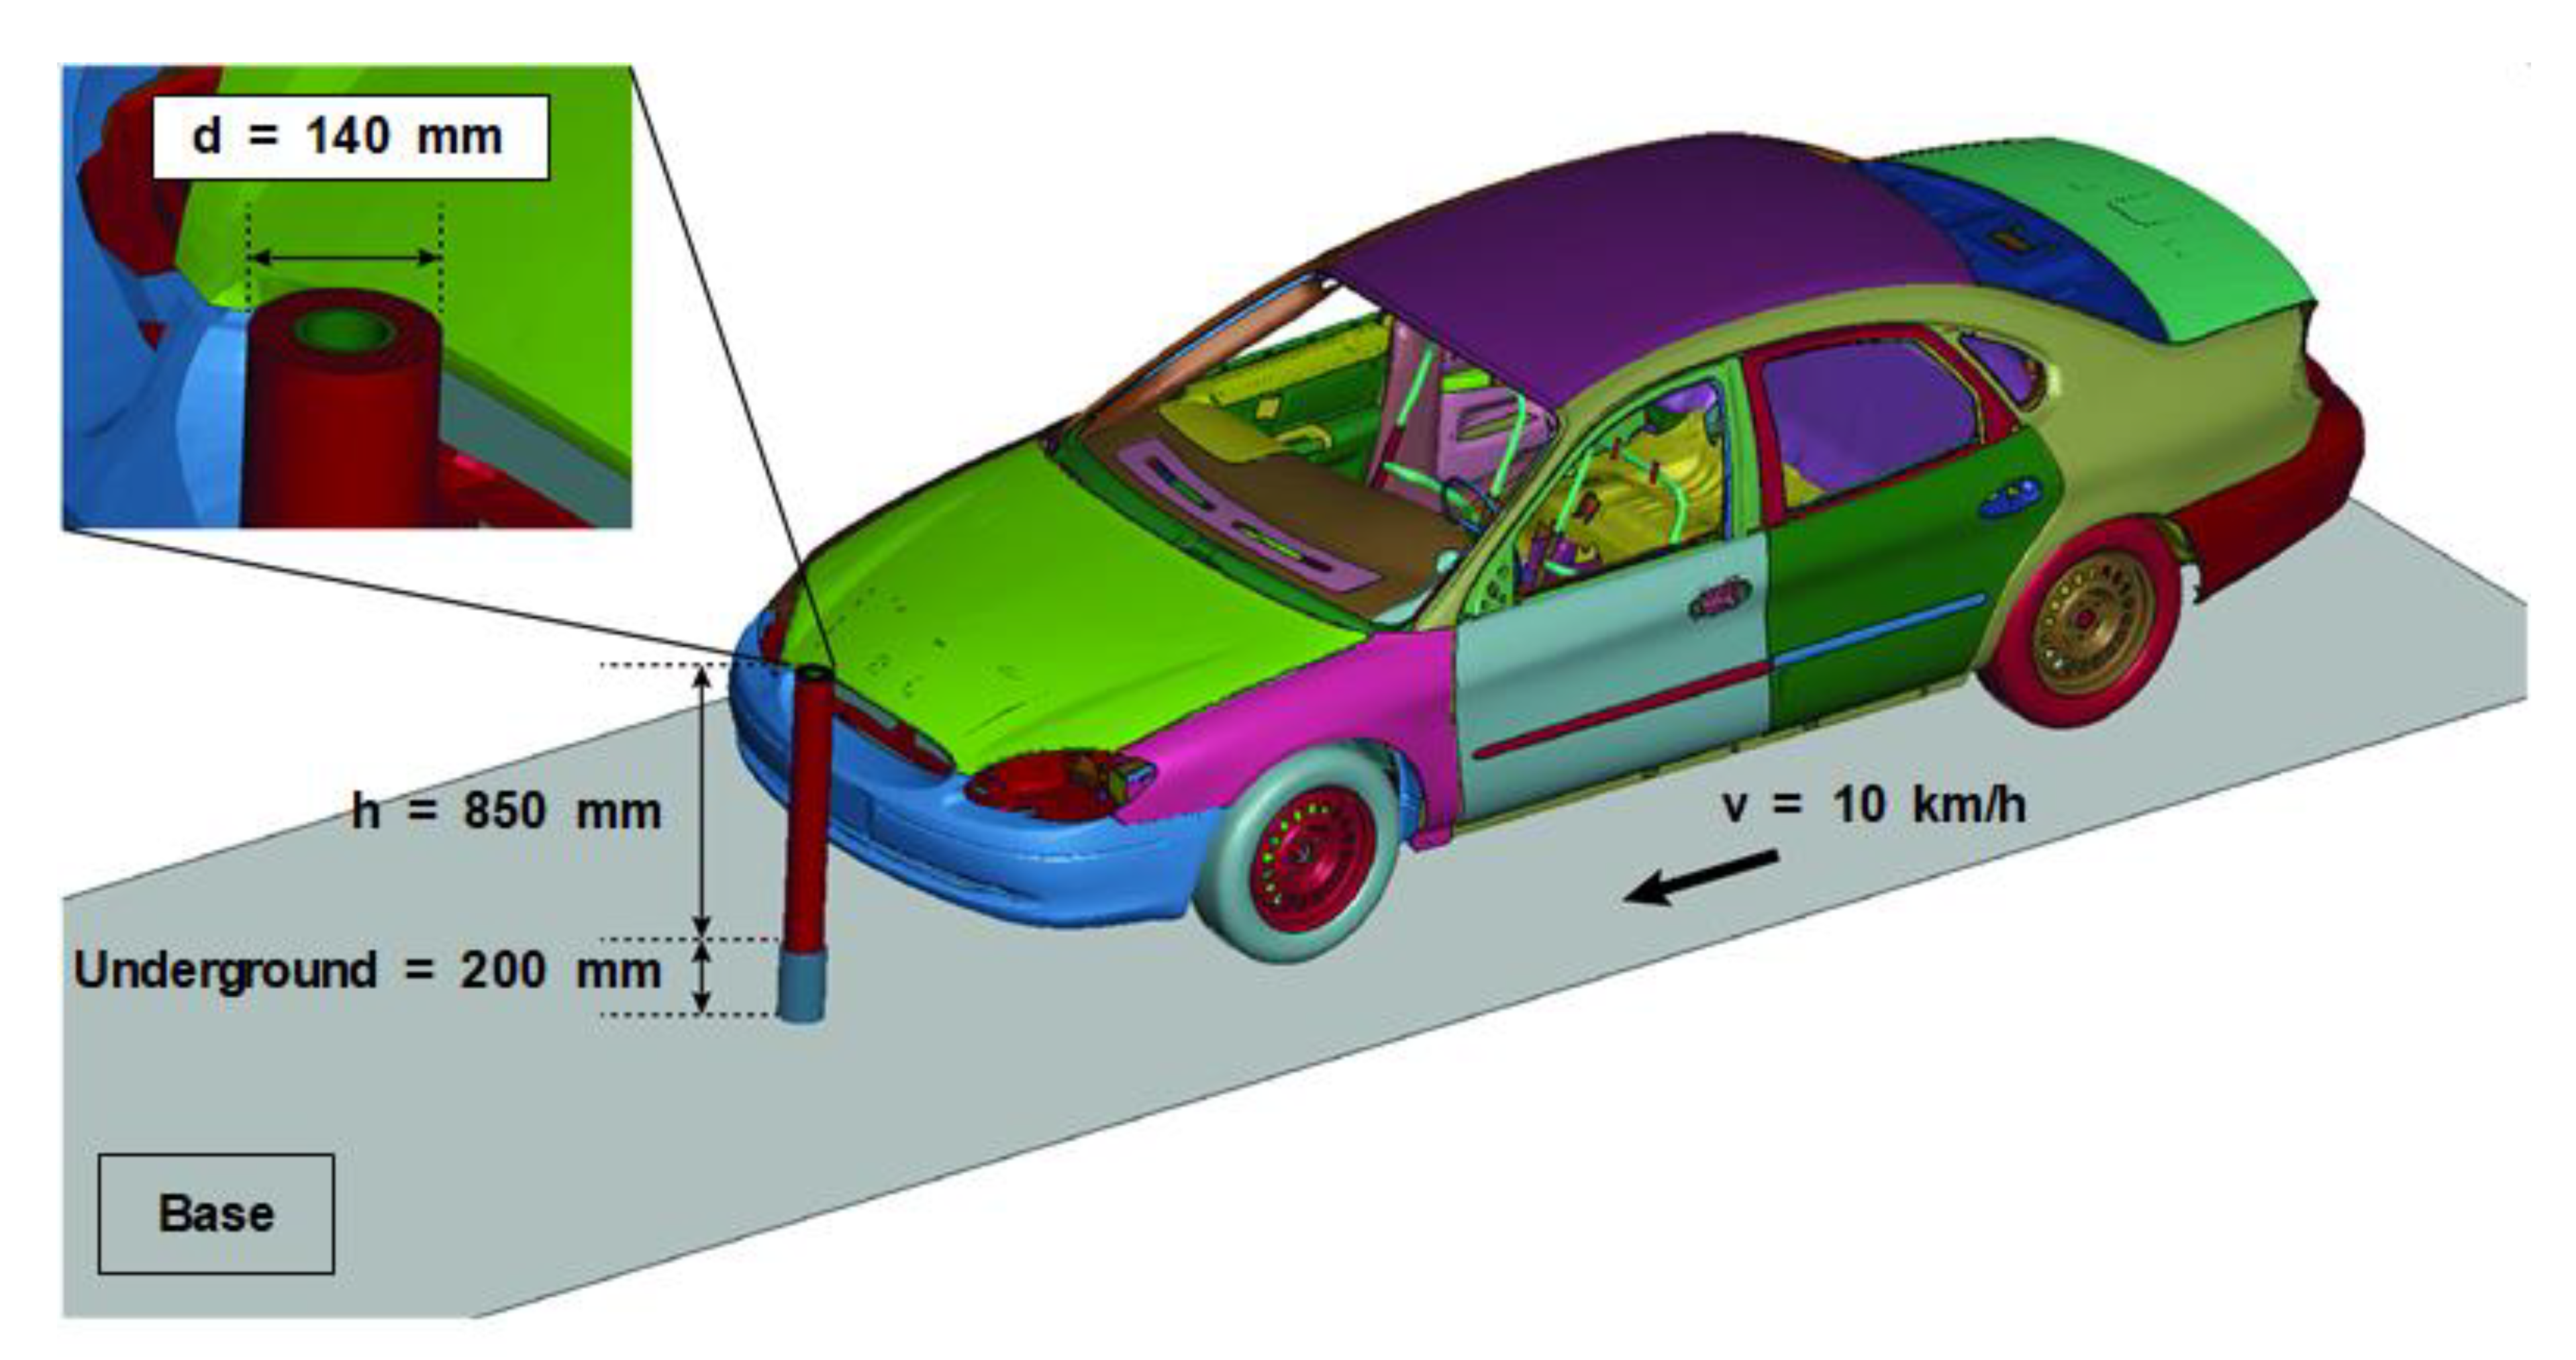
3.2. Numerical Simulations

Using LS-DYNA numerical analysis tool, developed based on explicit finite element scheme, vehicle collisions were simulated against conventional bollards and in-plane honeycomb bollards. The vehicle simulated in the tool was Ford Taurus 2001 model provided by National Highway Traffic Safety Administration (NHTSA), as shown in Figure 6. Both types of bollard were set to be buried 200 mm underground and the bollard exposed above the ground level is 850 mm high to satisfy the requirement mandated by the Korean MOLIT (Ministry of Land, Infrastructure and Transport) Act on Promotion of the Transportation Convenience of Mobility Disadvantaged Persons 2019.
All simulated collisions were frontal crashes, perfectly normal direction to the bollard cover plane, with an initial velocity of 10 km/h. Plastic Object MAT 24 (Piecewise Linear Plasticity) were chosen for both honeycomb unit and steel pipe, and MAT 20 (Rigid Body) for the support. Automatic surface to surface condition was used. To reduce the computational time, the minimum mesh sizes were increased to 0.6 mm and 1.86 mm for the PLA honeycomb and steel, respectively, and mass-scaling technique [26,27] was applied by increasing all simulated material mass by 10. With this technique, the critical time steps for the PLA honeycomb and steel were 1.134 × 10⁻⁶ and 1.2 × 10⁻⁶ s, respectively. Thus, 1 × 10⁻⁶ s was used as the minimum time steps and multiple simulations with various parameters were run for 0.45 s durations. Honeycomb cell wall lengths (l) were fixed at 4.1 mm for all simulations, but the wall thickness (t) was varied so that the yield strengths are adjusted to be 10, 20, 30, and 40 MPa. Table 1 summarizes the physical parameters of the main bollard materials, PLA and steel.

3.3. Simulation Result

Table 2 summarizes the simulated maximum accelerations of the front bumper frame and the B-pillar, the vertical roof support structure of a vehicle, when collided with the varied yield strengths of both steel and in-plane honeycomb bollards. It was reported that the acceleration on the drivers (and passengers) during the collision is similar to the acceleration on the B-pillar [28].
Therefore, B-pillar acceleration data were used to analyze the accelerations felt by drivers. Since simulations with the honeycomb unit with 20 MPa yield strength exhibited the lowest B-pillar maximum acceleration, 20 MPa honeycomb unit was chosen for the simulations to compare its results with the conventional bollards. Figure 7a shows the qualitative deformation results with the conventional bollards, while Figure 7b with the 20 MPa in-plane honeycomb bollard.
Figure 8 shows the time evolutions of maximum accelerations at the front bumper frame with the calculated maximum accelerations: 1.037 × 10³ m/s2 at 0.042 s for the steel bollard and 0.388 m/s2 at 0.059 s for the in-plane honeycomb bollard. Compared to the steel bollard, the maximum acceleration of the honeycomb bollard was delayed by 0.017 s, with its value decreased to 64% of the former. In addition, the acceleration peaks occur only once for the steel bollard but three times for the honeycomb bollard, including the third one at 0.38 s, with its peak much lower than others.
Figure 9 presents the simulated time history of the B-pillar accelerations. B-pillar maximum accelerations are 3.44 × 10³ m/s2 for the steel bollard and 2.99 × 10³ m/s2 for the honeycomb bollard, approximately 13% lower than the former. The simulated time evolutions of the front bumper and the B-pillar displacements due to the collision are graphed in Figure 10. Simulations showed that there is negligible deformation on the B-pillars. Thus, the front bumper frame displacements in Figure 10 were calculated using the physical distance between the bumper frame and the B-pillar, which was named the “displacement gap” in this paper, as inputs to the calculated strain values. It is shown in Figure 10 that there were no displacement gaps for the first 0.05 s after the start of the simulation since the bumper frame is not in contact with the bollards but the gap increases after the initial impact. Compared to the steel bollard, the maximum displacement time of the honeycomb bollard was delayed by 0.083 s and the maximum deformation value decreased by 26%.
Figure 11 shows the simulated sequence of damage on the in-plane honeycomb bollard by the vehicle. Figure 11a shows the initial impact moment when the in-plane honeycomb starts collapsing and Figure 11b shows the in-plane honeycomb unit in contact with the ground surface on the opposite side of the impact point collapsing. Lastly, Figure 11c shows the honeycomb unit at the bottom of the front side collapsing. This three-step collapsing sequence of the in-plane honeycomb unit works to increase the shock absorption duration and cause variations as well in the acceleration profile of the front bumper frame, as shown in Figure 8, with three peaks at 0.0590 s, 0.1689 s, and 0.329 s.
In addition, the steel pipe in the in-plane bollard will finally come to contact with the support that works to hold the forward motion of the vehicle. This indicates that the proposed in-plane honeycomb bollard design will serve the same core function of stopping or significantly reducing the vehicle motion when the collision energy exceeds the absorption capacity of the in-plane honeycomb unit but significantly lowers the damage to the colliding vehicle and the occupants inside.

4. Vehicle-Bollard Collision Experiments

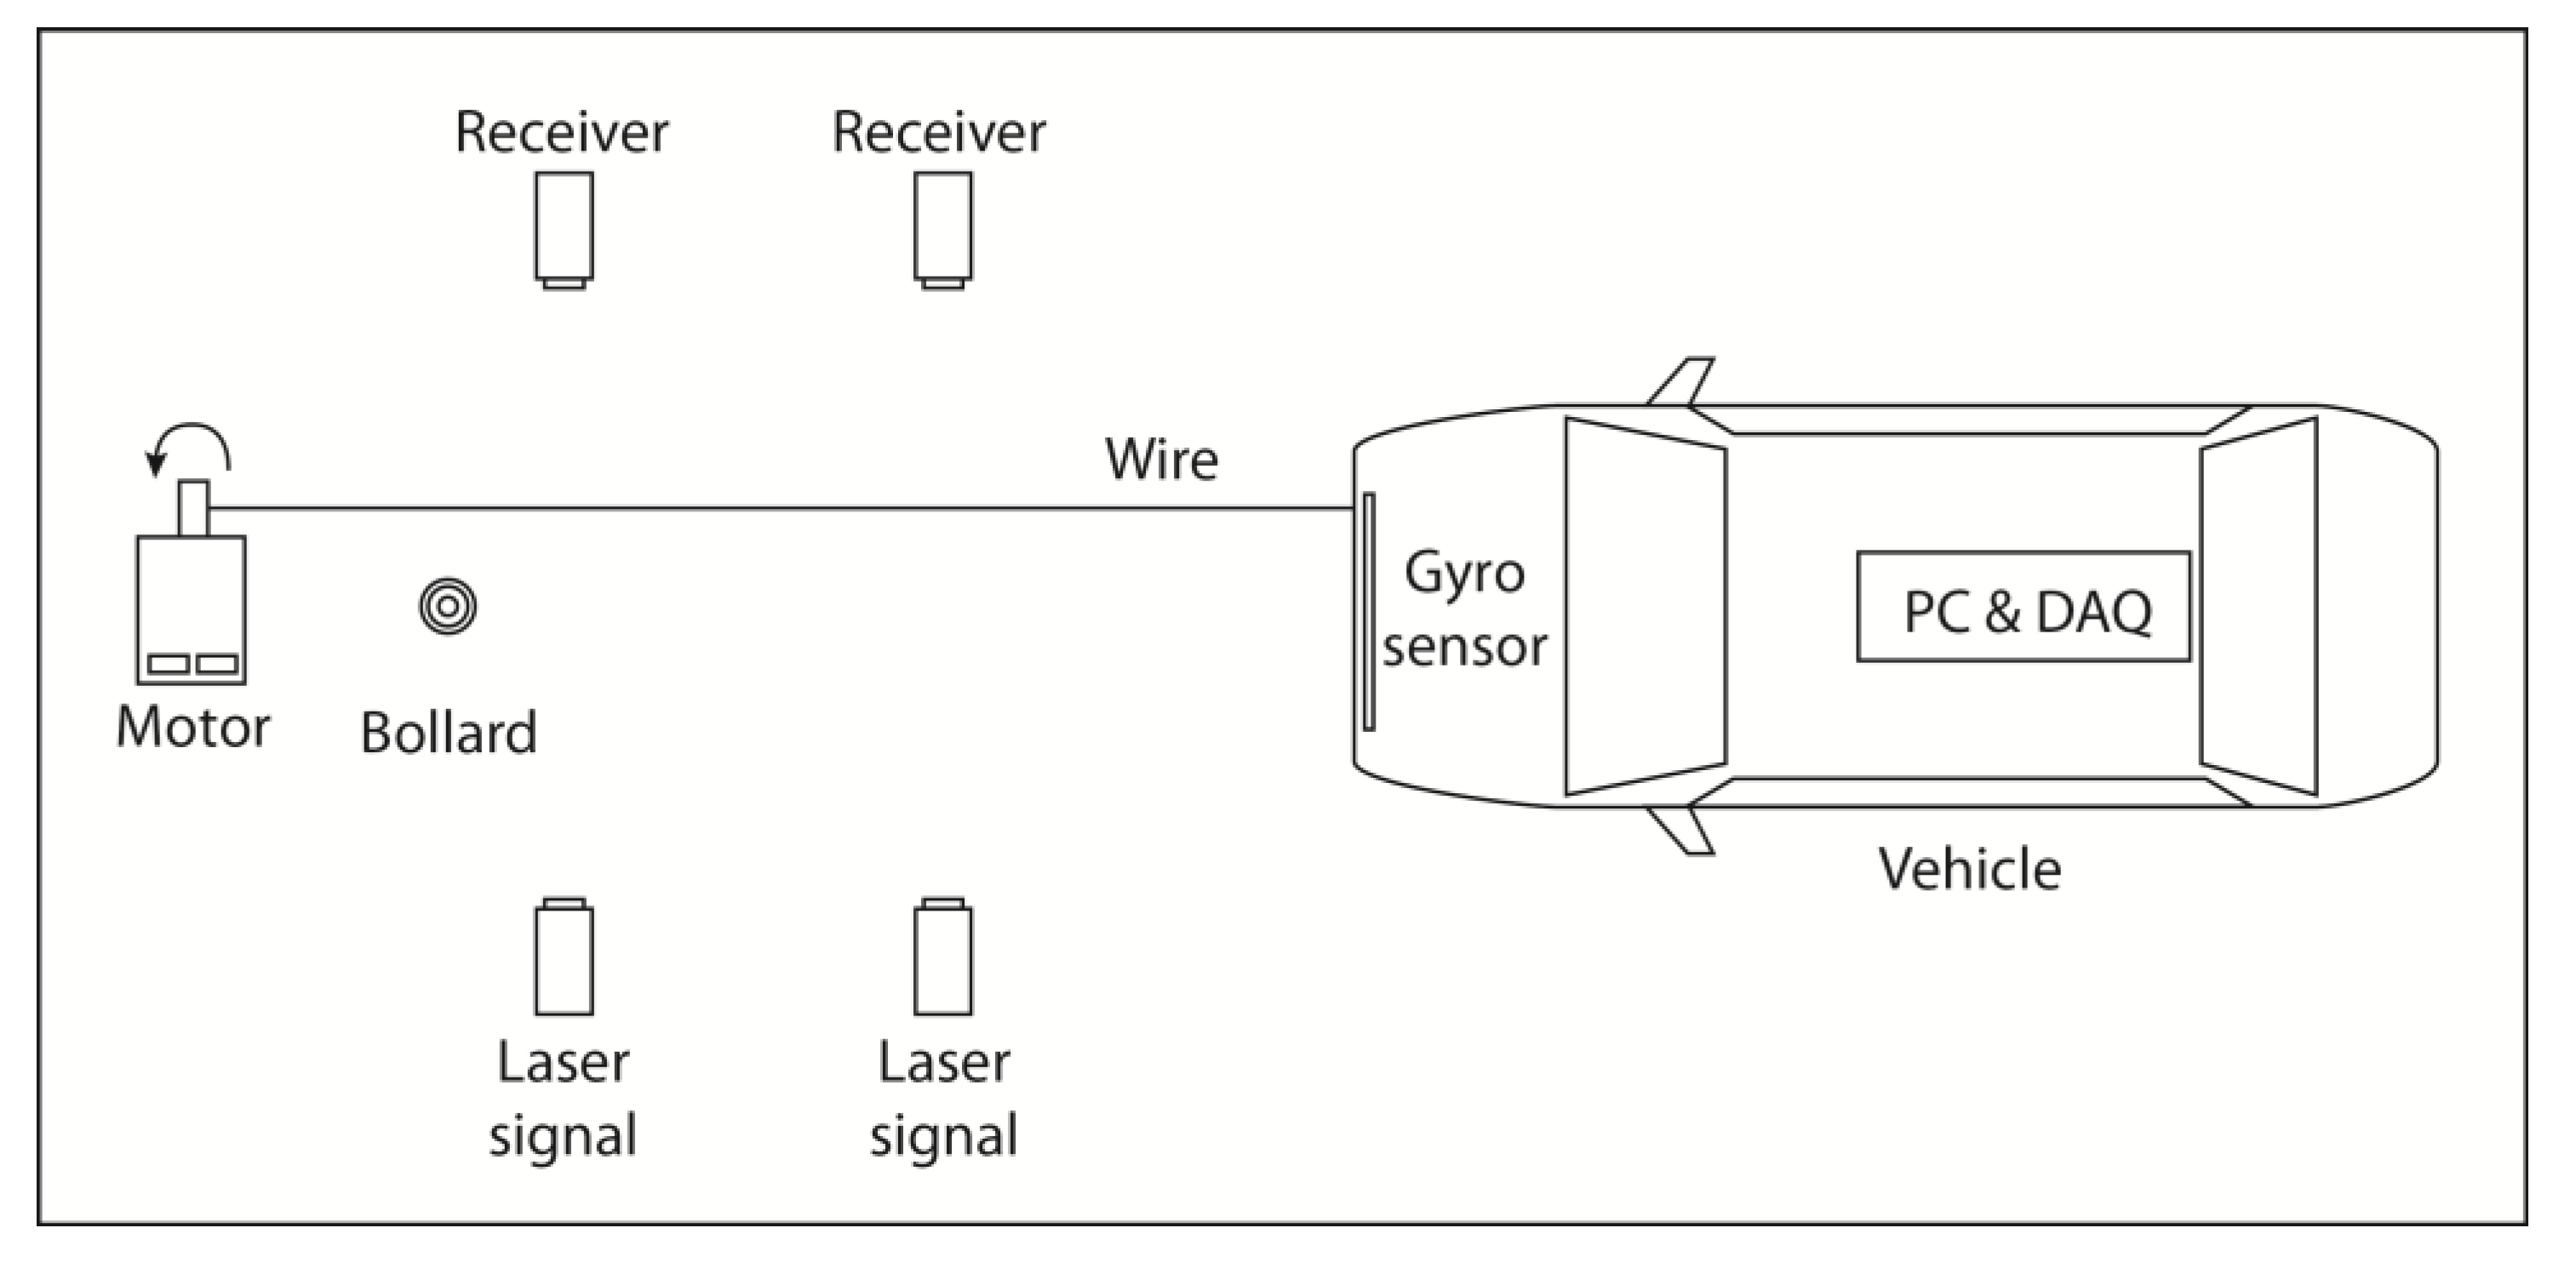
4.1. Experimental Setup

Figure 12 shows the manufactured honeycomb unit with 20 MPa yield strength at where the front bumper frame and the B-pillar showed the smallest simulated accelerations. Considering that the total bollard height is 1050 mm from the support and the 3D printers have specification limits, honeycomb units of diverse lengths—200, 250, and two 300 mm units—were printed out as shown in Figure 12. Honeycomb units were assembled into the bollards starting with first 300 mm unit from the support bottom to ensure continuity at the ground level above 200 mm support. On the top, 200, 250, and the two 300 mm units were installed to optimize the structural continuity at the impact location of the front bumper frame. All honeycomb units were manufactured to allow tight-fitting to the steel pipe outer diameter to ensure the best shock absorption without slipping.
Figure 13 shows the schematic diagram of the actual vehicle-bollard collision experiment setup to collect consistent data sets and to increase repeatability as well. A steel wire run by a 2-kW motor was attached to physically tow the experiment vehicle (Hyundai Avante MD model) and the distance between the motor and the vehicle can be adjusted to adjust the collision speed. For all the experiments, the wire length was fixed; thus, there was a fixed collision speed, to ensure the data reliability and repeatability.
As the vehicle passes through the first sensor, denoted as laser signal and receiver closer to the test vehicle in Figure 14, the sensor cuts off the signal to the electric traction motor to stop its operation, thus, the vehicle can collide to the bollard through coasting driving. The collision speed was then calculated by measuring the time difference sensed by the first (closer to the test vehicle) and the second sensors (closer to the bollard) in Figure 14.
For comparison with the acceleration data of the front bumper frame located inside the bumper as shown in Figure 15, a gyro-sensor was installed on top of the test vehicle bumper frame as shown in Figure 16 to collect time evolution of acceleration data. The sensor model is KMX63 tri-axis gyro-sensor with 1 kHz sampling rate and feed the sensed data to the Data Acquisition Device also installed onboard the vehicle.

4.2. Experimental Results

Based on the simulation results, 20 MPa yield strength in-plane honeycomb bollards of 4.1 mm honeycomb cellular length (l) and 0.9-mm thickness (t) were manufactured. Experiments were done by impacting the test vehicle with both steel and in-plane honeycomb bollards to collect acceleration and its time evolution data to compare with the simulated results. The simulate vehicle model was replaced with a Korean-made model in the experiments due to easy access and the best similarity in the frame design. Early collision tests were done with in-plane honeycomb bollards, followed by steel bollard, and the bumpers were switched to a new one for each collision test to ensure consistent qualitative and quantitative data collection.
In this research, maximum deformation time is the duration measured from the initial contact, as shown in Figure 17a or Figure 18a, to when the maximum deformation of the front bumper frame occurs, as shown in Figure 17b or Figure 18b. Total transformation time is defined to be the duration from the initial contact time to when the bollard and the bumper no longer maintain the contact with each other. From the collision experiment with the steel bollard, the maximum deformation time was 0.131 s and the total deformation time was 0.364 s. These values were measured to be 0.503 s and 1.102 s, respectively, for the in-plane honeycomb bollard. Both maximum deformation and maximum transformation times increased for the in-plane honeycomb bollard, compared to those of the steel bollard.
Figure 19 presents the time evolutions of the acceleration measured by the gyro-sensor at the front bumper frame and calculated from the simulation. The maximum acceleration values from the collision experiment and the simulation are 0.35 m/s2 and 0.388 m/s2, respectively. The slight difference is likely to be caused by the differences in the vehicle structure designs of the test and simulation vehicles, such as the Styrofoam added to the back of the test vehicle bumper as shown in Figure 8, but the similarity can be easily identified in Figure 19.
Figure 20a shows the collision with the in-plane honeycomb bollard, while Figure 20b shows the collision with the steel bollard. Collisions with both bollards caused damage to the bumper cover, but the collision with honeycomb bollard yielded no damage to the front bumper frame, while the one with the steel bollard not only yielded damage to the front bumper frame but also to the radiator.
Figure 21a shows the damaged honeycomb bollard due to the collision and Figure 21b shows the bent inner steel pipe, displaying the same qualitative damage trend as in the simulation results shown in Figure 21c. Exact damage location on the upper honeycomb unit differs from the simulation results due to the ground clearance required during the experiment but the contact location between the support and base (ground level) yields similar damage and bending characteristics. Figure 22a shows the damage sequence on the bottom honeycomb unit, which can be qualitatively compared with the damage from the actual collision test shown in Figure 22b.

5. Summary and Conclusions

This research, conducted with LS-DYNA simulations and vehicle-bollard collision tests, was motivated to design in-plane honeycomb bollards in order to improve shock absorption capability of steel bollards by adding in-plane bollard units and consequently reduce damage to vehicle and its occupants. Findings from this research can be summarized as follows:
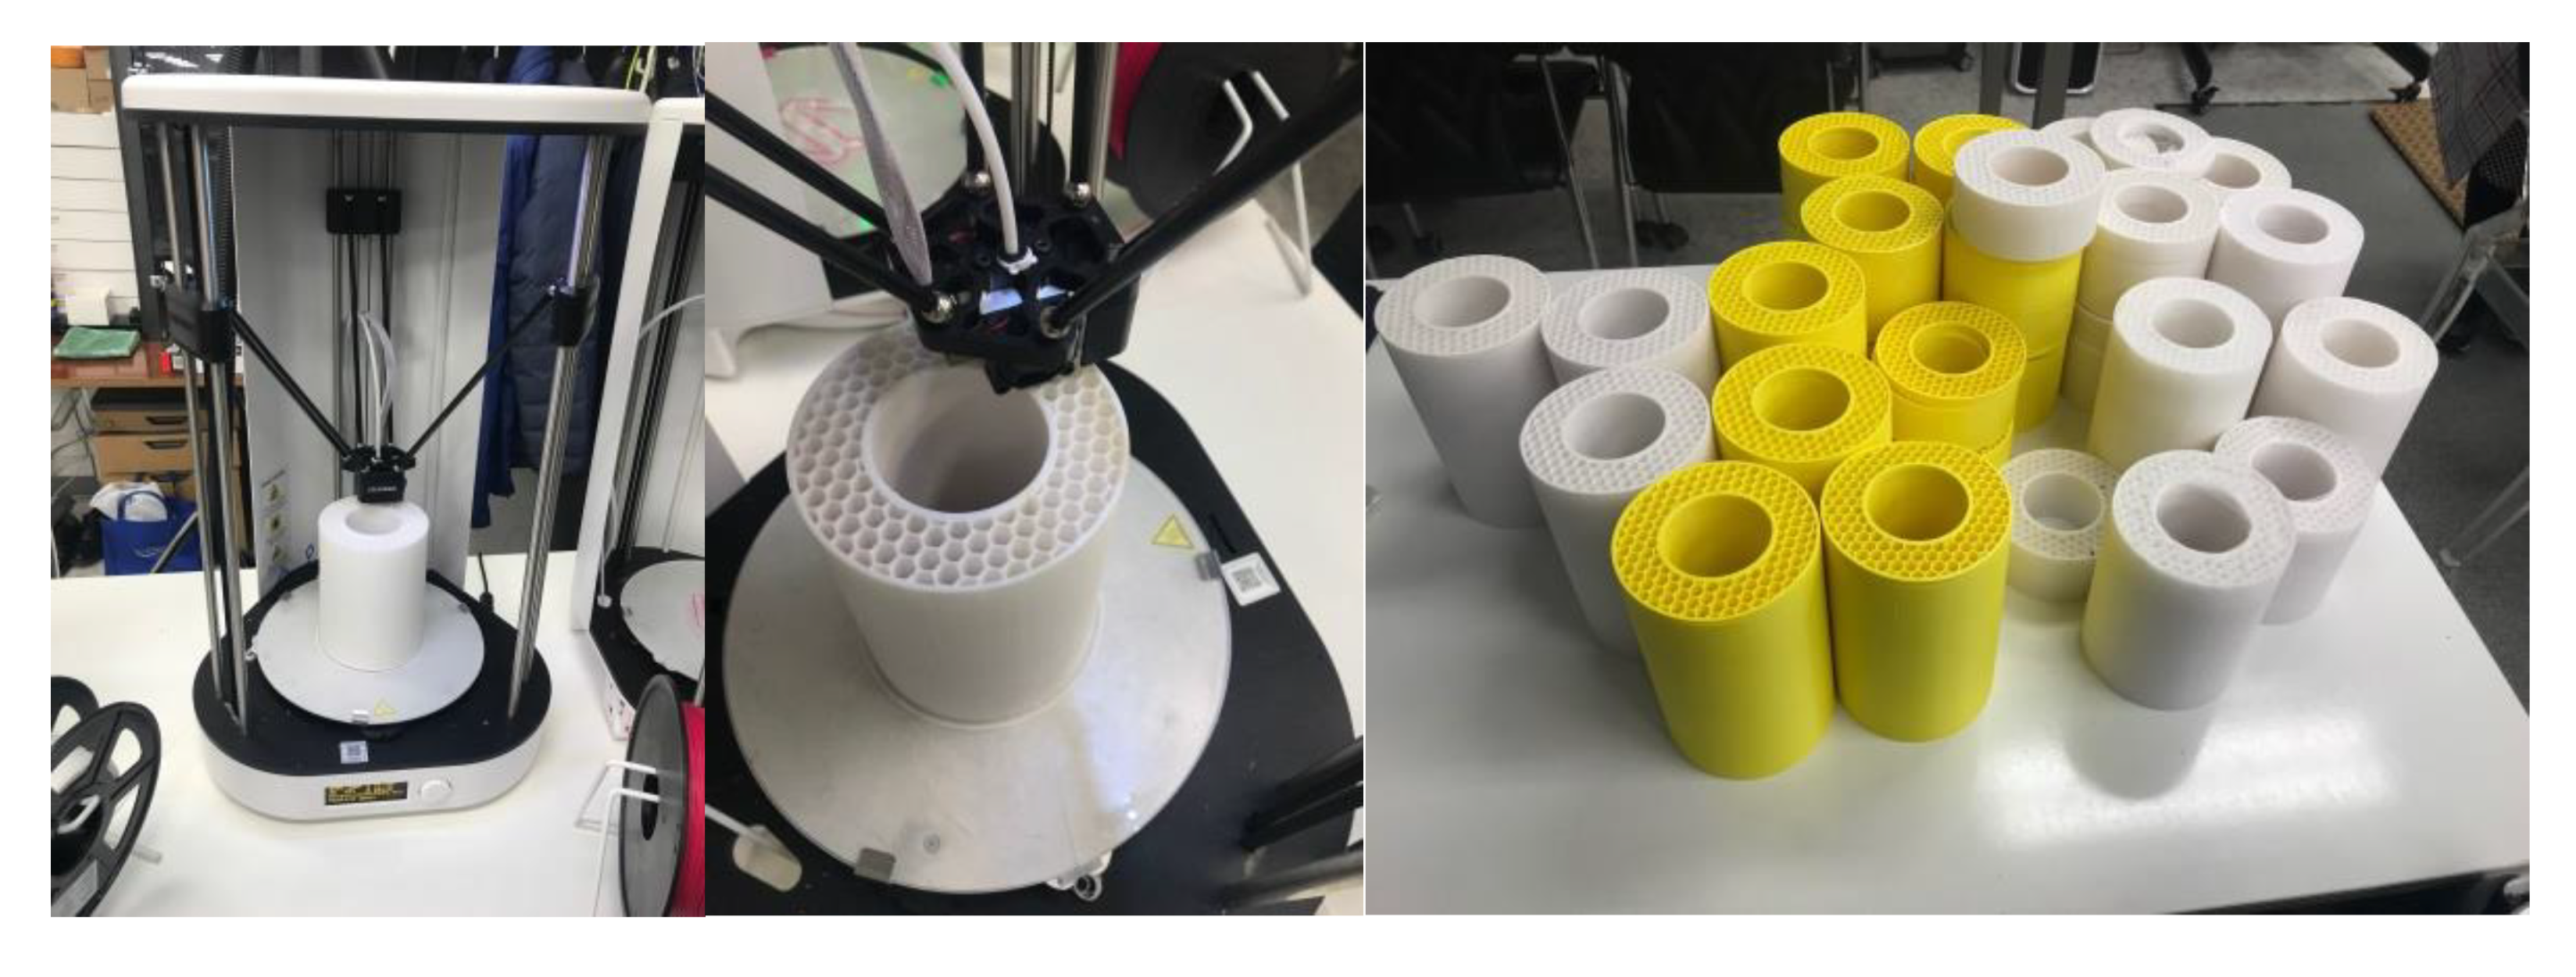
  • Honeycomb unit specimen with varying honeycomb cell wall length (l) and thickness (t) were manufactured with PLA materials for compression tests, which confirmed that the honeycomb strength is inversely proportional to l2 and proportional to t2, as reported in the literature.
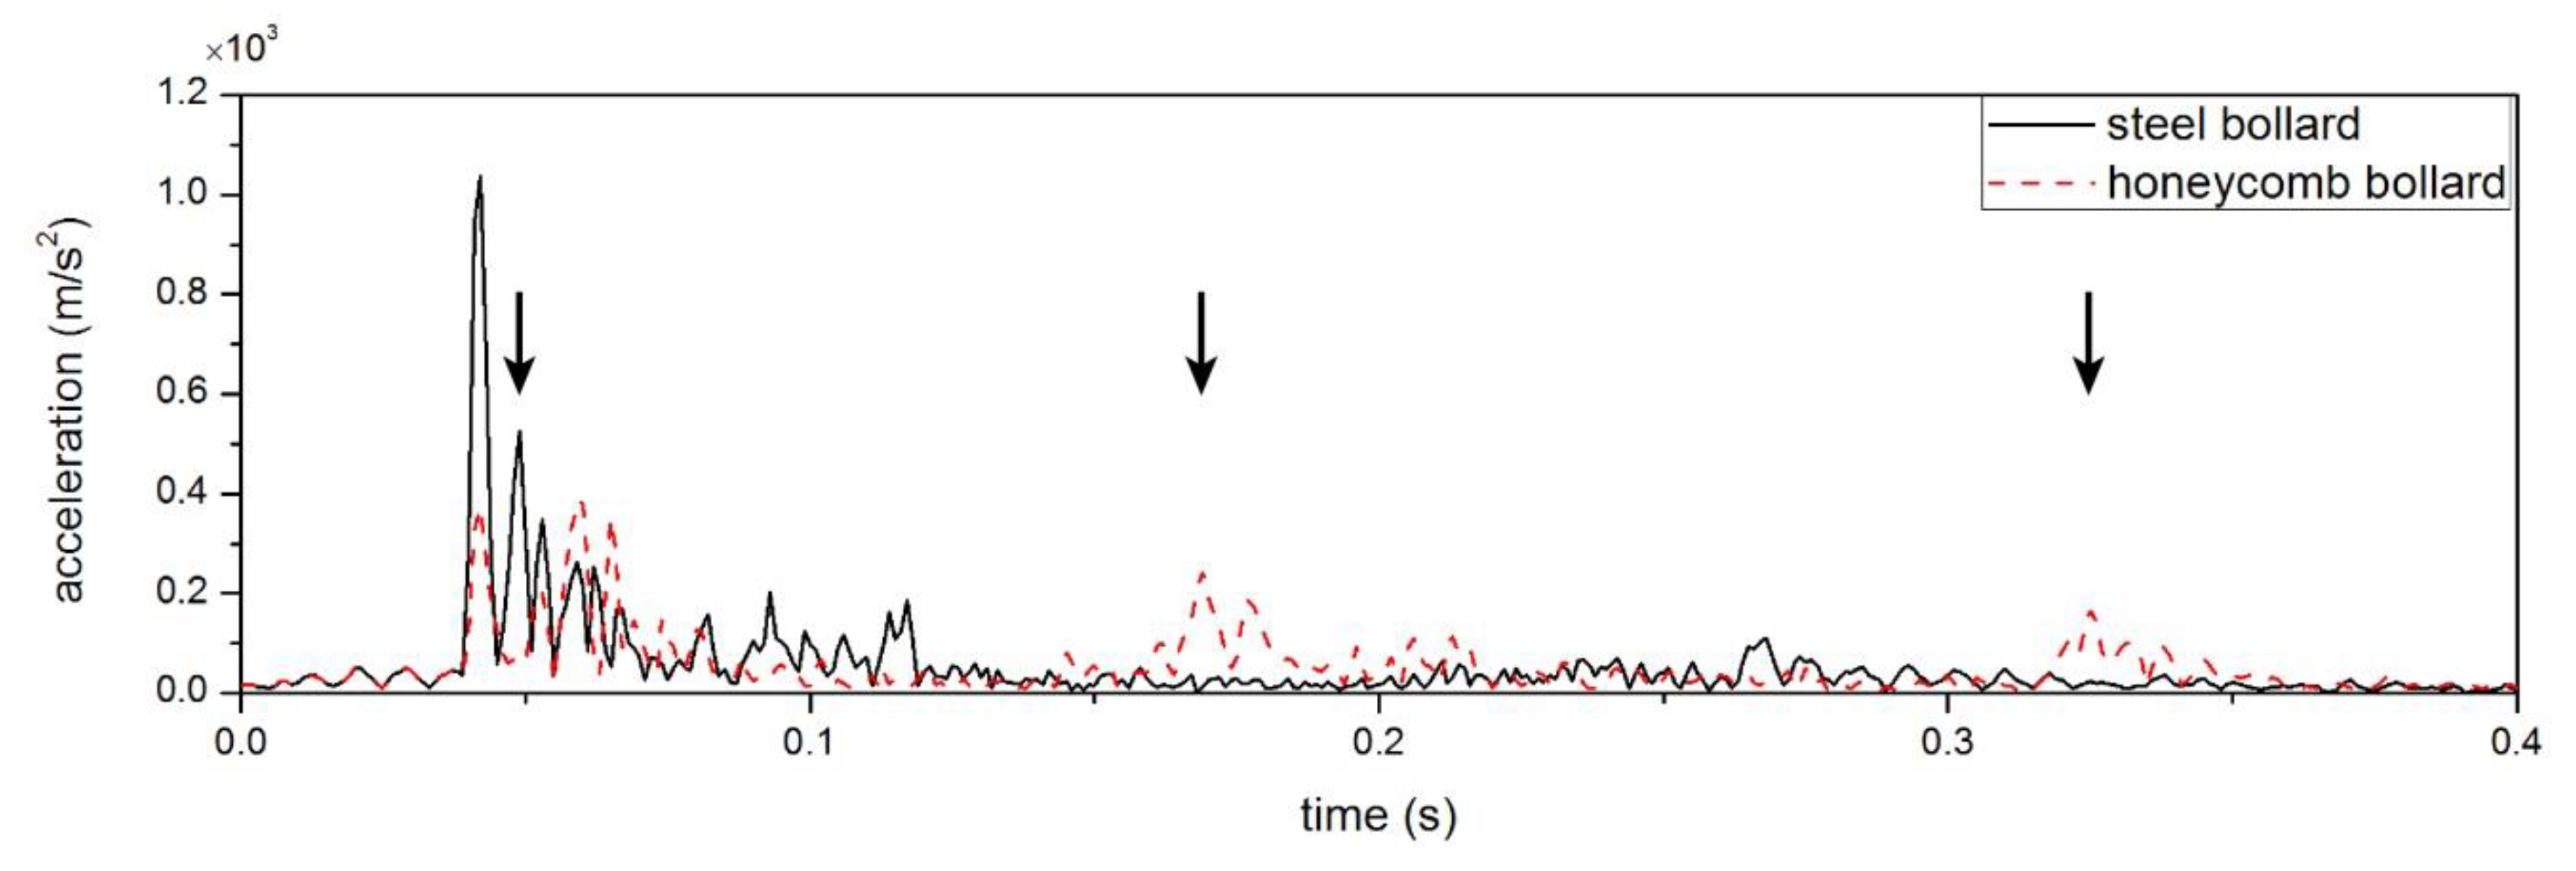
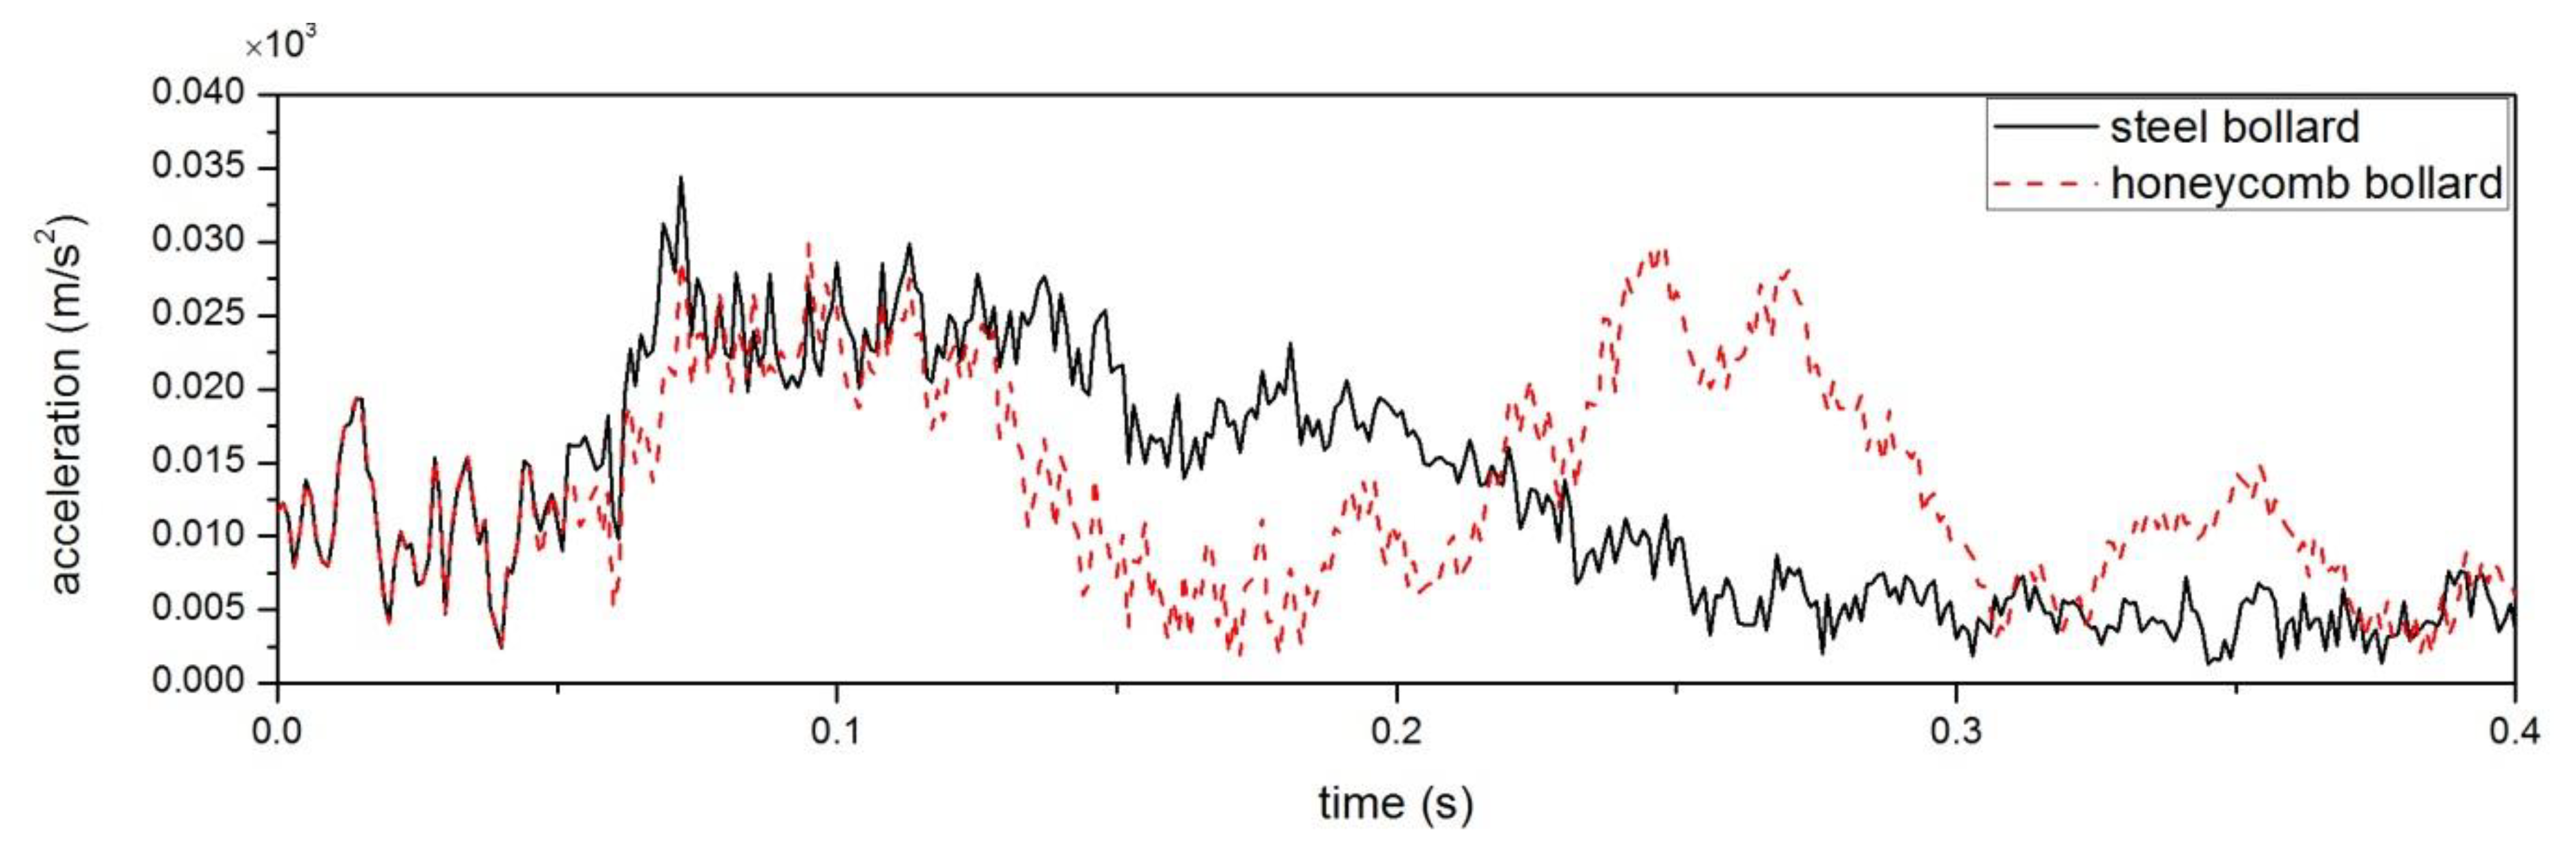
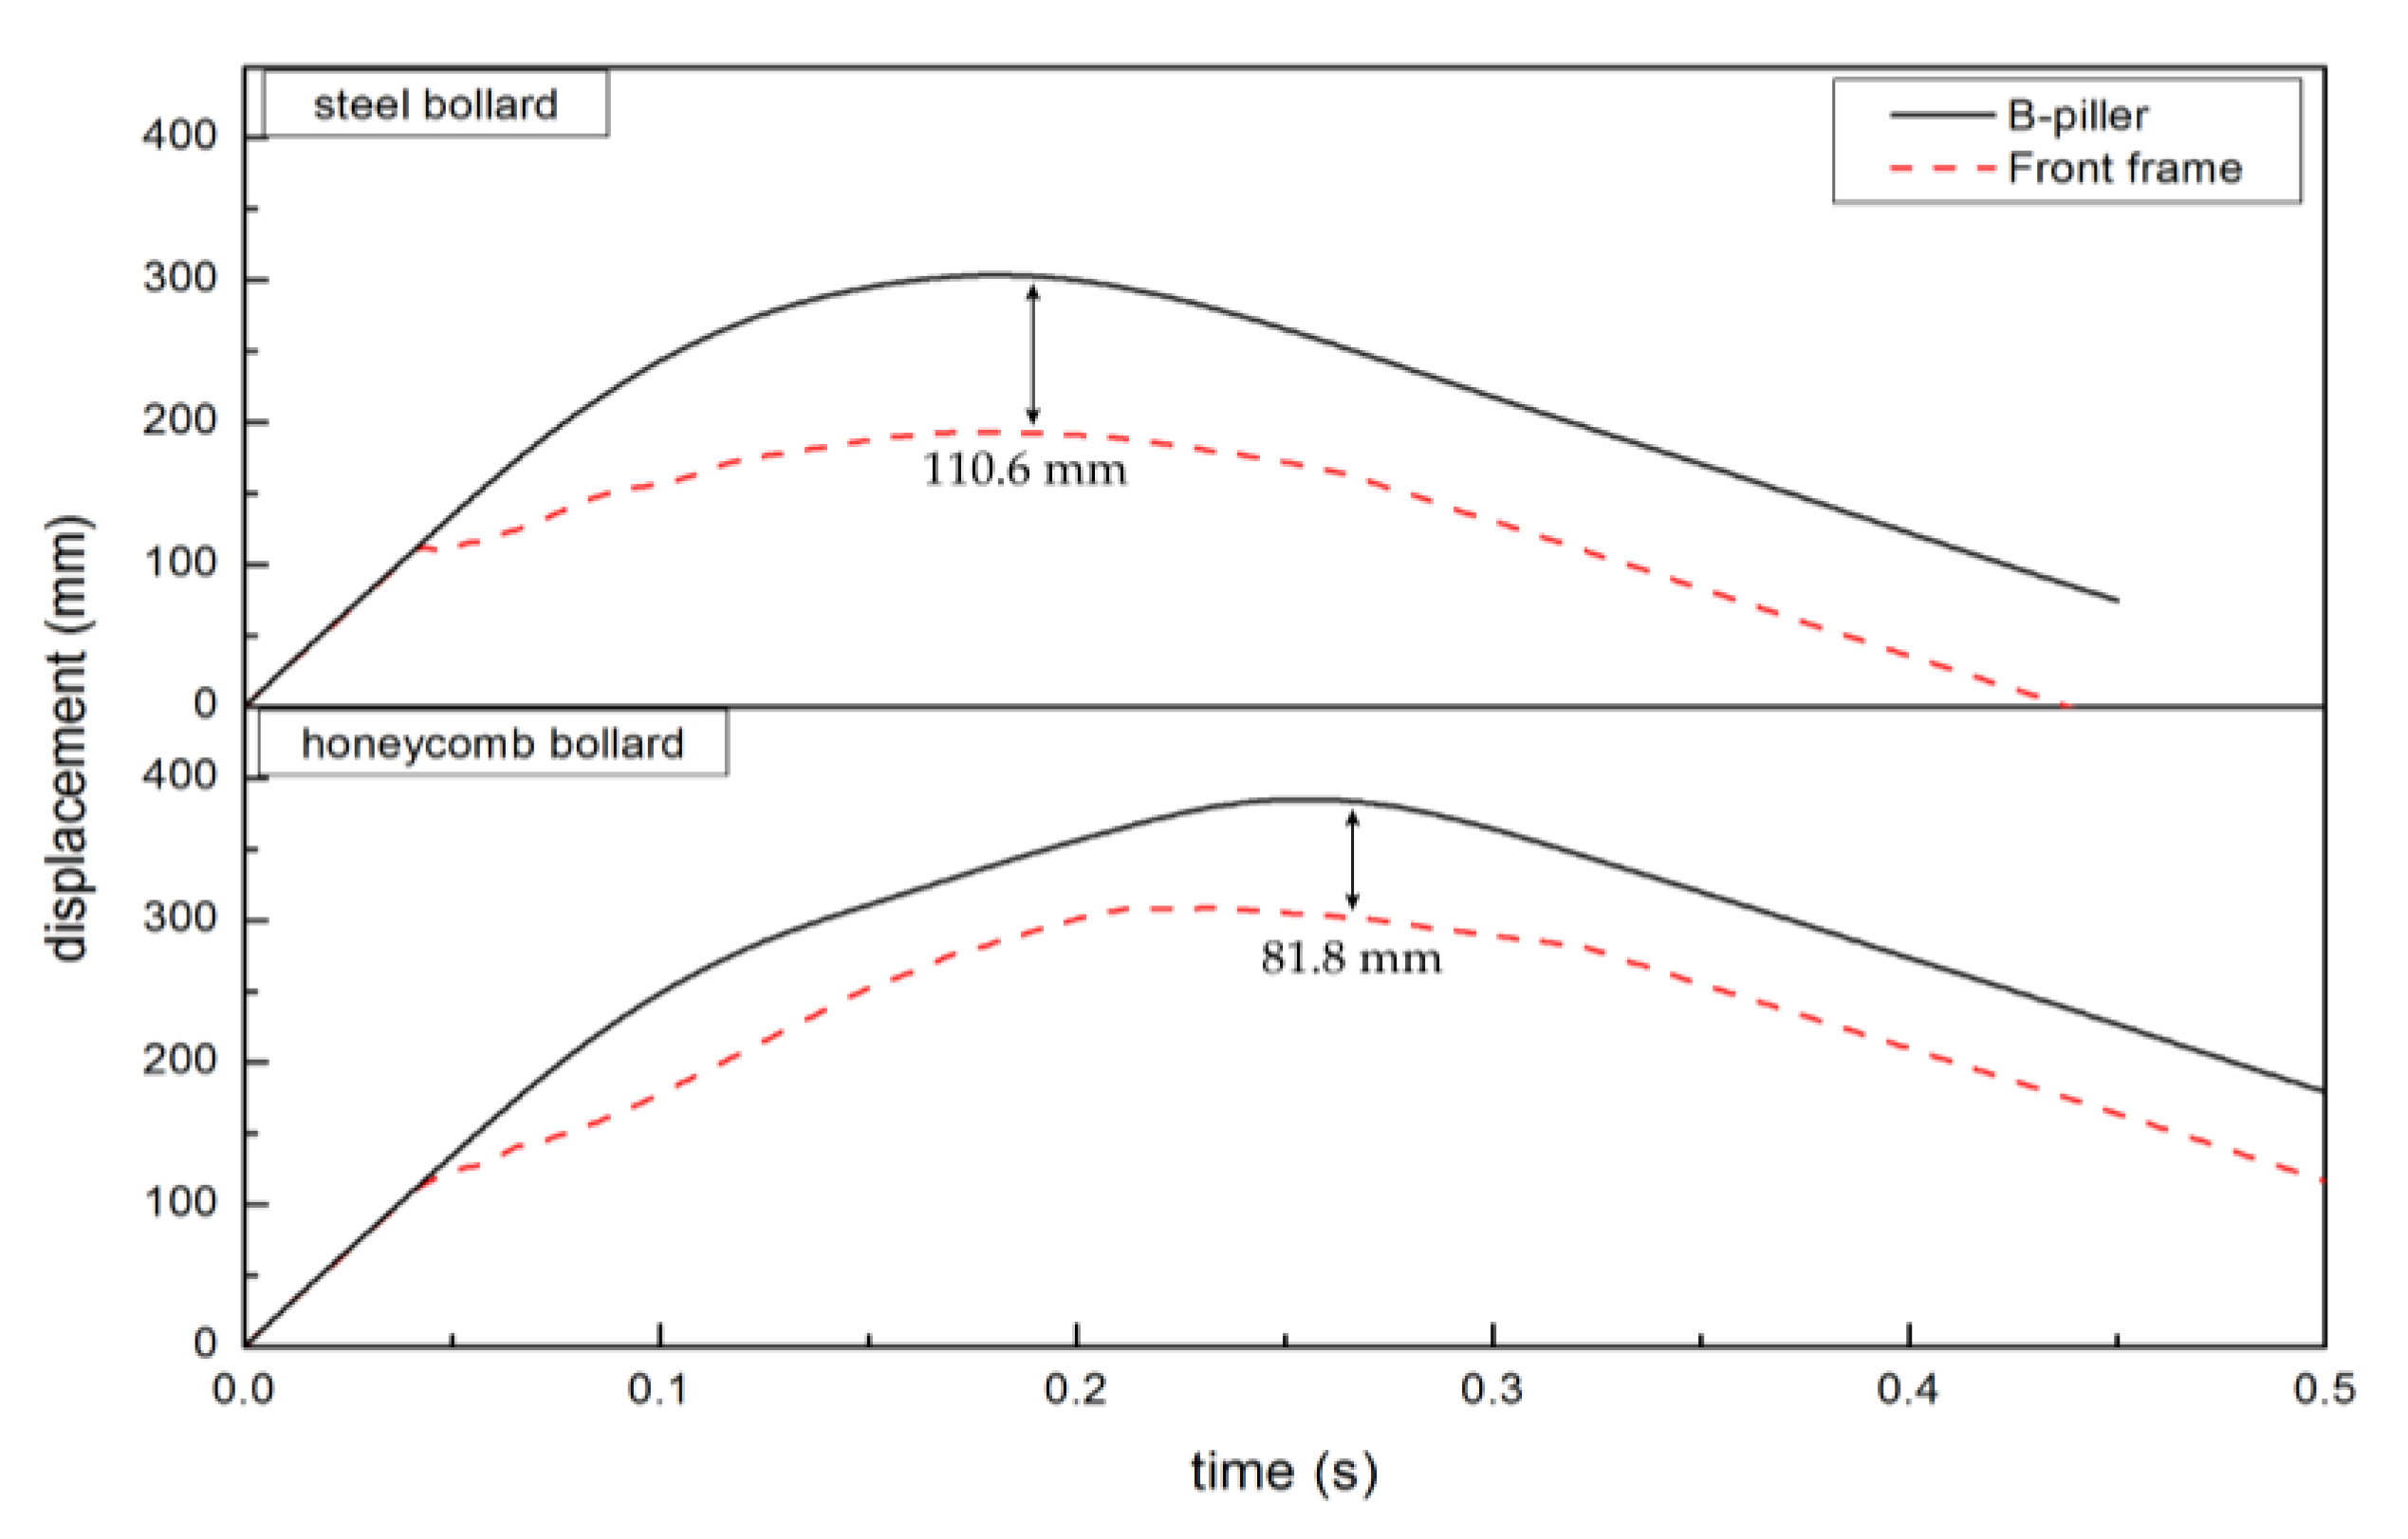
  • Maximum accelerations at the vehicle front bumper frame and the B-pillar were simulated with various yield strengths. Compared to steel bollard, simulations with 20 MPa in-plane honeycomb bollard, when impacted by the vehicle at 10 km/h, showed the maximum acceleration time being delayed by 0.017 s, the peak acceleration value decreased to 37.4% of the steel bollard’s peak, and maximum deformation time increased by 0.083 s. The maximum acceleration of the B-pillar decreased by 13% when compared to that of steel bollard.
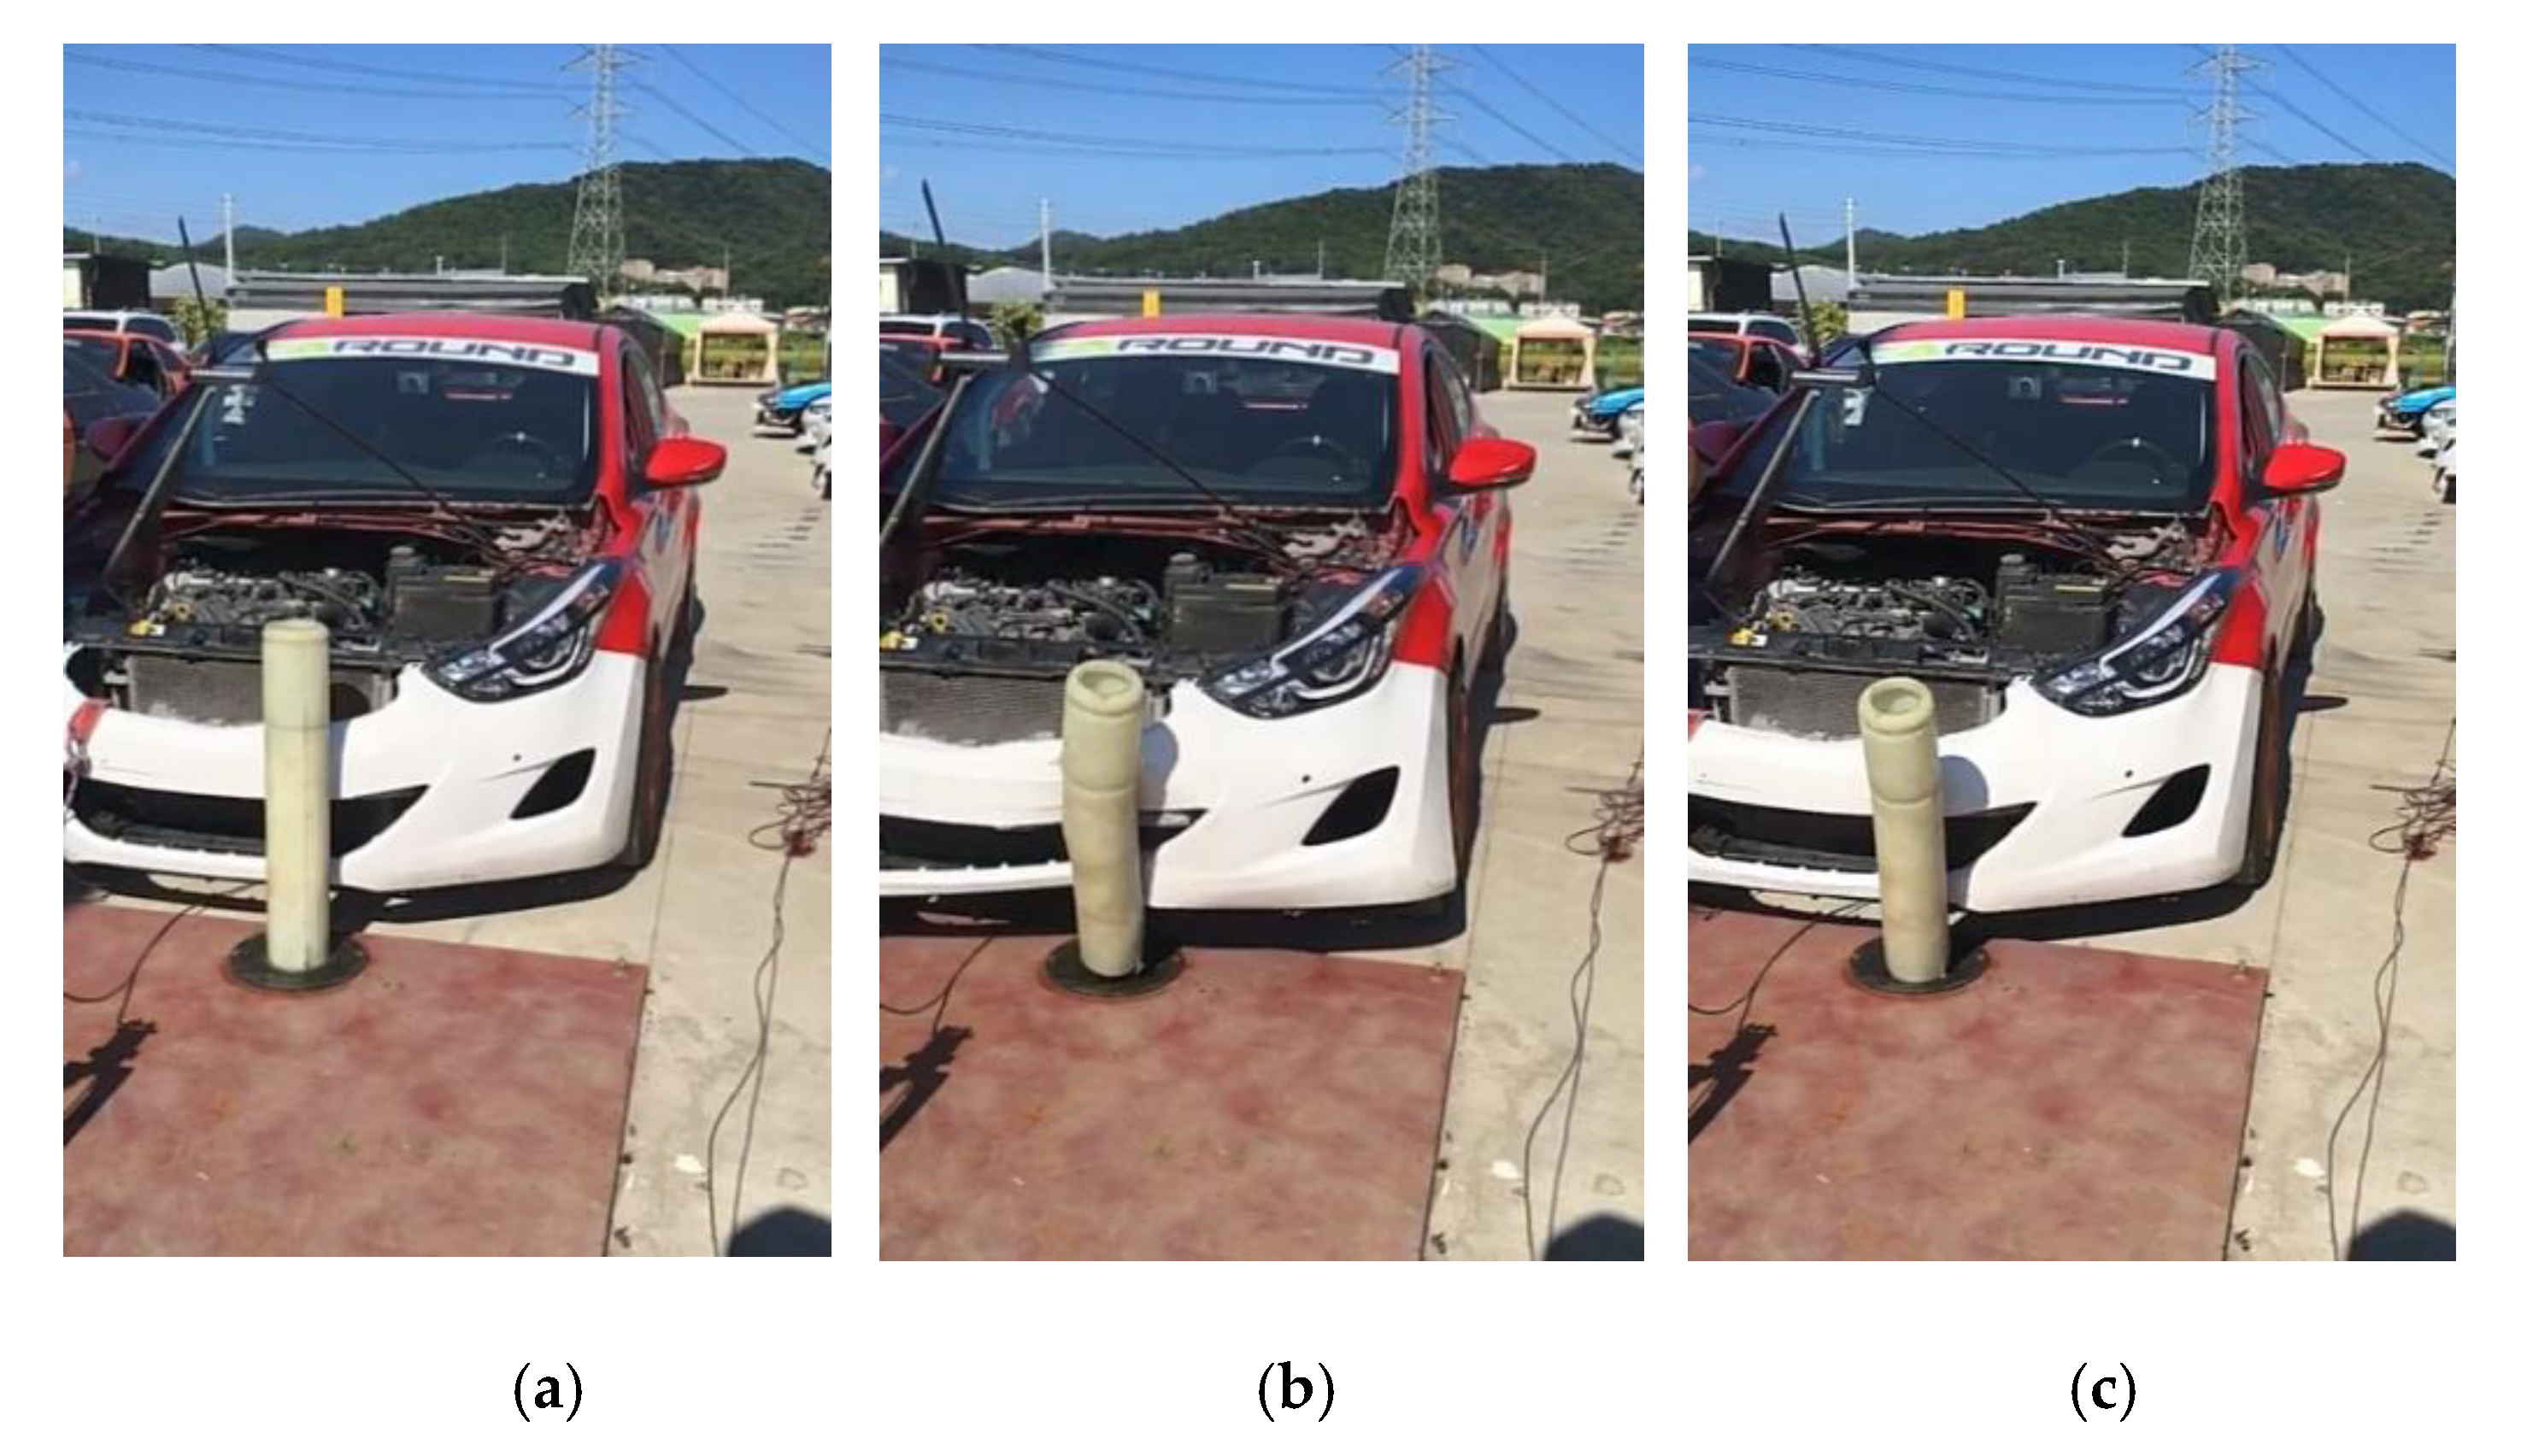
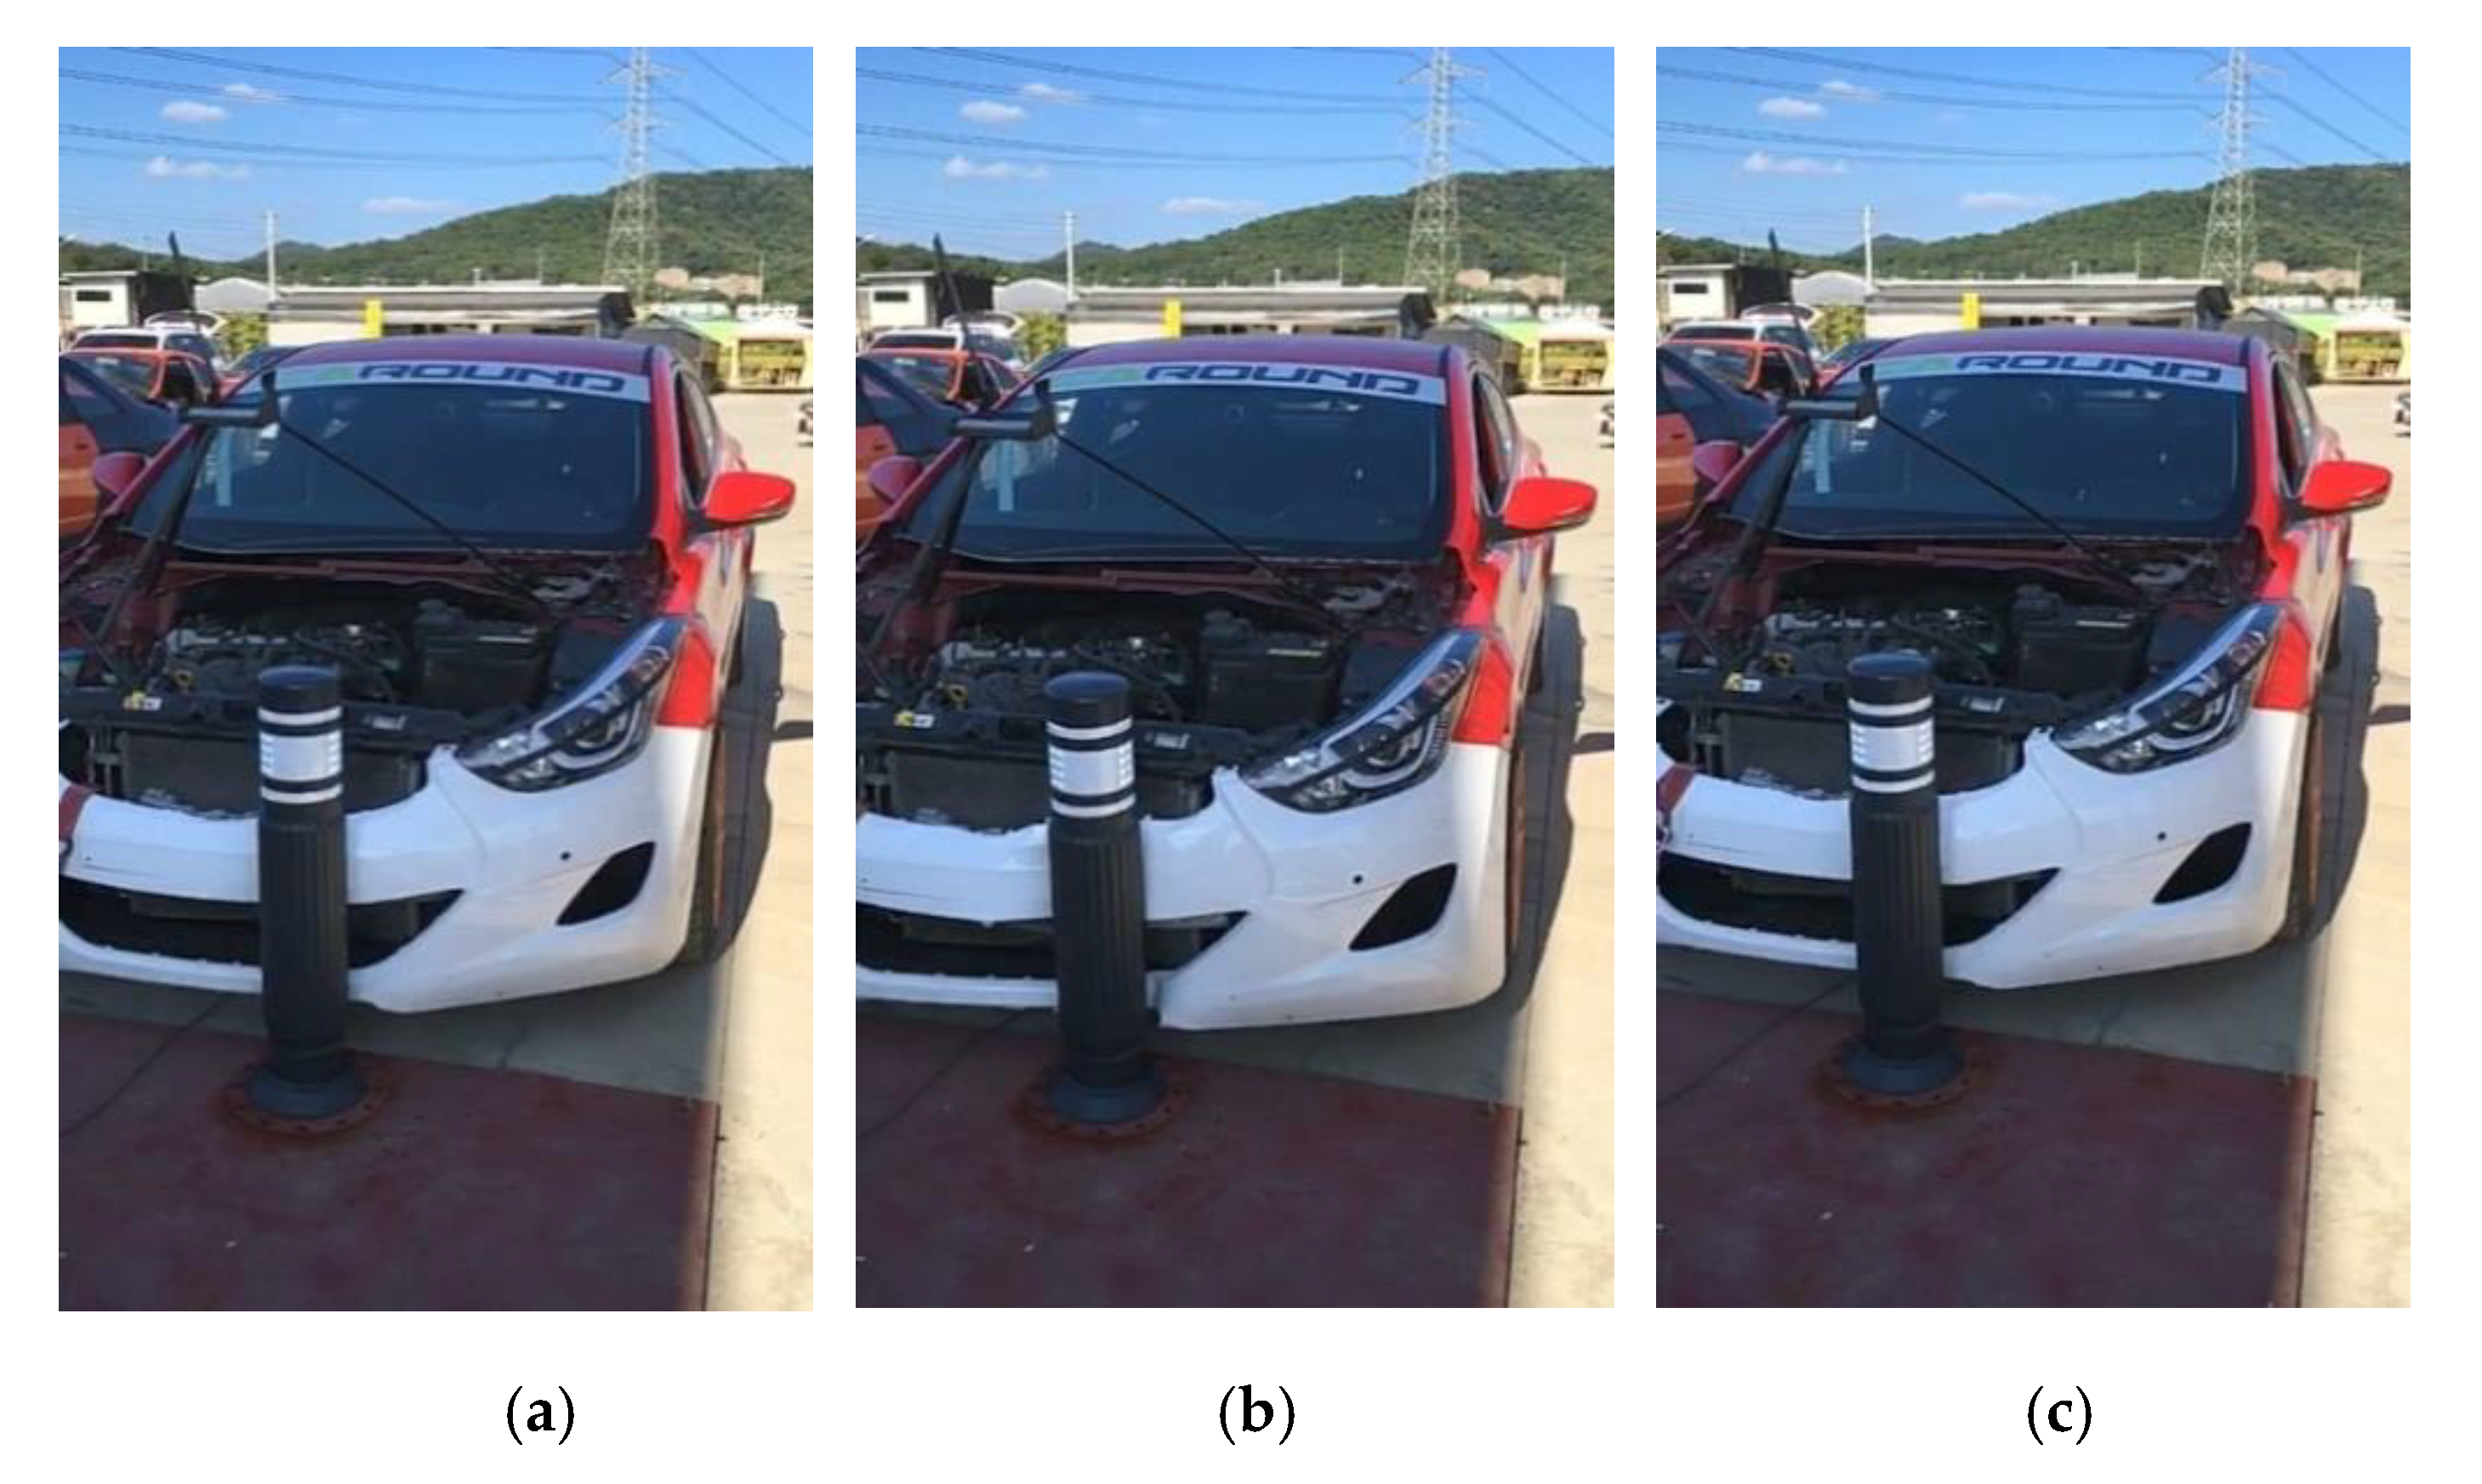
  • From the analysis of the vehicle-bollard collision experiment videos, the maximum acceleration occurrence time at the bumper cover has increased by 0.783 s.
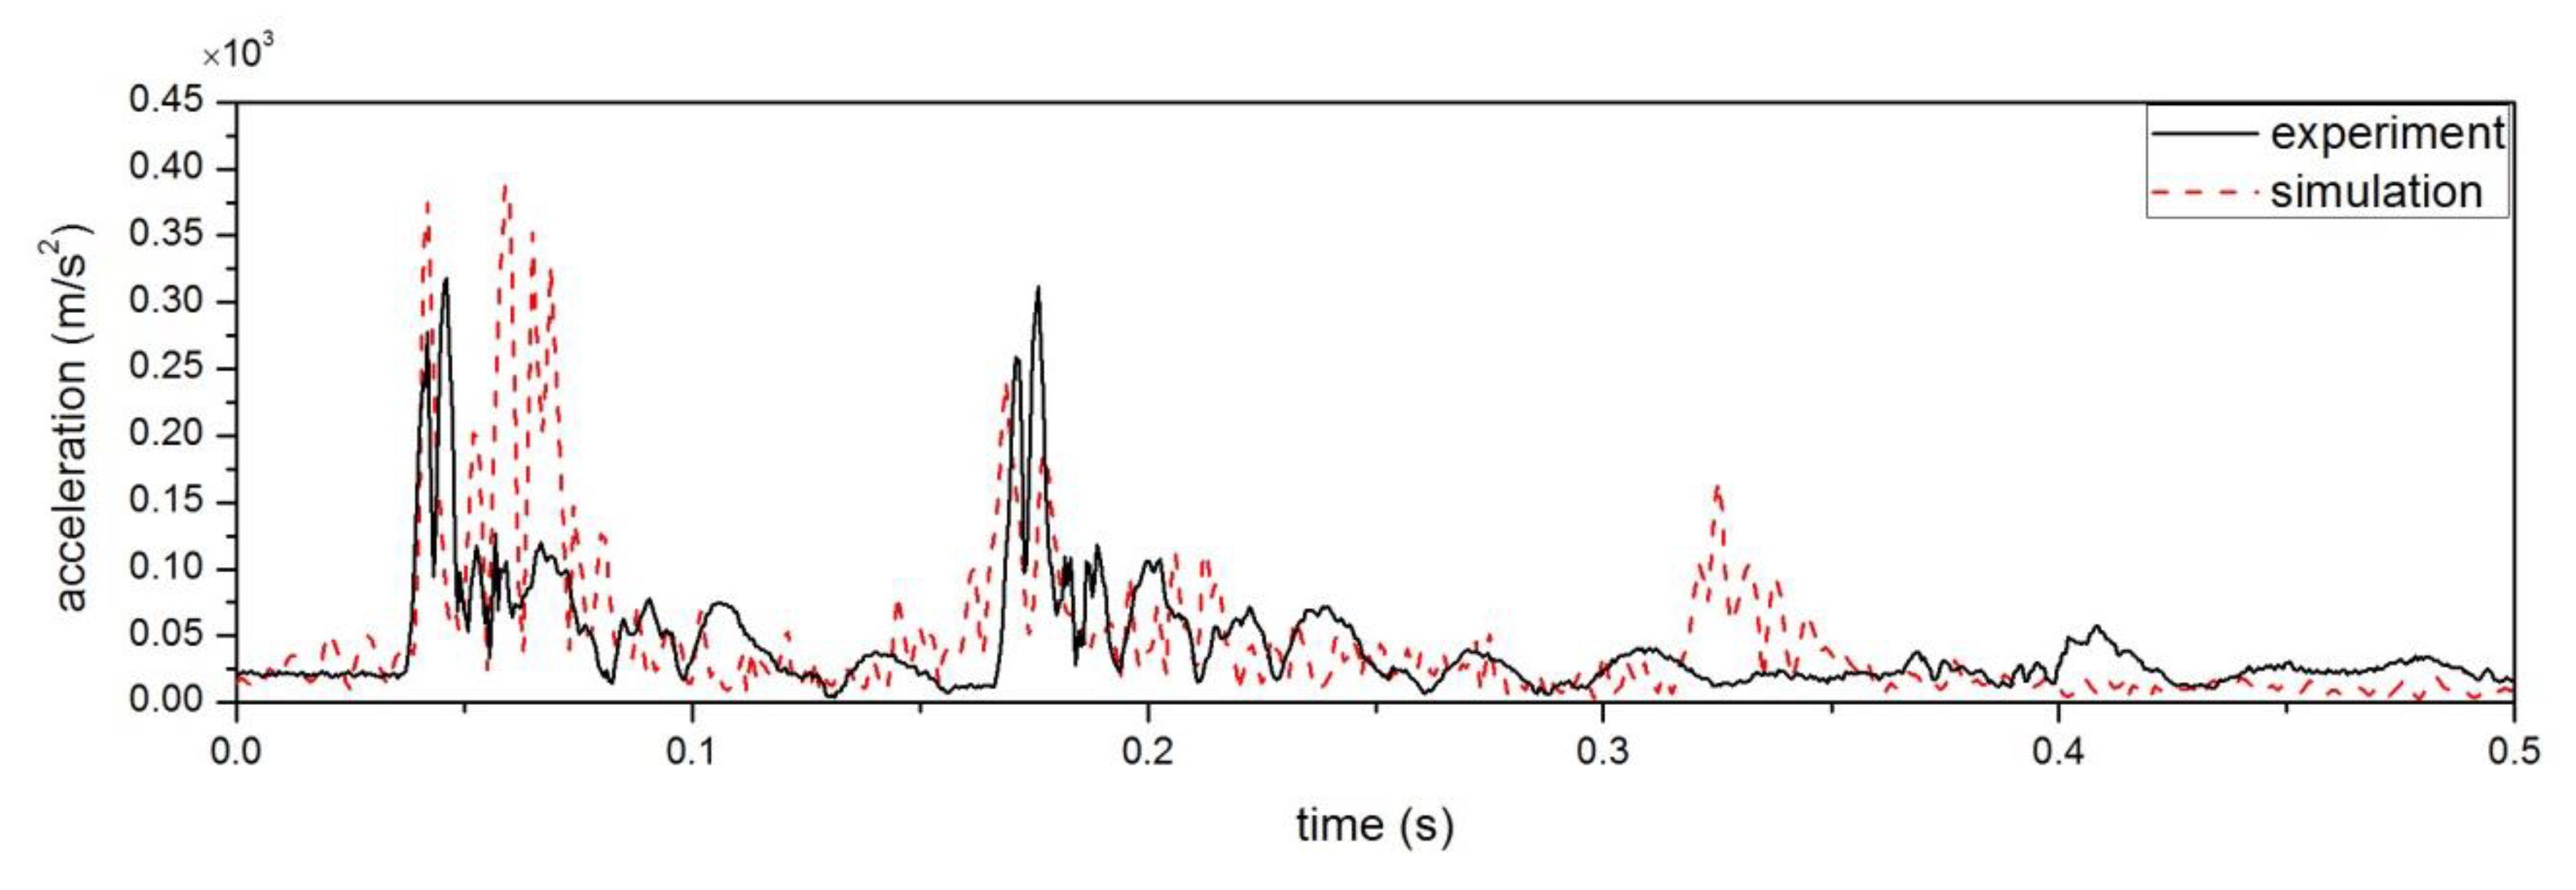
  • The maximum accelerations, measured during the experiment and calculated from the simulation, were 0.35 × 10³ m/s2 and 0.388 × 10³ m/s2, respectively. This proves the similarity in the acceleration and damage characteristics between the experiment and the simulation.
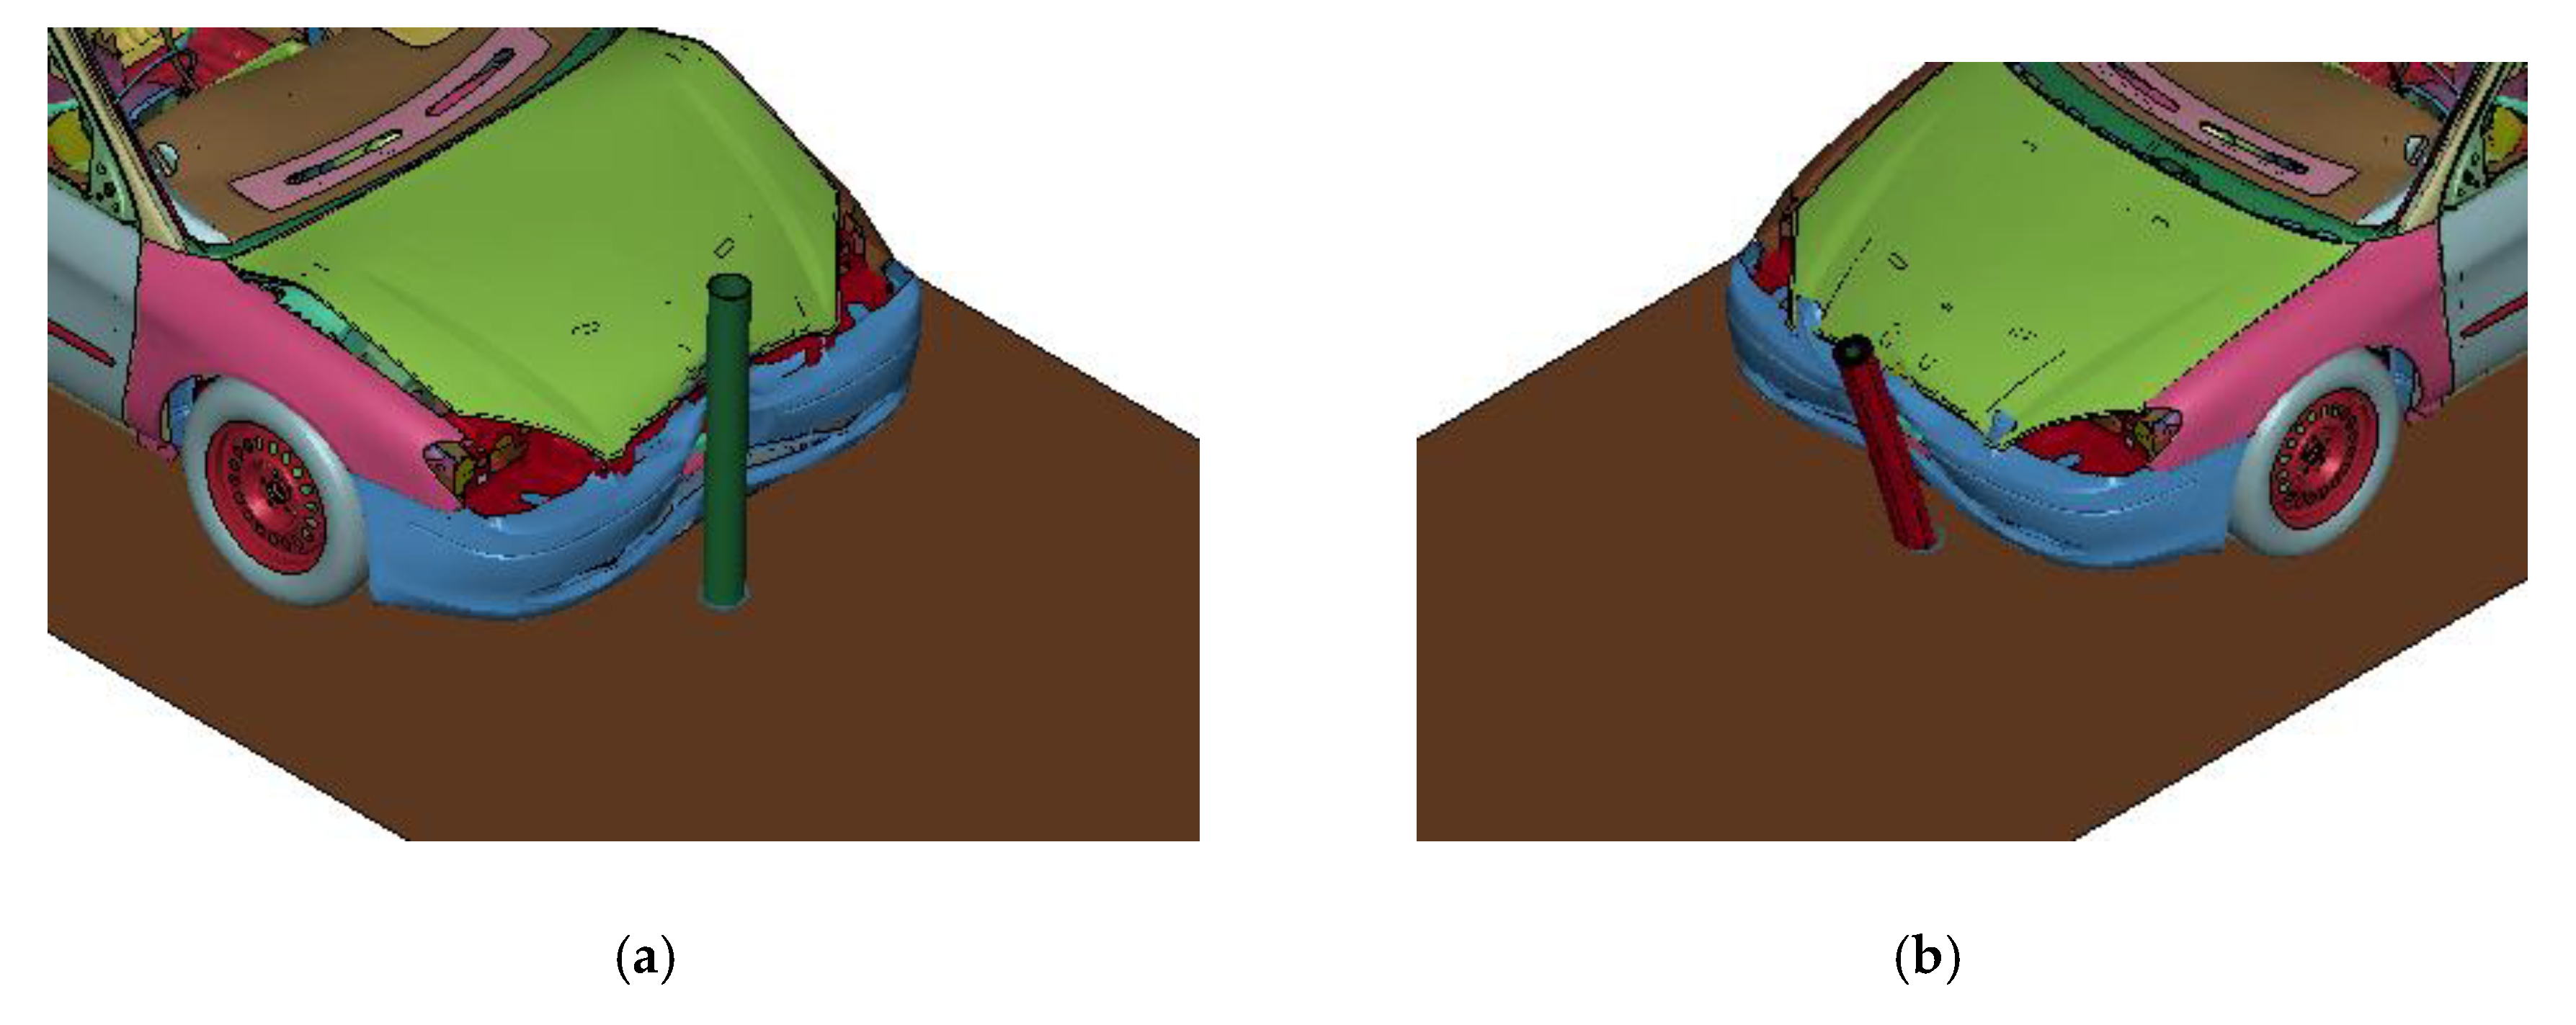
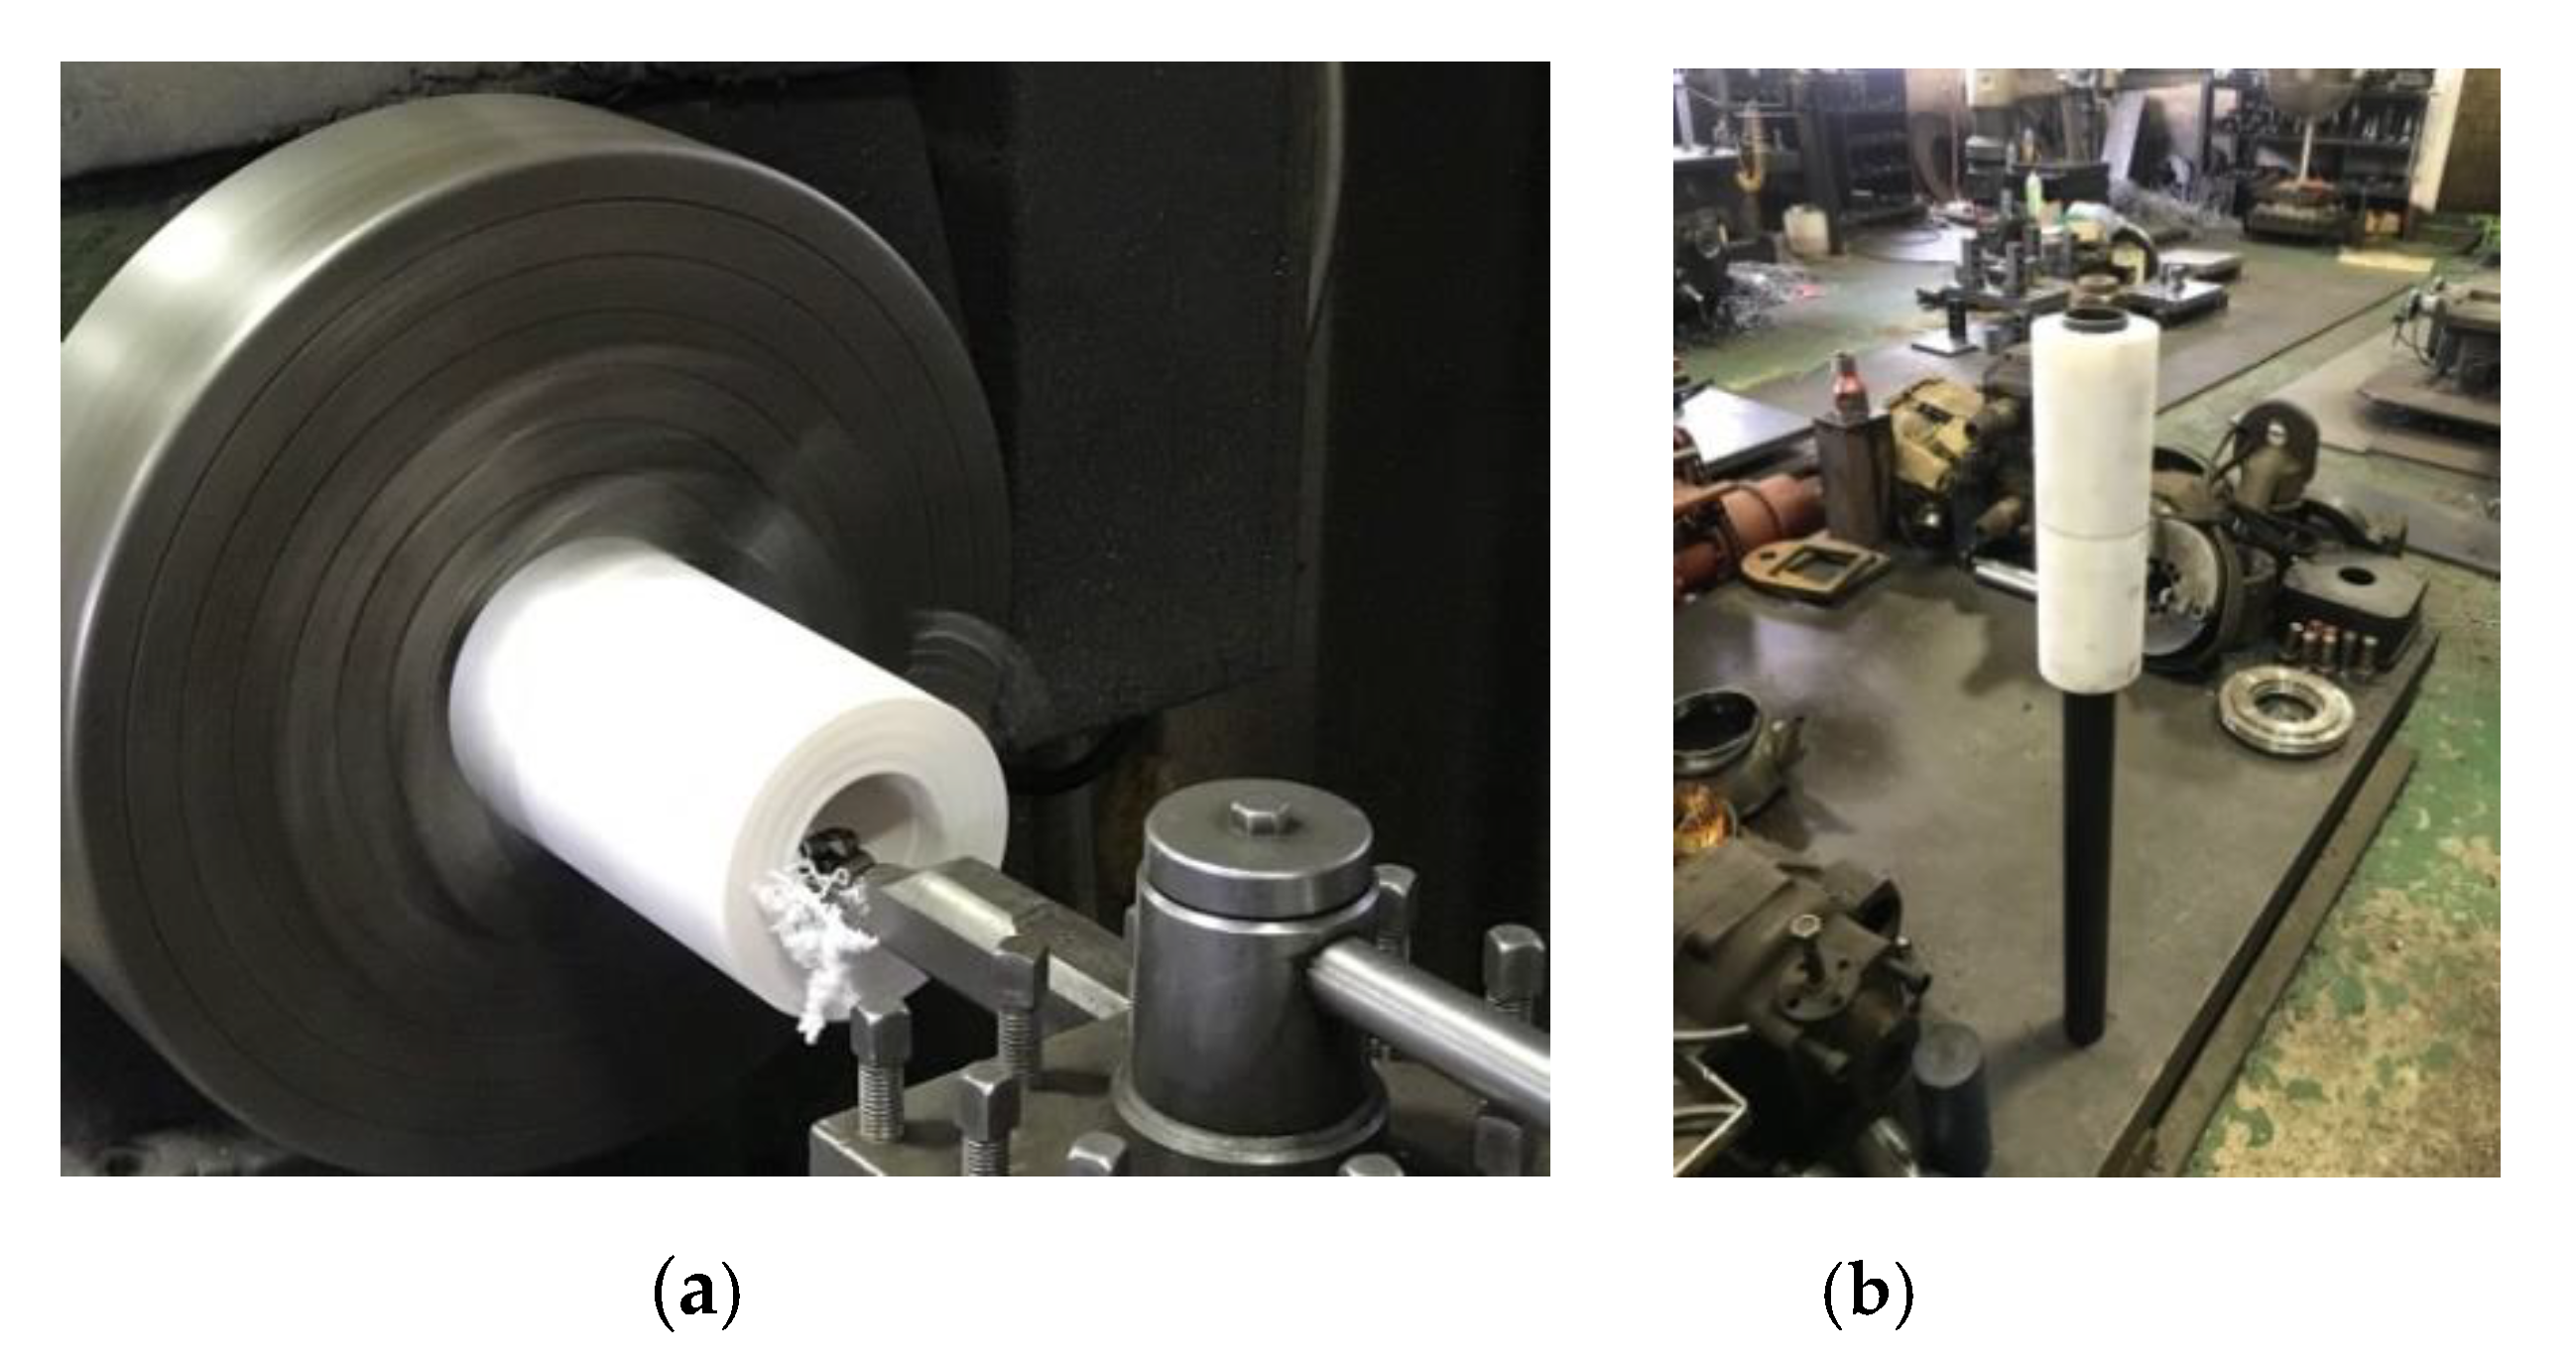
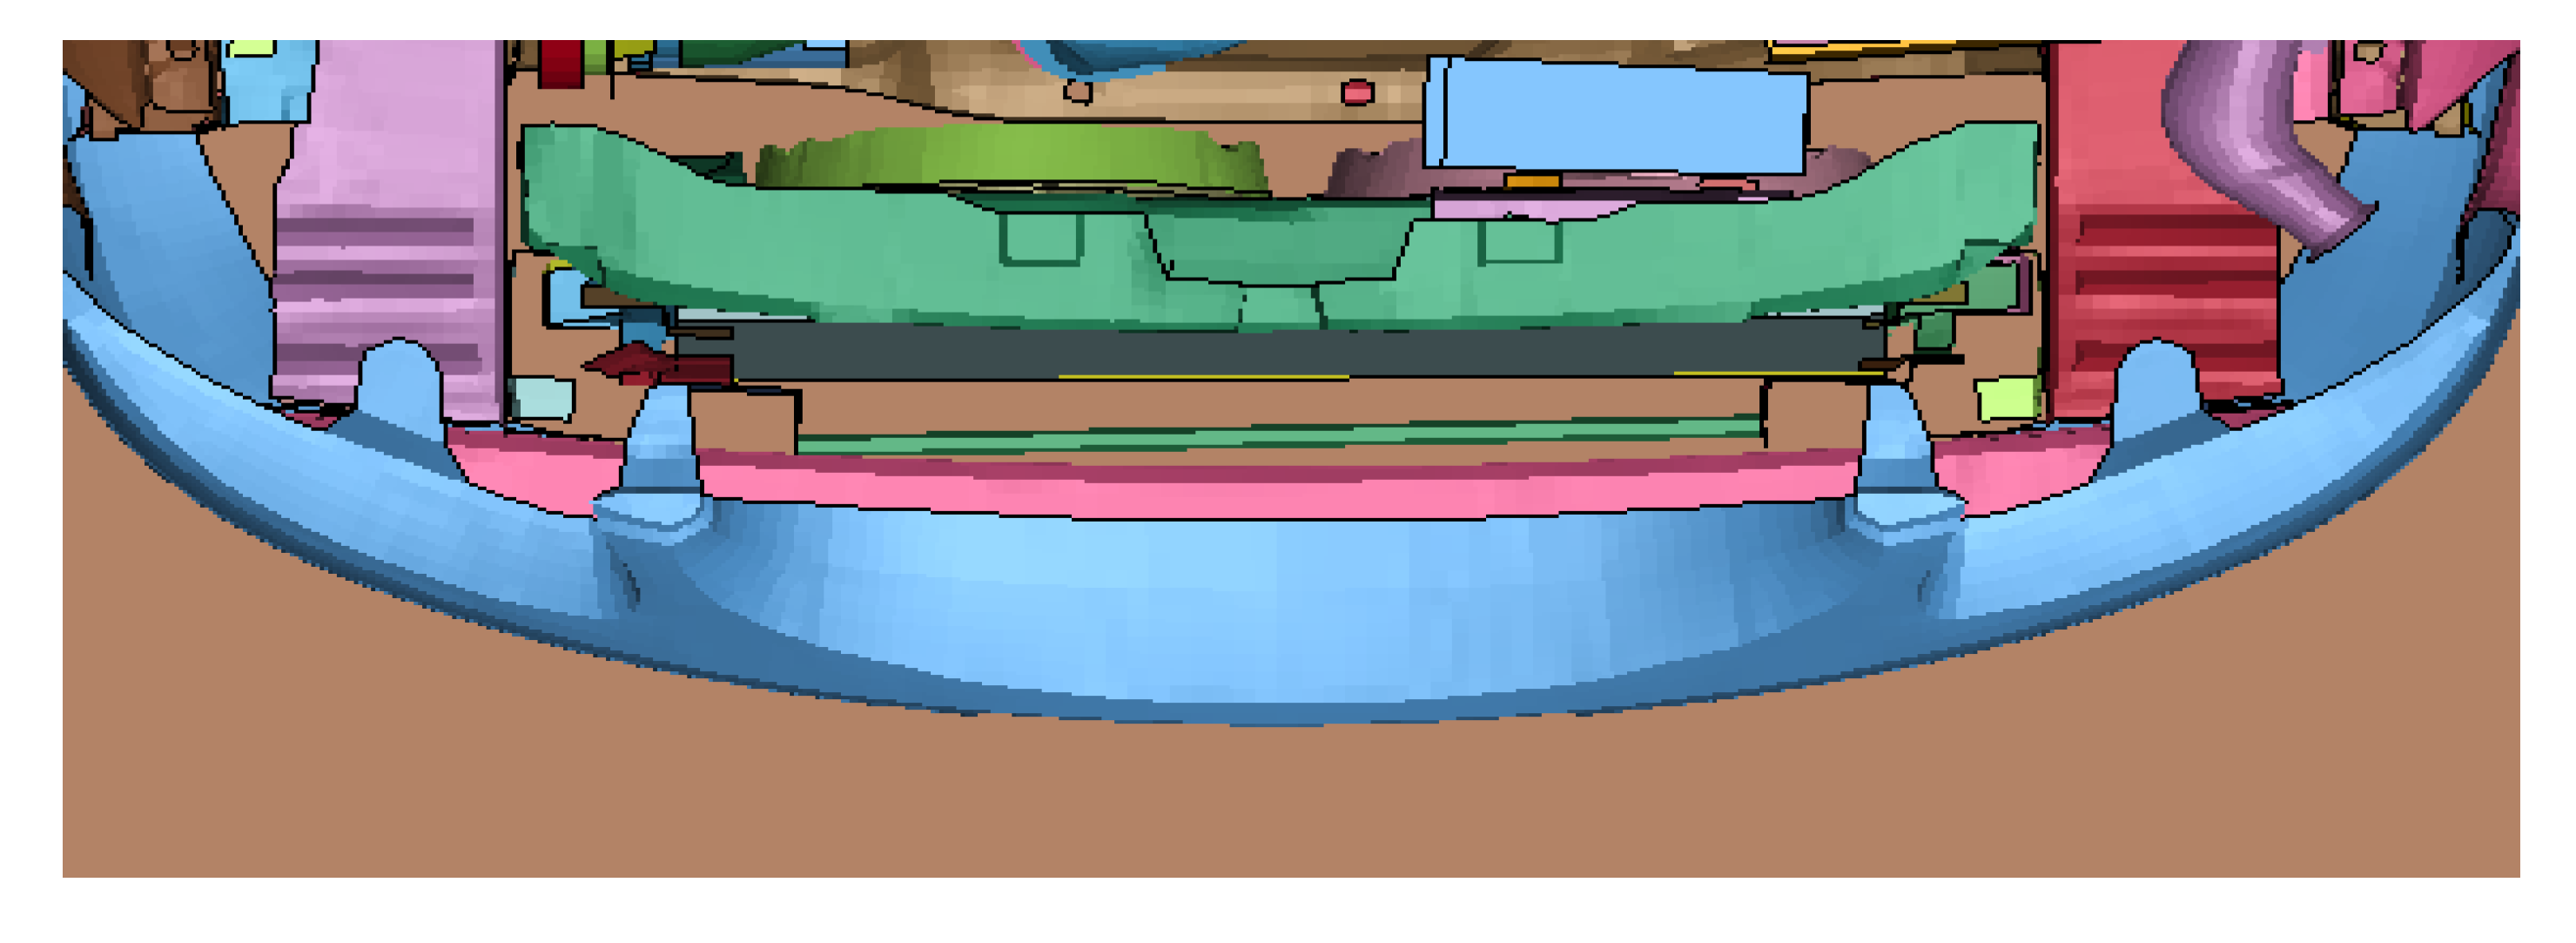
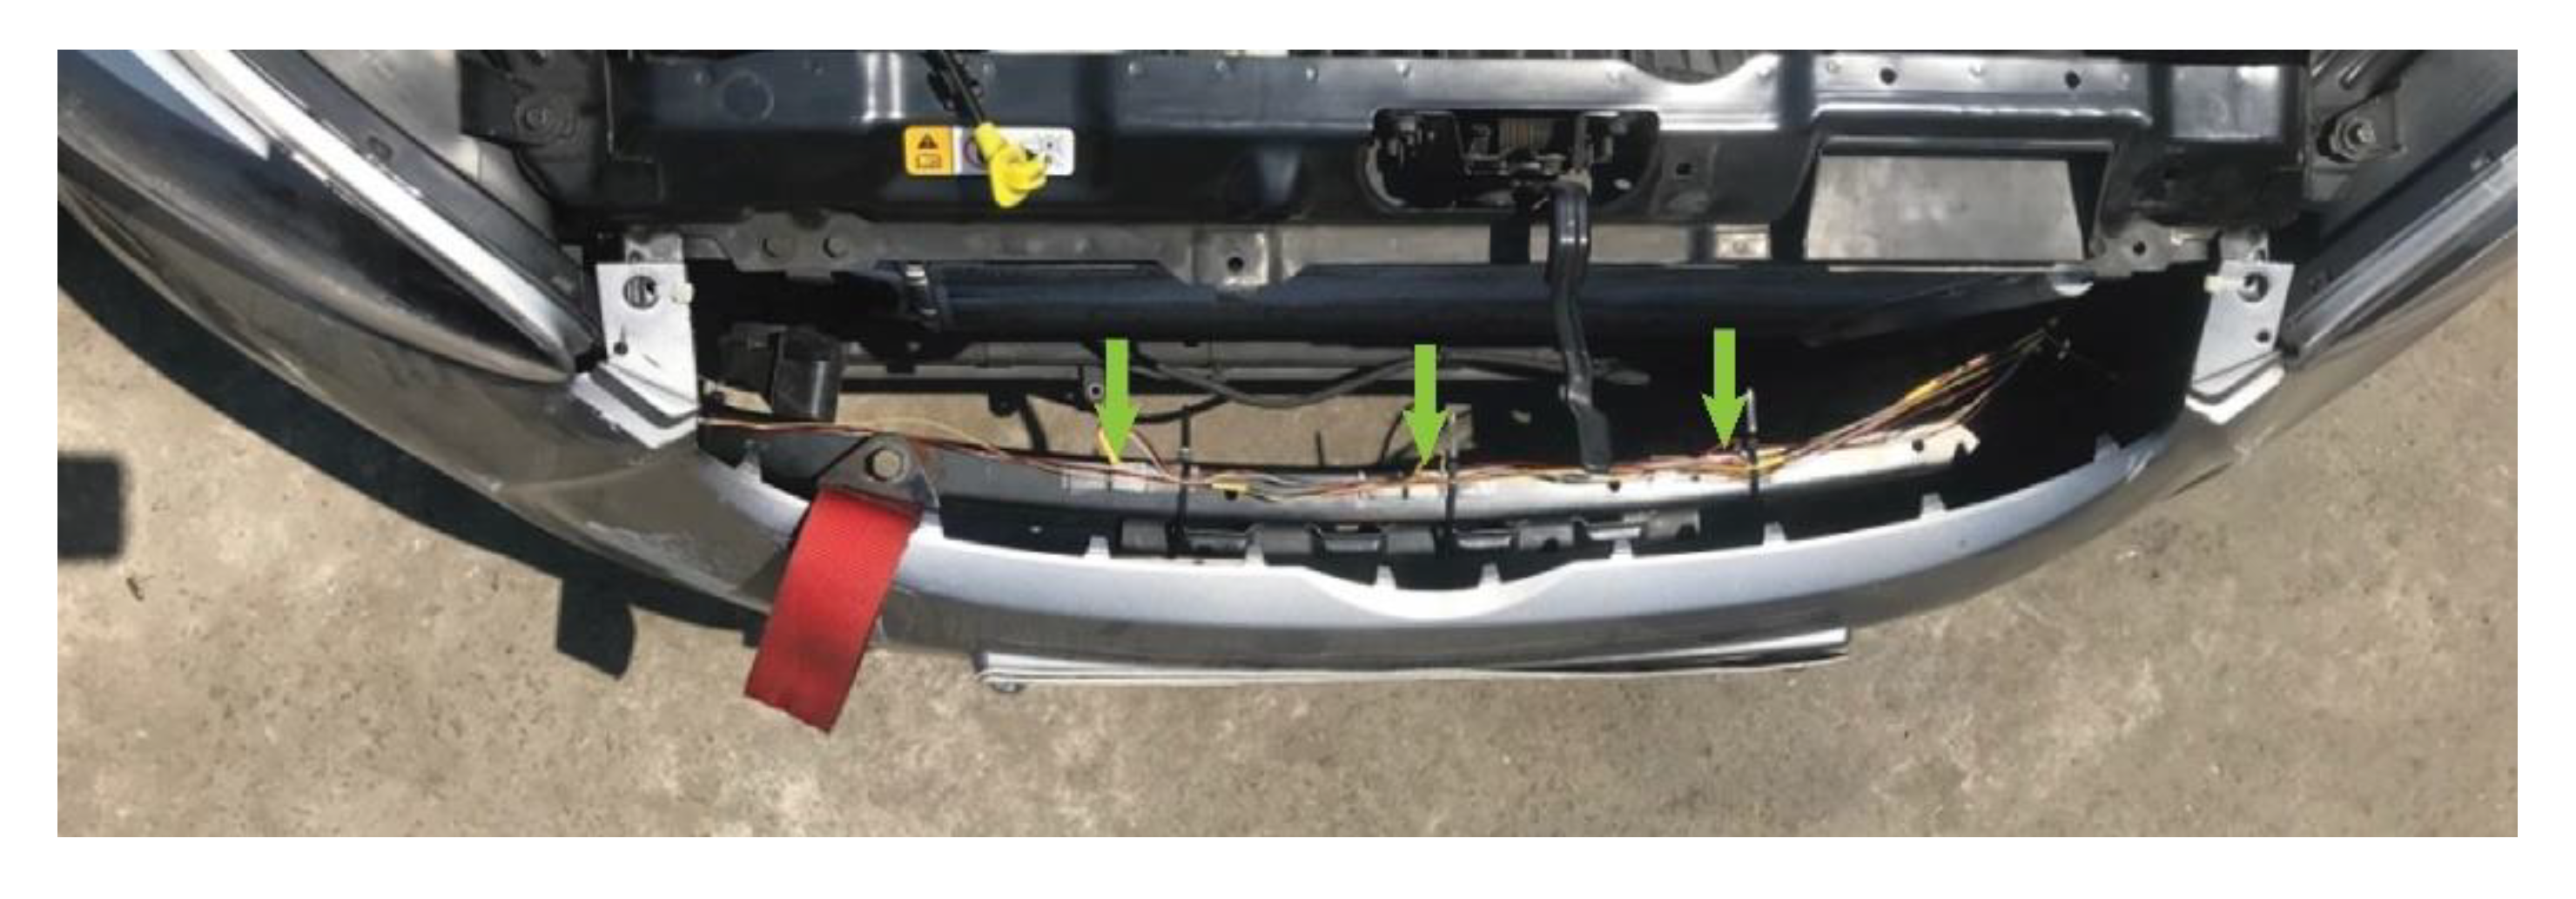
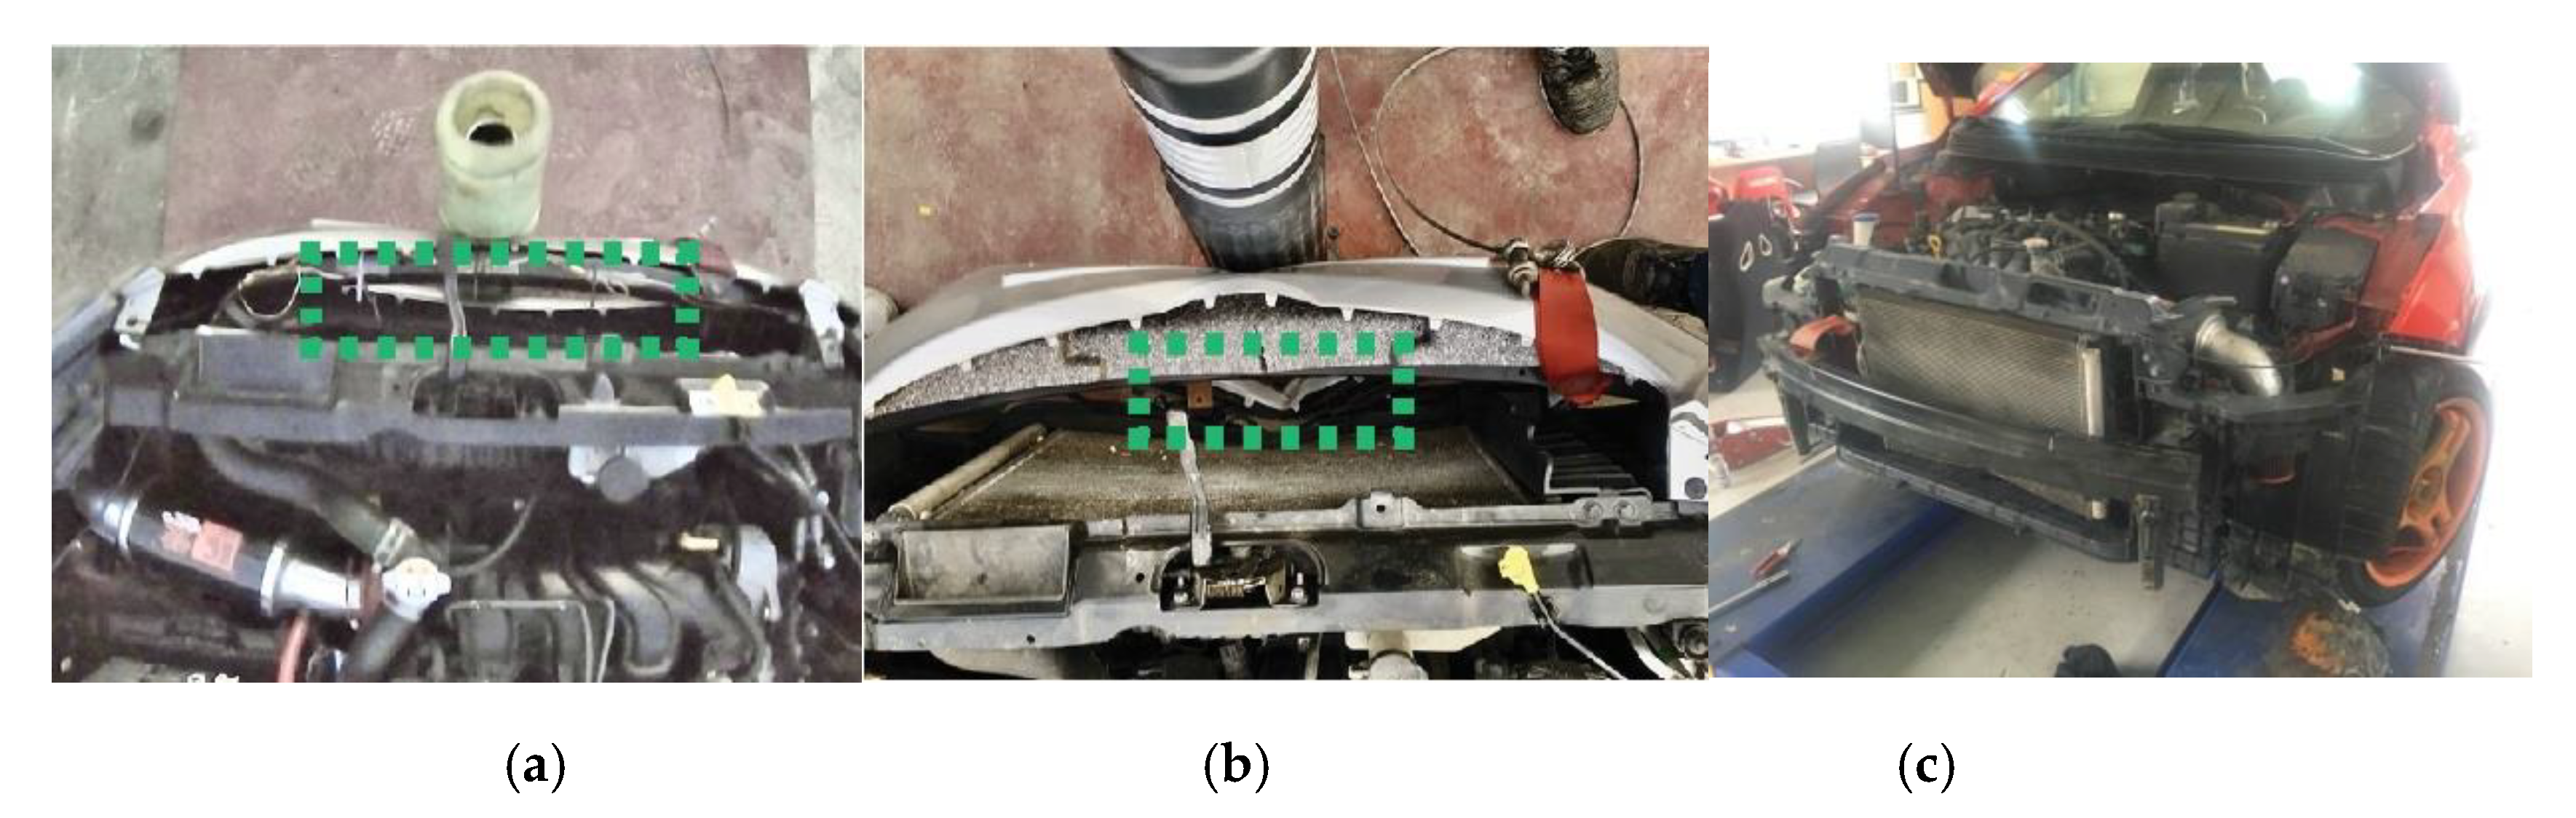
  • From the vehicle-bollard collision experiments, it was observed that the steel bollard not only caused damage to the test vehicle front bumper frame as in the simulation but also to its radiator. With only minor bumper frame deformation for the test against honeycomb bollard, this research proves the improved shock absorption characteristics of the proposed in-plane honeycomb bollards.
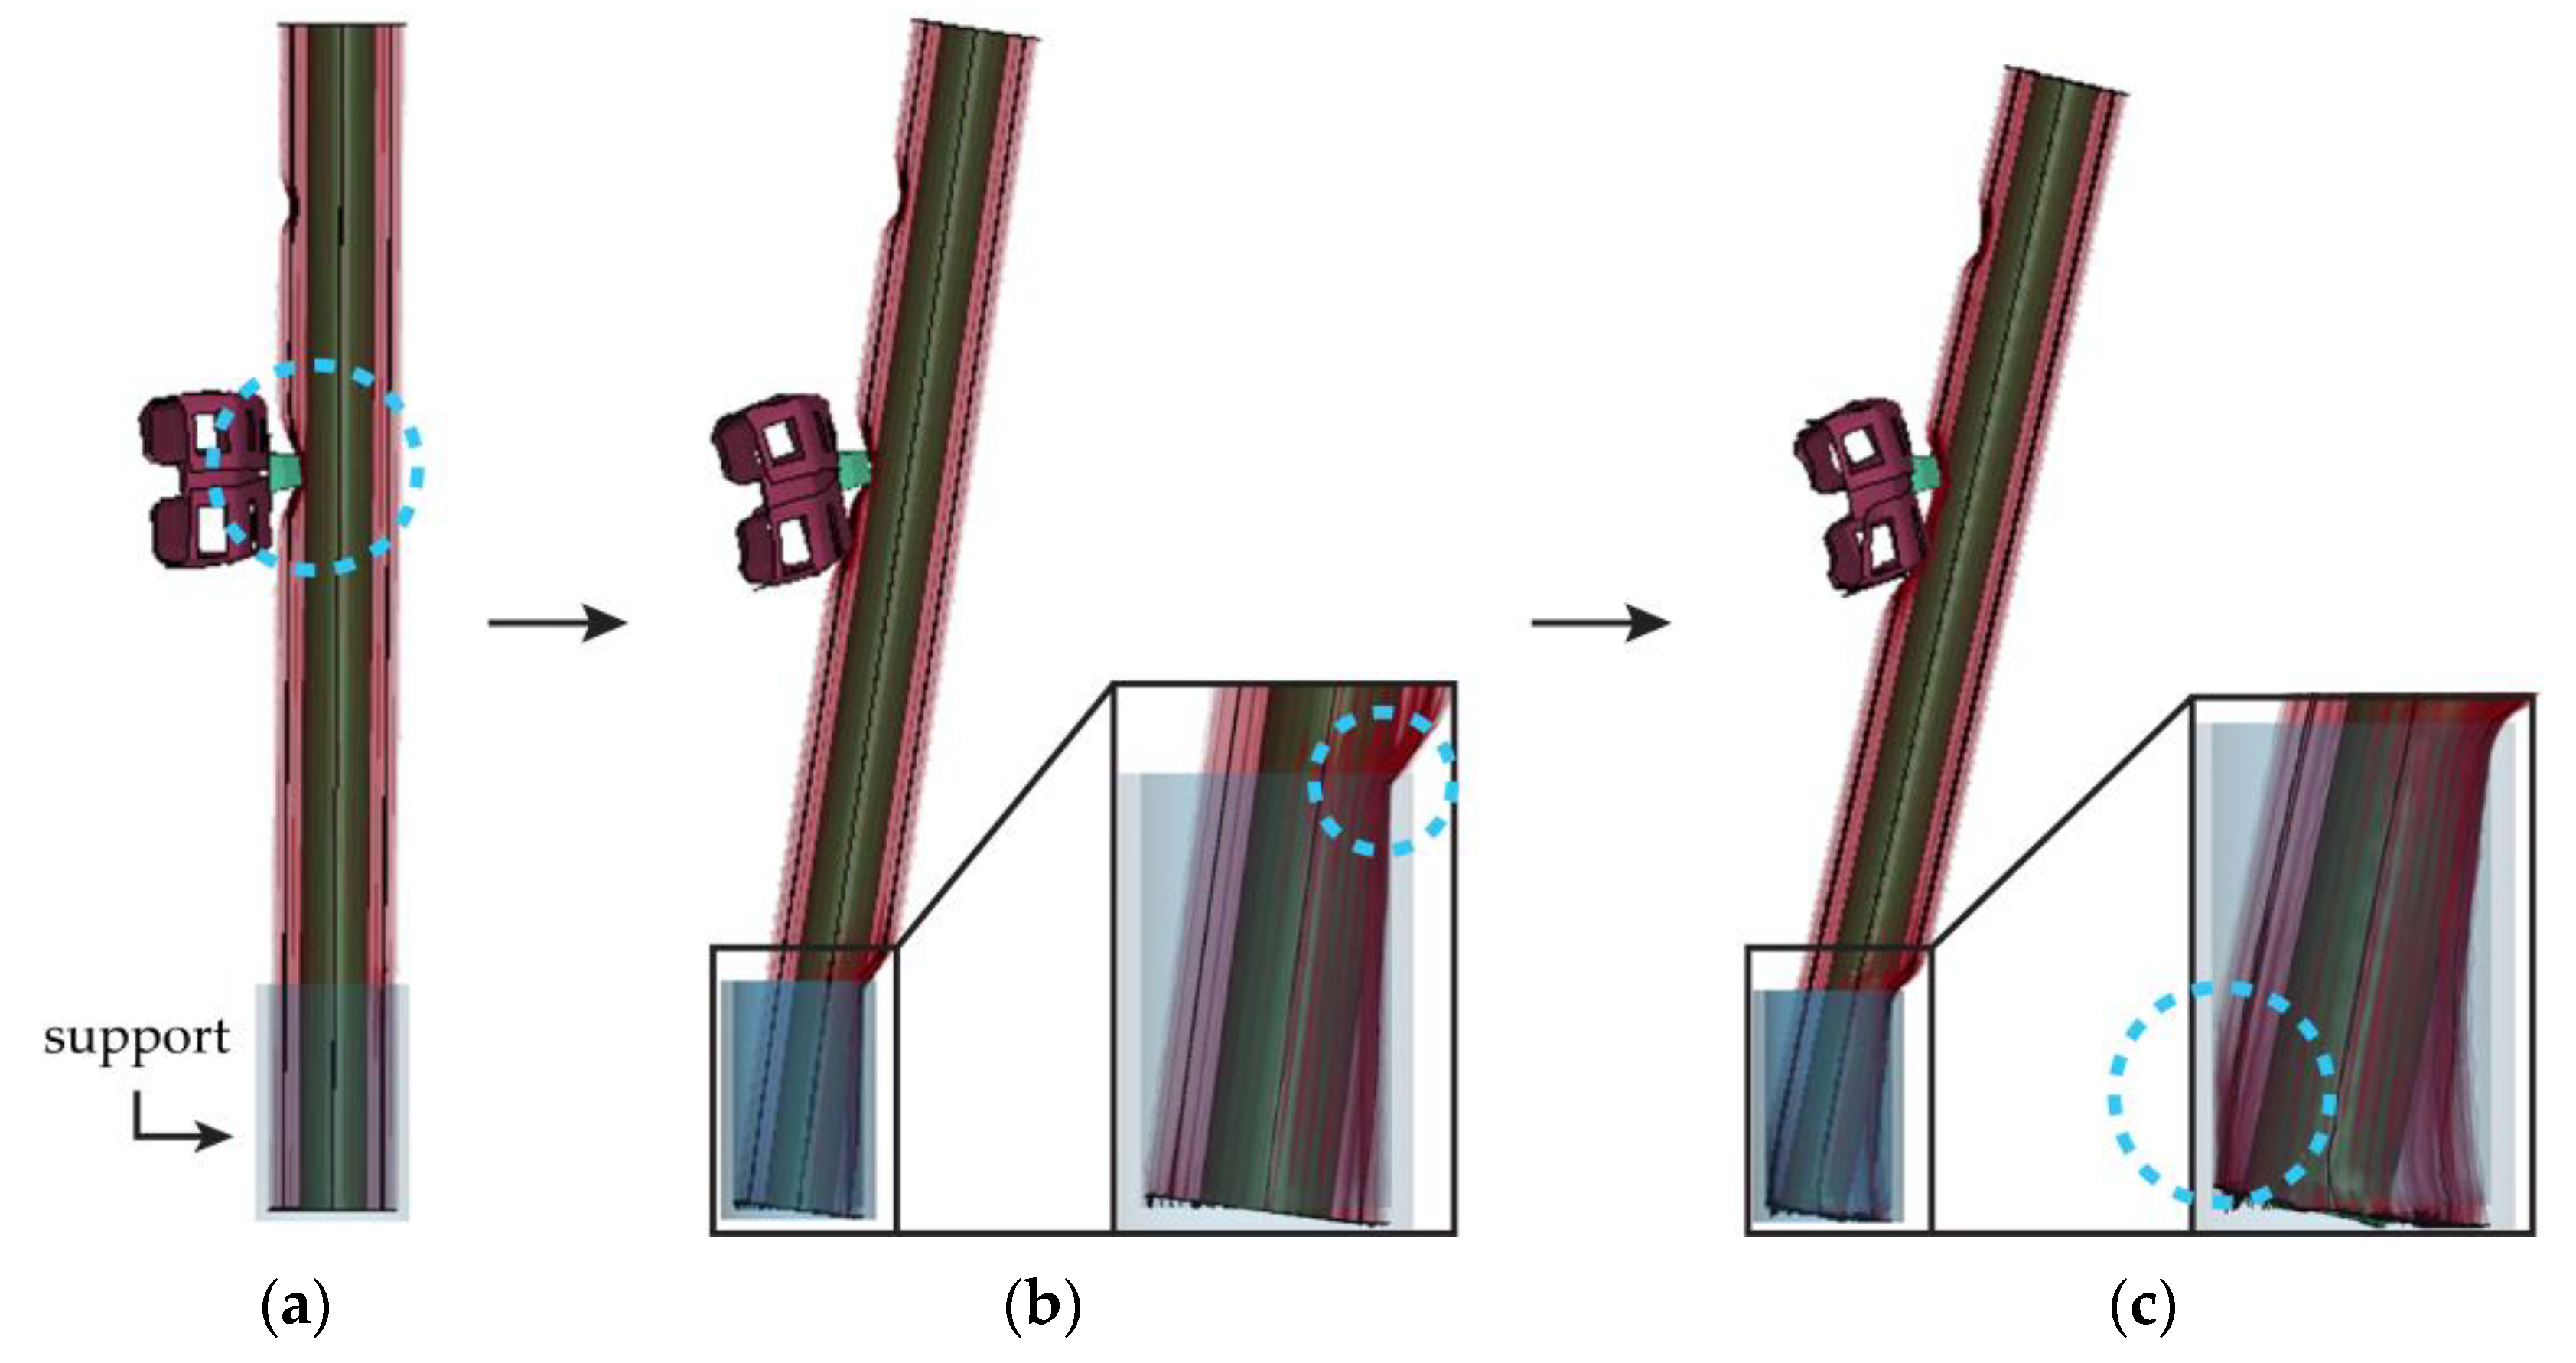
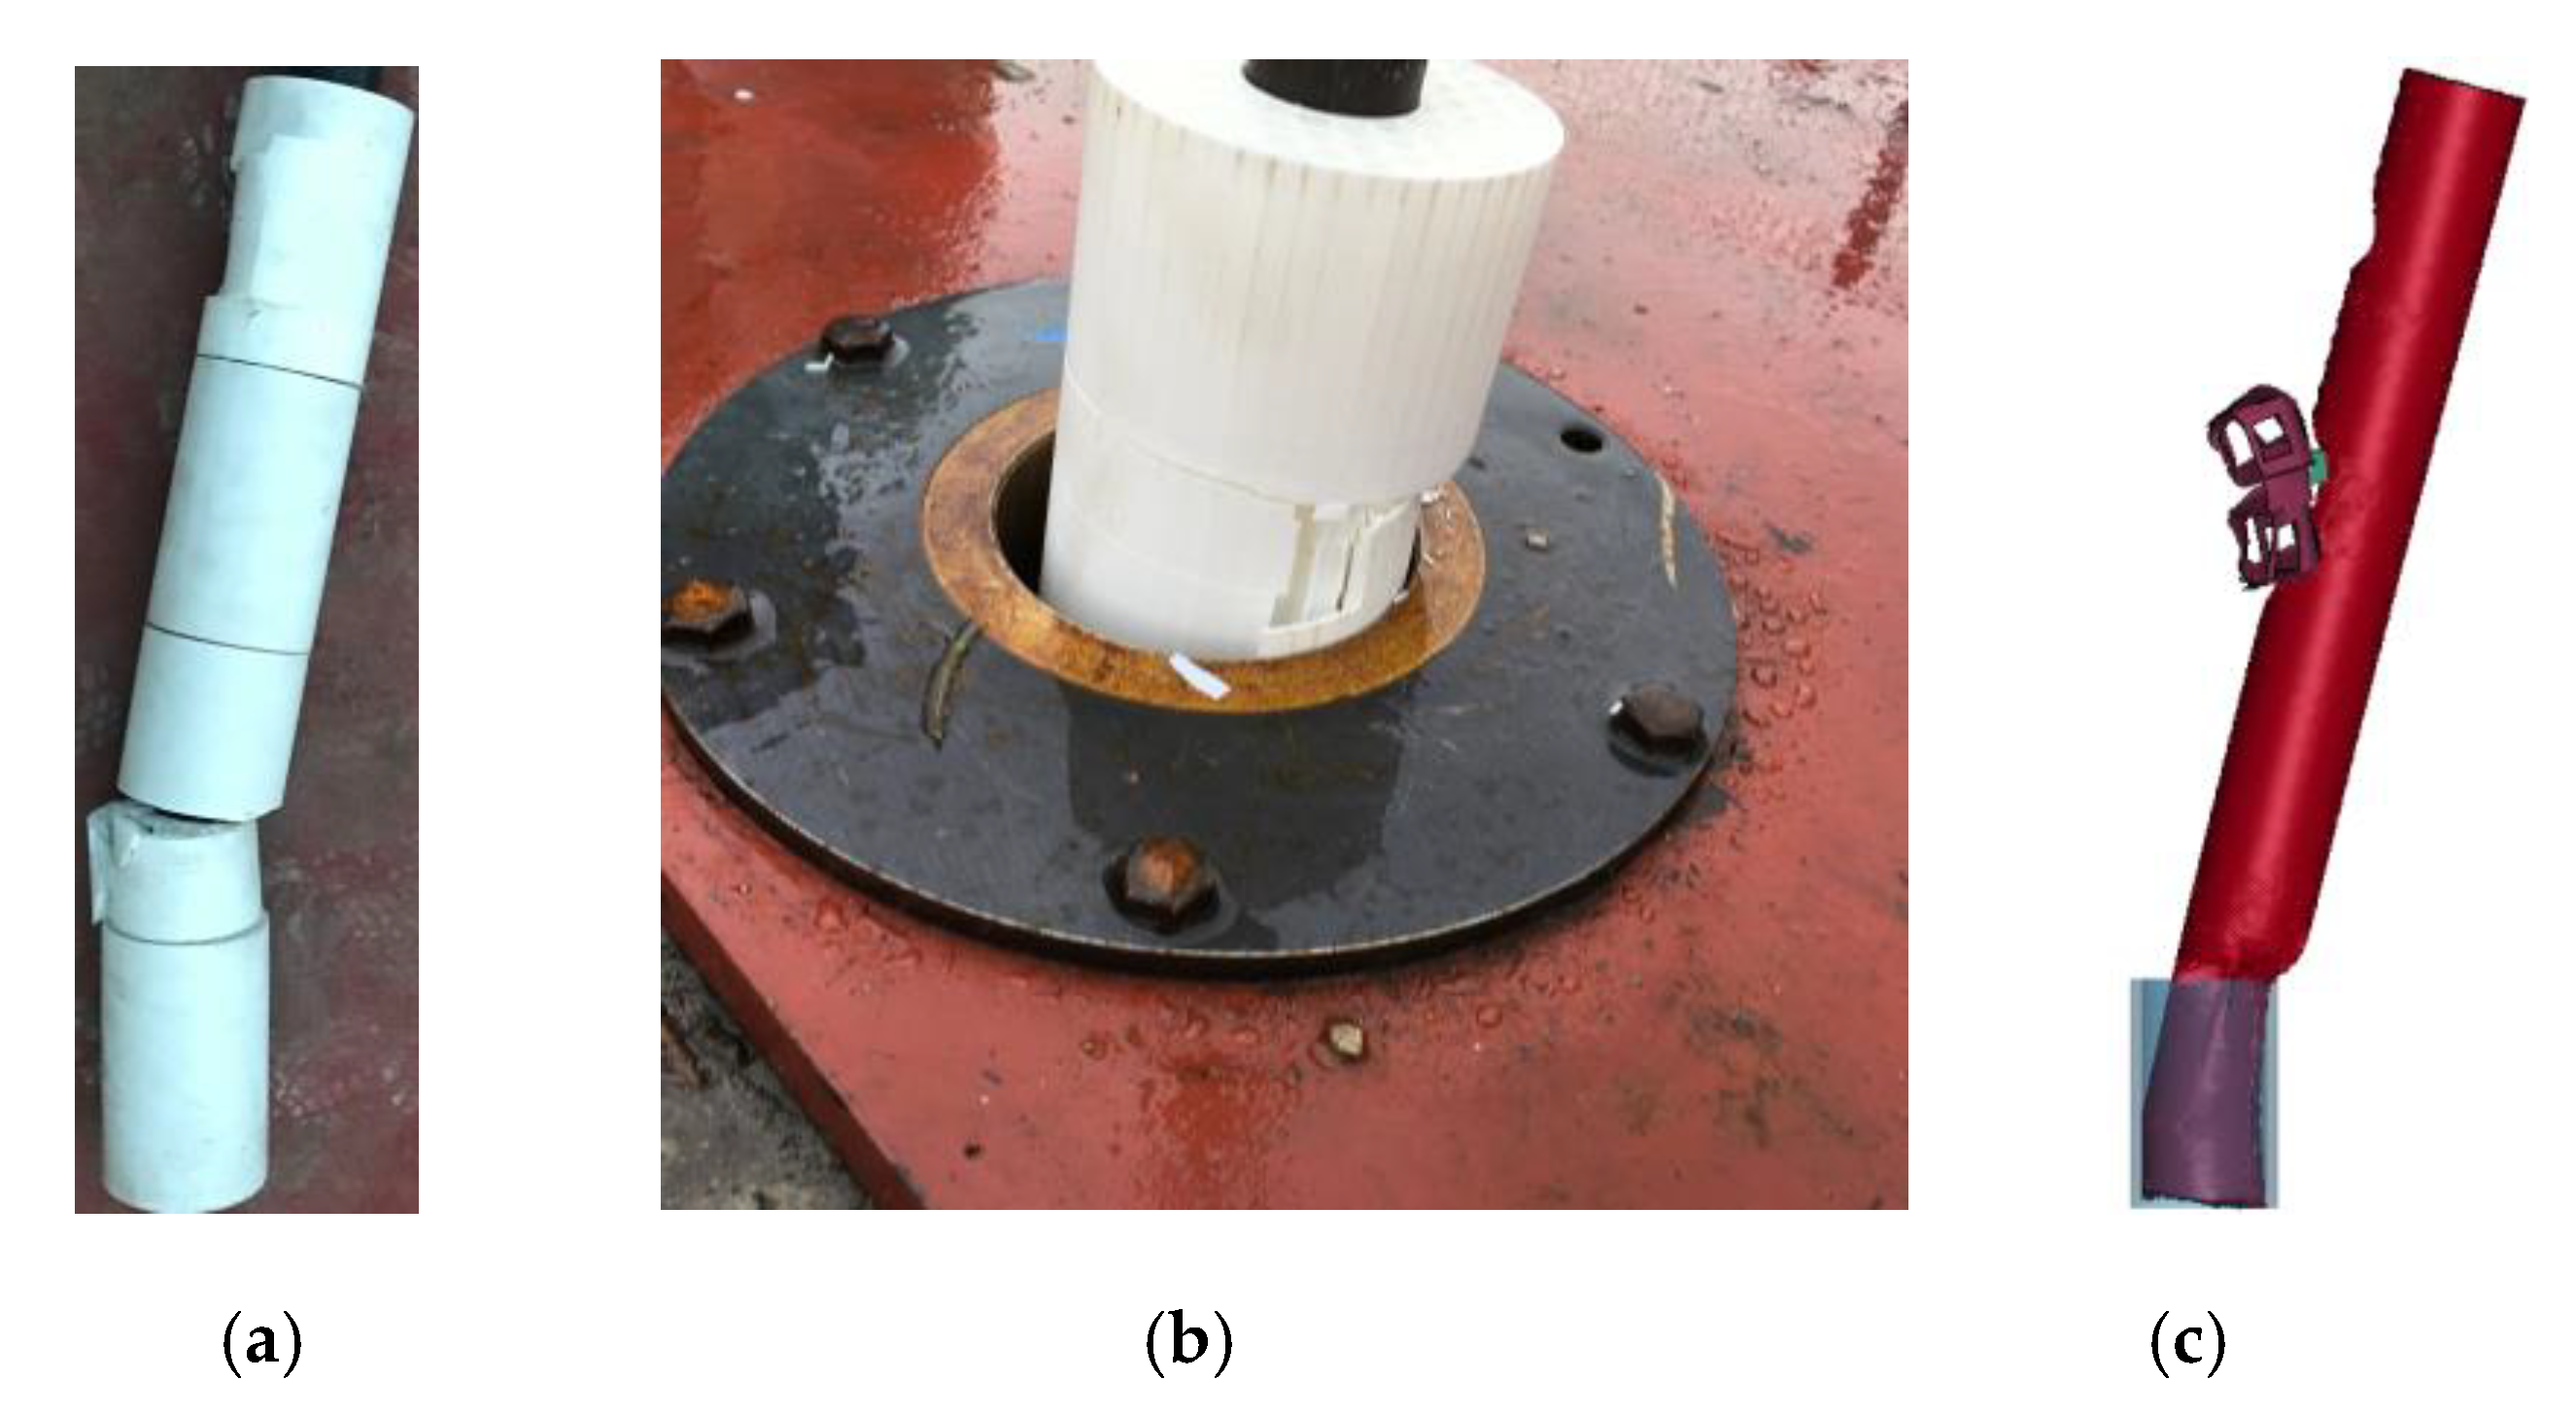
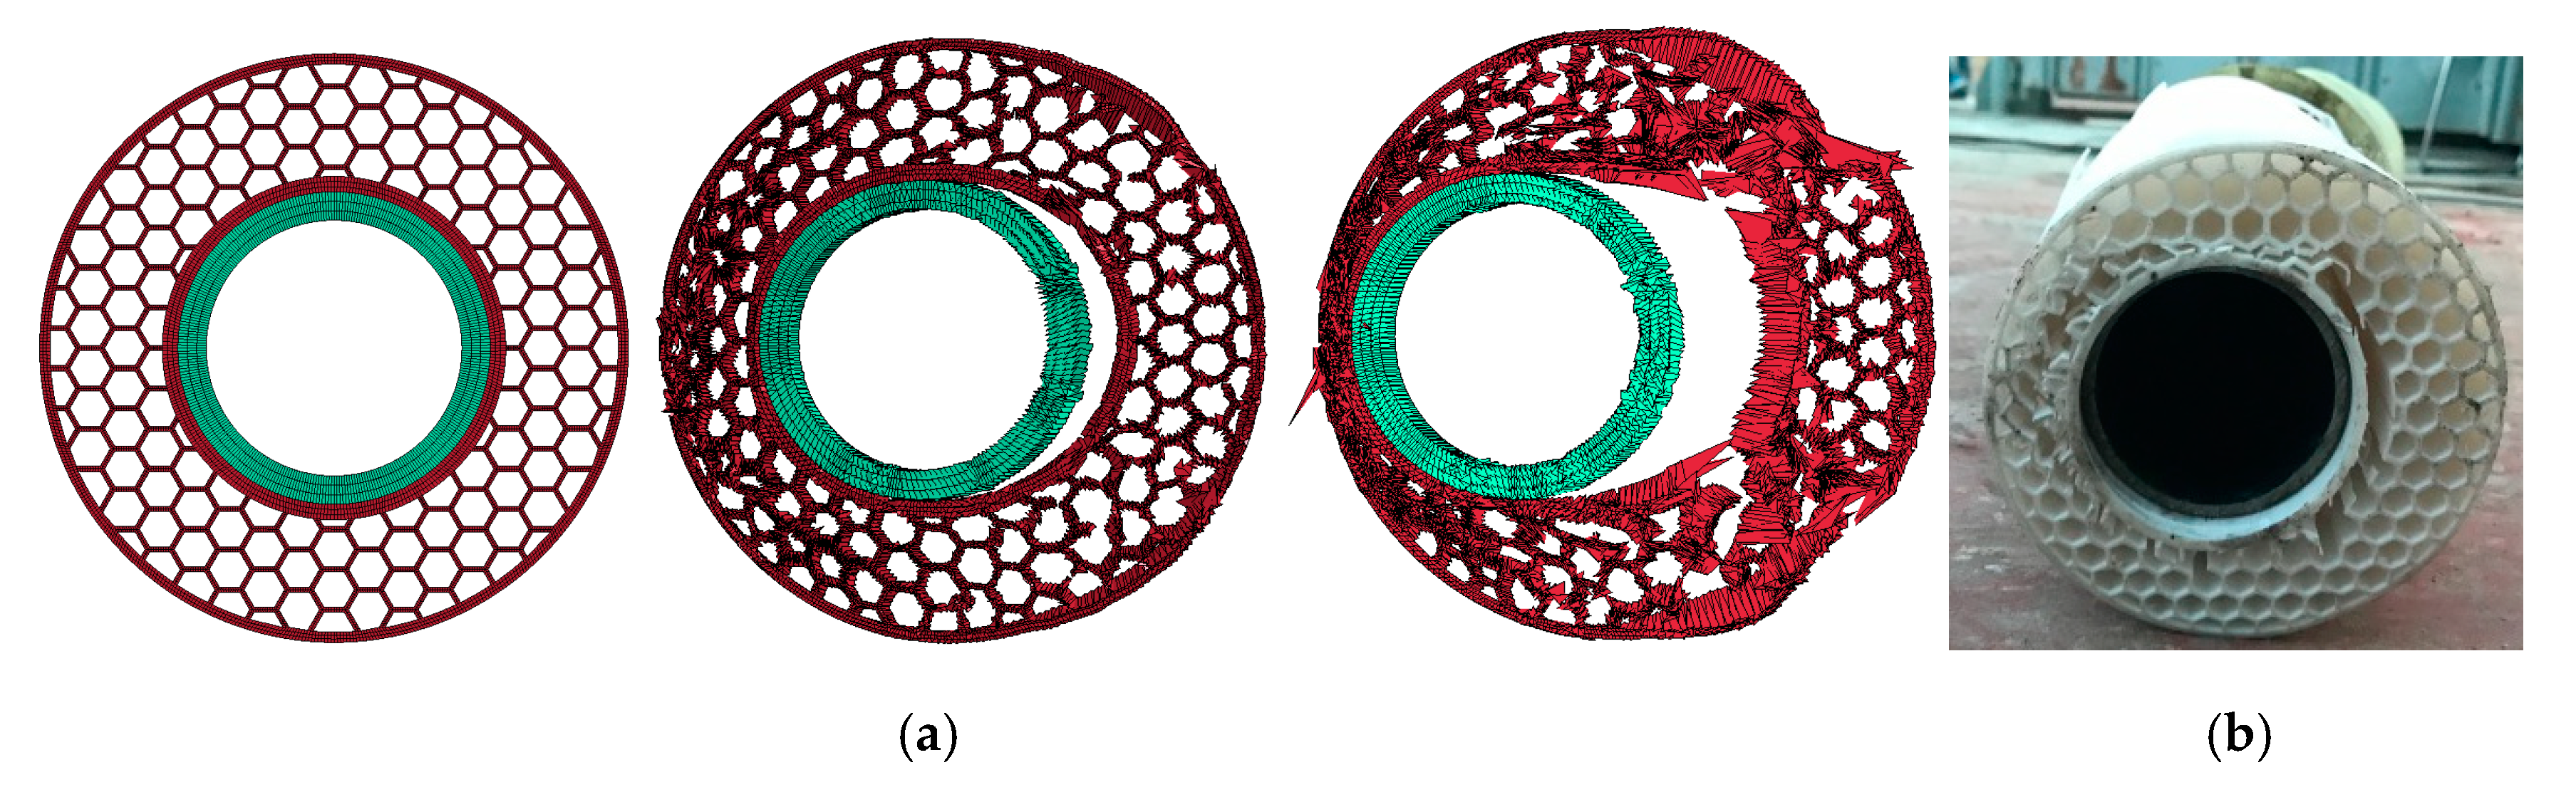
  • Vehicle-bollard collision tests against in-plane honeycomb bollards showed damages concentrated to three locations along the bollard—the front bumper contact point, base and support interfacing point, and the bollard bottom end. This coincides with the simulation results to further prove the consistency and reliability of the research results.
Vehicle-bollard collision tests against in-plane honeycomb bollards showed damage concentrated to three locations along the bollard-front bumper contact point, base and support interfacing point, and the bollard bottom end. This coincides with the simulation results to further prove the consistency and reliability of the research results.
It can be concluded from this research that the proposed in-plane honeycomb bollards can decrease damage to the vehicle and its occupants with its improved shock absorption capability compared to the conventional steel bollards. With the in-plane honeycomb units designed to be readily manufacturable with extruders, the honeycomb bollards can also be produced with minimal cost increase while bringing the benefit of reducing vehicle repair cost and medical bills for injured drivers and passengers. This research was also designed in a manner that other variants of the in-plane honeycomb units can be simulated, manufacture, and tested to further improve the shock absorption capability of proposed design in this paper.

Author Contributions

S.S. conducted a collision experiment to acquire data; K.K. supported the setting of the experimental equipment and conducted preliminary experiments; S.S. arranged and analyzed the acquired data; S.S. and K.K. analyzed the data and drafted the paper; C.B. discussed the results and contents to be reported and contributed to the revision and preparation of the submitted paper; W.Y. supervised and advised all parts in this paper. All authors have read and agreed to the published version of the manuscript.

Funding

This research was funded by the MSS (Ministry of SMEs and Startups) in the Republic of Korea.

Acknowledgments

This research was supported by Industry-University-Institute Cooperation Technology Development Project (2017) of the MSS (Ministry of SMEs and Startups) in the Republic of Korea.

Conflicts of Interest

The authors report no conflict of interest.

References

  1. Seon, S.W.; Yun, I.S.; Park, H.D.; Seon, B.S.; Lee, W. A Study on Shock Absorption Bollard using Honeycomb Geometry. Korean Soc. Precis. Eng. 2018, 2018, 537. [Google Scholar]
  2. Cha, E.H.; Jeon, D.J.; Han, S.E. Performance Evaluation and Proposal on Standard Establishment of the Bollard through Impact Analysis. J. Korean Assoc. Spat. Struct. 2016, 16, 59–66. [Google Scholar] [CrossRef]
  3. Ahn, J.S.; Oh, C.W. A Study on the Implementation of the Auditory Map for Blind People. Geogr. J. Korea 2014, 48, 573–584. [Google Scholar]
  4. Ministry of Land, Infrastructure and Transport. Act on Promotion of the Transportation Convenience of Mobility Disadvantaged Persons; Ministry of Land, Infrastructure and Transport: Sejong, Korea, 2019. [Google Scholar]
  5. Chen, L.; Xiao, Y.; Xiao, G.; Liu, C.; Agrawal, A. Test and numerical simulation of truck collision with anti-ram bollards. Int. J. Impact Eng. 2014, 75, 30–39. [Google Scholar] [CrossRef]
  6. National Counterterrorism Center. 2010 NCTC Report on Terrorism; National Counterterrorism Center: Washington, DC, USA, 2011. [Google Scholar]
  7. Kim, G.H.; Lee, O.S.; Park, I.S.; Kim, J.W.; Chung, T.Y.; Heo, S.J. Damageability, Repairability and Safety of Automobile at Low Speed Frontal and Rear Crash Test. Korean Soc. Automot. Eng. 1998, 5, 789–794. [Google Scholar]
  8. Deptula, L.; Noah, A. Assessing the Costs & Benefits of Effective Lightweighting Technologies. Cent. Automot. Res. 2015. Available online: http://www.cargroup.org/wp-content/uploads/2017/02/Assessing-the-Costs-Benefits-of-Effective-Lightweighting-Technologies.pdf (accessed on 30 March 2020).
  9. Mun, N. Activation of Automotive Replacement Auto-Parts. Auto J. 2019, 44–46. Available online: https://www.sae.org/standards/content/j1555_201910/ (accessed on 30 March 2020).
  10. Recommended Practice for Optimizing Automobile Damageability and Repairability. 2019. J1555_201910. Available online: https://www.sae.org/standards/content/j1555_201910/ (accessed on 30 March 2020).
  11. Lee, C.J.; Lee, S.B.; Ko, D.C.; Kim, B.M. Effect of Bead Shape in Aluminum Crash Box for Effective Impact Energy Absorption Under Low-Velocity Impact Condition. Trans. Korean Soc. Mech. Eng. 2012, 36, 1155–1162. [Google Scholar] [CrossRef]
  12. Yin, H.; Huang, X.; Scarpa, F.; Wen, G.; Chen, Y.; Zhang, C. In-plane crashworthiness of bio-inspired hierarchical honeycombs. Compos. Struct. 2018, 192, 516–527. [Google Scholar] [CrossRef] [Green Version]
  13. Tiwaria, G.; Thomasa, T.; Khandelwalb, R.P. Influence of reinforcement in the honeycomb structures under axial compressive load. Thin-Walled Struct. 2017, 126, 238–245. [Google Scholar] [CrossRef]
  14. Chawla, A.; Mukherjee, S.; Kumar, D.; Nakatani, T.; Ueno, M. Prediction of crushing behaviour of honeycomb structures. Int. J. Crashworthiness 2003, 8, 229–235. [Google Scholar] [CrossRef]
  15. Wang, H.; Lu, Z.; Yang, Z.; Li, X. A novel re-entrant auxetic honeycomb with enhanced in-plane impact resistance. Compos. Struct. 2019, 208, 758–770. [Google Scholar] [CrossRef]
  16. Kim, H.D.; Lee, H.H.; Park, J.S. Prediction to shock absorption energy of an aluminum honeycomb. J. Aeronaut. Space Sci. 2011, 39, 391–399. [Google Scholar] [CrossRef] [Green Version]
  17. Geng, X.; Liu, Y.; Zheng, W.; Wang, Y.; Li, M. Prediction of Crushing Response for Metal Hexagonal Honeycomb under Quasi-Static Loading. Shock Vib. 2018, 2018, 8043410. [Google Scholar] [CrossRef]
  18. Gibson, L.J.; Ashby, M.F. Cellular Solids: Structure and Properties, 2nd ed.; Cambridge University Press: Cambridge, UK, 1997. [Google Scholar]
  19. Bonanno, A.; Crupi, V.; Epasto, G.; Guglielmino, E.; Palomba, G. Aluminum honeycomb sandwich for protective structures of earth moving machines. Procedia Struct. Integr. 2018, 8, 332–344. [Google Scholar] [CrossRef]
  20. Said, M.R.; Reddy, T. Quasi-static response of laterally simple compressed hexagonal rings. Int. J. Crashworthiness 2002, 7, 345–364. [Google Scholar] [CrossRef]
  21. Lee, J.-H.; Kim, J.-S.; Lee, S.-J.; Cheon, S.-K. A Study on the Impact Characteristics of honeycomb Sandwich Panels for the Hybrid Composite Train Bodyshell. Korean Soc. Mech. Eng. 2006, 2635–2639. [Google Scholar]
  22. Rebelo, H.; Lecompte, D.; Cismasiu, C.; Jonet, A.; Belkassem, B.; Maazoun, A. Experimental and numerical investigation on 3D printed PLA sacrificial honeycomb cladding. Int. J. Impact Eng. 2019, 131, 162–173. [Google Scholar] [CrossRef]
  23. Tran, J.P.; Linforth, S.; Ngo, T.; Lumantarna, R.; Nguyen, K. Design Analysis of Hybrid Composite Anti-ram Bollard Subjected to Impulsive Loadings. Compos. Struct. 2018, 189, 568–613. [Google Scholar] [CrossRef]
  24. Khan, J.G.; Dalu, R.S.; Gadekar, S.S. Defects in Extrusion Process and Their Impact on Product Quality. Int. J. Mech. Eng. Robot. Res. 2014, 3, 187–194. [Google Scholar]
  25. NIIR Board of Consultants & Engineers. The Complete Technology Book on Plastic Extrusion, Moulding and Mould Designs; NIIR: Moscow, Russia, 2017. [Google Scholar]
  26. Du Bois, J.H.; Du Bois, P. A Study in Mass Scaling for Sheet Metal Forming with LS-DYNA. In Proceedings of the 15th International LS-DYNA Users Conference, Detroit, MI, USA, 10–12 June 2018. [Google Scholar]
  27. Heimbs, S. Virtual testing of sandwich core structures with LS-Dyna. In Proceedings of the 26th CADFEM Users’ Meeting, Darmstadt, Germany, 22–24 October 2008. [Google Scholar]
  28. Chunke, L.; Xinping, S.; Jiao, W. Simulation Analysis of Car Front Collision Based on LS-DYNA and Hyper Works. J. Trans. Technol. 2014, 4, 337–342. [Google Scholar] [CrossRef] [Green Version]
Figure 1. Cell deformations by cell wall bending and rotation in plastic collapses.
Applsci 10 03014 g001
Figure 2. Honeycomb Unit Designs and Compressions Tests Pictures: (a) Honeycomb modeling; (b) In-plane direction compression test; (c) Compressed specimen showing results.
Applsci 10 03014 g002
Figure 3. Load displacement curves for various honeycomb cell wall length (l) and thickness (t).
Applsci 10 03014 g003
Figure 4. Comparisons of Honeycomb Compression Experiment and Simulation: (a) Experimental results of a Honeycomb specimen; (b) Simulation results of a Honeycomb specimen.
Applsci 10 03014 g004
Figure 5. Comparison of internal structure: (a) Conventional steel bollard; (b) Bollard with Honeycomb.
Applsci 10 03014 g005
Figure 6. LS-DYNA simulation settings.
Applsci 10 03014 g006
Figure 7. Maximum deformation of collision between vehicle and bollard; (a) steel bollard; (b) honeycomb 20 MPa bollard.
Applsci 10 03014 g007
Figure 8. Simulated acceleration evolutions at the front bumper frame: arrows indicate the estimated three local acceleration peaks of honeycomb bollard.
Applsci 10 03014 g008
Figure 9. Simulated acceleration evolutions at the B-pillar.
Applsci 10 03014 g009
Figure 10. Simulated displacements of steel and in-plane honeycomb bollards.
Applsci 10 03014 g010
Figure 11. Simulation of in-plane honeycomb unit damage sequence: (a) at the initial impact; (b) honeycomb unit on the backside starts collapsing; (c) honeycomb unit at the bottom front side starts collapsing.
Applsci 10 03014 g011
Figure 12. Manufacturing of in-plane honeycomb units with a three-dimensional (3D) printer.
Applsci 10 03014 g012
Figure 13. Assembly of bollards with honeycomb and pipes; (a) Honeycomb processing; (b) Bollard Assembly.
Applsci 10 03014 g013
Figure 14. Schematic of the experiment.
Applsci 10 03014 g014
Figure 15. Numerical model for collision of vehicle.
Applsci 10 03014 g015
Figure 16. Test vehicle for collision and gyro sensor.
Applsci 10 03014 g016
Figure 17. Pictures of an actual collision test with in-plane honeycomb bollard: (a) the immediate collision; (b) maximum deformation; (c) falling.
Applsci 10 03014 g017
Figure 18. Pictures of an actual collision test with steel bollard: (a) the immediate collision; (b) maximum deformation; (c) falling.
Applsci 10 03014 g018
Figure 19. Acceleration of front bumper frame with gyro sensor and numerical result.
Applsci 10 03014 g019
Figure 20. Result of collision with steel bollard: (a) Collision with honeycomb bollard; (b) Collision with steel bollard; (c) Disassembled vehicle after collision with steel bollard.
Applsci 10 03014 g020
Figure 21. Damaged honeycomb bollard pictures: (a) Honeycomb unit damage; (b) Internal pipe deformation; (c) Simulation results.
Applsci 10 03014 g021
Figure 22. Comparison of bottom honeycomb unit and damaged honeycomb simulation: (a) Simulation results; (b) Collision test results.
Applsci 10 03014 g022
Table 1. Specification of polylactic acid (PLA) and Steel.
ItemUnitPLASteel
Density kg/m312527830
Young’s ModulusPa3.5 × 10+092.07 × 10+11
Poisson’s Ratio-0.360.33
Bulk ModulusPa4.17 × 10+09-
Shear ModulusPa1.287 × 10+09-
Table 2. Maximum accelerations of the front bumper and the B-pillar for the simulated vehicle-bollard collisions.
Yield Stress (MPa)Front Bumper Frame Maximum Acceleration (m/s2)B-Pillar Maximum Acceleration (m/s2)
Steel Bollard2151.037 × 10+33.44 × 10+1
Honeycomb Bollard100.701 × 10+33.16 × 10+1
200.388 × 10+32.99 × 10+1
300.481 × 10+33.19 × 10+1
400.550 × 10+33.25 × 10+1

