Complex Network Characterization Using Graph Theory and Fractal Geometry: The Case Study of Lung Cancer DNA Sequences


1
Faculty of Information Studies, 8000 Novo mesto, Slovenia
2
Faculty of Computer and Information Science, University of Ljubljana, 1000 Ljubljana, Slovenia
3
Department of Electric, Electronics and Computer Engineering, University of Catania, 95125 Catania, Italy
*
Author to whom correspondence should be addressed.
Appl. Sci. 2020, 10(9), 3037; https://doi.org/10.3390/app10093037
Submission received: 19 March 2020
/
Revised: 18 April 2020
/
Accepted: 20 April 2020
/
Published: 27 April 2020
(This article belongs to the Special Issue Signal Processing and Machine Learning for Biomedical Data)
Abstract
:This paper discusses an approach developed for exploiting the local elementary movements of evolution to study complex networks in terms of shared common embedding and, consequently, shared fractal properties. This approach can be useful for the analysis of lung cancer DNA sequences and their properties by using the concepts of graph theory and fractal geometry. The proposed method advances a renewed consideration of network complexity both on local and global scales. Several researchers have illustrated the advantages of fractal mathematics, as well as its applicability to lung cancer research. Nevertheless, many researchers and clinicians continue to be unaware of its potential. Therefore, this paper aims to examine the underlying assumptions of fractals and analyze the fractal dimension and related measurements for possible application to complex networks and, especially, to the lung cancer network. The strict relationship between the lung cancer network properties and the fractal dimension is proved. Results show that the fractal dimension decreases in the lung cancer network while the topological properties of the network increase in the lung cancer network. Finally, statistical and topological significance between the complexity of the network and lung cancer network is shown.
1. Introduction
Theoretical models on complex networks have assumed a key role in numerous disciplines, ranging from computer science, physics, sociology, engineering, and medicine, to molecular, population biology, and deoxyribonucleic acid (DNA) sequences analysis [1,2]. In the classical conception of DNA geometry, the double helix represents a ribbon constructed from smooth curves describing an idealized structure. How to read and recognize the primary structure of a DNA sequence seems to be a fundamental problem. In recent years, DNA sequencing and fragment assembly have received a much more specific attention for improving the reconstruction of full strands of DNA focused on the pieces of data to record. Fragment assembly due to imperfect data sets constitutes one of the most interesting challenges for researchers. In this paper, the concept of graph theory and fractal geometry are proposed a particular way of analyzing DNA sequences and their properties. Many scientific papers [3] dealing with DNA sequences analysis [4] have been published. However, the main aim of the work is to outline the advantage of applying graph theory and fractals in the study of lung cancer DNA sequences. This application allows the existence of hidden geometries to be shown, which can help underline more clearly the structure of a DNA sequence. An important consideration of this research is that this geometry has fractal structures. In order to achieve this goal, some basic steps must be observed, and they are indicated as follows: (1) Converting DNA nucleotides into a new coordinate system; (2) presenting DNA nucleotides as a path in a graph in the new coordinate system; (3) connecting points into a continuous graph; (4) using a method for estimating the Hurst exponent H; (5) using fractal geometry to determine the complexity of the graph; (6) constructing visibility graphs; and (7) calculating statistical and topological properties of the DNA network.
In this perspective, this paper introduces an initial presentation of the concepts of graph theory, fractals, and pattern recognition for their possible use in the calculation of statistical and topological properties of the DNA network and the characterization of DNA sequences in lung cancer.
The study of graph theory [5,6] was much elaborated in the twentieth century when the use of modeling techniques was implemented, and it has grown significantly to be routinely applied in various branches of science and engineering. Obviously, as special applications have multiplied in number and scope, the theory has developed considerably. It is known in mathematics that through graphs, complex relationships between many objects are commonly modelled. It is right to state that a graph is defined by a connection of nodes (also known as vertices) and edges. As an abstract data point, a node could represent anything, like nucleotides of DNA sequences. The application of mathematics to systems (such as a database of DNA sequences) with a large number of vertices and edges seems possible now as computers can be effectively adopted to provide solutions to such large graphs.
Fractals [7,8,9,10] are complex patterns occurring with self-similarly across different scales characterized by a fractal dimension. As mathematical descriptions of natural shapes, they become models generated by equations resulting in chaotic systems. In mathematical visualization, they are created from simple patterns that continue repeating over and over in a recursive process whose irregularity is very difficult to be described using classical geometry. Fractals can be thought of as images of dynamic systems. What makes fractal geometry more interesting for many scientists is its useful application in medicine, biology, and geology. In biology, chaotic systems can be used to show the rhythms of heartbeats, walking strides, and even the biological changes of aging. Fractals can be used to model the structures of nerve networks, circulatory systems, lungs, and even DNA [11]. Fractal geometry has been demonstrated to be a powerful tool for solving important problems in applied science [12]. Much more physical fractal systems are being rapidly known. The use of concepts of fractal geometry in life sciences has contributed significantly to understanding the complexity and topological properties of networks that characterize DNA sequences.
Pattern recognition [13] involves the evolution of systems that are oriented to find a solution to a given problem by using a set of example instances represented by a number of features. Statistical pattern recognition basically treats the problem of the automatic identification of objects belonging to one of the possible classes. Pattern recognition, dealing with identifying regularities in data with algorithms that learn to solve a problem using a limited set of measurement data, is closely related to informatics education. Statistical DNA pattern recognition is a technique based on finding genetic code in the DNA sequence and has applications in forensics, genetic engineering [14], bioinformatics [15], DNA nanotechnology, history, and so on.
Hypoxia-inducible factor 1α (HIF1A) [16] is the master transcriptional regulator of the cellular and systemic homeostatic response to hypoxia ruling the execution of the program that makes cells capable of running hypoxic stress [17]. As a protein-coding gene, HIF1A is the oxygen-sensitive subunit of the hypoxia-inducible factor (HIF), which, active under hypoxic conditions, plays an essential role in tumors. It functions by mediating transcription of over 40 genes involved in survival, glucose metabolism, invasion, metastasis, and angiogenesis (e.g., VEGF). Two subunits constitute the hypoxia-inducible factor 1 (HIF1) transcription factor as a heterodimer: Hypoxia-inducible factor 1, α subunit (basic helix-loop-helix transcription factor) (HIF1A/HIF-1α), and aryl hydrocarbon receptor nuclear translocator (ARNT/HIF-1β) 1,2; though, during ongoing synthesis, the HIF1A protein degrades swiftly by the ubiquitin-proteasome system under normal oxygen concentrations (normoxia) [18]. An adaptive response is driven to hypoxia by activating the expression of genes in which regulate erythropoiesis, angiogenesis, and glycolysis [19]. HIF1 is overexpressed in several cancers, often connected to poor prognosis, and is considered an interesting target for pharmacological manipulation [20,21,22].
Globally, lung cancer [23] has shown to be one of the most common types of cancer since 1985, in relation to incidence and mortality rates. Basically, two general types of lung cancer are recognized and are classified as non-small cell lung cancer (NSCL) [24,25,26,27,28,29,30] and small cell lung cancer (SCLC). They start growing in the lungs: The most common type is NSCL, while SCLC grows and spreads faster than NSCL. The first application of massively parallel sequencing in lung cancer research was published in 2008; most recently, an examination of paired NSCLC and normal lung tissue from a never-smoking patient with adenocarcinoma by [31].
Hypermethylation of cytosine guanine (CpG) islands [32] located in the promoter regions of tumor suppressor genes is now assumed as an important mechanism for gene inactivation. CpG island hypermethylation has resulted in almost every tumor type. Before 1994, CpG island promoter hypermethylation was conceived as a mechanism to inactivate genes in cancer fully restored as a result of the discovery that the von Hippel–Lindau (VHL) gene also undergoes methylation-associated inactivation [33].
Therefore, in this study, the application of a novel method is proposed, focusing on network and graph theory, fractal geometry, and statistical pattern recognition, to define the prognostic value of HIF-1α expression in surgically treated lung cancer patients. The paper is structured into four sections, excluding the introduction: In the second section, the proposed method is illustrated, providing a definition of the selected concepts considered as useful tools for the analysis of DNA sequences in relation to the carcinoma of the lung; in Section 3, the results obtained in terms of the main differences of the topological and statistical properties between lung cancer and non-cancer DNA networks are presented; Section 4 is a discussion on the functional role of HIF1A with respect to the connection between networks and fractals in DNA sequencing; and, finally, the conclusions of this study are provided.
2. Methodology
The approach that has orientated the development of this method focuses on the interaction between some theoretical concepts and assumptions that we consider relevant to treat the case of carcinoma of the lung. This section is thus divided into five subsections where these concepts are discussed. In the first subsection, we present carcinoma of the lung. In Section 2.2, a definition of the basic notions of graph theory and fractal geometry is provided. In Section 2.3, we describe the proposed method for DNA sequencing, which is based on the graph theory and fractal geometry. Section 2.4 presents statistical DNA pattern recognition. The topological properties of DNA graphs are also presented. The last section concerns data Preparation–Application using DNA data from the Homo sapiens HIF1A base.
2.1. Carcinoma of the Lung
Carcinoma of the lung is the leading cause of cancer death worldwide. Hypermethylation of CpG islands in the promoter regions of genes easily occurs in lung cancer, as shown by investigating the methylation status of over 40 genes from lung cancer tumors, cell lines, patient sputum, and/or serum. A problematic issue will be to harness the power of methylation signatures, which involves recognizing possible markers, the testing of these markers through case-control association studies and prospective trials [34], and developing statistical tools for the analysis of complex methylation data [35]. The fact that lung cancer is a heterogeneous disease implies that effective lung cancer biomarkers will probably require patient-specific molecular defects, clinical characters, and elements of the tumor microenvironment to be addressed. In [36], many emerging clinical bioinformatics-based strategies were studied specifically related to lung cancer. In [37], authors suggested a new model based on epigenomics data with the aim of predicting transcriptome-level differential gene expression in lung cancers. Dropping-off feature sets by data type show that CpG methylation features have a significant role in the prediction. In eukaryotic cells, the DNA methylation figures at the 5′ carbon position of the cytosine residue in the cytosine guanine (CpG) dinucleotide context. In [38], authors developed a computational model to detect those CpG islands that are methylated in colon cancer and unmethylated in normal cells, respectively. They created a highly accurate prediction model for those CpG islands where methylation differentiation is involved in colon cancer, which was assessed by using extensive cross-validation and generalization testing experiments. In [39], authors integrated the ordering networks, classification information, and pathway database to develop the topology-based pathway analysis for identifying cancer class-specific pathways, which might be essential in the biological significance of cancer. In our research, we present a new method using a hybrid system of two mathematical disciplines of fractal geometry and network theory. With a new topology classification and a new approach to determining complexity by using fractal geometry of a DNA network, we can accurately distinguish lung cancer DNA sequences from non-cancer DNA sequences.
2.2. Graph Theory and Fractal Geometry
First, let us introduce a few concepts from graph theory. A graph G = (V, E) consists of a set V of nodes (or vertices) and a set E of edges between these nodes, where each edge is an unordered pair of nodes. The number of nodes in a graph is the size of the graph. Nodes that are connected by edges are called neighbors and the number of neighbors a node has is called a node degree. We denote with N(v) the neighbors of v and with d(v) = |N(v)| the degree of the node v. Graphs are the main objects studied in graph theory.
In practice, graphs represent some real-life objects and relations within them. Statistical properties of the graph are often also calculated, such as the clustering coefficient, which measures how much nodes tend to cluster together. For a graph G = (V, E), the local clustering coefficient of a node v is defined as
and the global clustering coefficient of a graph as defined by Watts and Strogatz is a network average clustering coefficient, i.e.,
Now, let us introduce a field of fractal geometry, which is a branch of geometry that studies fractals. It offers a plethora of tools for describing and predicting natural phenomena by exploiting iterated mathematical concepts, such as complex number fractals, iterated function systems, and cellular automata. Perhaps, two of the most well-known complex number fractals are Julia and Mandelbrot sets. The latter is described by the recursive formula,
where and is an initial complex number; here, i denotes the imaginary unit.
Repeating the calculation of and observing the values result in a fractal. In particular, the is observed whether it remains near the origin or escapes to infinity. We say that a point c is a member of the Mandelbrot set if it remains near the origin. The process may be repeated for every point in the complex plane. Moreover, it is often graphically represented by coloring the points depending on the result. Such representations exhibit one of the main properties of fractals, namely, self-similarity.
Another important property of fractals is their fractal dimension, which describes the capacity of the fractal pattern to fill the space where the fractal scales differently from the space it is embedded in. It is common that a fractal exhibits a non-integer fractal dimension.
One way to calculate a fractal dimension D is by relating it to the Hurst exponent H; in particular, D = 2 − H. The Hurst exponent is defined for a time series as
where R(n) is the range of the first n cumulative deviations from the mean, S(n) is their standard deviation, n is the time span of the observation, and C is a constant.
2.3. A New Method for DNA Sequencing
We have different base DNA sequences. For example, the coding sequences of the first exon of the β-globin gene of Human (Homo sapiens) (92 bases) is:
ATGGTGCACCTGACTCCTGAGGAGAAGTCTGCCGTTACTGCCCTGTGGGGCAAGGTGAACGTGGAGTAAGTTGGTGGTGAGGCCCTGGGCAG
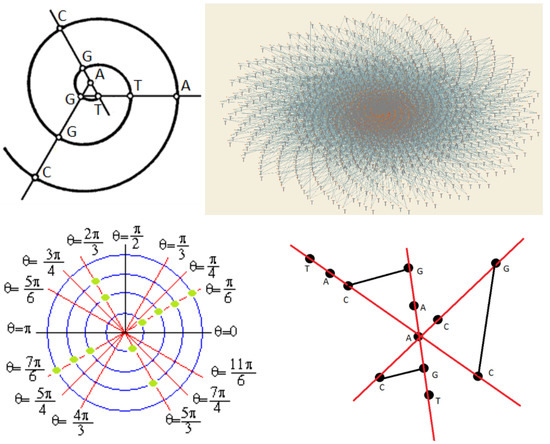
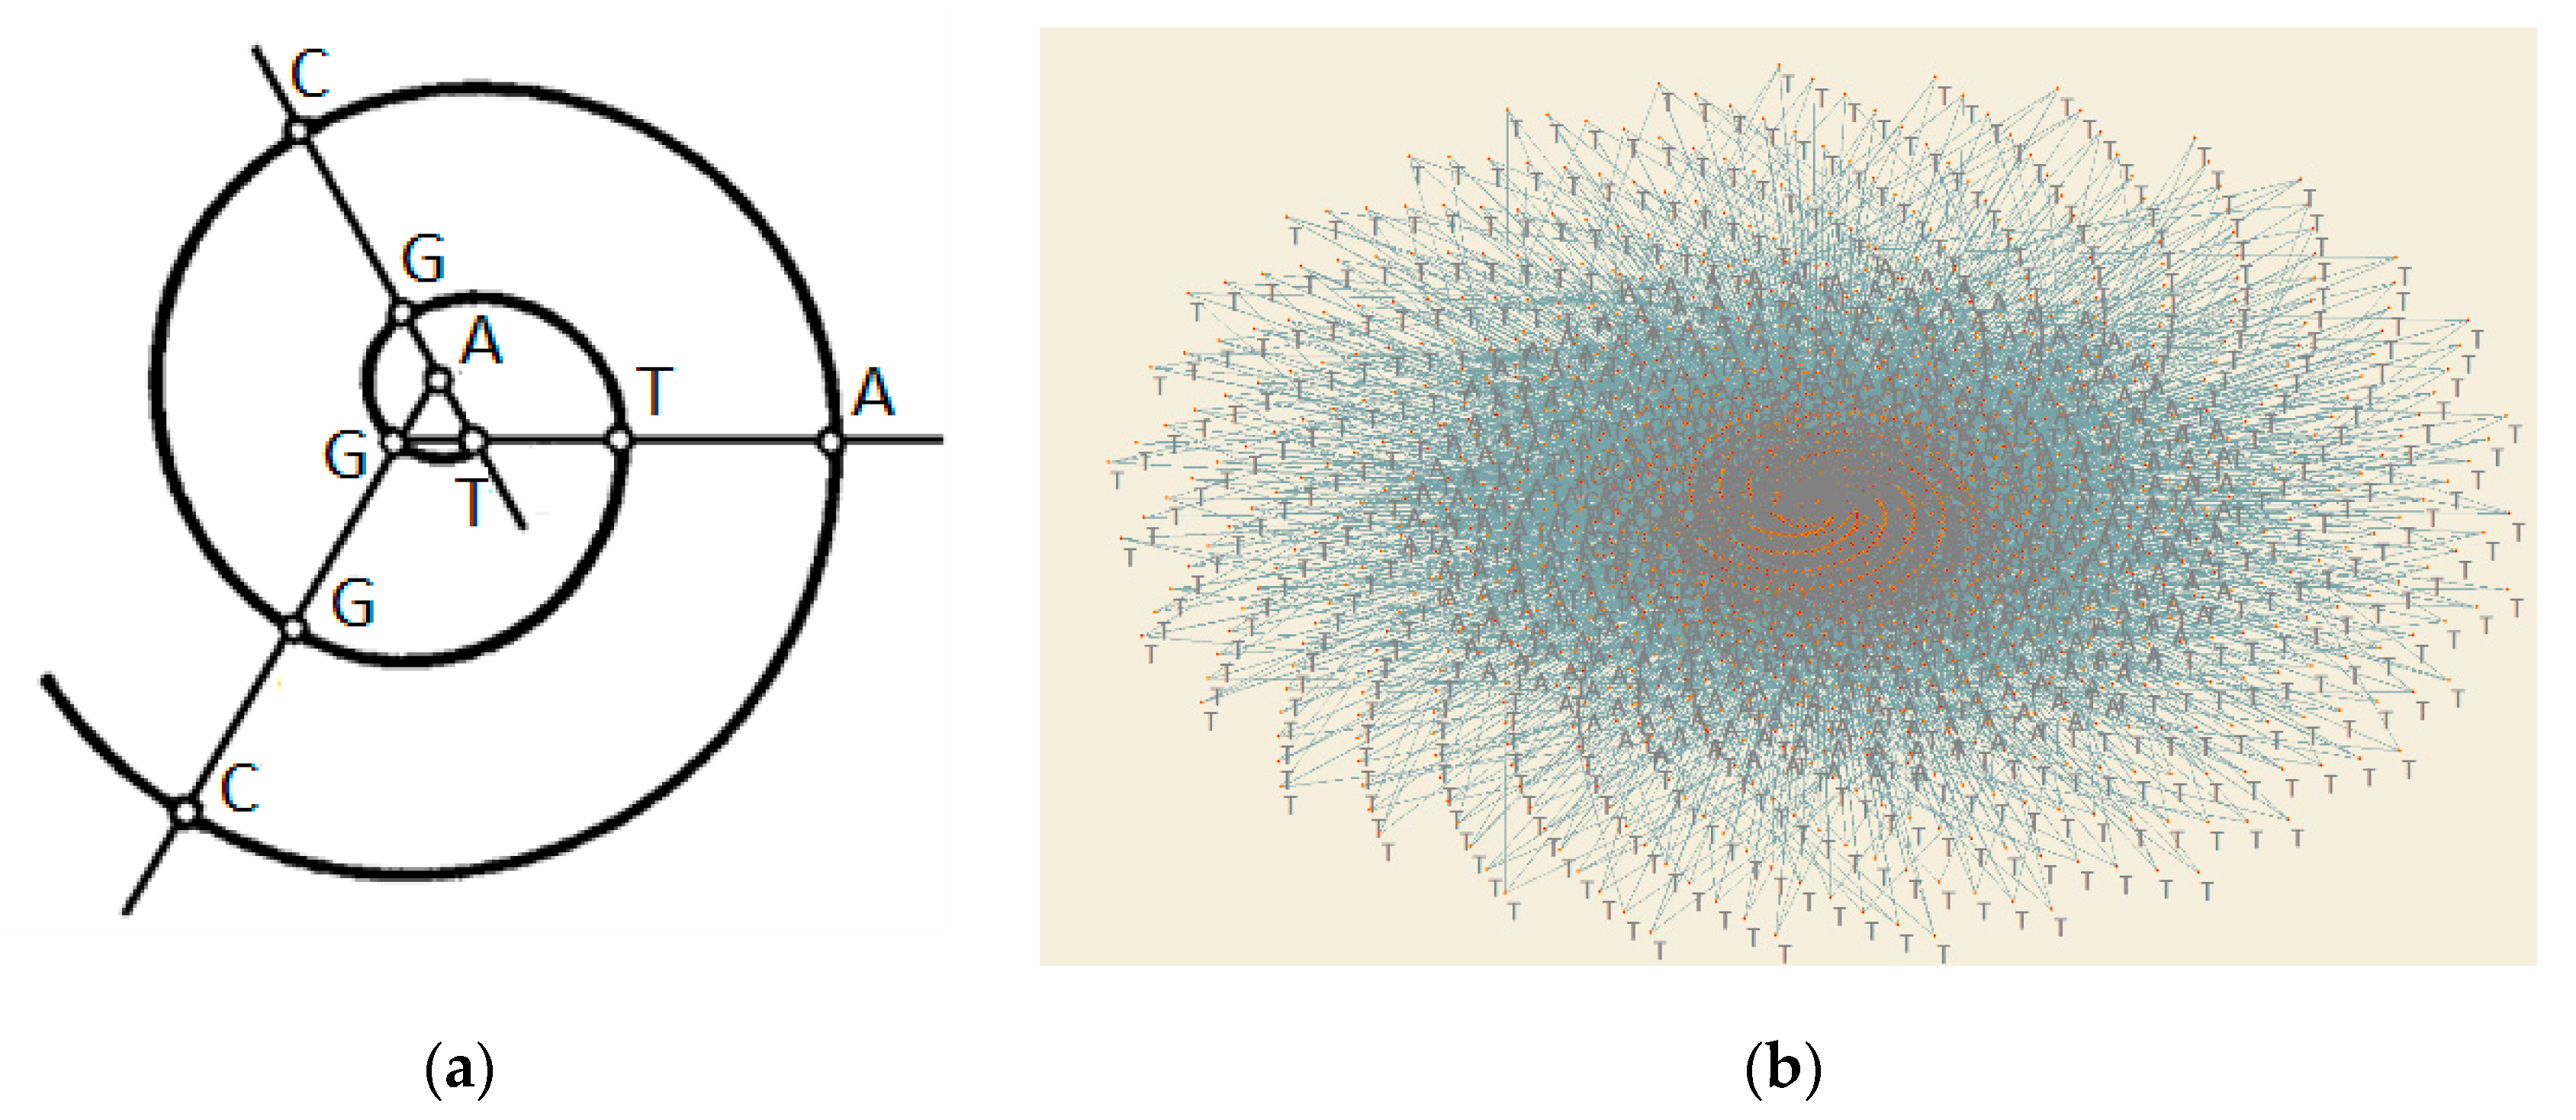
For each nucleotide of the DNA base, we present an Archimedean spiral. These nucleotides are presented in the polar coordinate system. The polar coordinate system is a two-dimensional coordinate system in which each point located in a plane is determined by specifying a distance r and angle φ from the origin of the system.
In addition, polar coordinate systems have two coordinates (r,φ). Equation (1) presents the Archimedean spiral.
r = a + bφ
Firstly, we determine n ∈ N of all nucleotides (in Human (92 bases), we have 92 bases, also n = 92). Then, we determine the number of all nucleotides n(A), n(C), n(G), and n(T) (in Human (92 bases), we have 17 nucleotides of A, 19 nucleotides of C, 36 nucleotides of G, and 20 nucleotides of T). After the determination of the number of all nucleotides, we calculate φi, for each nucleotide i ∈ {A, C, G, T}, as follows:
φ(A) = n(A)/n × 2π
φ(C) = n(C)/n × 2π
φ(G) = n(G)/n × 2π
φ(T) = n(T)/n × 2π
φ(A+C+G+T) = 2π
In Figure 1, nucleotides of a DNA base on an Archimedean spiral are presented.
Secondly, we transform Archimedean coordinates into Cartesian coordinates:
(r,φ)→(x,y),
(r,φ)→(rcosφ, rsinφ).
In Equation (1), we determine a = 1 and b = 1 (we can use ∀a,b). Thus, r = 1 + φ and
(r,φ)→((1 + φ)cosφ, (1 + φ)sinφ).
As we have 4 different φi, i ∈ {A, C, G, T}, and φ(A), φ(C), φ(G), φ(T), we have transformation
(r,φi)→((1 + kiφi)cos(kiφi), (1 + kiφi)sin(kiφi)), 0 < φ < 2π, k ∈ N.
In Figure 2, the transformation of Archimedean coordinates to Cartesian coordinates is presented.
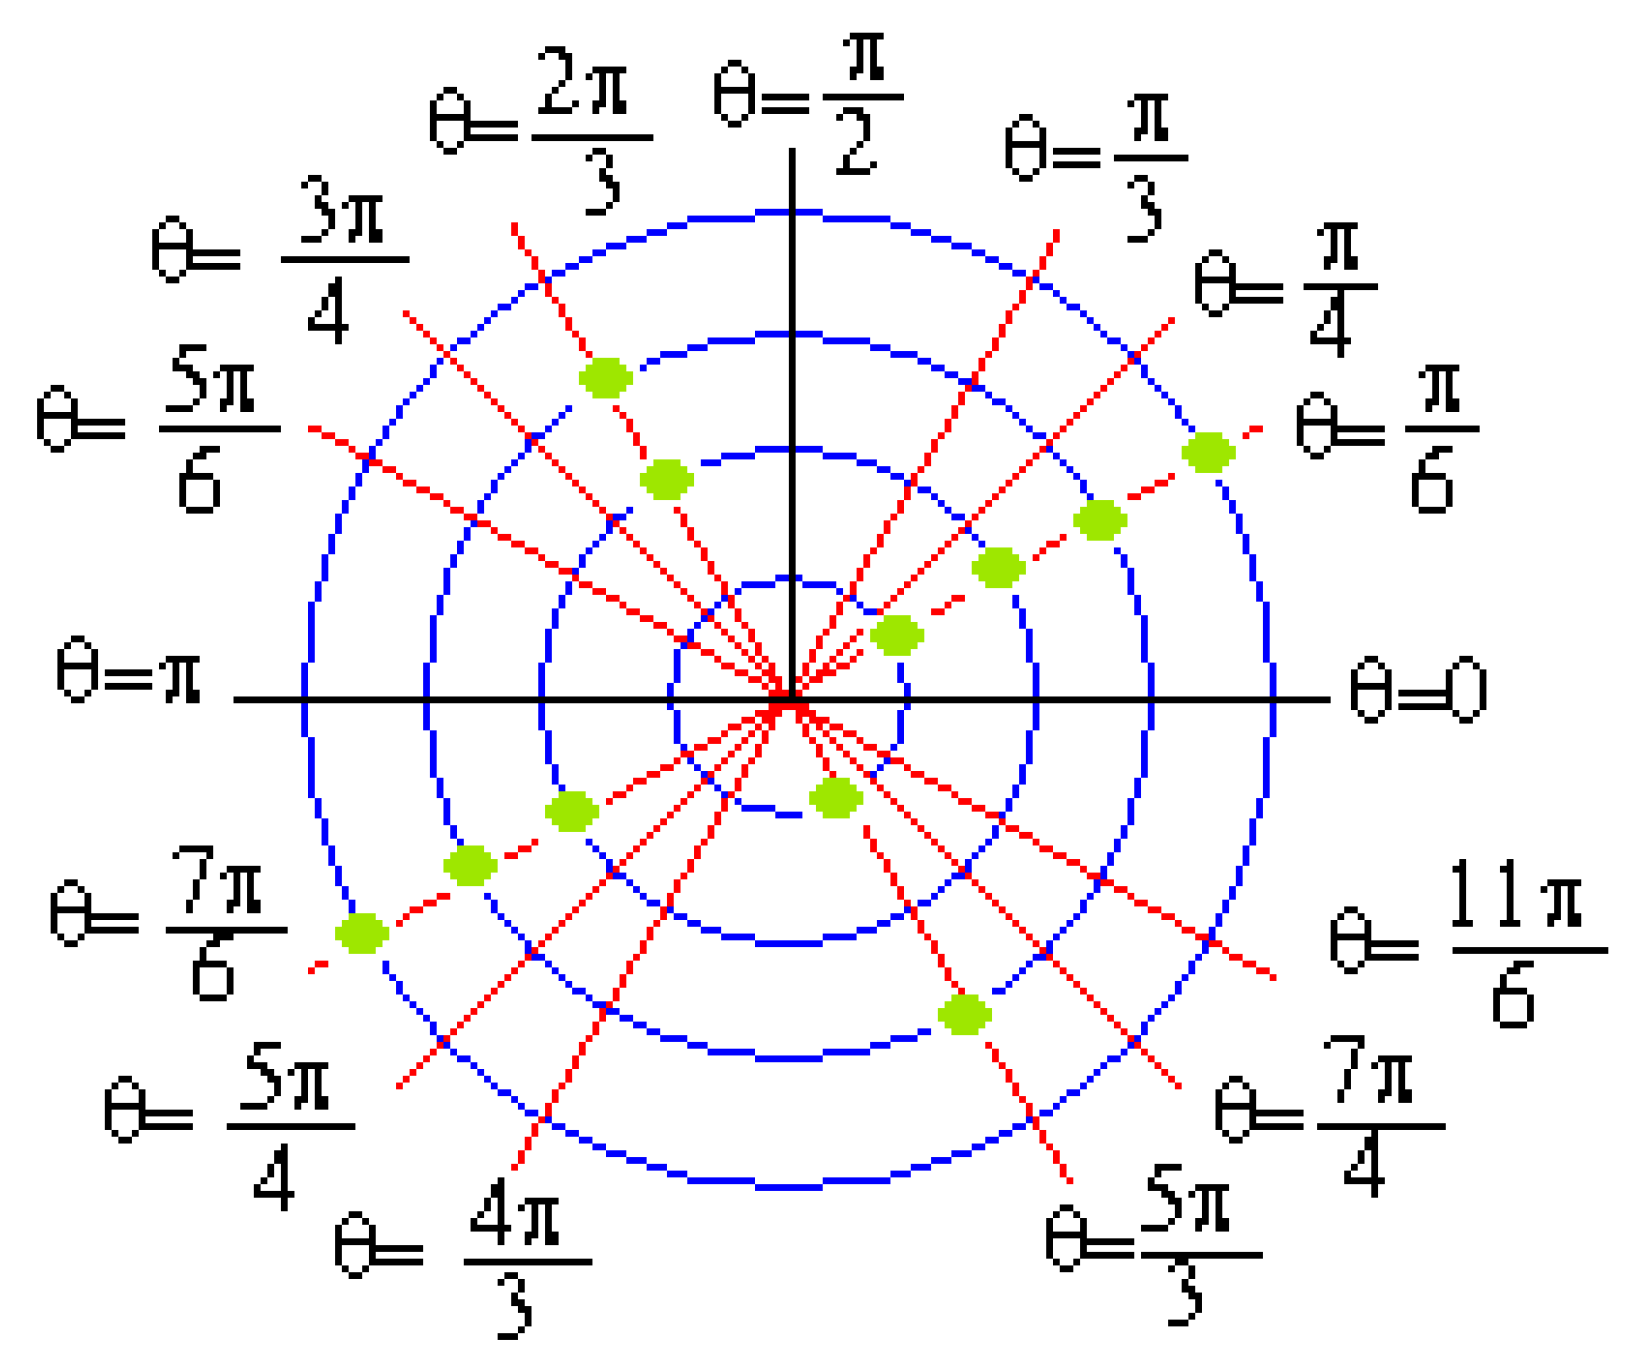
In the fourth step, we estimate the complexity of the network. In addition, we have coordinates of DNA sequences (r,φ), which determine the network of DNA. Nucleotides of DNA in sequences present nodes of the network. We find how many nodes lie on a line with equal φ on the network of DNA, where 0 < φ < 2π. For each φi, where i ∈ N, we find j nodes, where j ∈ N (Figure 3). Firstly, nodes that have equal φ are connected together sequentially. Secondly, each nucleotide C is connected with G in CpG islands in DNA sequences (Figure 4).
In the next step, we determine the sequence (φi, j), where i, j ∈ N. Sequence (φi, j) presents the graph Γ(φi, j) shown in Figure 5.
Fractal mining is characterized by different statistical properties from conventional ones. It can present a probability distribution function, a slowly decaying autocorrelation function, and a power spectrum function of type. Otherwise, it can show the statistical dependence, either long-range dependence or short-range dependence, and global or local self-similarity. When self-similar, it is invariant with reference to the scale adopted to observe the data set. It is assumed that fractals have a scaling property that is displayed at every scale used to look at them, whereas the self-similarity is recognized at many data sets over a range of scales. The fractal dimension is useful to measure self-similarity. As a relevant aspect of many complex systems, the fractal dimension can play a powerful representation technique. The DNA graph Γ(φi, j) of sequence (φi, j) from DNA sequences does not have self-similarity but statistical self-affinity. In addition, graph Γ(φi, j) is a statistical self-affinity function. Let W be a function obtained by the sampling of function Y(X) from x: Z(x) = Y(ax), where a is repeating sampling interval (2, 3, 4). As Y(a) is a statistical self-affinity function, we have W(x) = Y(ax). Thus, Z(a) = a−HY(ax), and this is the affine function. In this relation, H presents the Hurst exponent. In addition, for graph Γ(φi, j), we estimate Hurst exponent H [40] with the R/S method [41]. After estimating the Hurst exponent H, we calculate the fractal dimension D = 2 − H, which determines the complexity of the DNA network.
2.4. Statistical DNA Pattern Recognition
The perspective of attributing a certain relevance to different network properties allows the study of the internal organization of a biological network, the repartition of molecules among cellular processes, and the structure of DNA sequences. As follows, the fundamental properties that will be analyzed in DNA networks are briefly illustrated. Firstly, we calculate the topological property density, average degree, the Zagreb group index 1, the Zagreb group index 2, the Platt index, edges, type of triads 3–102, type of triads 16–300, Watts–Strogatz clustering coefficient, and fractal dimension of cancer and non-cancer DNA networks. Then, we calculate statistical properties standard deviation, standard error, variance, mean absolute deviation, coefficient of variation, coefficient of dispersion, and Pearson’s contingency coefficient of graphs Γ(φi, j) of sequence (φi, j) for cancer and non-cancer DNA sequences. For calculating topological properties, we use the program Pajek [42].
2.5. Data Preparation—Application
We use the Homo sapiens HIF1A base. HIF-1a is encoded by the HIF1A and HIF1A loci, which map to regions of conserved synteny on human chromosome 14q21–q24 and mouse chromosome 12, respectively [43]. HIF1A consists of 15 exons and 14 introns. All the 5′ and 3′ splice junctions of the HIF1A gene conformed to established consensus sequences [44]. Each of the 14 introns of the HIF1A gene interrupts the coding sequence at the same location as in the mouse HIF1A gene [45]. The length of introns between these exons on DNA is long enough to avoid DNA amplification. We use methods of statistical DNA pattern recognition for cancer and non-cancer DNA sequences for all exons, introns, and for 5′ flanking sequences and 3′ flanking sequences. Figure 6 presents the structure of the human HIF1A gene.
3. Results
Complexity in biological systems is predicted by describing interactions amongst different DNA structures. Graphs are emerging as indispensable tools in explaining how the DNA structure functions. We calculated topological properties that describe Lung gene networks. In Table 1, we present the SNP ID/substitution, their genomic location, and association to diseases and phenotypes. In Table 2, we show the topological and statistical properties of the non-cancer DNA network. We calculate the total adjacency index, Zagreb index 1, Platt index, density, average degree, and fractal dimension by DNA network. In Table 3, we show the topological and statistical properties of the lung cancer DNA network. We calculate equal topological and statistical properties as the non-cancer DNA network.
In Table 4, the statistical properties of graphs Γ(φi, j) of sequence (φi, j) from non-cancer DNA sequences are calculated: Standard deviation; standard error; variance; mean absolute deviation; coefficient of variation; coefficient of dispersion, and Pearson’s contingency coefficient.
In Table 5, we show the statistical properties of lung cancer of graphs Γ(φi, j) of sequence (φi, j) from cancer DNA sequences.
Figure 7 presents the comparison graph Γ(φi, j) of sequence (φi, j) from DNA sequences between non cancer and cancer rs10873142 [C > T]. The same identical results were also obtained in the comparison graph Γ(φi, j) of sequence (φi, j) from DNA sequences between non cancer and cancer rs41508050 [C > T] and rs10645014 [C > T].
Figure 8 presents the comparison graph Γ(φi, j) of sequence (φi, j) from DNA sequences between non cancer and cancer 1 rs41492849 [C > T], cancer 2 rs34005929 [G > A], cancer 3 rs11549465 [C > T], cancer 4 rs11549467 [G > A], and cancer 5 Rs199775054 [G > C].
4. Discussion
This study investigated the functional role of HIF1A between exons and introns and the connection between these polymorphisms and lung cancer risk by using fractal geometry and graph theory. In the field of network analysis applied in biology, the overall structure of the networks resulted to be far from random; contrarily, it seemed to be very complex. A more sophisticated application of the theory of random graphs in the study of biological networks has been advancing [46,47,48,49,50]. This is needed in order to establish null models to use in assessing the statistical significance of subgraphs, paths, patterns, and motifs that are found in biological networks. The average probability that two genes are associated with cancer or another has not been observed as fairly uniform. We need to be able to distinguish observed patterns and subgraphs from those that occur with a high probability in a random graph, under a biologically appropriate model of randomness. The overexpression of the complex structure of HIF1A mRNA in cancer is also correlated to cancer aggressiveness [51,52]. The Perez-school of study of recursive systems as an interdisciplinary school [53] demonstrated that the DNA is fractal at DNA, codon, full chromosome set, and whole genome levels. Perez [54] presented a new bioinformatics bridge between genomics and mathematics. Deciding to consider the “Universal Fractal Genome Code Law,” the frequency of each of the 64 codons across the entire human genome is shown to be determined by the codon’s position in the Universal Genetic Code table. In this paper, we discussed that the distribution of nucleotides along the sequence has some hidden mathematical geometrical rules of fractals that depend on the biological activity if we use the presented method for DNA sequencing [55,56,57,58].
In this study, we investigated the relationship between eight HIF-1 alpha polymorphisms rs10873142 [C > T], rs41508050 [C > T], rs41492849 [C > T], rs34005929 [G > A], rs11549465 [C > T], rs11549467 [G > A], Rs199775054 [G > C], and rs10645014 [C > T] among lung cancer patients by using a new method for the determination of the complexity of the DNA network. We calculated the total adjacency index, Zagreb index 1, Platt index, density, average degree, and fractal dimension by DNA network. A significant relationship was found in topological properties between the lung cancer and non-lung cancer DNA networks.
There was a significant difference in statistical property between the lung cancer and non-lung cancer DNA networks. We calculated equal topological and statistical properties as a non-cancer DNA network. Our results are indirectly supported by a study showing that the topological properties were increased in the lung cancer DNA network.
As a key network parameter, network density measures the portion of the potential connections in a network that are substantially actual connections. What is different in a potential connection is that a connection potentially exists between two nodes, regardless of its concrete subsistence. Measuring the density of a network gives us a ready index of the degree of dyadic connection in a network. Our results showed that density increased in the lung cancer DNA network.
Network density and average degree differed from each other in the fact that the average degree emphasized the factors influencing the number of links, while the network density outlined the factors that affect the number of nodes. The average degree increased in the lung cancer DNA network.
When the Zagreb index was evaluated, the vascular network was more similar to the Erdős–Renyi graph than to the irregular bounded valence graph. The first Zagreb index M1 can be indicated as one of the oldest and the most famous topological molecular structure descriptors, specifically described as the sum of squares of the degrees of the vertices [59]. In our research, Zagreb index 1 was increased in the lung cancer network.
The second Zagreb index M2 can be defined, instead, as equal to the sum of the products of the degrees of pairs of adjacent vertices of the underlying network (graph). In our research, Zagreb index 2 increased in the lung cancer network, as well.
It was easy to recognize the importance of the two-bond molecular fragments for the properties of chemical compounds. These fragments in their total number constitute, in the chemical theory, Platt’s index [60]. In general, Platt’s index can be considered as a more specific complexity measure than the number of edges. At the same number of edges, where operating complexifying factors like branches and cycles, Platt’s index is subjected to a rapid increase. From the analysis carried out in chemical graph theory, it follows that Platt’s index still fails to mirror some complex structural patterns, and better measures need to be discovered. In our study, the lung cancer network is associated with increasing Platt index.
The total adjacency index presents the number of edges of a graph. A significant difference in statistical topological property was found between the lung cancer and non-lung cancer DNA networks. Moreover, total adjacency index increased in the lung cancer network.
Since 1986, the elaboration of statistical methods has been developed for probability distributions of graphs with a significant relationship to the triad or triplet counts, complemented with star counts and nodal variables. Moreover, what is recently important is that an adequate modeling of empirical network data requires the inclusion of higher-order configurations (subgraphs with more nodes). In our study, the lung cancer network results are associated with an increasing number of type of triads 3–102 and 16–300.
The clustering coefficient applied to an undirected graph can be defined as a measure of the number of triangles in a graph. This coefficient is computed as the probability that edges are connected to form triangles. In other words, it measures the proportion that incident edge pairs are completed by a third edge to form a triangle. The Watts–Strogatz model is used to replicate a wide range of clustering coefficients and shortest path lengths simultaneously, but proves to be less efficient in producing the observed types of node degree distributions. Nodes tend to attach to popular nodes; popularity is attractive. In our study, the lung cancer network is associated with increasing Watts–Strogatz clustering coefficient.
The goal of our research was to study network science from a mathematical point of view, especially concerning the connection between networks and fractals. In [61], the authors describe the architectural organization and associated emergent topological properties of gene regulatory networks (GRNs) that describe protein–DNA interactions (PDIs) in several model eukaryotes.
Characterization of the dimensionality of complex networks was first introduced by Csányi [62] and was further developed by Gastner and Newman [63]. In addition, the paper proposes a new method for determination of the network complexity. This new method meaningfully favors data analysis on the one hand, and perhaps more importantly, it permits the estimation of the dimension of a network without having global information of its geometric structure. In our study of the fractal dimension of DNA network conditions, we showed that the fractal dimensions decreased in the lung cancer DNA network.
We compared the statistical properties of graphs Γ(φi, j) of sequence (φi, j) from non-cancer DNA sequences and cancer DNA sequences, which are presented in Table 4 and Table 5.
The standard deviation is well known to be a good measure of dispersion. Nevertheless, it is heavily subjected to the influence of outlying observations, as well as the overall shape of the distribution. When the assumption of normality is valid, it can be said that the confidence intervals for the mean, variance, and standard deviation are valid as well. It is also true that the standard error of each of these intervals is determined by the sample standard deviation and the sample size. In addition, this is the standard error of the mean. This means that it is the estimated standard deviation for the distribution of sample means for an infinite population. Another measure of dispersion is the sample variance, s2, which measures how much data spread around the mean. In statistics, it is also defined as an average of the squared deviations from the mean. Mean absolute deviation is not affected by outliers as much as the standard deviation, as the differences from the mean are not squared. As a robust relative measure of dispersion, the coefficient of variation is instead most often used to compare the amount of variation in two samples. The coefficient of dispersion is a measure of association independent of sample size, which ranges between 0 (no relationship) and 1 (perfect relationship). For any particular table, the maximum possible depends on the size of the table, so it should only be used to compare tables with the same dimensions. In our study, the lung cancer network is associated with increasing statistical properties of graphs Γ(φi, j) of sequence (φi, j) from lung cancer DNA sequences.
Our work also raises an important question of how the fractal dimension of the DNA network correlates with the statistical properties of the cancer DNA network. Additionally, the complexity of small networks under big networks means precisely the key to the fractal geometry. In addition, the key of fractal geometry is the fractal dimension, which describes the complexity of DNA geometric structures.
5. Conclusions
This study addresses the potential of an applied analytical method for the prediction of lung cancer. In the paper, this new method is based on a hybrid system of two mathematical disciplines; fractal geometry and network theory are presented for application in bioinformatics and, especially, for the analysis of DNA structures. With a new topology classification and a new approach to the determination of complexity by using fractal geometry of the DNA network, we can accurately distinguish lung cancer DNA sequences from non-cancer DNA sequences. Developing a connection of graph theory and fractal geometry in this proposed method represents the first of many steps that can be made to simplify the analysis of DNA sequencing. Compared to the method proposed by [66], our method is more rigorous, sovereign, and more useful. Baish et al. used the box-counting method for analyzing fractal dimension from pictures. A critical aspect could be that many published results claiming fractal behavior of natural objects may be flawed by poor attention to detail and multiple checks that were revealed to be necessary. In our method, we present the fractal dimension directly from DNA sequences. From a conceptual and computational point of view, the approach is simple and can, therefore, be very useful in many fields of bioinformatics. The proposed approach seems to be advantageous as it allows visual inspection of data and to identify major similarities among different DNA sequences. We believe that the analysis of the motif profiles in complex network models can constitute a point of departure of open and challenging problems in biology. As future work, we aim to introduce some improvements to this research study in terms of a comparative study in order to enhance the accuracy of the investigation technique. In the future, we aim to validate the results in comparison to other research to improve the adopted method for an experimental evaluation and numerical assessment of DNA sequencing. This scientific intention to develop further comparison among the methods used in other studies could produce a better prediction of data processing and analysis in DNA structures in lung cancer networks but also in other types of cancer. Thanks to future improvements, the proposed method could also extend its potentiality for a robust performance from the bioinformatics field to other research areas and fields such as public transport, transit systems, communication systems, robot systems, and motion.
Author Contributions
Conceptualization, M.B., J.M. and M.C.; Data curation, M.B., J.M. and M.C.; Formal analysis, M.B., J.M. and M.C.; Methodology, M.B., J.M. and M.C.; Writing—original draft, M.B.; Writing—review & editing, M.C. The authors contributed equally to this work. All authors have read and agreed to the published version of the manuscript.
Funding
This research was supported by the fund for the athenaeum research in Catania; research programme 2019/2021.
Conflicts of Interest
The authors declare no conflict of interest.
References
- Wilhelm, T.; Kim, J. What is a complex graph? Physica A 2008, 387, 2637–2652. [Google Scholar] [CrossRef]
- Babič, M.; Calì, M.; Nazarenko, I.; Fragassa, C.; Ekinovic, S.; Mihaliková, M.; Janjić, M.; Belič, I. Surface roughness evaluation in hardened materials by pattern recognition using network theory. Int. J. Interact. Des. Manuf. 2019, 13, 211–219. [Google Scholar] [CrossRef]
- El-Metwally, S.; Ouda, O.M.; Helmy, M. Next generation sequencing technologies and challenges in sequence assembly. Springer Sci. Bus. 2014, 7, 51–59. [Google Scholar]
- Almeida, J.S. Sequence analysis by iterated maps, a review. Brief. Bioinform. 2014, 15, 369–375. [Google Scholar] [CrossRef] [PubMed] [Green Version]
- Tutte, W.T. Graph Theory; Cambridge University Press: Cambridge, UK, 2001. [Google Scholar]
- Babič, M.; Marina, N.; Mrvar, A.; Dookhitram, K.; Calì, M. A New Method for Biostatistical miRNA Pattern Recognition with Topological Properties of Visibility Graphs in 3D Space. J. Healthc. Eng. 2019, 2019, 9. [Google Scholar] [CrossRef] [PubMed]
- Mandelbrot, B.B. The Fractal Geometry of Nature; W. H. Freeman: New York, NY, USA, 1982. [Google Scholar]
- Peitgen, H.-O.; Jürgens, H.; Saupe, D. Chaos and Fractals: New Frontiers of Science, 2nd ed.; Springer: Berlin/Heidelberg, Germany, 2004. [Google Scholar]
- Lennon, F.E.; Cianci, G.C.; Cipriani, N.A.; Hensing, T.A.; Zhang, H.J.; Chen, C.T.; Murgu, S.D.; Vokes, E.E.; Vannier, M.W.; Salgia, R. Lung cancer—A fractal viewpoint. Nat. Rev. Clin. Oncol. 2015, 12, 664–675. [Google Scholar] [CrossRef] [PubMed] [Green Version]
- Ristanovic, D.; Milosevic, N.T. Fractal analysis: Methodologies for biomedical researchers. Theor. Biol. Forum 2012, 105, 99–118. [Google Scholar]
- Fractal Geometry in Biological Systems: An Analytical Approach; Iannaccone, P.M.; Khokha, M. (Eds.) CRC Press: Boca Raton, FL, USA, 1996. [Google Scholar]
- Matej, B.; Miliaresis, G.C.; Matjaž, M.; Ambu, R.; Michele, C. New method for estimating fractal dimension in 3d space and its application to complex surfaces. Int. J. Adv. Sci. Eng. Inf. Technol. 2019, 9, 2154–2159. [Google Scholar] [CrossRef]
- Broz, P.; Monack, D.M. Newly described pattern recognition receptors team up against intracellular pathogens. Nat. Rev. Immunol. 2013, 13, 551–565. [Google Scholar] [CrossRef]
- Nelson, T.R.; West, B.J.; Goldberger, A.L. The fractal lung: Universal and species-related scaling patterns. Experientia 1990, 46, 251–254. [Google Scholar] [CrossRef]
- Siegel, R.; Ma, J.; Zou, Z.; Jemal, A. Cancer statistics. CA Cancer J. Clin. 2014, 64, 9–29. [Google Scholar] [CrossRef] [PubMed] [Green Version]
- Kenneth, N.S.; Rocha, S. Regulation of gene expression by hypoxia. Biochem. J. 2008, 414, 19–29. [Google Scholar] [CrossRef] [PubMed] [Green Version]
- Keith, B.; Johnson, R.S.; Simon, M.C. HIF1α and HIF2α: Sibling rivalry in hypoxic tumour growth and progression. Nat. Rev. Cancer 2012, 12, 9–22. [Google Scholar] [CrossRef] [PubMed] [Green Version]
- Salceda, S.; Caro, J. Hypoxia-inducible factor 1α (HIF-1α) protein is rapidly degraded by the ubiquitin–proteasome system under normoxic conditions: Its stabilization by hypoxia depends on redox-induced changes. J. Biol. Chem. 1997, 272, 22642–22647. [Google Scholar] [CrossRef] [Green Version]
- Prabhakar, N.R.; Semenza, G.L. Adaptive and maladaptive cardiorespiratory responses to continuous and intermittent hypoxia mediated by hypoxia-inducible factors 1 and 2. Physiol. Rev. 2012, 92, 967–1003. [Google Scholar] [CrossRef] [Green Version]
- Griffiths, E.A.; Pritchard, S.A.; Welch, I.M.; Price, P.M.; West, C.M. Is the hypoxia-inducible factor pathway important in gastric cancer? Eur. J. Cancer 2005, 41, 2792–2805. [Google Scholar] [CrossRef]
- Stoeltzing, O.; McCarty, M.F.; Wey, J.S.; Fan, F.; Liu, W.; Belcheva, A.; Bucana, C.D.; Semenza, G.L.; Ellis, L.M. Role of hypoxia-inducible factor 1alpha in gastric cancer cell growth, angiogenesis, and vessel maturation. J. Natl. Cancer Inst. 2004, 96, 946–956. [Google Scholar] [CrossRef] [Green Version]
- Zhong, H.; Semenza, G.L.; Simons, J.W.; De Marzo, A.M. Up-regulation of hypoxia-inducible factor 1alpha is an early event in prostate carcinogenesis. Cancer Detect. Prev. 2004, 28, 88–93. [Google Scholar] [CrossRef]
- Rami-Porta, R.; Bolejack, V.; Giroux, D.J.; Chansky, K.; Crowley, J.; Asamura, H.; Goldstraw, P. The IASLC lung cancer staging: The new database to inform the eighth edition of the TNM classification of lung cancer. J. Thorac. Oncol. 2014, 9, 1618–1624. [Google Scholar] [CrossRef] [Green Version]
- Maeda, R.; Yoshida, J.; Ishii, G.; Hishida, T.; Nishimura, M.; Nagai, K. Risk factors for tumor recurrence in patients with early-stage (stage I and II) non–small cell lung cancer. Patient selection criteria for adjuvant chemotherapy according to the seventh edition TNM classification. Chest 2011, 140, 1494–1502. [Google Scholar] [CrossRef]
- Choi, J.P.; Jeong, S.S.; Yoon, S.S. Prognosis of recurrence after complete resection in earlystage non–small cell lung cancer. Korean J. Thorac. Cardiovasc. Surg. 2013, 46, 449–456. [Google Scholar] [CrossRef] [PubMed]
- Taylor, M.D.; Nagji, A.S.; Bhamidipati, C.M.; Theodosakis, N.; Kozower, B.D.; Lau, C.L.; Jones, D. RTumor recurrence after complete resection for non–small cell lung cancer. Ann. Thorac. Surg. 2012, 93, 1813–1821. [Google Scholar] [CrossRef] [PubMed]
- Kawase, A.; Yoshida, J.; Miyaoka, E.; Asamura, H.; Fujii, Y.; Nakanishi, Y.; Eguchi, K.; Mori, M.; Sawabata, N.; Okumura, M. Japanese Joint Committee of Lung Cancer Registry visceral pleural invasion classification in non–small-cell lung cancer in the 7th edition of the tumor, node, metastasis classification for lung cancer: Validation analysis based on a large-scale nationwide database. J. Thorac. Oncol. 2013, 8, 606–611. [Google Scholar]
- Endo, C.; Sakurada, A.; Notsuda, H.; Noda, M.; Hoshikawa, Y.; Okada, Y.; Kondo, T. Results of long-term follow-up of patients with completely resected non–small cell lung cancer. Ann. Thorac. Surg. 2012, 93, 1061–1069. [Google Scholar] [CrossRef]
- Fu, Q.F.; Liu, Y.; Fan, Y.; Hua, S.N.; Qu, H.Y.; Dong, S.W.; Li, R.L.; Zhao, M.Y.; Zhen, Y.; Yu, X.L.; et al. Alpha-enolase promotes cell glycolysis, growth, migration, and invasion in non-small cell lung cancer through FAK-mediated PI3K/AKT pathway. J. Hematol. Oncol. 2015, 8, 22. [Google Scholar] [CrossRef] [PubMed] [Green Version]
- Sakoda, L.C.; Ferrara, A.; Achacoso, N.S.; Peng, T.; Ehrlich, S.F.; Quesenberry, C.P.; Habel, L.A. Metformin use and lung cancer risk in patients with diabetes. Cancer Prev. Res. 2015, 8, 174–179. [Google Scholar] [CrossRef] [Green Version]
- Ju, Y.S.; Lee, W.C.; Shin, J.Y.; Lee, S.; Bleazard, T.; Won, J.K.; Kim, Y.T.; Kim, J.I.; Kang, J.H.; Seo, J.S. A transforming KIF5B and RET gene fusion in lung adenocarcinoma revealed from whole-genome and transcriptome sequencing. Genome Res. 2012, 22, 436–445. [Google Scholar] [CrossRef] [Green Version]
- Costello, J.F.; Plass, C. Methylation matters. J. Med. Genet. 2001, 38, 285–303. [Google Scholar] [CrossRef] [Green Version]
- Herman, J.G.; Latif, F.; Weng, Y.; Lerman, M.I.; Zbar, B.; Liu, S.; Linehan, W.M. Silencing of the VHL tumor-suppressor gene by DNA methylation in renal carcinoma. Proc. Natl. Acad. Sci. USA 1994, 91, 9700–9704. [Google Scholar] [CrossRef] [Green Version]
- Sullivan Pepe, M.; Etzioni, R.; Feng, Z.; Potter, J.D.; Thompson, M.L.; Thornquist, M.; Winget, M.; Yasui, Y.J. Phases of biomarker development for early detection of cancer. Natl. Cancer Inst. 2001, 93, 1054–1061. [Google Scholar] [CrossRef] [PubMed] [Green Version]
- Siegmund, K.D.; Laird, P.W. Analysis of complex methylation data. Methods 2002, 27, 170–178. [Google Scholar] [CrossRef]
- Wu, D.; Wang, X. Application of clinical bioinformatics in lung cancer-specific biomarkers. Cancer Metastasis Rev. 2015, 34, 209–216. [Google Scholar] [CrossRef] [PubMed]
- Li, J.; Ching, T.; Huang, S.; Garmire, L.X. Using epigenomics data to predict gene expression in lung cancer. BMC Bioinform. 2015, 16, 5. [Google Scholar] [CrossRef] [PubMed] [Green Version]
- Zhang, Q.; Wu, H.; Zheng, H. Aberrantly methylated CpG island detection in colon cancer. J. Proteom. Bioinform. 2015, 8, 1. [Google Scholar] [CrossRef] [Green Version]
- Liu, C.C.; Chen, W.S.E.; Lin, C.C.; Liu, H.C.; Chen, H.Y.; Yang, P.C.; Chang, P.C.; Chen, J.J. Topology-based cancer classification and related pathway mining using microarray data. Nucleic Acids Res. 2006, 34, 4069–4080. [Google Scholar] [CrossRef] [Green Version]
- Babič, M.; Kokol, P.; Guid, N.; Panjan, P.A. New method for estimating the Hurst exponent H for 3D objects = Nova metoda za ocenjevanje Hurstovega eksponenta H za 3D-objekte. Mater. Teh. 2014, 48, 203–208. [Google Scholar]
- Feder, Jens, Fractals; Plenum Press: New York, NY, USA, 1988.
- De Nooy, W.; Mrvar, A.; Batagelj, V. Exploratory Social Network Analysis with Pajek: Revised and Expanded Edition for Updated Software; Cambridge University Press: New York, NY, USA, 2005. [Google Scholar]
- Semenza, G.L.; Rue, E.A.; Iyer, N.V.; Pang, M.G.; Kearns, W.G. Assignment of the hypoxia-inducible factor 1a gene to a region of conserved synteny on mouse chromosome 12 and human chromosome 14. Genomics 1996, 34, 437–439. [Google Scholar] [CrossRef]
- Breathnach, R.; Chambon, P. Organization and expression of eucaryotic split genes coding for proteins. Ann. Rev. Biochem. 1981, 50, 349–383. [Google Scholar] [CrossRef]
- Wenger, R.H.; Gassmann, M. Oxygen(es) and the hypoxia-inducible factor 1. Biol. Chem. 1997, 378, 609–616. [Google Scholar]
- Milenković, T.; Memišević, V.; Bonato, A.; Pržulj, N. Dominating biological networks. PLoS ONE 2011, 6, e23016. [Google Scholar] [CrossRef] [Green Version]
- Barabási, A.L.; Gulbahce, N.; Loscalzo, J. Network medicine: A network-based approach to human disease. Nat. Rev. Genet. 2011, 12, 56–68. [Google Scholar] [CrossRef] [PubMed] [Green Version]
- Bauer-Mehren, A.; Bundschus, M.; Rautschka, M.; Mayer, M.A.; Sanz, F.; Furlong, L.I. Gene-disease network analysis reveals functional modules in mendelian, complex and environmental diseases. PLoS ONE 2011, 6, e20284. [Google Scholar] [CrossRef] [PubMed] [Green Version]
- Sarajlić, A.; Janjić, V.; Stojković, N.; Radak, D.; PrŻulj, N. Network topology reveals key cardiovascular disease genes. PLoS ONE 2013, 8, e71537. [Google Scholar] [CrossRef] [PubMed] [Green Version]
- Hayes, W.; Sun, K.; Pržulj, N. Graphlet-based measures are suitable for biological network comparison. Bioinformatics 2013, 29, 483–491. [Google Scholar] [CrossRef] [PubMed] [Green Version]
- Cavadas, M.A.S.; Nguyen, L.R.; Cheong, A. Hypoxia-inducible factor (HIF) network: Insights from mathematical models. Cell Commun. Signal. 2013, 11, 42. [Google Scholar] [CrossRef] [Green Version]
- Furlan, D.; Sahnane, N.; Carnevali, I.; Cerutti, R.; Uccella, S.; Bertolini, V.; Chiaravalli, A.M.; Capella, C. Up-regulation and stabilization of HIF-1 alpha in colorectal carcinomas. Surg. Oncol. 2007, 16, S25–S27. [Google Scholar] [CrossRef]
- Perez, J.C. Caminos Interdisciplinaios, Seminario CLAVE_INTER, Espacio Interdisciplinario, Universidad de la Republica Montevideo Uruguay. 27 October 2011. Available online: https://issuu.com/eiudelar/docs/en_clave_web (accessed on 21 April 2020).
- Perez, J.C. Codon population in single-stranded whole human genome DNA are fractal and fine-tuned by the Golden Ration 1.618. Interdiscip. Sci. Comput. Life Sci. 2010, 2, 228–340. [Google Scholar] [CrossRef]
- Shendure, J.; Lieberman Aiden, E. The expanding scope of DNA sequencing. Nat. Biotechnol. 2012, 30, 1084–1094. [Google Scholar]
- Mathur, R.; Adlakha, N. A graph theoretic model for prediction of reticulation events and phylogenetic networks for DNA sequences. Egypt. J. Basic Appl. Sci. 2016, 3, 263–271. [Google Scholar] [CrossRef] [Green Version]
- Li, Y.; Liu, Q.; Zheng, X. DUC-Curve, a highly compact 2D graphical representation of DNA sequences and its application in sequence alignment. Phys. A Stat. Mech. Appl. 2016, 456, 256–270. [Google Scholar] [CrossRef]
- Nandy, A. The GRANCH techniques for analysis of DNA, RNA and protein sequences. Adv. Math. Chem. Appl. 2015, 2, 96–124. [Google Scholar]
- Farahani, M.R. Zagreb Indices and Zagreb Polynomials of Polycyclic Aromatic Hydrocarbons PAHs. J. Chem. Acta 2013, 2, 70–72. [Google Scholar]
- Platt, J.R. Prediction of Isomeric Differences in Paraffin Properties. J. Phys. Chem. 1952, 56, 328–336. [Google Scholar] [CrossRef]
- Ouma, W.Z.; Pogacar, K.; Grotewold, E. Topological and statistical analyses of gene regulatory networks reveal unifying yet quantitatively different emergent properties. PLoS Comput. Biol. 2018, 14, e1006098. [Google Scholar] [CrossRef] [PubMed]
- Csányi, G.; Szendrői, B. Fractal–small-world dichotomy in real-world networks. Phys. Rev. 2004, 70, 016122. [Google Scholar] [CrossRef] [Green Version]
- Gastner, M.T.; Newman, M.E. The spatial structure of networks. Eur. Phys. J. B Condens. Matter Complex Syst. 2006, 49, 247. [Google Scholar] [CrossRef] [Green Version]
- Dragomir, M.; Mafra, A.C.P.; Dias, S.M.; Vasilescu, C.; Calin, G.A. Using microRNA networks to understand cancer. Int. J. Mol. Sci. 2018, 19, 1871. [Google Scholar] [CrossRef] [PubMed] [Green Version]
- Rai, A.; Pradhan, P.; Nagraj, J.; Lohitesh, K.; Chowdhury, R.; Jalan, S. Understanding cancer complexome using networks, spectral graph theory and multilayer framework. Sci. Rep. Nat. 2017, 7, 1–16. [Google Scholar] [CrossRef] [PubMed] [Green Version]
- Baish, J.W.; Jain, R.K. Fractals and cancer. Cancer Res. 2000, 60, 3683–3688. [Google Scholar]
Figure 1.
(a) Nucleotides of DNA base on Archimedean spiral; (b) DNA sequences of lung cancer rs10873142[C > T] on Archimedean spiral.
Figure 1.
(a) Nucleotides of DNA base on Archimedean spiral; (b) DNA sequences of lung cancer rs10873142[C > T] on Archimedean spiral.

Figure 2.
Transformation of Archimedean coordinates to Cartesian coordinates.

Figure 3.
Green points present nodes for each angle φ of the network of DNA.

Figure 4.
DNA network.

Figure 5.
Graph Γ(φi, j) of sequence (φi, j) from DNA sequences.

Figure 6.
Structure of the human HIF1A gene.

Figure 7.
Comparison graph Γ(φi, j) of sequence (φi, j) from DNA sequences between non cancer and cancer rs10873142 [C > T].
Figure 7.
Comparison graph Γ(φi, j) of sequence (φi, j) from DNA sequences between non cancer and cancer rs10873142 [C > T].

Figure 8.
Comparison graph Γ(φi, j) of sequence (φi, j) from DNA sequences between non cancer and cancer 1 rs41492849 [C > T], cancer 2 rs34005929 [G > A], cancer 3 rs11549465 [C > T], cancer 4 rs11549467 [G > A], cancer 5 Rs199775054 [G > C].
Figure 8.
Comparison graph Γ(φi, j) of sequence (φi, j) from DNA sequences between non cancer and cancer 1 rs41492849 [C > T], cancer 2 rs34005929 [G > A], cancer 3 rs11549465 [C > T], cancer 4 rs11549467 [G > A], cancer 5 Rs199775054 [G > C].


Table 1.
SNP ID/substitution, genomic location, and association to diseases and phenotypes of lung cancer.
Table 1.
SNP ID/substitution, genomic location, and association to diseases and phenotypes of lung cancer.
| SNP ID/Substitution | Genomic Location | Association to Diseases and Phenotypes |
|---|---|---|
| rs10873142 [C > T] | Intron 8 | Lung cancer (Konac et al., 2009) |
| rs41508050 [C > T] | Exon 10 | Lung cancer (Konac et al., 2009) |
| rs41492849 [C > T] | Exon 12 | Lung cancer (Konac et al., 2009) |
| rs34005929 [G > A] | Exon 12 | Lung cancer (Konac et al., 2009) |
| rs11549465 [C > T] | Exon 12 | Lung cancer (NSCLC) (Koukourakis et al., 2006) (Konac et al., 2009; Kuo et el., 2012) (associated with lung cancer with TP53 LOH) (Putra et al., 2011b), (NSCLC) (Kim el al., 2010) |
| rs11549467 [G > A] | Exon 12 | Lung cancer (Konac et al., 2009), (Associated with adenocarcinoma with 1p34 LOH) (Putra et al., 2011b)) and lung carcinoma (NSCLC) (Kim el al., 2010; Koukourakis et al., 2006; Kou et al., 2005) |
| Rs199775054 [G > C] | Exon 12 | Lung cancer (Park et al., 2009) Lung cancinoma (NSCLC) (Koukourakis et al., 2006) |
| rs10645014 [C > T] | Intron 13 | Lung cancer (Konac et al., 2009) |
Table 2.
Topological and statistical properties of the non-cancer DNA network.
| Network Properties | Intron 8 | Exon 10 | Exon 12 | Intron 13 |
|---|---|---|---|---|
| Density | 0.01546718 | 0.01608148 | 0.01621950 | 0.01589322 |
| Average Degree | 40.10639938 | 4.59930314 | 7.02304147 | 13.92246294 |
| The Zagreb group index 1 | 4,197,898 | 7318 | 24,348 | 181,692 |
| The Zagreb group index 2 | 84,948,210 | 22,800 | 104,419 | 1,413,671 |
| The Platt index | 4,093,862 | 5998 | 21,300 | 169,482 |
| Edges | 52,018 | 660 | 1524 | 6105 |
| Type of triads 3–102 | 132,781,531 | 185,036 | 647,562 | 5,256,849 |
| Type of triads 16–300 | 681,579 | 978 | 3498 | 28,152 |
| Watts–Strogatz Clustering Coefficient | 0.99896066 | 0.97880415 | 0.98307498 | 0.99606624 |
| Fractal dimension | 1.365 | 1.862 | 1.907 | 1.851 |
Table 3.
Topological and statistical properties of the lung cancer DNA network.
| Network Properties | rs10873142 [C > T] | rs41508050 [C > T] | rs41492849 [C > T] | rs34005929 [G > A] | rs11549465 [C > T] | rs11549467 [G > A] | rs199775054 [G > C] | rs10645014 [C > T] |
|---|---|---|---|---|---|---|---|---|
| Density | 0.01546748 | 0.01676372 | 0.02084908 | 0.01770948 | 0.01757311 | 0.02084908 | 0.02226456 | 0.01609628 |
| Average Degree | 40.10717039 | 4.79442509 | 9.02764977 | 7.66820276 | 7.62672811 | 9.02764977 | 9.64055300 | 14.10034208 |
| Zagreb group index 1 | 4,199,568 | 8198 | 48,822 | 29,668 | 29,424 | 48,844 | 46,042 | 187,550 |
| Zagreb group index 2 | 85,054,098 | 27,736 | 351,924 | 141,323 | 139,795 | 352,309 | 260,722 | 1,495,322 |
| The Platt index | 4,095,530 | 6822 | 44,904 | 26,340 | 26,114 | 44,926 | 41,858 | 175,184 |
| Edges | 52,019 | 688 | 1959 | 1664 | 1655 | 1959 | 2092 | 6183 |
| Type of triads 3–102 | 132,783,343 | 192,594 | 823,641 | 705,525 | 701,722 | 823,661 | 882,619 | 5,322,238 |
| Type of triads 16–300 | 681,875 | 1112 | 7419 | 4339 | 4292 | 7433 | 6911 | 29,099 |
| Watts–Strogatz Clustering Coefficient | 0.99897467 | 0.98532192 | 0.98663000 | 0.98329772 | 0.98323644 | 0.98822358 | 0.98587087 | 0.99628683 |
| Fractal dimension | 1.325 | 1.741 | 1.849 | 1.747 | 1.844 | 1.787 | 1.803 | 1.718 |
Table 4.
Statistical properties of graphs Γ(φi, j) of sequence (φi, j) from non-cancer DNA sequences.
Table 4.
Statistical properties of graphs Γ(φi, j) of sequence (φi, j) from non-cancer DNA sequences.
| Statistical Properties | Intron 8 | Exon 10 | Exon 12 | Intron 13 |
|---|---|---|---|---|
| Standard Deviation | 11.896 | 2.12891 | 3.464352 | 4.634643 |
| Standard Error | 1.487 | 0.2703719 | 0.433044 | 0.5793303 |
| Variance | 141.5149 | 4.532258 | 12.00174 | 21.47991 |
| Mean Absolute Deviation | 7.617188 | 1.705515 | 2.952637 | 3.946289 |
| Coefficient of Variation | 0.320701 | 0.4599039 | 0.5474532 | 0.3675553 |
| Coefficient of Dispersion | 0.1318597 | 0.3387097 | 0.4869792 | 0.3016827 |
| Pearson’s Contingency Coefficient | 0.9608 | 0.9487 | 0.9536 | 0.9682 |
Table 5.
Statistical properties of graphs Γ(φi, j) of sequence (φi, j) from cancer DNA sequences.
| Statistical Properties | rs10873142 [C > T] | rs41508050 [C > T] | rs41492849 [C > T] | rs34005929 [G > A] | rs11549465 [C > T] | rs11549467 [G > A] | rs199775054 [G > C] | rs10645014 [C > T] |
|---|---|---|---|---|---|---|---|---|
| Standard Deviation | 12.36723 | 2.374446 | 3.85292 | 4.675162 | 3.493759 | 4.068852 | 5.10522 | 5.060326 |
| Standard Error | 1.545904 | 0.299152 | 0.4816149 | 0.5843953 | 0.4367198 | 0.5086065 | 0.6590812 | 0.6325407 |
| Variance | 152.9484 | 5.637993 | 14.84499 | 21.85714 | 12.20635 | 16.55556 | 26.06328 | 25.6069 |
| Mean Absolute Deviation | 7.890625 | 1.904762 | 3.253418 | 3.523438 | 2.925781 | 3.109375 | 4.915555 | 4.140625 |
| Coefficient of Variation | 0.3348151 | 0.5212198 | 0.5829477 | 0.7056849 | 0.5273598 | 0.6141663 | 0.7582011 | 0.4013146 |
| Coefficient of Dispersion | 0.1387195 | 0.4563492 | 0.5390625 | 0.6125 | 0.484375 | 0.55 | 1.566667 | 0.33125 |
| Pearson’s Contingency Coefficient | 0.9661 | 0.9535 | 0.9701 | 0.9682 | 0.9636 | 0.9661 | 0.9635 | 0.9718 |
© 2020 by the authors. Licensee MDPI, Basel, Switzerland. This article is an open access article distributed under the terms and conditions of the Creative Commons Attribution (CC BY) license (http://creativecommons.org/licenses/by/4.0/).
Share and Cite
MDPI and ACS Style
Babič, M.; Mihelič, J.; Calì, M. Complex Network Characterization Using Graph Theory and Fractal Geometry: The Case Study of Lung Cancer DNA Sequences. Appl. Sci. 2020, 10, 3037. https://doi.org/10.3390/app10093037
AMA Style
Babič M, Mihelič J, Calì M. Complex Network Characterization Using Graph Theory and Fractal Geometry: The Case Study of Lung Cancer DNA Sequences. Applied Sciences. 2020; 10(9):3037. https://doi.org/10.3390/app10093037
Chicago/Turabian StyleBabič, Matej, Jurij Mihelič, and Michele Calì. 2020. "Complex Network Characterization Using Graph Theory and Fractal Geometry: The Case Study of Lung Cancer DNA Sequences" Applied Sciences 10, no. 9: 3037. https://doi.org/10.3390/app10093037
Note that from the first issue of 2016, this journal uses article numbers instead of page numbers. See further details here.