Density, Viscosity, and Excess Properties of MDEA + H2O, DMEA + H2O, and DEEA + H2O Mixtures


Faculty of Technology, Natural Sciences and Maritime Studies, University of South-Eastern Norway, Kjølnes Ring 56, 3901 Porsgrunn, Norway
*
Author to whom correspondence should be addressed.
Appl. Sci. 2020, 10(9), 3196; https://doi.org/10.3390/app10093196
Submission received: 16 March 2020
/
Revised: 20 April 2020
/
Accepted: 27 April 2020
/
Published: 3 May 2020
Abstract
:This study presents measured density and viscosity of N-methyldiethanolamine (MDEA) + H2O, Dimethylethanolamine (DMEA) + H2O, and Diethylethanolamine (DEEA) + H2O mixtures. The density was measured at amine mass fraction w1 from 0.3 to 1 for the temperature range 293.15–353.15 K. The excess molar volumes VE were determined from density data. Redlich–Kister type polynomials were proposed to fit VE and density deviation ln(ργ) to represent measured densities. The viscosity was measured at amine mass fraction w1 from 0.3 to 1 for the temperature range 293.15–363.15 K. The viscosity deviation ηE and excess free energy of activation for viscous flow ΔGE* were determined from measured viscosities and examined for intermolecular interactions among mixture molecules. Correlations were proposed to fit viscosity data with acceptable accuracies. The McAllister’s three-body model was adopted to fit kinematic viscosities determined from density and dynamic viscosity data. The results showed the importance of examining intermolecular interactions that are discussed in McAllister’s four-body model to improve the accuracies of data fits.
1. Introduction
Amine-based post-combustion CO2 capture (PCC) is a widely discussed emission control approach in which CO2 in flue gas is captured though chemical absorption. The technology has proven the capability of over 90% of CO2 removal efficiency, making amine-based PCC a reliable and economical technology [1,2]. Primary amines are highly reactive compared to secondary and tertiary amines and monoethanol amine (MEA) is the most basic of the amines in acid gas treating. The PCC with MEA is regarded as the benchmark process to compare and evaluate performance of processes with different amines for the CO2 capture performance, energy utilization, and amine degradation. Tertiary amines exhibit a low absorption rate; nevertheless, fast desorption rate and high absorption capacity compared to primary amines like MEA are advantages. The reaction between CO2 and MEA forms stable carbamate that limits a theoretical absorption capacity at 0.5 mol CO2/mol amine [3].
Tertiary aqueous amines like N-methyldiethanolamine (MDEA), Dimethylethanolamine (DMEA), and Diethylethanolamine (DEEA) have been studied for performance in CO2 removal [4,5,6,7]. The low reaction heat of tertiary amines with CO2 reduce the energy penalty due to the CO2 stripping, which make the technology more feasible to use [6]. Tertiary amines do not generate carbamate during the reaction with CO2, and bicarbonate is formed as the only CO2 carrying specie. This leads to increase the theoretical CO2 absorption capacity up to 1 mol CO2/mol amine [3]. The characteristics shown by DMEA and DEEA in CO2 absorption identify them as alternative solvents for the CO2 caption processes [6,8].
Physical properties of amine solvents are useful in various aspects in process design, equipment sizing, mathematical modeling, and simulations. Density data are useful to evaluate physical solubility of CO2 in solvent, mass transfer, and solvent kinetics. Viscosity data are important to estimate diffusivity using a modified Stoke–Einstein equation [9] that is required perform calculation of mass transfer and kinetics properties [10]. Further, such data are required to build thermodynamic models and to determine model parameters [11,12]. This study provides measured density and viscosity data of aqueous MDEA, DMEA, and DEEA mixtures at different concentrations and temperatures. Table 1 provides the molecular structures and IUPAC names of pure tertiary amines. Due to improved corrosion resistant materials, the trend is to discover more concentrated amine solutions. The excess properties evaluated from measured data were compared by discussing the molecular structure and intermolecular interactions of the different tertiary amines. Density and viscosity correlations were fitted to the measured data, and accuracy of the data fit were analyzed through average absolute relative deviation (AARD %) and absolute maximum deviation (AMD).
2. Materials and Methods
2.1. Sample Preparation
A description of the materials used in this work is listed in Table 2. A series of aqueous amine mixtures were prepared by mixing amines and water with different mass fractions. The deionized water (resistivity: 18.2 MΩ·cm) was degassed using a rotary evaporator (R-210, Buchi, Flawil, Switzerland) and used for the sample preparations. For the weight measurements, an electronic balance model—XS-403S from Mettler Toledo (Greifensee, Switzerland)—with a resolution of 1 mg was used to make a sample with 150 mL at each amine concentration.
2.2. Density Measurements
The density measurements of aqueous amine mixtures were performed using a DMA 4500 density meter from Anton Paar (Graz, Austria) operating at atmospheric pressure. The DMA 4500 is an oscillating U-tube density meter with an accuracy of ±0.05 kg·m3. The calibration of density meter was carried out using air and H2O at 293.15 K and a density check was performed with H2O at 293.15 K frequently to observe the validity of previous calibration. Additionally, the density of a density reference standard S3S from Paragon Scientific Ltd. (Prenton, United Kingdom) was measured and was compared with reference values to examine any possible deviations. A sample with approximately 5 mL was introduced to the borosilicate glass U-tube (~0.7 mL) using a syringe and allowed to reach the desired temperature before the density was measured. The cell was cleaned with water, followed by ethanol, and dried with air before the next density measurement. A new sample was fed into the cell during the experiments at each different temperature levels. Final density was reported as an average of three replicates.
2.3. Viscosity Measurements
A double-gap pressure cell XL in Physica MCR 101 rheometer from Anton Paar (Graz, Austria) was used to perform dynamic viscosity measurements in aqueous amine mixtures. The solution temperature (>303.15 K) was controlled by an internal temperature controlling system with standard temperature uncertainty 0.03 K. For the temperatures below 303.15 K, an external Anton Paar Viscotherm VT2 cooling system with standard temperature uncertainty 0.02 K was used to acquire precise temperature control [13]. In the experiments, a liquid sample with a volume of 7 mL was transferred into the pressure cell using a syringe. An adequate time was given to the sample to reach the desired temperature before taking the viscosity measurements. The experiments were repeated for three times and the final viscosity was reported as the average of 120 different readings at each temperature levels. An air check and motor adjustment were carried out prior to the experiments as suggested by Anton Paar to examine the performance of the bearing in the rotating parts. A generally used viscosity reference standard S3S from Paragon Scientific Ltd. was used to calibrate the measuring system at different temperatures. The possible viscosity deviations were recorded by comparing measured viscosity of standard oil with reference values at corresponding temperatures provided by the supplier, and corrections for the measured viscosity were made accordingly. For the temperature levels not defined by the supplier, viscosity deviations were found by interpolation. Table S1 in the supplementary material provides the information of viscosity deviations at different temperatures.
2.4. Measurement Uncertainty
Following uncertainty sources of material purity u(pu), temperature measurement u(T), weight measurement u(w), calibration u(c), and repeatability u(rep) were considered to evaluate combined standard uncertainty of density and viscosity measurements of aqueous amine mixtures.
The specified standard uncertainties for the uncertainty of density measurement were u(pu) = 0.006, (pu) = 0.006, u(T) = 0.012 K, u(w) = 2 × 10⁻⁴ kg, u(c) = 0.01 kg·m−3, and u(rep) = 0.13 kg·m−3. The maximum gradient of density against temperature, , was found to be 1.2 kg·m−3·K−1, and the corresponding uncertainty in ρ, , was determined to be 0.02 kg·m−3. The combined standard uncertainty for the density measurement was calculated as described in the Guide to the Expression of Uncertainty in Measurement [14,15] by considering all mentioned uncertainty sources to be u(ρ) = 5.9 kg·m−3. Then, the combined expanded uncertainty of the density measurement U(ρ) was found to be 11.8 kg·m−3 (level of confidence = 0.95).
For the uncertainty of viscosity measurement, specified standard uncertainties for the uncertainty sources were u(pu) = 0.006, u(T) = 0.012 K, u(w) = 2 × 10⁻⁴ kg, u(c) = 0.065 mPa·s, and u(rep) = 0.008 mPa·s. Then the combined standard uncertainty for the viscosity measurement was calculated to be u(η) = 0.07 mPa·s. The combined expanded uncertainty of the viscosity measurement U(η) was found to be 0.14 mPa·s (level of confidence = 0.95).
3. Results and Discussion
3.1. Density and Excess Molar Volume of the Binary Mixtures
The measured densities of pure MDEA, DMEA, and DEEA in the temperature range from 293.15 K to 353.15 K under atmospheric pressure are listed in Table 3. A comparison of measured densities of pure amines in this study with available literature data indicates that the instrument was calibrated properly prior to all experiments. The density of the aqueous amine mixtures was measured in the temperature range from 293.15 K to 343.15 K under atmospheric pressure. In the Appendix, the measured densities are presented in Table A1, Table A2, and Table A3 under different mass fractions, mole fractions, and temperatures.
Density of pure and aqueous amine mixtures decreases with increasing temperature. For the MDEA + H2O mixtures, the density starts to increase with MDEA concentration from x1 = 0 and reach a maximum value and then decreases. A shift of maximum from x1 = 0.3 at 293.15 K to x1 = 0.28 at 353.15 K was observed due to the influence from temperature. The density of DMEA + H2O and DEEA + H2O mixtures continues to decrease from x1 = 0, and a minimum was observed at x1 = 1. A comparison of measured density of aqueous mixtures with literature from authors Concepcion et al. [21] and Hawrylak et al. [16] is included in the supplementary materials. The comparison showed a good agreement between measured densities with available density data in the literature.
The excess molar volume VE of a binary mixture is given by Equations (1) and (2) and is a property that can be used to fit density data of a binary mixture. The sign of VE carries information of intermolecular interactions and molecular structure of the molecules in a mixture. The excess molar volume VE becomes negative when the intermolecular interaction between unlike molecules are stronger than that in like molecules [22,23]. Further, VE is negative when the molecules are efficiently packed in the solution [24]. For the mixtures having weak intermolecular interactions such as dispersion forces have positive deviation for VE [25].
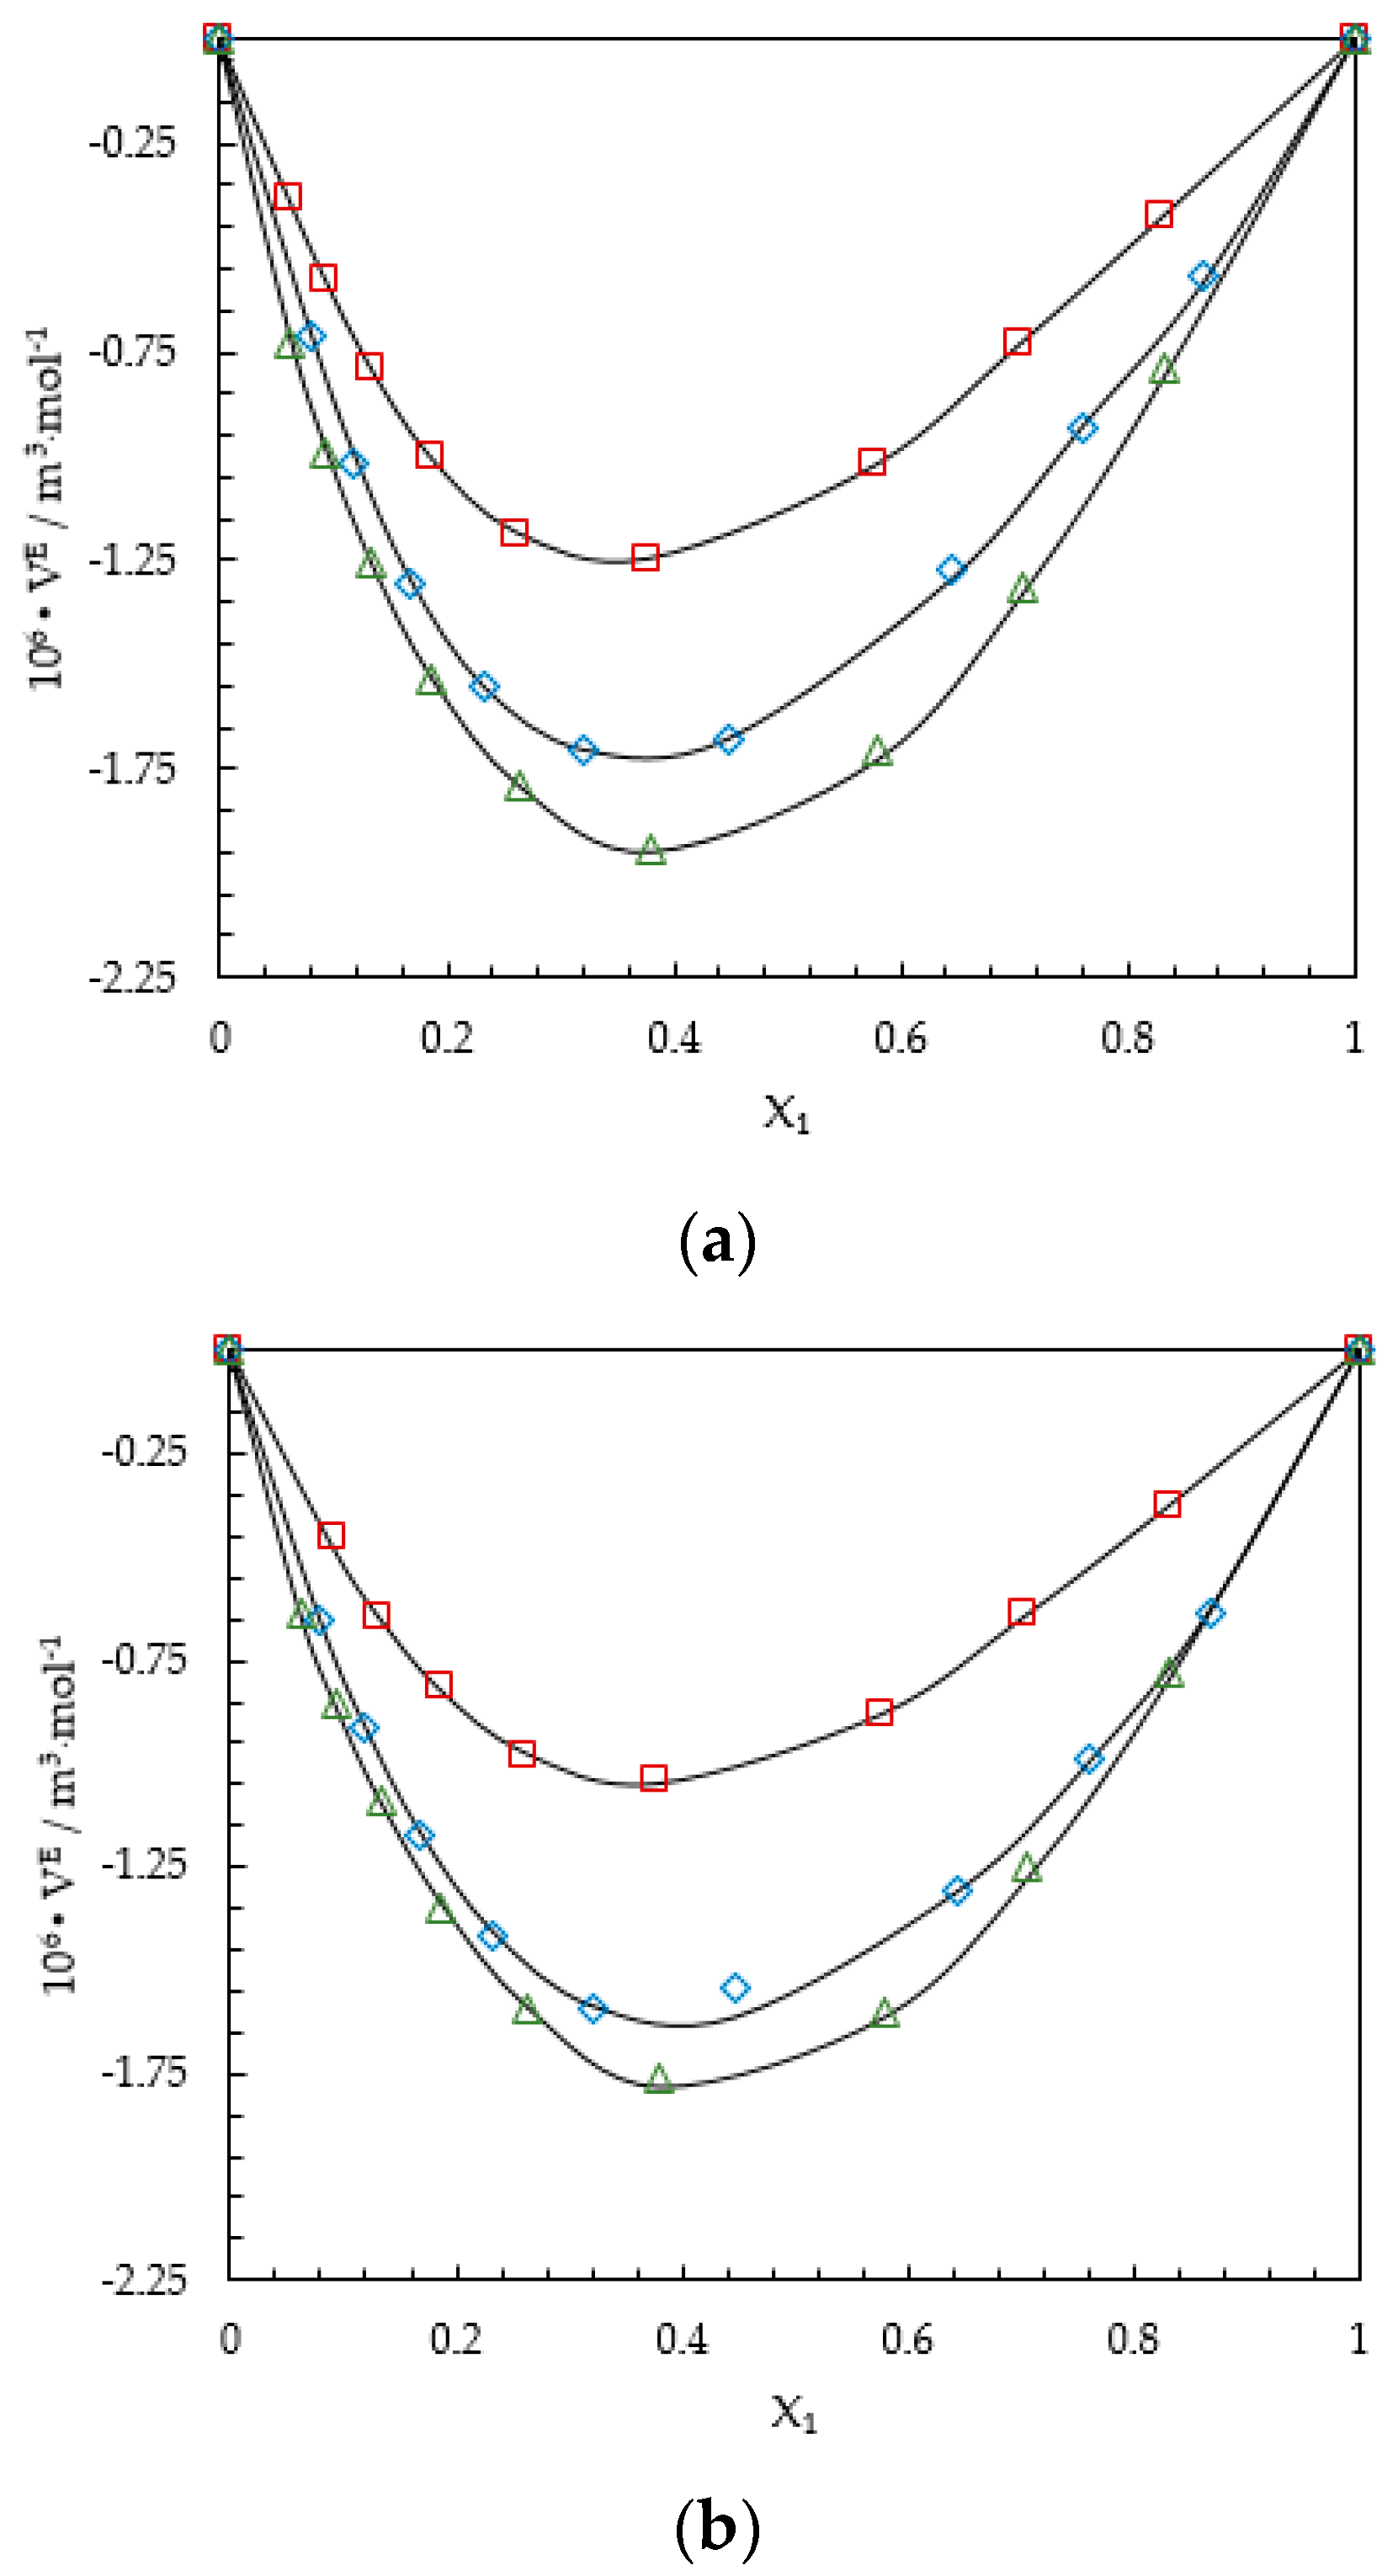
The calculated VE for MDEA + H2O, DMEA + H2O, and DEEA + H2O are shown in Table A1, Table A2, and Table A3, respectively. The density of pure H2O was taken from the reference [26]. A negative deviation for VE was observed for the whole range of amine concentration with a minimum in H2O-rich region at x1 of 0.36, 0.38, and 0.38 for MDEA, DMEA, and DEEA, respectively. This indicates the existence of strong intermolecular interactions like H-bonds among unlike molecules and efficient packing of molecules in the mixtures. Figure 1a,b compares the variation of VE between three different mixtures at 293.15 K and 353.15 K.
A negative VE or a volume contraction in the systems further reveals that considered tertiary amines and H2O are completely miscible (polar organic solvent + H2O) systems [27]. The calculated VE for MDEA + H2O mixtures showed the lowest deviation for the range of amine concentrations compared to DMEA + H2O and DEEA + H2O mixtures. The largest deviation for VE was observed in DEEA + H2O mixtures, indicating the existence of strong intermolecular interactions and efficient molecular packing in the mixtures. Compared to VE of MDEA, a significant deviation was reported with DMEA (≈1.4 times) and DEEA (≈1.6 times) at the minimum point of 293.15 K. The substitution of one methyl (-CH3) group for one ethanol (-CH2CH2OH) group in MDEA might results an increase of intermolecular interactions especially the H-bonding between N and OH in amine and H2O or increase of packing efficiency. Two ethyl groups (-CH2CH3) in DEEA compared to two methyl (-CH3) groups in DMEA further negatively contributed to VE. The introduction of methyl (-CH3) or ethyl (-CH2CH3) groups increases the hydrophobicity of amine [19]. As explained by Begum et al. [23], the H2O molecules restructure around the hydrophobic part of the organic solute forming a cage-like structure. Accordingly, more structured H2O molecules around the hydrophobic groups (-CH3) and (-CH2CH3) in DMEA and DEEA, respectively, might explain the reported volume contraction in the mixtures.
A Redlich–Kister [28] type polynomial as given in the Equation (3) was proposed to fit calculated VE for all aqueous mixtures. The measured densities at low amine concentrations (< 30% mass) presented in literature for MDEA + H2O mixtures from Maham, Teng, Mather, and Hepler [17], DMEA + H2O mixtures from Maham et al. [18], and DEEA + H2O mixtures from Lebrette et al. [20] were adopted for this work to improve the accuracy of data fitting into the proposed correlation. A temperature dependency for the Redlich-Kister coefficients (Ai) was suggested as given in Equation (4) to determine optimum values for (Ai) at each temperature. Table 4 lists the parameters for temperature dependency of the Redlich-Kister coefficients (Ai) for VE of different mixtures.
The partial molar volume of each component is defined as shown in Equation (5)
For a binary mixture, partial molar volume can be determined by the following equations [29]:
Equations (8) and (9) can be derived by differentiating Equation (3) for VE with respect to x2 and combining it with Equations (6) and (7).
The partial molar volume of amines at infinite dilution in H2O can be determined by considering the scenario of x2 = 1 as given in the Equation (10) and partial molar volume of H2O at infinite dilution in amines can be found by considering the scenario of x2 = 0 as shown in Equation (11).
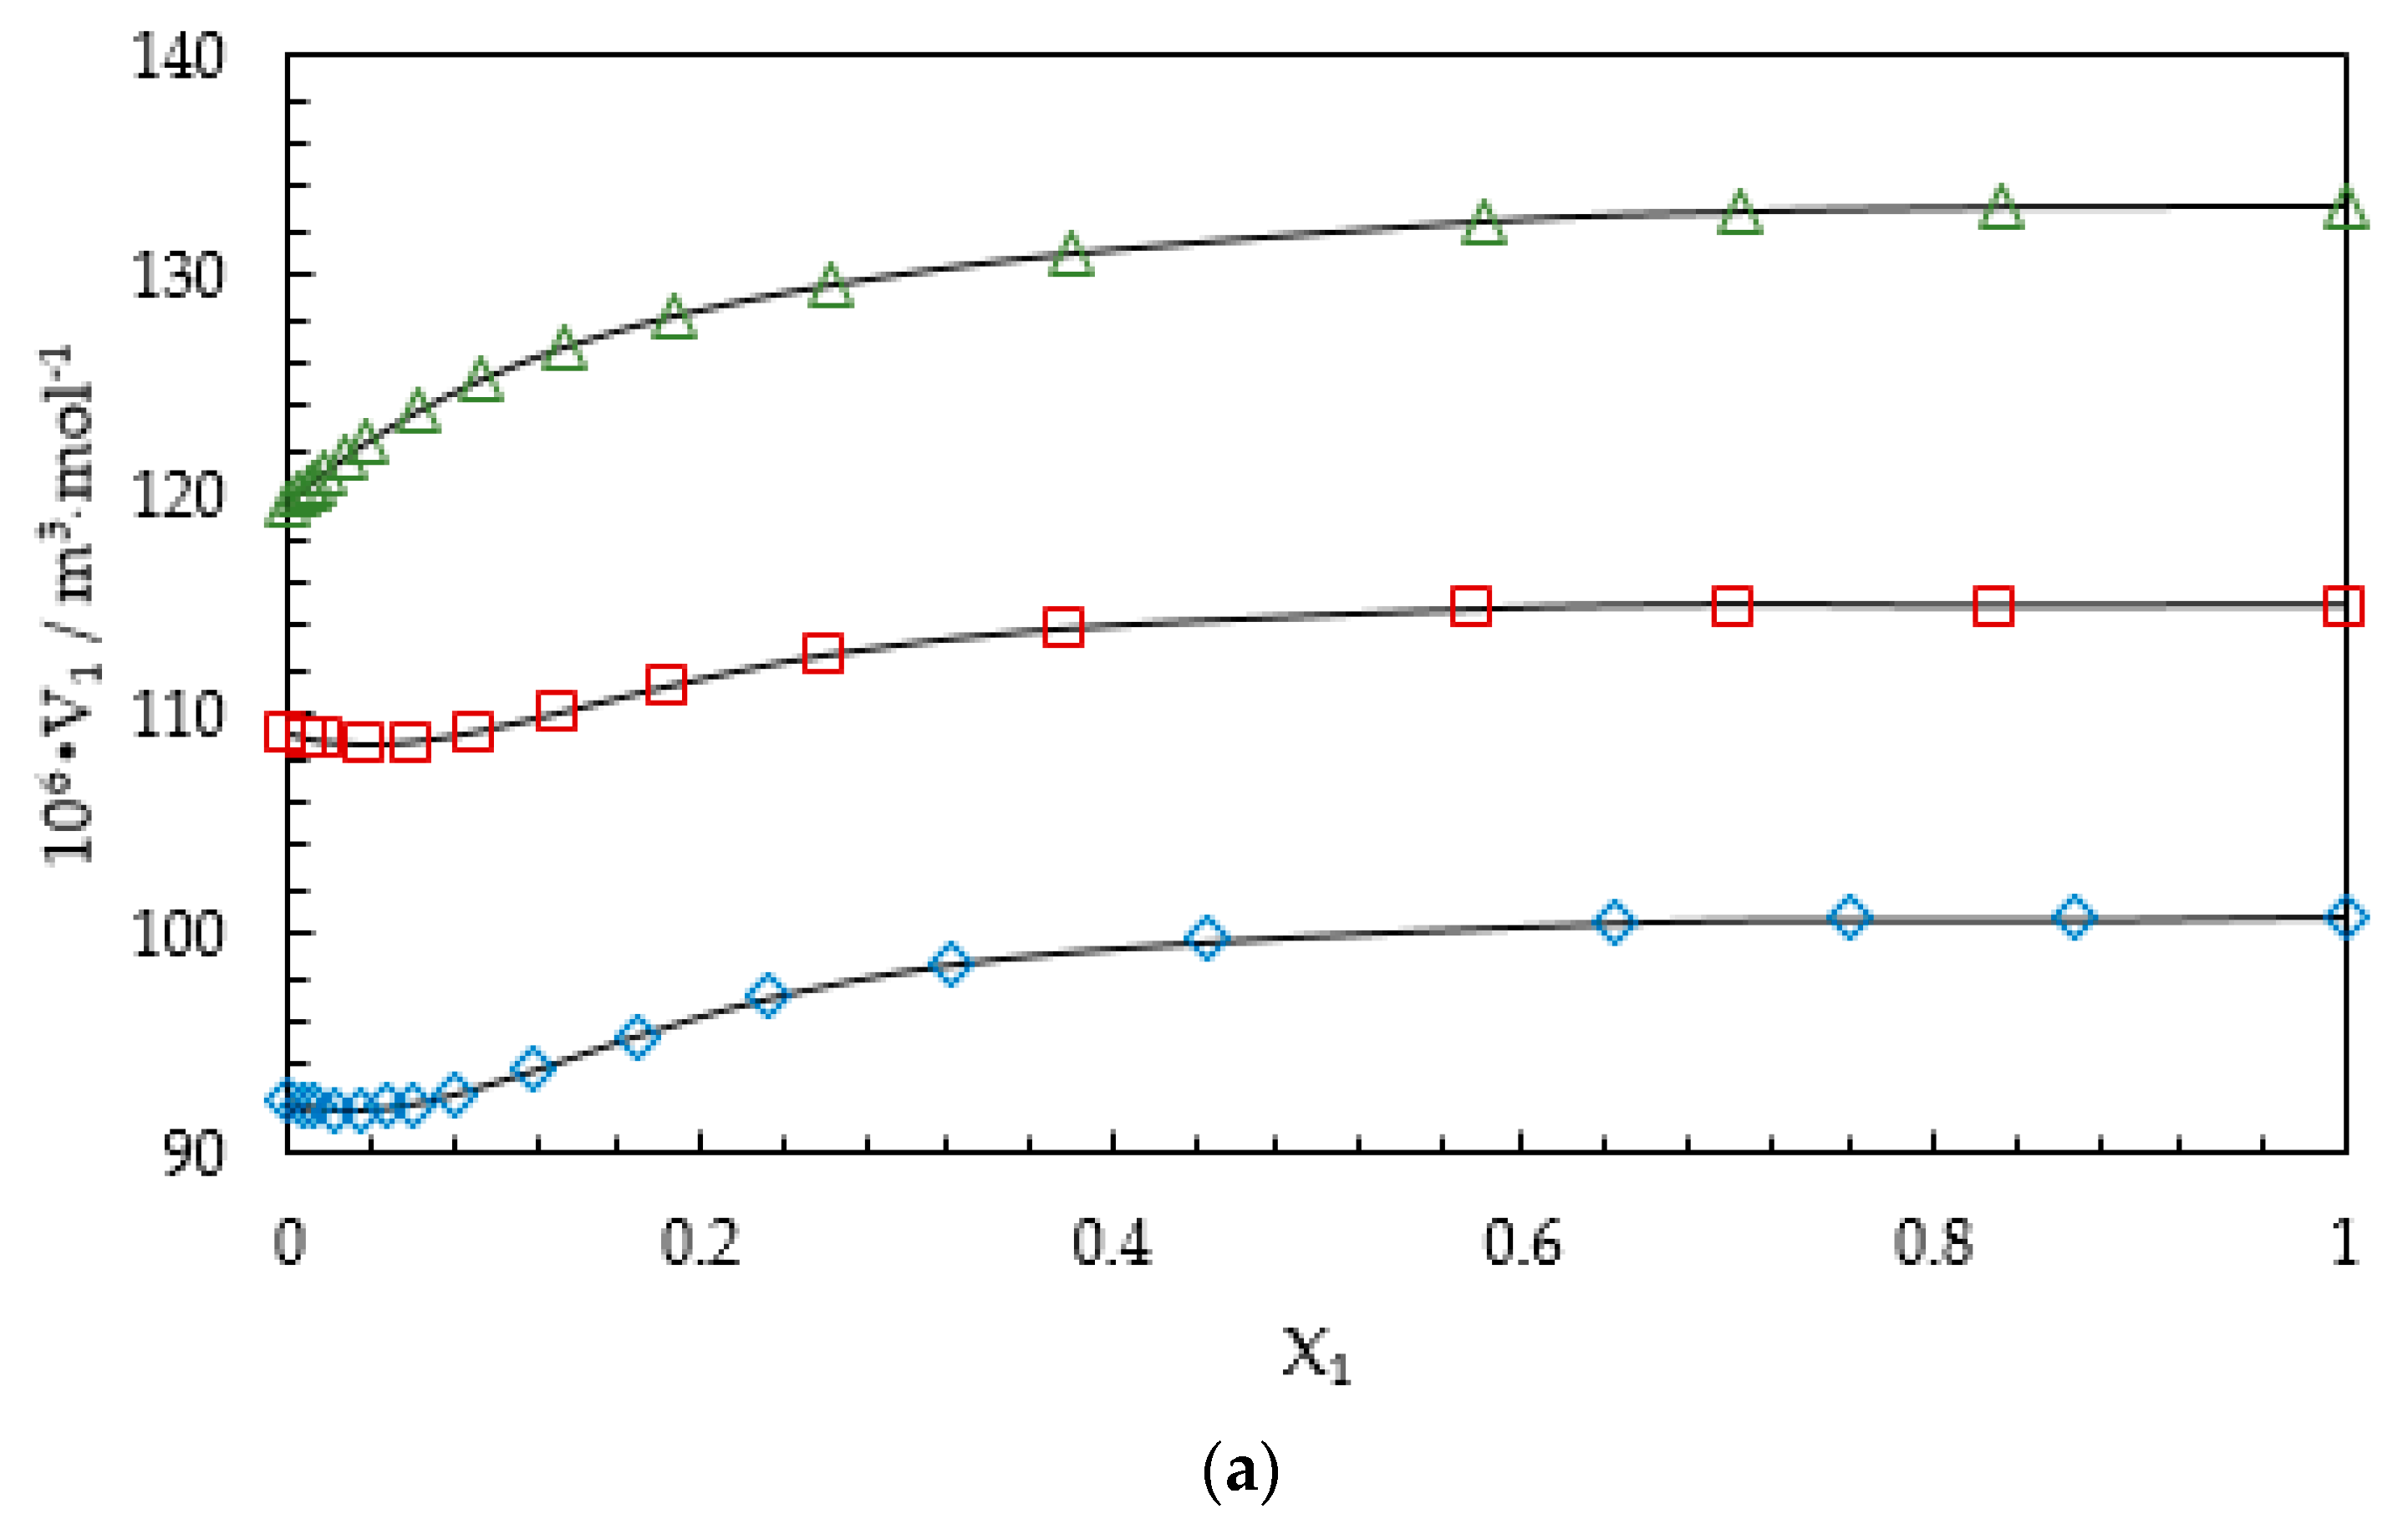
Table A4 presents the calculated partial molar volume of amines at infinite dilution in H2O with molar volume of pure amines. The proposed temperature dependency for the Redlich-Kister coefficients (Ai) was able to calculate with a deviation around 1% AARD compared to literature data. The partial molar volume of amines were smaller than the corresponding molar volume of pure amines. This can be explained for MDEA, DMEA and DEEA by the existence of (partially) ice-like structure in pure H2O [30], which is more open than a nearly close packed arrangement, enables to fit (partially) amine molecules into the open or empty spaces in liquid H2O [29]. Hepler [30] explained structure making solute and structure breaking solute based on the sign of , in which the positive sign is associated with structure making solute, while the negative sign is associated with structure breaking solute. The study shows that for all considered tertiary amines, variation of with temperature is linear (R2 > 0.999) by making the first derivative of with respect to temperature a positive constant. This does not provide any information about second derivation for a positive or a negative sign. A similar observation was reported by Maham, Teng, Hepler, and Mather [29] for MDEA. Accordingly, this does not indicate that MDEA, DMEA, and DEEA in dilute aqueous mixtures can be considered as either net structure makers or net structure breakers. Figure 2a,b illustrate the composition dependence of the partial molar volume of MDEA in (MDEA + H2O), DMEA in (DMEA + H2O), and DEEA in (DEEA + H2O) at 298.15 K and 353.15 K, respectively. Figure 2a shows a minimum value for around x1 = 0.04 for MDEA and DMEA at 298.15 K and it disappears with the increase of temperature, as shown in Figure 2b.
The accuracy of the data fit was determined by average absolute relative deviation (AARD) and absolute maximum deviation (AMD) as given in Equations (12) and (13). A density correlation based on a Redlich-Kister type polynomial for VE and density deviation defined as ln(ργ) in Equation (15) were examined to fit the measured densities of MDEA + H2O, DMEA + H2O and DEEA + H2O mixtures at different concentrations and temperatures.
Average absolute relative deviation:
Absolute maximum deviation:
For binary mixtures, the use of excess molar volume to correlate mixture density is a widely adopted approach described in Equation (14). The evaluated correlation parameters for different mixtures are listed in Table 5 with relevant AARD and AMD.
For MDEA + H2O mixtures, a maximum deviation of measured density from the correlation was found at MDEA mole fraction x1 = 0.0916 and temperature 353.15 K. Similarly, for DMEA + H2O and DEEA + H2O mixtures, maximum deviations were reported at x1 = 0.447 and x1 = 0.0618 at temperature 353.15 K and 293.15 K, respectively. Table 5 lists the calculated parameters for the correlation based on density deviation with corresponding AARD and AMD for each binary mixture. It was observed that MDEA + H2O shows a maximum deviation of measured density from the correlation at x1 = 0.5764 at 293.15 K. For the DMEA + H2O mixtures, a maximum deviation of measured density from the correlation was found at x1 = 0.1187 at 293.15 K, while DEEA + H2O mixtures revealed a maximum deviation at x1 = 0.0618 at 293.15 K. The study showed that the correlation based on VE for density provided higher accuracies in the data fits. However, the reported accuracies from both considered correlations are acceptable to use them in the engineering calculations.
3.2. Viscosity of the Binary Mixtures
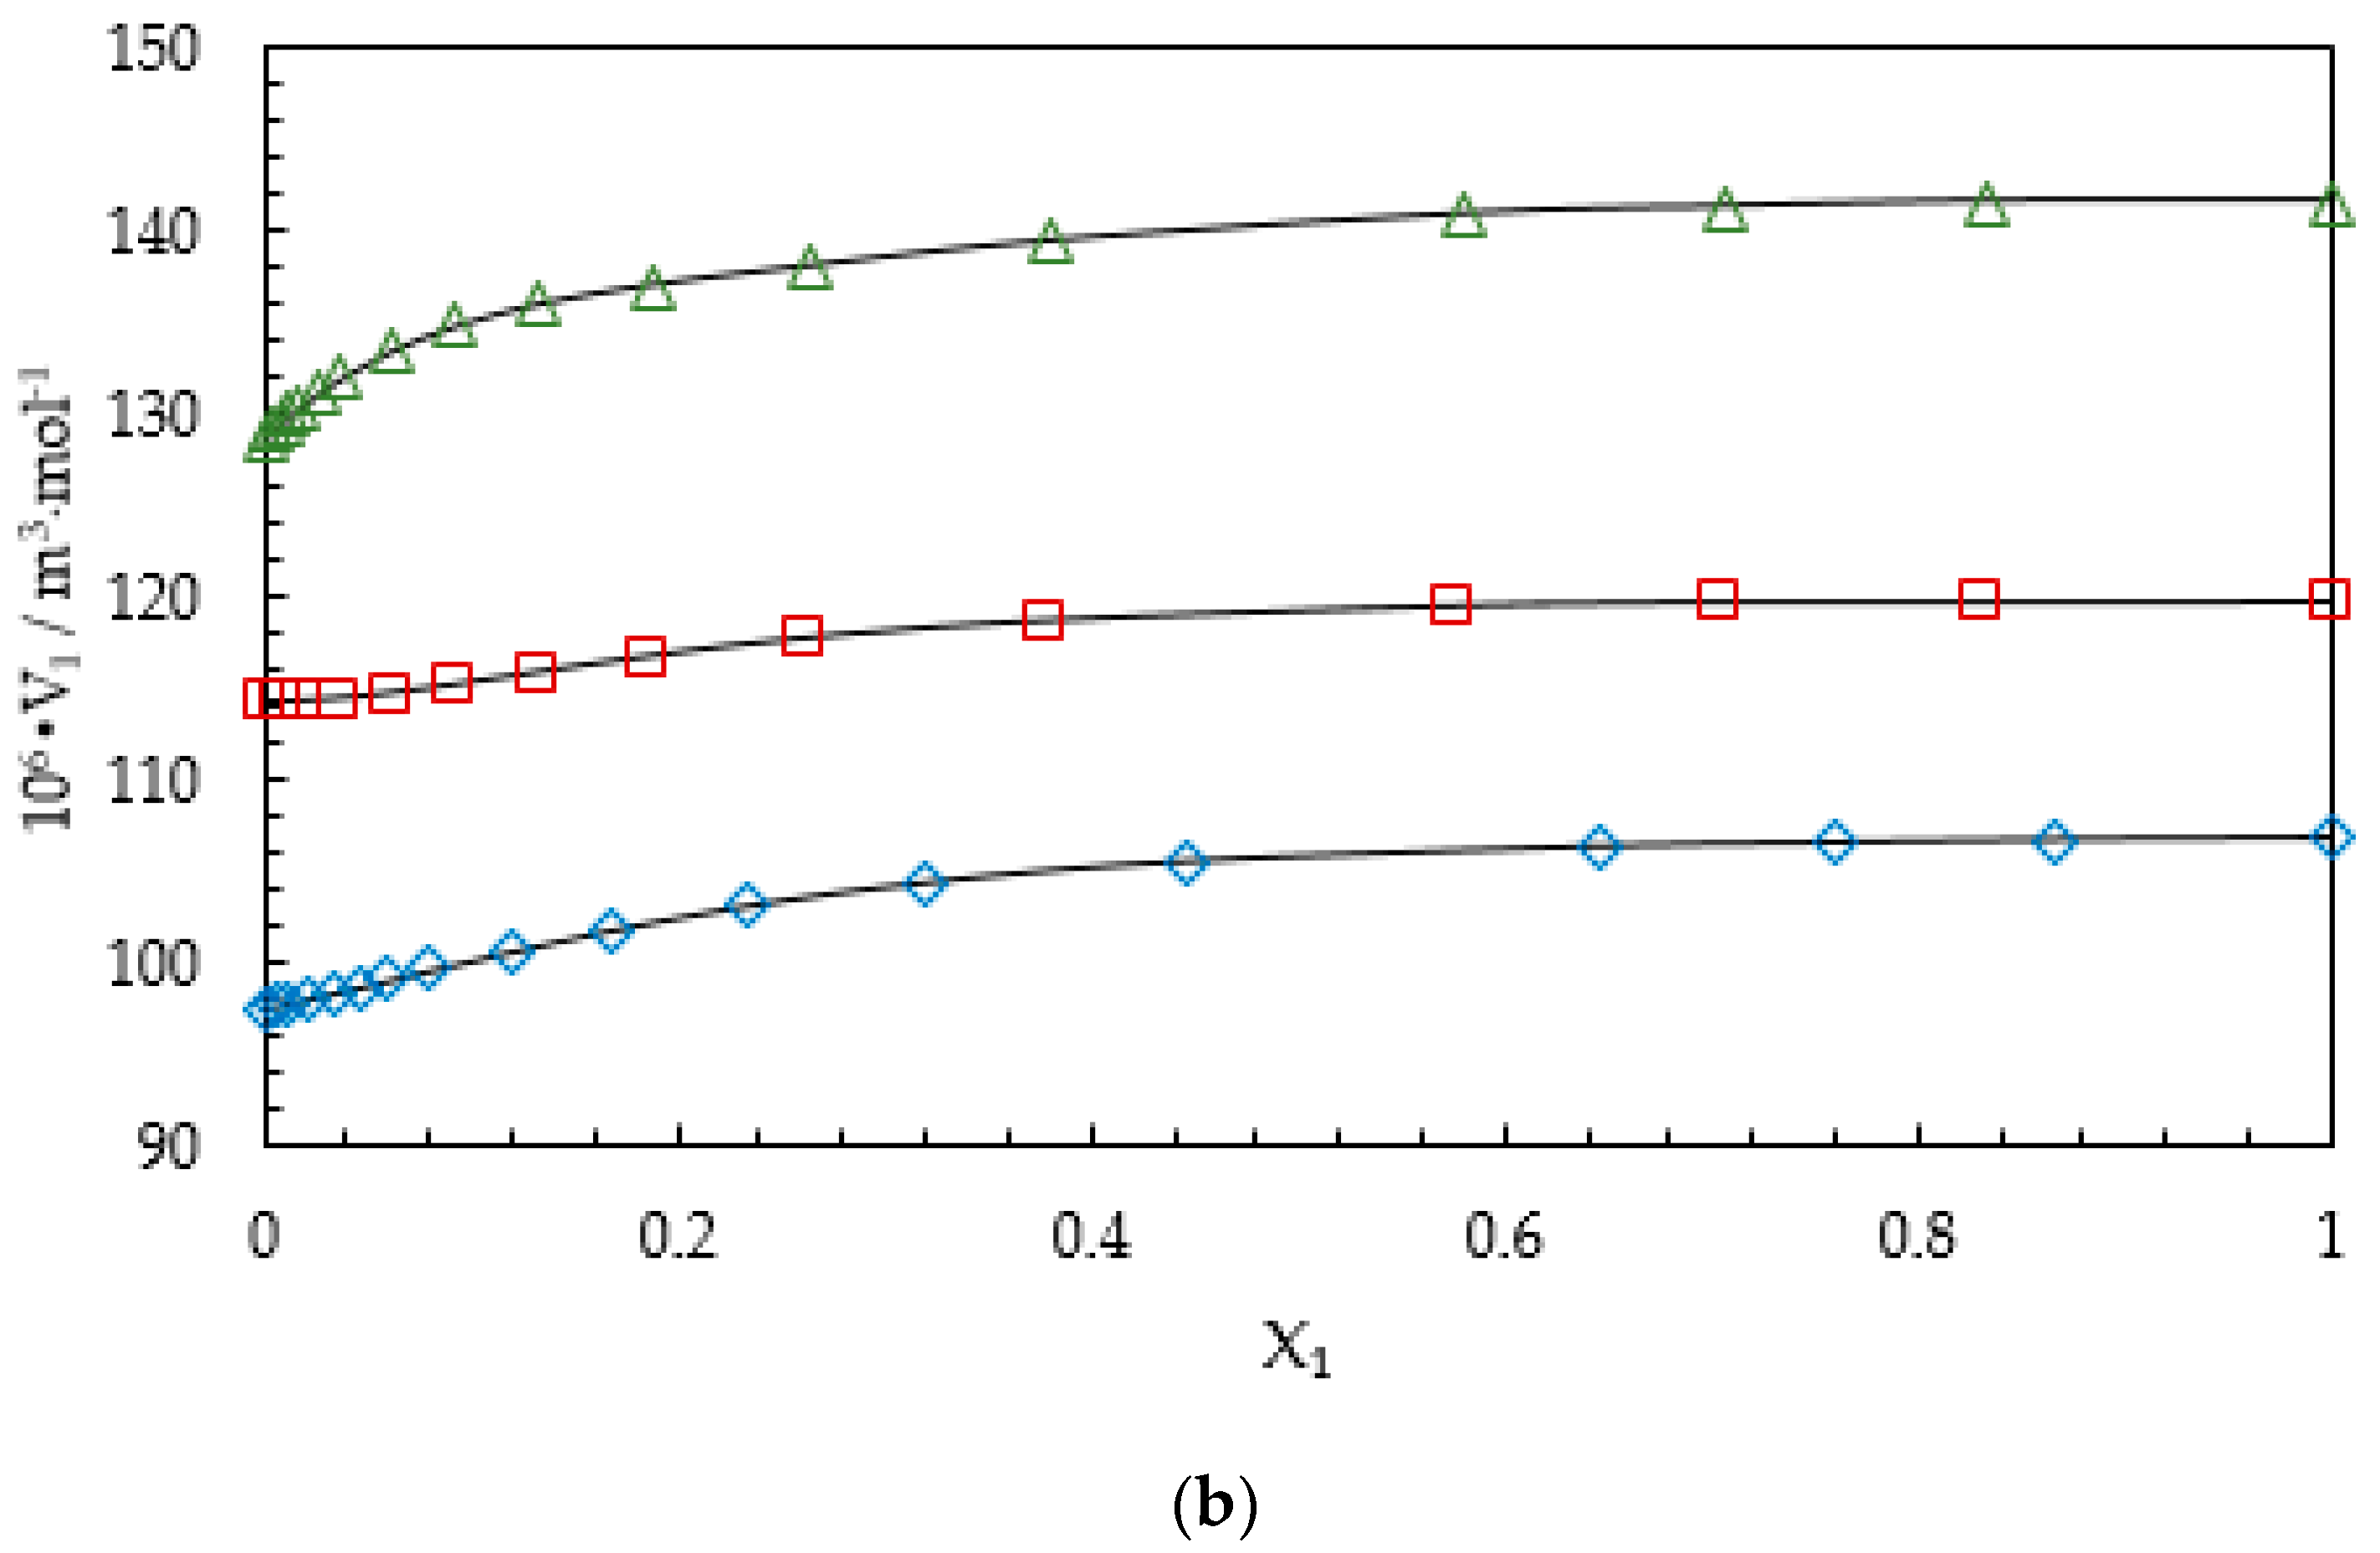
A comparison of measured viscosity of pure amines in this study with available data in the literature is given in Table 6. The study shows that measured viscosities agree with literature data with around 3.5% AARD. The measured viscosities of the binary aqueous mixtures are shown in Table A5, Table A6, and Table A7. The mixture viscosity varies with the composition and temperature. For the MDEA + H2O mixtures at 293.15 K, a maximum viscosity was observed around . The study shows that DEEA + H2O mixtures have a maximum viscosity around x1 = 0.36 at 293.15 K and the DMEA + H2O mixtures exhibit a maximum viscosity around x1 = 0.38 at 293.15 K. The measured viscosities of aqueous mixtures were compared with viscosities presented by Concepcion et al. [21], Teng et al. [31], Garcia et al. [32], and Maham et al. [33] in the supplementary materials. Figure 3 compares viscosity variations of different aqueous amine mixtures at 293.15 K.
The viscosity deviation ηE or the excess viscosity of the mixtures is calculated as shown in Equation (17). The viscosity of pure H2O was taken from Korson et al. [34].
According to Kauzmann and Eyring [35], the viscosity of a mixture strongly depends on the entropy of the mixture that is related to the liquid’s structure and bond enthalpy and consequently with the intermolecular interactions between components in the mixture [36]. Hence, viscosity deviation is attributed to the difference in size and shape of the component molecules and molecular interactions between unlike molecules such as H-bonds (strong interactions) and dispersion forces (weak interactions). The value of ηE becomes positive due to the presence of strong interactions like H-bond formation [37] and ηE is negative where the weak interactions (weak dipole and dispersion forces) are dominant [37,38].
The semiempirical model suggested by Grunberg and Nissan [39] can be adopted to interpret the strength of the molecular interactions between components in a binary mixture [37]. The model is consisting of one adjustable parameter G12 that is beneficial to correlate dynamic viscosity of binary mixtures using pure component viscosities. The model for a binary mixture is given as follows.
The sign of G12 gives similar information as for the liquid mixtures. Accordingly, G12 is negative for systems in which dispersion forces are dominant and G12 become positive as the strength of the intermolecular interaction increases [37].
The dynamic viscosity model proposed by Eyring [40] based on the theory of absolute reaction rate provides another approach to examine the molecular interaction in a binary mixture. For a liquid mixture, the viscosity is represented according to the Eyring’s model as follows:
Accordingly, excess free energy of activation for viscous flow ΔGE* is defined as follows using pure component viscosities and molar volumes.
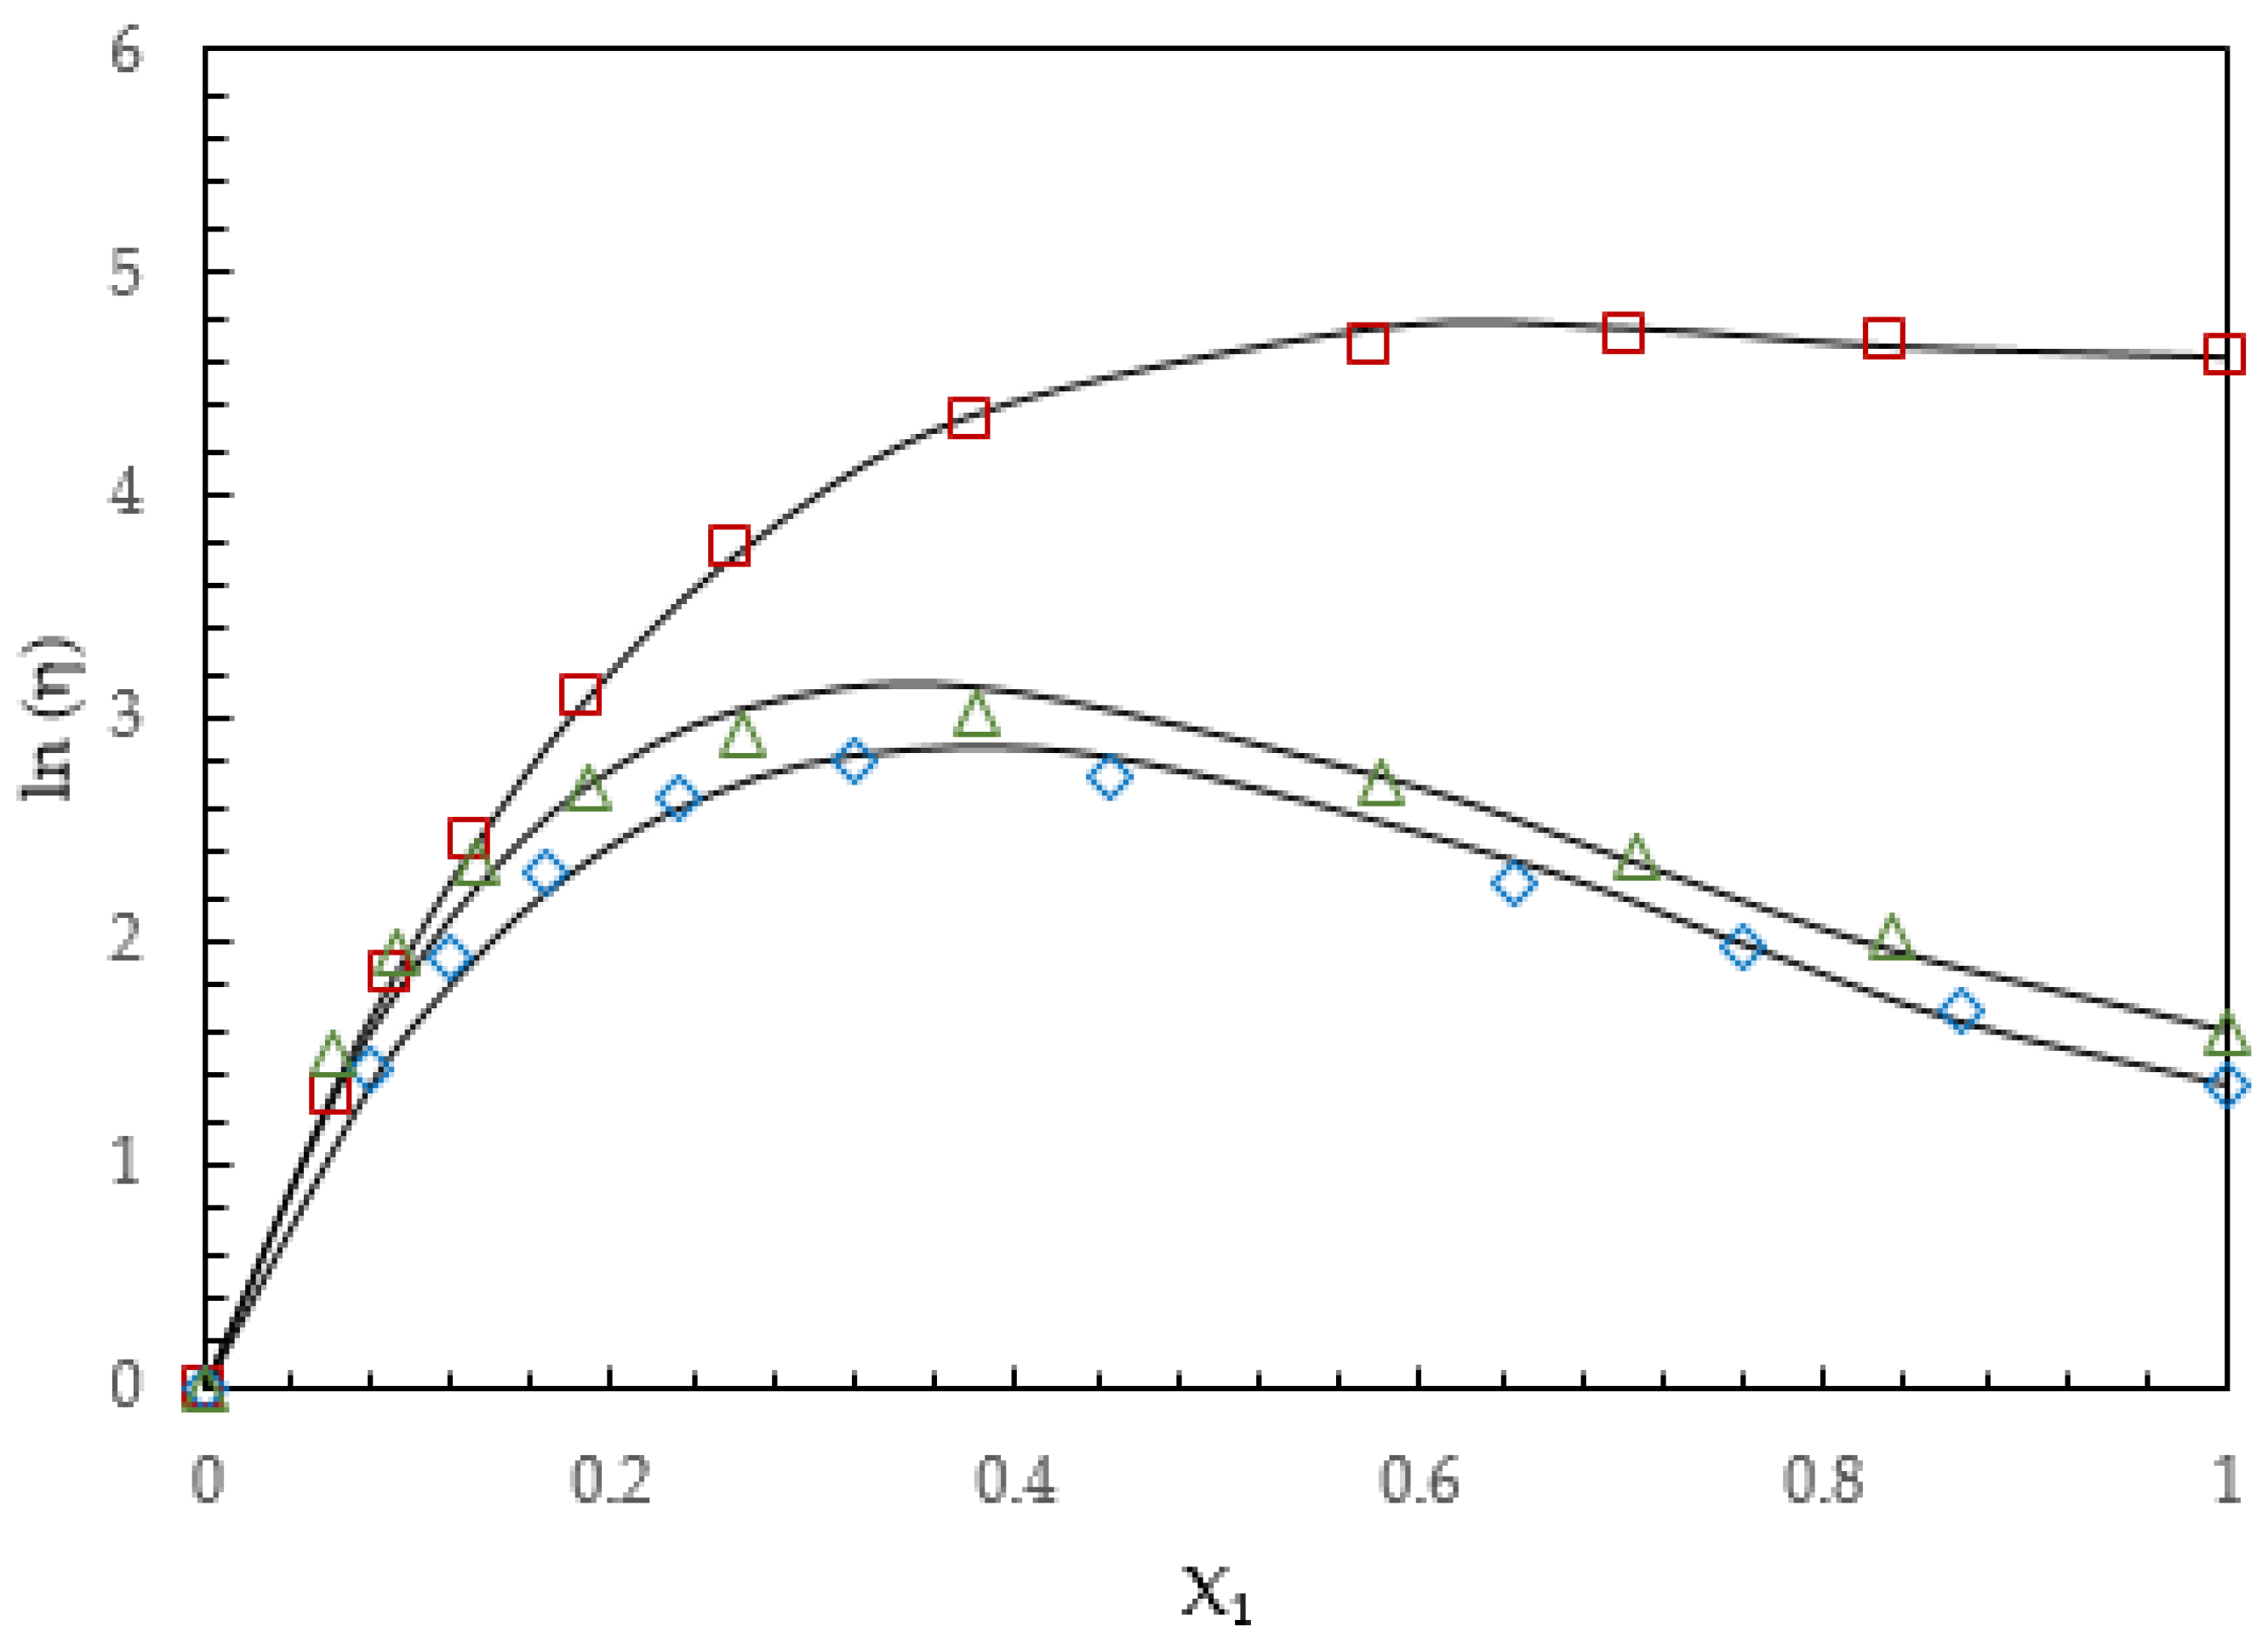
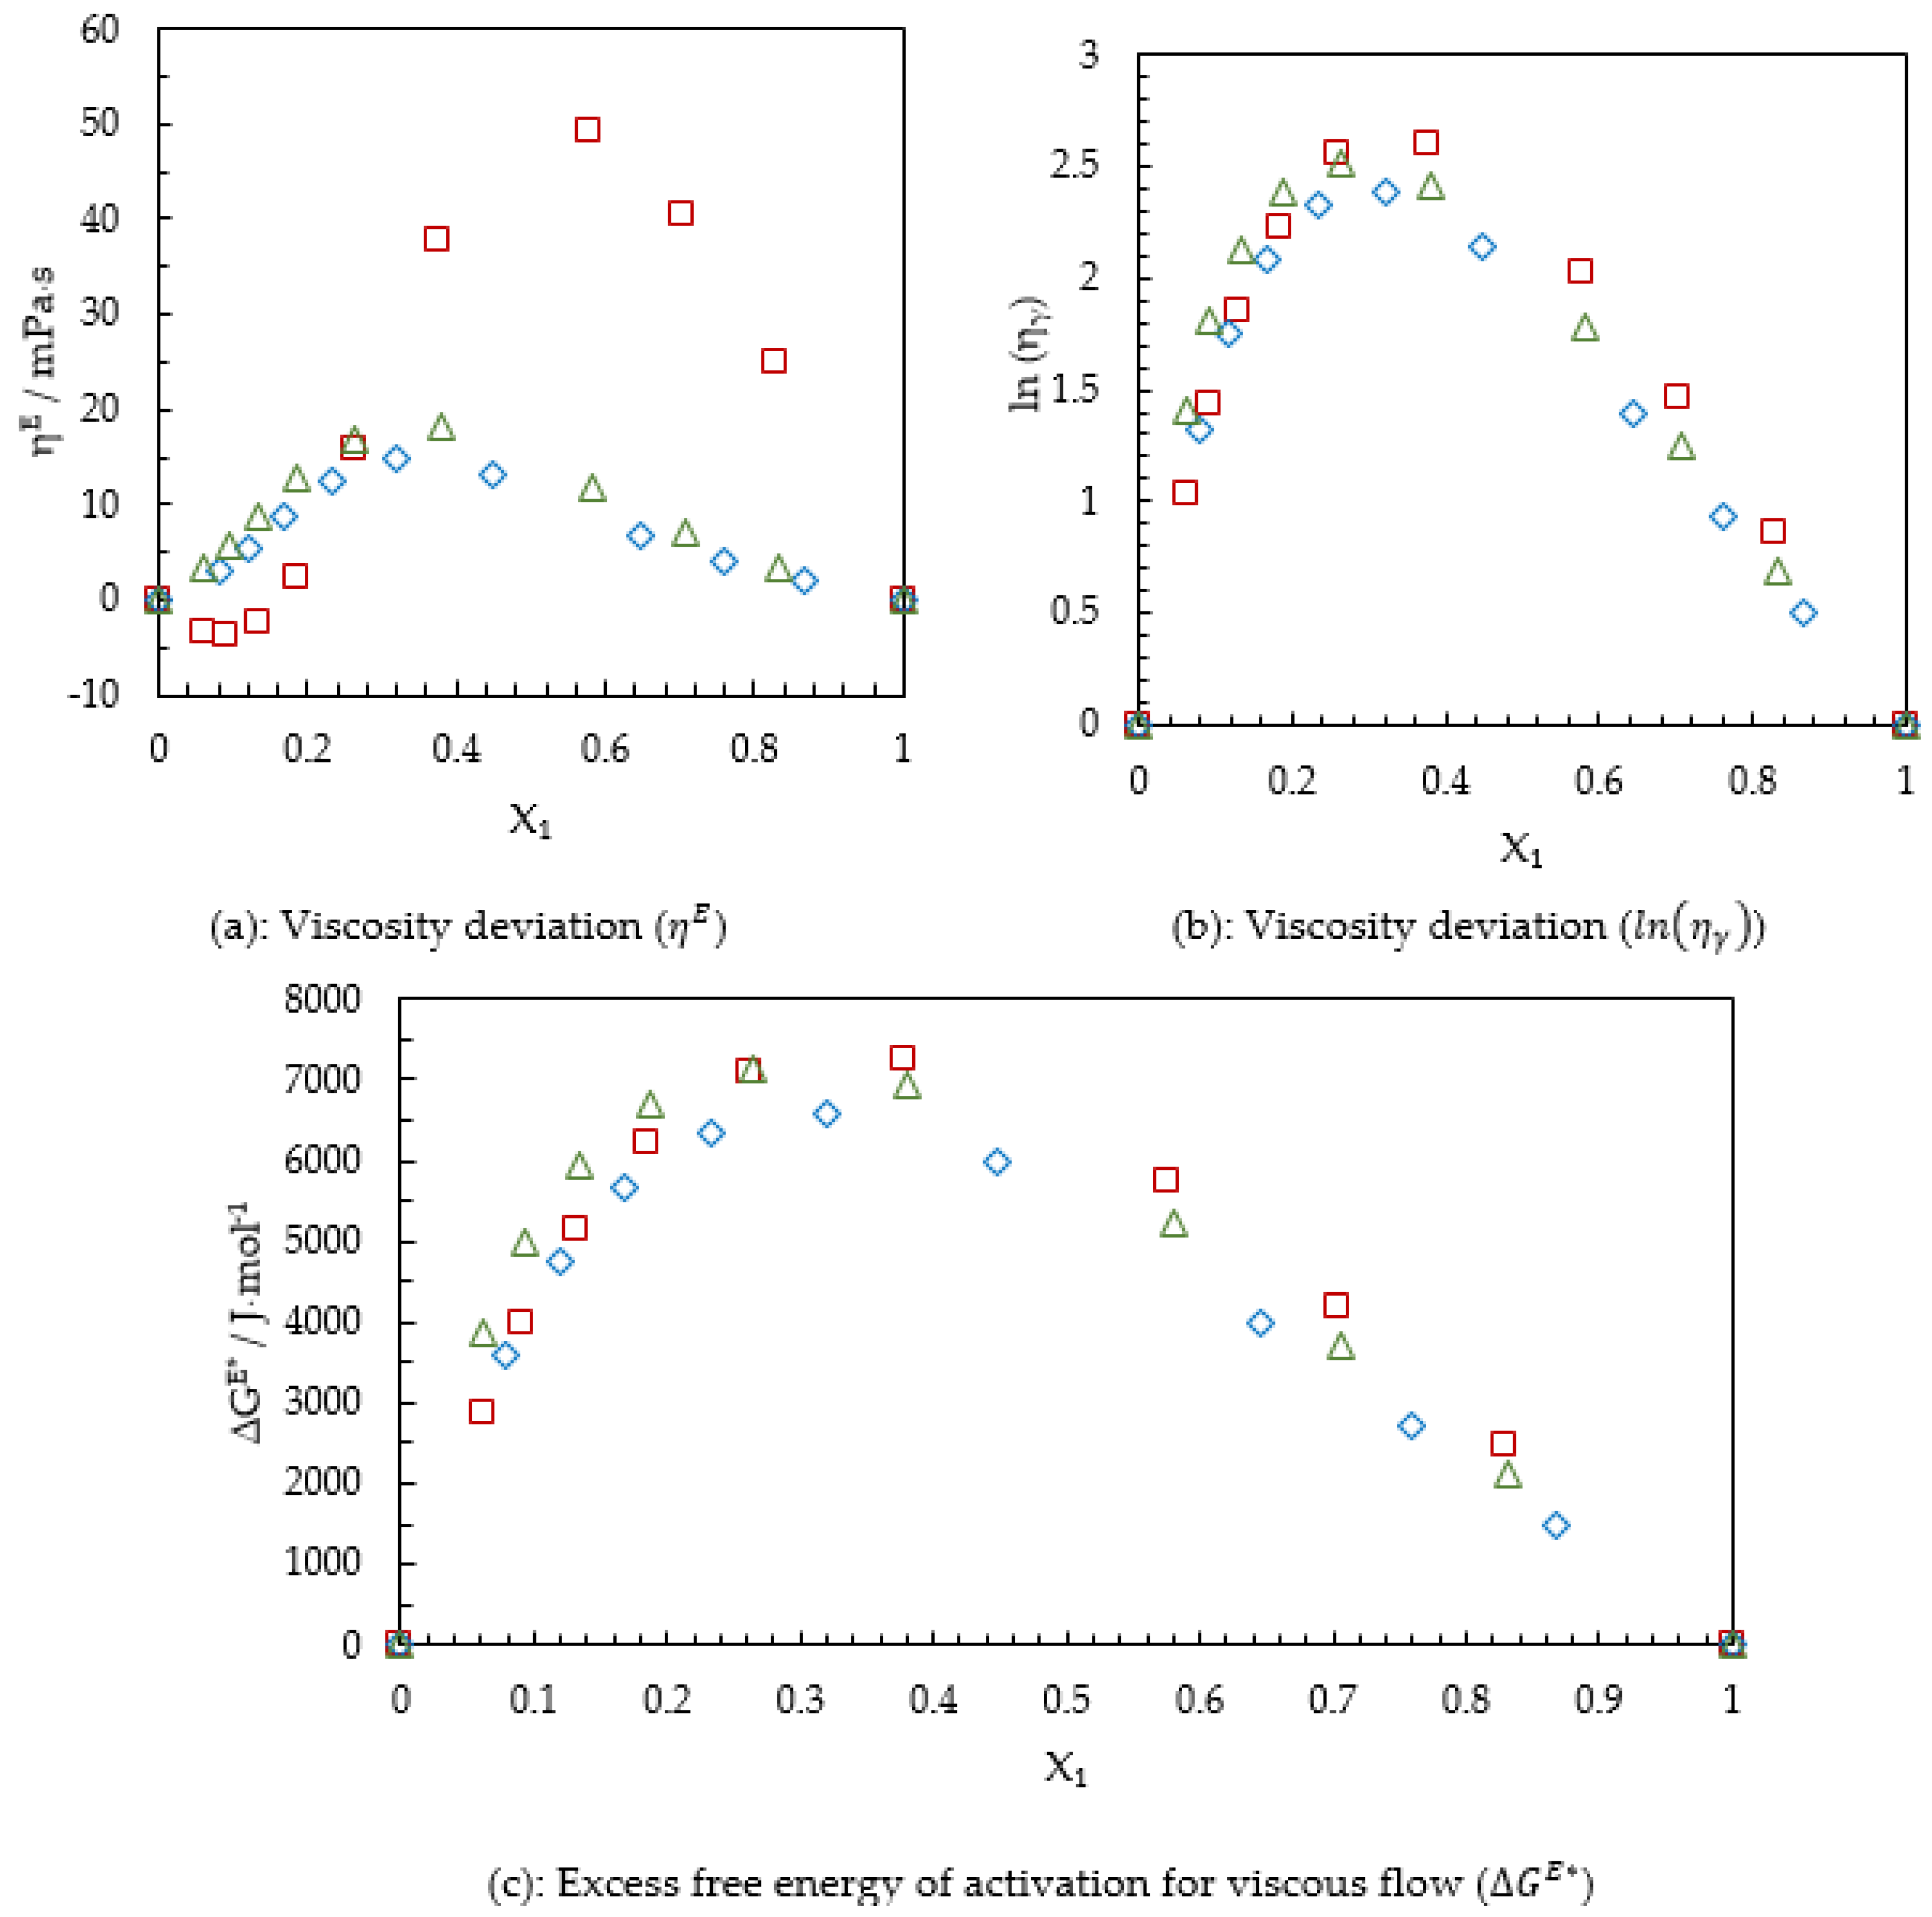
Meyer et al. [41] discussed the applicability of the sign of ΔGE* as in viscosity deviation ηE to understand the types of intermolecular interactions. It has been reported by authors [41,42,43,44] that the positive ΔGE* indicates strong interactions like H-bond and negative ΔGE* signifies weak molecular interactions like dispersion forces. The ln(ηγ) shown in Equation (22) is similar to the term x1x2G12 in the Grunberg and Nissan [39] model. Figure 4a–c illustrate the variation of ηE, ln(ηγ) and ΔGE* with amine concentration in different mixtures at 293.15 K.
Figure 4a shows that ηE was negative for low MDEA concentrations indicating the presence of weak intermolecular interactions like weak dipole and dispersion forces. As MDEA concentration increases, ηE becomes positive and shows a maximum in the amine-rich region, signifying the existence of strong intermolecular interactions like H-bonds among unlike molecules. The DMEA + H2O and DEEA + H2O mixtures showed positive deviation for ηE for the whole amine concentrations, revealing that the intermolecular interactions between those amines and H2O are stronger than interactions between like molecules. For DMEA + H2O and DEEA + H2O mixtures, the maximum ηE was observed in the H2O rich region. The highest positive deviation for ηE was reported by MDEA + H2O mixtures around x1 = 0.6 The DMEA + H2O and DEEA + H2O mixtures reached their highest ηE around x1 = 0.35. DMEA + H2O and DEEA + H2O mixtures showed a similar behavior for ηE, while MDEA + H2O mixtures showed deviations indicating the influence of (-OH) groups in MDEA on viscosity of aqueous mixtures. The calculated G12 and ΔGE* showed positive deviations for all considered aqueous amine mixtures for the whole range of amine concentrations. This shows that the considered aqueous amine mixtures are having strong intermolecular interactions among unlike molecules for the whole range of amine concentrations. The MDEA + H2O mixtures showed a highest peak around x1 = 0.35, while DMEA + H2O and DEEA + H2O mixtures showed peaks around x1 = 0.3 and x1 = 0.25, respectively. Figure 4c illustrates that DEEA + H2O mixtures have a higher ΔGE* in H2O rich region than MDEA + H2O mixtures and ΔGE* of MDEA + H2O showed higher values than DMEA + H2O and DEEA + H2O for the amine rich region. However, ΔGE* does not show a large deviation among the different amine mixtures as in ηE. This can be assumed due to the influence of molecular packing in the mixtures on viscous flow.
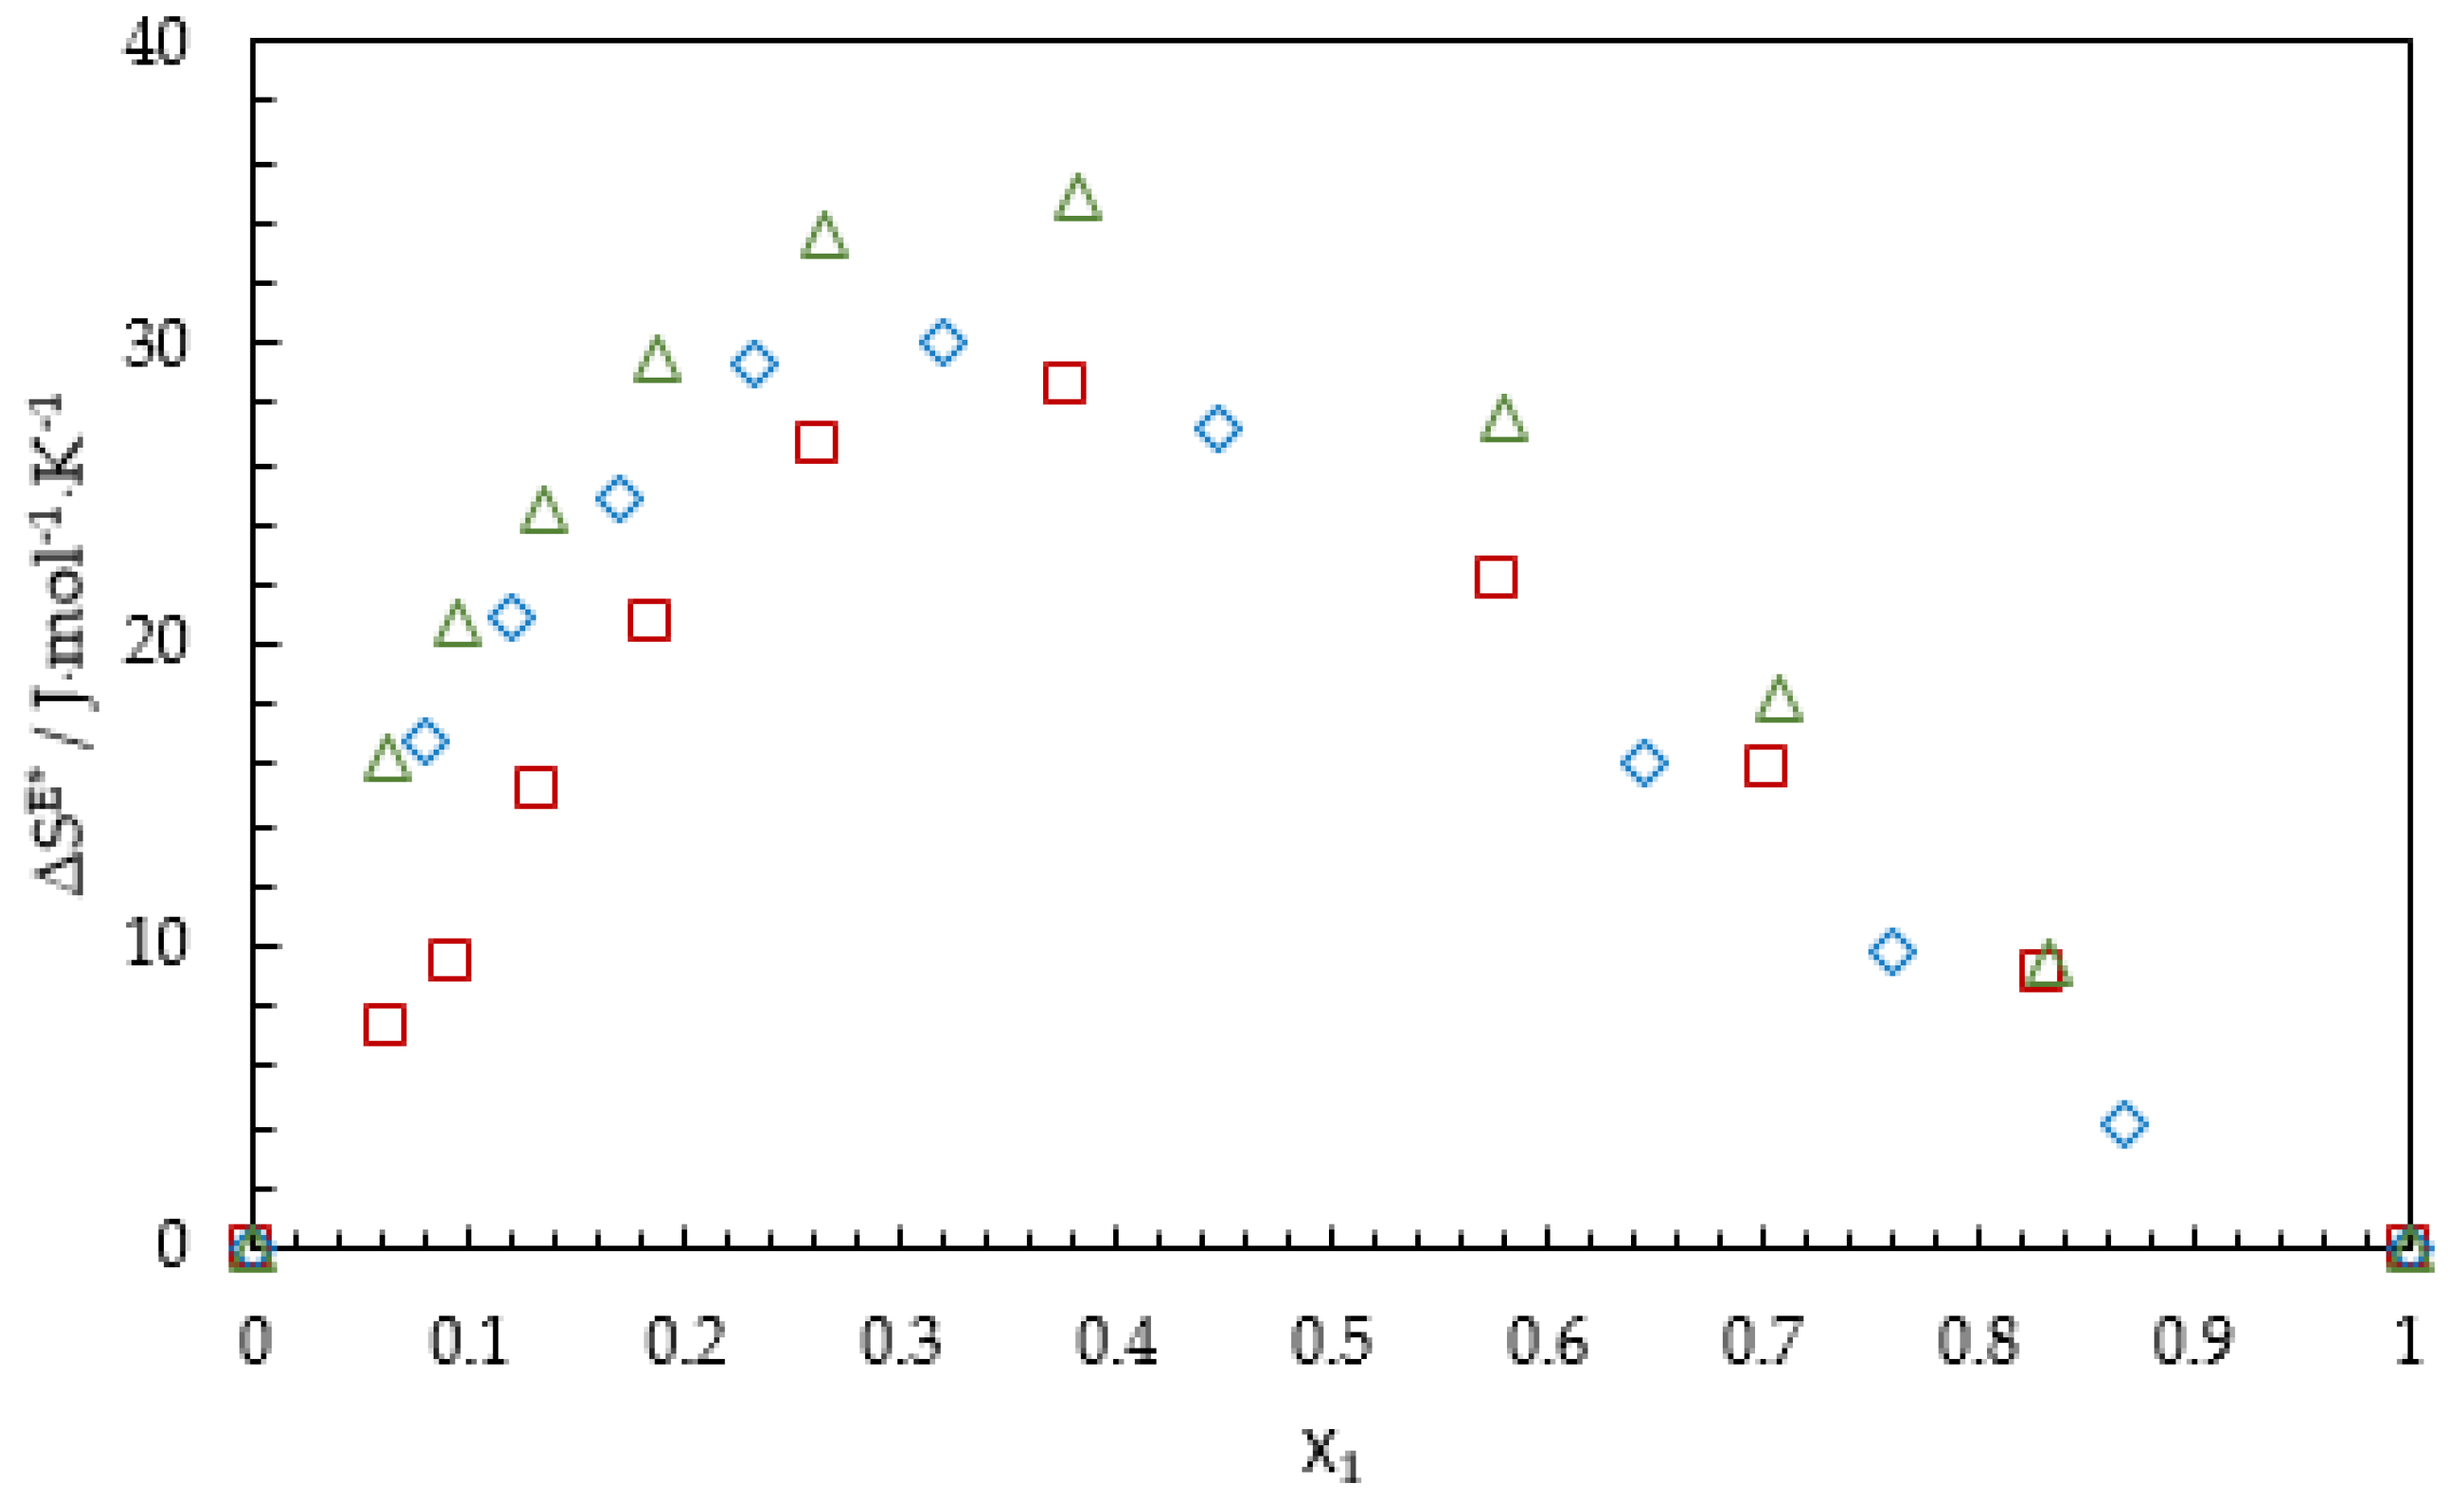
The slope of the excess free energy of activation for viscous flow ΔGE* against temperature (T) carries the information about the excess entropy of activation for viscous flow ΔSE* as given in Equation (23). The plot of ΔGE* versus temperature (T) was linear in the temperature range from 293.15 K to 363.15 K at a certain mole fraction for the mixtures studied.
Figure 5 illustrates the excess entropy of activation for viscous flow ΔSE* for MDEA + H2O, DMEA + H2O and DEEA + H2O mixtures over the whole range of concentrations. Equation (23) was adopted to calculate ΔSE* for temperature range 293.15–363.15 K. Similar to the ΔGE* variation with the mole fraction, ΔSE* increases with the increase of mole fraction up to a maximum and then decreases. The peaks were observed around x1 = 0.38 for MDEA + H2O and DEEA + H2O mixtures, while DMEA + H2O showed a peak around x1 = 0.32. The ΔSE* of DEEA + H2O mixtures was higher than that of MDEA + H2O and DMEA + H2O mixtures for the whole range of amine concentration.
The measured viscosities from 293.15 K to 363.15 K of the mixtures were fitted to the empirical correlation shown in Equation (22). The Redlich–Kister model [28] is a good candidate to correlate excess properties in a binary mixtures. In order to acquire a good accuracy in data fit, a higher degree polynomial is required with a large number of fitting parameters. A simplified lower degree polynomial was suggested as given in Equation (24). Similar work have been reported by Hartono et al. [45] for the viscosity of MEA + H2O mixtures.
Table 7 lists the calculated parameters of Equation (24) for different mixtures. The correlations provide acceptable accuracies for use in engineering calculations. For MDEA + H2O mixtures, AMD shows a relatively high deviation as 6.4 mPa·s, but measured viscosity is as high as 114.261 mPa·s.
McAllister [46] developed a semiempirical model based on Eyring’s theory of absolute reaction rates to represent kinematic viscosities in a binary mixture. The McAllister [46] three-body model considered interactions among three molecules that are all in one plane.
The McAllister’s three-body model:
McAllister’s three-body model have two fitting parameters of v12 and v21. For each type of ΔG* considered during the model development, a corresponding kinematic viscosity were assigned as shown in Equations (26)–(30). With the assumption of temperature independent enthalpies and entropies of activation for viscous flow, it provides a kinematic viscosity model with both composition and temperature as independent variables. The unknown enthalpies and entropies can be calculated by fitting kinematic viscosity data at different compositions and temperatures to the model. Our previous work based on kinematic viscosities of MEA (monoethanol amine) + H2O mixtures provided acceptable accuracies by following this method [47].
The explained approach was adopted in this study to represent kinematic viscosities that were calculated via measured dynamic viscosities and densities. It was calculated accuracies as 23%, 17%, and 15% for MDEA + H2O, DMEA + H2O, and DEEA + H2O mixtures. These deviations are relatively high and questioning that adopted method with McAllister’s three-body model is viable to use for correlating kinematic viscosities of the considered mixtures. Accordingly, kinematic viscosity data were fitted at different temperatures instead of a temperature range using Equation (25) to see improvements in the accuracies. The reported AARD using Equation (25) are 8.4 %, 9.2% and 16% for MDEA + H2O, DMEA + H2O, and DEEA + H2O mixtures. It indicates that data fitting at different temperatures improves the accuracies of viscosity representation except for the DEEA + H2O. Table 8 lists the calculated parameters of Equation (25) at different temperatures. McAllister stated the necessity of taking into account other interactions that are involving more than three molecules in a three dimensional space instead of one plane for the scenario of two types of molecules having a size (radius) difference by more than a factor of 1.5 [46]. McAllister’s four-body model discusses such interactions however the fitting of kinematic viscosity data into four-body model is not discussed in this work.
4. Conclusions
Densities of MDEA + H2O, DMEA + H2O, and DEEA + H2O mixtures were measured for amine mass fraction range from 0.3 to 1 and for the temperature range from 293.15 K to 353.15 K. The measured density of MDEA + H2O mixtures increases with increase of MDEA concentration until a maximum and then decreases. For the density of DMEA + H2O and DEEA + H2O mixtures, a density maximum reported at x1 = 0 and density continues to decrease with increase of amine concentration. The excess molar volumes VE were negative for the all mixtures and temperature dependent. This indicates efficient molecular packing and existence of strong intermolecular interactions such as H-bonds among unlike molecules in the mixtures. The density correlations based on Redlich–Kister type polynomials for excess molar volume VE and density deviation ln(ργ) represented measured densities with good accuracy signifying their applicability to perform engineering calculations. The proposed Redlich–Kister type polynomials with linear temperature dependency were able to calculate partial molar volume of amines at infinite dilution in H2O with acceptable accuracies compared to values reported in literature.
Viscosities of MDEA + H2O, DMEA + H2O, and DEEA + H2O mixtures were measured for amine mass fraction w1 range from 0.3 to 1 for the temperature range from 293.15 K to 363.15 K. The calculated viscosity deviation ηE and excess free energy of activation for viscous flow ΔGE* could be explained the intermolecular interactions among unlike molecules in the mixtures. The proposed viscosity correlations were able to represent measured data with acceptable accuracies. The McAllister’s three-body model was adopted to correlate kinematic viscosities calculated from measured viscosities and densities at different concentrations and temperatures. The accuracies of the data fits into McAllister’s three-body model are relatively low compared to the proposed viscosity correlations in this work and it is recommended to examine McAllister’s four-body model for better data representation.
Supplementary Materials
The following are available online at https://www.mdpi.com/2076-3417/10/9/3196/s1, Figure S1: Comparison of measured density of MDEA (1) + H2O (2) mixtures with literature, Figure S2: Comparison of measured density of DMEA (1) + H2O (2) mixtures with literature, Figure S3: Comparison of measured density of DEEA (1) + H2O (2) mixtures with literature, Figure S4: Comparison of measured viscosity of MDEA (1) + H2O (2) mixtures with literature, Figure S5: Comparison of measured viscosity of DMEA (1) + H2O (2) mixtures with literature, Figure S6: Comparison of measured viscosity of DEEA (1) + H2O (2) mixtures with literature, Table S1: Viscosity of reference standard, Table S2: Comparison of measured density of DMEA (1) + H2O (2) mixtures with literature, Table S3: Comparison of measured viscosity of DMEA (1) + H2O (2) mixtures with literature.
Author Contributions
Supervision, L.E.Ø. and D.A.E.; Writing—original draft, S.S.K. All authors have read and agreed to the published version of the manuscript.
Funding
This work was funded by the Ministry of Education and Research of the Norwegian Government.
Conflicts of Interest
The authors declare no conflict of interest.
Nomenclature
| Latin Symbols | Greek Symbols | ||
| Characteristic constant | Viscosity (dynamic) of the mixture, mPa·s | ||
| Free energy of activation for viscous flow, J·mol−1 | Viscosity deviation in Equation (17), mPa·s | ||
| Excess free energy of activation for viscous flow, J·mol−1 | Viscosity of pure component, mPa·s | ||
| Planck’s constant, J·s | Viscosity deviation in Equation (22), mPa·s | ||
| Enthalpy of activation for viscous flow, J·mol−1 | Density of the mixture, kg·m−3 | ||
| Molecular weight, kg·mol−1 | Density of pure components, kg·m−3 | ||
| Molecular weight of amine, kg·mol−1 | Density of pure amine, kg·m−3 | ||
| Molecular weight of H2O, kg·mol−1 | Density of pure H2O, kg·m−3 | ||
| Number of data points | Density deviation, kg·m−3 | ||
| Avogadro’s number, mol−1 | Kinematic viscosity, m2·s−1 | ||
| Gas constant, J·mol−1·K−1 | , | McAllister’s model parameters | |
| Excess entropy of activation for viscous flow, J·mol−1·K−1 | |||
| Entropy of activation for viscous flow, J·mol−1·K−1 | |||
| Temperature, K | |||
| Molar volume of the mixture, m3·mol−1 | |||
| Excess molar volume, m3·mol−1 | |||
| Molar volume of pure amine, m3·mol−1 | |||
| Molar volume of pure H2O, m3·mol−1 | |||
| Partial molar volume of component in the mixture, m3·mol−1 | |||
| Partial molar volume of amine in the mixture, m3·mol−1 | |||
| Partial molar volume of H2O in the mixture, m3·mol−1 | |||
| Partial molar volume of amine at infinite dilution in H2O, m3·mol−1 | |||
| Partial molar volume of H2O at infinite dilution in amine, m3·mol−1 | |||
| Mole fraction of component in the mixture | |||
| Mole fraction of amine in the mixture | |||
| Mole fraction of H2O in the mixture | |||
| Excess property | |||
| Measured property | |||
| Calculated property | |||
Appendix A

Table A1.
Measured density (ρ/kg·m−3) and deduced excess molar volume (VE/m3·mol−1) of MDEA (1) + H2O (2) mixtures.
Table A1.
Measured density (ρ/kg·m−3) and deduced excess molar volume (VE/m3·mol−1) of MDEA (1) + H2O (2) mixtures.
| T/K | aw1 | 0.30 | 0.40 | 0.50 | 0.60 | 0.70 | 0.80 | 0.90 | 0.94 | 0.97 | |||||||||
|---|---|---|---|---|---|---|---|---|---|---|---|---|---|---|---|---|---|---|---|
| bx1 | 0.0609 | 0.0916 | 0.1313 | 0.1849 | 0.2608 | 0.3768 | 0.5764 | 0.7031 | 0.8302 | ||||||||||
| ρ | 106 · VE | ρ | 106 · VE | ρ | 106 · VE | ρ | 106 · VE | ρ | 106 · VE | ρ | 106 · VE | ρ | 106 · VE | ρ | 106 · VE | ρ | 106 · VE | ||
| 293.15 | 1026.9 | −0.381 | 1036.8 | −0.572 | 1045.6 | −0.784 | 1052.5 | −0.998 | 1056.5 | −1.185 | 1056.0 | −1.245 | 1050.7 | −1.018 | 1046.8 | −0.730 | 1043.7 | −0.422 | |
| 298.15 | 1024.7 | −0.376 | 1034.2 | −0.563 | 1042.6 | −0.770 | 1049.2 | −0.981 | 1052.9 | −1.167 | 1052.4 | −1.231 | 1047.0 | −1.011 | 1043.2 | −0.727 | 1040.1 | −0.423 | |
| 303.15 | 1022.4 | −0.372 | 1031.5 | −0.554 | 1039.5 | −0.757 | 1045.7 | −0.964 | 1049.3 | −1.149 | 1048.6 | −1.214 | 1043.3 | −0.999 | 1039.4 | −0.721 | 1036.3 | −0.419 | |
| 308.15 | 1019.9 | −0.368 | 1028.6 | −0.546 | 1036.3 | −0.744 | 1042.2 | −0.947 | 1045.6 | −1.130 | 1044.9 | −1.198 | 1039.5 | −0.989 | 1035.7 | −0.714 | 1032.6 | −0.415 | |
| 313.15 | 1017.3 | −0.364 | 1025.6 | −0.539 | 1033.0 | −0.733 | 1038.6 | −0.932 | 1041.8 | −1.114 | 1041.0 | −1.182 | 1035.7 | −0.980 | 1031.8 | −0.709 | 1028.8 | −0.415 | |
| 318.15 | 1014.5 | −0.360 | 1022.5 | −0.532 | 1029.6 | −0.722 | 1035.0 | −0.918 | 1038.0 | −1.098 | 1037.1 | −1.166 | 1031.8 | −0.969 | 1028.0 | −0.702 | 1024.9 | −0.411 | |
| 323.15 | 1011.7 | −0.357 | 1019.4 | −0.525 | 1026.1 | −0.711 | 1031.2 | −0.903 | 1034.1 | −1.080 | 1033.2 | −1.150 | 1027.9 | −0.958 | 1024.1 | −0.695 | 1021.1 | −0.404 | |
| 328.15 | 1008.7 | −0.354 | 1016.1 | −0.519 | 1022.5 | −0.701 | 1027.4 | −0.889 | 1030.2 | −1.064 | 1029.2 | −1.133 | 1024.0 | −0.946 | 1020.2 | −0.686 | 1017.2 | −0.400 | |
| 333.15 | 1005.5 | −0.349 | 1012.7 | −0.512 | 1018.9 | −0.691 | 1023.6 | −0.875 | 1026.2 | −1.047 | 1025.1 | −1.116 | 1020.0 | −0.934 | 1016.3 | −0.679 | 1013.3 | −0.396 | |
| 338.15 | 1002.2 | −0.345 | 1009.2 | −0.505 | 1015.1 | −0.680 | 1019.6 | −0.861 | 1022.1 | −1.030 | 1021.0 | −1.098 | 1015.8 | −0.912 | 1012.3 | −0.668 | 1009.4 | −0.393 | |
| 343.15 | 998.6 | −0.335 | 1005.4 | −0.492 | 1011.3 | −0.670 | 1015.6 | −0.847 | 1018.0 | −1.013 | 1016.9 | −1.080 | 1011.9 | −0.909 | 1008.3 | −0.659 | 1005.5 | −0.388 | |
| 348.15 | 1001.5 | −0.481 | 1007.4 | −0.659 | 1011.5 | −0.832 | 1013.8 | −0.995 | 1012.7 | −1.062 | 1007.8 | −0.895 | 1004.3 | −0.649 | 1001.5 | −0.383 | |||
| 353.15 | 996.9 | −0.450 | 1003.4 | −0.646 | 1007.3 | −0.813 | 1009.5 | −0.977 | 1008.4 | −1.042 | 1003.7 | −0.879 | 1000.3 | −0.636 | 997.5 | −0.375 | |||
a mass fraction, b mole fraction of MDEA.
Table A2.
Measured density (ρ/kg·m−3) and deduced excess molar volume (VE/m3·mol−1) of DMEA (1) + H2O (2) mixtures.
Table A2.
Measured density (ρ/kg·m−3) and deduced excess molar volume (VE/m3·mol−1) of DMEA (1) + H2O (2) mixtures.
| T/K | aw1 | 0.30 | 0.40 | 0.50 | 0.60 | 0.70 | 0.80 | 0.90 | 0.94 | 0.97 | |||||||||
|---|---|---|---|---|---|---|---|---|---|---|---|---|---|---|---|---|---|---|---|
| bx1 | 0.0797 | 0.1187 | 0.1681 | 0.2326 | 0.3204 | 0.4470 | 0.6452 | 0.7600 | 0.8673 | ||||||||||
| ρ | 106 · VE | ρ | 106 · VE | ρ | 106 · VE | ρ | 106 · VE | ρ | 106 · VE | ρ | 106 · VE | ρ | 106 · VE | ρ | 106 · VE | ρ | 106 · VE | ||
| 293.15 | 991.0 | −0.712 | 987.1 | −1.020 | 979.9 | −1.305 | 969.3 | −1.550 | 954.9 | −1.704 | 936.6 | −1.678 | 914.2 | −1.274 | 904.2 | −0.931 | 896.5 | −0.567 | |
| 298.15 | 988.2 | −0.704 | 983.8 | −1.004 | 976.2 | −1.286 | 965.4 | −1.534 | 950.9 | −1.692 | 932.6 | −1.675 | 910.1 | −1.279 | 900.2 | −0.941 | 892.4 | −0.579 | |
| 303.15 | 985.4 | −0.696 | 980.3 | −0.990 | 972.3 | −1.268 | 961.4 | −1.518 | 946.8 | −1.680 | 928.4 | −1.668 | 906.0 | −1.284 | 896.0 | −0.947 | 888.3 | −0.589 | |
| 308.15 | 982.4 | −0.689 | 976.8 | −0.977 | 968.4 | −1.253 | 957.3 | −1.502 | 942.7 | −1.669 | 924.3 | −1.666 | 901.8 | −1.287 | 891.8 | −0.956 | 884.0 | −0.591 | |
| 313.15 | 979.2 | −0.683 | 973.1 | −0.965 | 964.5 | −1.239 | 953.2 | −1.488 | 938.4 | −1.659 | 920.0 | −1.661 | 897.5 | −1.291 | 887.6 | −0.960 | 879.7 | −0.596 | |
| 318.15 | 976.0 | −0.679 | 969.5 | −0.957 | 960.5 | −1.226 | 949.0 | −1.476 | 934.1 | −1.649 | 915.7 | −1.657 | 893.3 | −1.295 | 883.3 | −0.964 | 875.4 | −0.601 | |
| 323.15 | 972.7 | −0.674 | 965.7 | −0.948 | 956.4 | −1.215 | 944.7 | −1.464 | 929.8 | −1.640 | 911.3 | −1.653 | 888.9 | −1.298 | 878.9 | −0.968 | 871.0 | −0.603 | |
| 328.15 | 969.3 | −0.670 | 961.9 | −0.941 | 952.3 | −1.205 | 940.4 | −1.454 | 925.4 | −1.632 | 906.9 | −1.649 | 884.5 | −1.301 | 874.5 | −0.973 | 866.6 | −0.605 | |
| 333.15 | 965.8 | −0.668 | 958.0 | −0.934 | 948.1 | −1.195 | 936.0 | −1.444 | 920.9 | −1.624 | 902.4 | −1.645 | 880.0 | −1.301 | 870.0 | −0.973 | 862.2 | −0.611 | |
| 338.15 | 962.1 | −0.665 | 954.0 | −0.928 | 943.8 | −1.187 | 931.5 | −1.435 | 916.4 | −1.616 | 897.9 | −1.643 | 875.5 | −1.304 | 865.6 | −0.980 | 857.6 | −0.613 | |
| 343.15 | 958.3 | −0.663 | 950.0 | −0.928 | 939.5 | −1.184 | 927.0 | −1.433 | 911.8 | −1.617 | 893.2 | −1.650 | 870.9 | −1.322 | 861.0 | −1.007 | 853.1 | −0.642 | |
| 348.15 | 954.3 | −0.652 | 945.7 | −0.914 | 935.1 | −1.170 | 922.4 | −1.414 | 907.1 | −1.596 | 888.6 | −1.625 | 866.3 | −1.292 | 856.4 | −0.973 | 848.5 | −0.604 | |
| 353.15 | 950.4 | −0.653 | 941.5 | −0.912 | 930.7 | −1.172 | 917.8 | −1.413 | 902.3 | −1.596 | 882.5 | −1.546 | 861.6 | −1.306 | 851.7 | −0.989 | 843.9 | −0.633 | |
a mass fraction, b mole fraction of DMEA.
Table A3.
Measured density (ρ/kg·m−3) and deduced excess molar volume (VE/m3·mol−1) of DEEA (1) + H2O (2) mixtures.
Table A3.
Measured density (ρ/kg·m−3) and deduced excess molar volume (VE/m3·mol−1) of DEEA (1) + H2O (2) mixtures.
| T/K | aw1 | 0.30 | 0.40 | 0.50 | 0.60 | 0.70 | 0.80 | 0.90 | 0.94 | 0.97 | |||||||||
|---|---|---|---|---|---|---|---|---|---|---|---|---|---|---|---|---|---|---|---|
| bx1 | 0.0618 | 0.0930 | 0.1332 | 0.1874 | 0.2640 | 0.3808 | 0.5805 | 0.7066 | 0.8325 | ||||||||||
| ρ | 106 · VE | ρ | 106 · VE | ρ | 106 · VE | ρ | 106 · VE | ρ | 106 · VE | ρ | 106 · VE | ρ | 106 · VE | ρ | 106 · VE | ρ | 106 · VE | ||
| 293.15 | 989.6 | −0.724 | 983.2 | −0.990 | 974.6 | −1.258 | 963.9 | −1.531 | 950.8 | −1.786 | 934.4 | −1.941 | 912.9 | −1.706 | 902.4 | −1.313 | 893.6 | −0.788 | |
| 298.15 | 986.6 | −0.712 | 979.7 | −0.973 | 970.7 | −1.240 | 959.8 | −1.513 | 946.5 | −1.771 | 930.0 | −1.932 | 908.5 | −1.707 | 897.9 | −1.319 | 889.1 | −0.800 | |
| 303.15 | 983.4 | −0.701 | 976.0 | −0.957 | 966.7 | −1.222 | 955.6 | −1.497 | 942.0 | −1.755 | 925.4 | −1.922 | 903.9 | −1.705 | 893.3 | −1.321 | 884.5 | −0.802 | |
| 308.15 | 980.2 | −0.692 | 972.3 | −0.944 | 962.6 | −1.206 | 951.2 | −1.481 | 937.6 | −1.742 | 920.8 | −1.913 | 899.2 | −1.695 | 888.7 | −1.327 | 879.9 | −0.808 | |
| 313.15 | 976.8 | −0.684 | 968.5 | −0.931 | 958.5 | −1.191 | 946.8 | −1.465 | 933.0 | −1.727 | 916.1 | −1.898 | 894.6 | −1.699 | 884.0 | −1.324 | 875.2 | −0.809 | |
| 318.15 | 973.4 | −0.676 | 964.6 | −0.920 | 954.3 | −1.177 | 942.4 | −1.450 | 928.4 | −1.712 | 911.4 | −1.888 | 889.8 | −1.693 | 879.3 | −1.324 | 870.5 | −0.812 | |
| 323.15 | 969.8 | −0.669 | 960.6 | −0.909 | 950.0 | −1.164 | 937.8 | −1.436 | 923.6 | −1.698 | 906.6 | −1.875 | 884.9 | −1.677 | 874.5 | −1.322 | 865.7 | −0.809 | |
| 328.15 | 966.2 | −0.663 | 956.5 | −0.900 | 945.6 | −1.152 | 933.2 | −1.422 | 918.8 | −1.683 | 901.7 | −1.861 | 880.2 | −1.679 | 869.7 | −1.316 | 861.0 | −0.807 | |
| 333.15 | 962.4 | −0.657 | 952.4 | −0.890 | 941.1 | −1.140 | 928.5 | −1.407 | 914.0 | −1.666 | 896.8 | −1.850 | 875.3 | −1.668 | 864.8 | −1.308 | 856.1 | −0.804 | |
| 338.15 | 958.5 | −0.651 | 948.2 | −0.881 | 936.6 | −1.127 | 923.8 | −1.393 | 909.1 | −1.650 | 891.7 | −1.822 | 870.3 | −1.655 | 859.9 | −1.294 | 851.3 | −0.804 | |
| 343.15 | 954.6 | −0.645 | 943.8 | −0.872 | 932.0 | −1.115 | 919.0 | −1.379 | 904.1 | −1.633 | 886.6 | −1.806 | 865.3 | −1.639 | 854.9 | −1.282 | 846.4 | −0.799 | |
| 348.15 | 950.5 | −0.641 | 939.5 | −0.863 | 927.3 | −1.102 | 914.1 | −1.363 | 899.1 | −1.617 | 881.5 | −1.786 | 860.2 | −1.621 | 849.9 | −1.270 | 841.4 | −0.788 | |
| 353.15 | 946.3 | −0.632 | 935.0 | −0.853 | 922.6 | −1.091 | 909.1 | −1.346 | 893.8 | −1.592 | 876.3 | −1.763 | 855.0 | −1.599 | 844.8 | −1.252 | 836.4 | −0.776 | |
a mass fraction, b mole fraction of DEEA.
Table A4.
Partial molar volume /m3·mol−1 of MDEA, DMEA, and DEEA at infinite dilution in H2O and molar volume of pure species /m3·mol−1 at various temperatures.
Table A4.
Partial molar volume /m3·mol−1 of MDEA, DMEA, and DEEA at infinite dilution in H2O and molar volume of pure species /m3·mol−1 at various temperatures.
| T/K | MDEA (1) at Infinite Dilution in H2O (2) | DMEA (1) at Infinite Dilution in H2O (2) | DEEA (1) at Infinite Dilution in H2O (2) | ||||||
|---|---|---|---|---|---|---|---|---|---|
Literature | Literature | Literature | |||||||
| 293.15 | 108.7 | 114.5 | 92.0 | 93.6 c,d | 100.4 | 118.9 | 122.1 d,e | 132.5 | |
| 298.15 | 109.1 | 109.5 a, 108.9 b | 114.9 | 92.4 | 93.7 b, 94.1 c, 93.9 c,d | 100.9 | 119.6 | 117.6 b, 122.6 e, 122.7 d,e | 133.2 |
| 303.15 | 109.6 | 110.7 a | 115.3 | 92.8 | 94.3 c, 94.2 c,d | 101.4 | 120.4 | 123.0 e, 122.7 d,e | 133.9 |
| 308.15 | 110.0 | 110.0b | 115.8 | 93.3 | 95.7b | 101.9 | 121.2 | 118.0b | 134.6 |
| 313.15 | 110.5 | 110.7a | 116.2 | 93.7 | 94.8 c, 94.9 c,d | 102.4 | 122.0 | 123.7 e, 123.6 d,e | 135.4 |
| 318.15 | 110.9 | 110.7 b | 116.6 | 94.2 | 97.2 b | 102.9 | 122.8 | 118.3 b | 136.1 |
| 323.15 | 111.4 | 111.4 a | 117.1 | 94.6 | 103.4 | 123.6 | 136.9 | ||
| 328.15 | 111.8 | 117.5 | 95.1 | 103.9 | 124.4 | 137.6 | |||
| 333.15 | 112.3 | 112.5 a | 118.0 | 95.6 | 96.3 c | 104.5 | 125.2 | 125.3 e | 138.4 |
| 338.15 | 112.8 | 118.4 | 96.1 | 105.0 | 126.1 | 139.2 | |||
| 343.15 | 113.3 | 113.1 a | 118.9 | 96.6 | 105.6 | 126.9 | 140.0 | ||
| 348.15 | 113.7 | 119.3 | 97.1 | 106.2 | 127.8 | 140.8 | |||
| 353.15 | 114.2 | 113.8a | 119.8 | 97.6 | 98.1c | 106.8 | 128.7 | 128.0 e | 141.6 |
Table A5.
Measured viscosity (η/mPa·s) and deduced viscosity deviation (ηE/mPa·s) of MDEA (1) + H2O (2) mixtures.
Table A5.
Measured viscosity (η/mPa·s) and deduced viscosity deviation (ηE/mPa·s) of MDEA (1) + H2O (2) mixtures.
| T/K | aw1 | 0.30 | 0.40 | 0.50 | 0.60 | 0.70 | 0.80 | 0.90 | 0.94 | 0.97 | |||||||||
|---|---|---|---|---|---|---|---|---|---|---|---|---|---|---|---|---|---|---|---|
| bx1 | 0.0609 | 0.0916 | 0.1313 | 0.1849 | 0.2608 | 0.3768 | 0.5764 | 0.7031 | 0.8302 | ||||||||||
| η | ηE | η | ηE | η | ηE | η | ηE | η | ηE | η | ηE | η | ηE | η | ηE | η | ηE | ||
| 293.15 | 3.712 | −3.358 | 6.410 | −3.723 | 11.633 | −2.465 | 21.915 | 2.480 | 42.784 | 15.778 | 76.266 | 37.686 | 107.892 | 49.414 | 111.511 | 40.394 | 108.675 | 24.890 | |
| 298.15 | 3.136 | −2.319 | 5.290 | −2.468 | 9.323 | −1.418 | 16.721 | 1.965 | 32.161 | 11.711 | 56.123 | 26.967 | 79.249 | 35.126 | 82.357 | 28.727 | 80.921 | 17.762 | |
| 303.15 | 2.673 | −1.594 | 4.410 | −1.609 | 7.561 | −0.725 | 13.075 | 1.737 | 24.522 | 8.854 | 41.834 | 19.548 | 58.937 | 25.273 | 61.546 | 20.654 | 60.950 | 12.815 | |
| 308.15 | 2.301 | −1.090 | 3.721 | −1.018 | 6.200 | −0.285 | 10.404 | 1.570 | 18.988 | 6.821 | 31.721 | 14.458 | 44.492 | 18.469 | 46.689 | 15.102 | 46.555 | 9.390 | |
| 313.15 | 1.995 | −0.742 | 3.170 | −0.618 | 5.152 | 0.002 | 8.418 | 1.435 | 14.936 | 5.354 | 24.435 | 10.879 | 34.108 | 13.719 | 35.949 | 11.220 | 36.084 | 7.005 | |
| 318.15 | 1.748 | −0.496 | 2.732 | −0.343 | 4.335 | 0.183 | 6.916 | 1.315 | 11.930 | 4.273 | 19.137 | 8.338 | 26.566 | 10.363 | 28.108 | 8.473 | 28.378 | 5.304 | |
| 323.15 | 1.544 | −0.322 | 2.376 | −0.155 | 3.683 | 0.289 | 5.759 | 1.205 | 9.659 | 3.460 | 15.206 | 6.490 | 20.977 | 7.936 | 22.277 | 6.489 | 22.607 | 4.065 | |
| 328.15 | 1.376 | −0.199 | 2.088 | −0.027 | 3.168 | 0.353 | 4.863 | 1.106 | 7.938 | 2.846 | 12.272 | 5.138 | 16.823 | 6.179 | 17.927 | 5.053 | 18.264 | 3.155 | |
| 333.15 | 1.236 | −0.109 | 1.849 | 0.062 | 2.749 | 0.389 | 4.147 | 1.014 | 6.600 | 2.372 | 10.019 | 4.117 | 13.644 | 4.865 | 14.580 | 3.973 | 14.924 | 2.485 | |
| 338.15 | 1.117 | −0.043 | 1.649 | 0.121 | 2.408 | 0.406 | 3.572 | 0.930 | 5.554 | 2.005 | 8.281 | 3.346 | 11.201 | 3.882 | 11.996 | 3.163 | 12.326 | 1.975 | |
| 343.15 | 1.017 | 0.006 | 1.478 | 0.161 | 2.128 | 0.414 | 3.104 | 0.856 | 4.722 | 1.716 | 6.923 | 2.760 | 9.291 | 3.136 | 9.962 | 2.543 | 10.278 | 1.591 | |
| 348.15 | 0.930 | 0.041 | 1.335 | 0.188 | 1.894 | 0.413 | 2.723 | 0.792 | 4.055 | 1.486 | 5.844 | 2.300 | 7.788 | 2.567 | 8.353 | 2.067 | 8.642 | 1.289 | |
| 353.15 | 0.853 | 0.066 | 1.213 | 0.206 | 1.698 | 0.408 | 2.407 | 0.736 | 3.513 | 1.301 | 4.984 | 1.943 | 6.587 | 2.124 | 7.065 | 1.698 | 7.337 | 1.064 | |
| 358.15 | 0.790 | 0.086 | 1.108 | 0.218 | 1.528 | 0.394 | 2.144 | 0.685 | 3.072 | 1.149 | 4.290 | 1.659 | 5.619 | 1.772 | 6.026 | 1.406 | 6.268 | 0.873 | |
| 363.15 | 0.747 | 0.114 | 1.018 | 0.224 | 1.377 | 0.374 | 1.925 | 0.641 | 2.710 | 1.028 | 3.725 | 1.434 | 4.834 | 1.494 | 5.181 | 1.1761 | 5.395 | 0.723 | |
a mass fraction, b mole fraction of MDEA.
Table A6.
Measured viscosity (η/mPa·s) and deduced viscosity deviation (ηE/mPa·s) of DMEA (1) + H2O (2) mixtures.
Table A6.
Measured viscosity (η/mPa·s) and deduced viscosity deviation (ηE/mPa·s) of DMEA (1) + H2O (2) mixtures.
| T/K | aw1 | 0.30 | 0.40 | 0.50 | 0.60 | 0.70 | 0.80 | 0.90 | 0.94 | 0.97 | |||||||||
|---|---|---|---|---|---|---|---|---|---|---|---|---|---|---|---|---|---|---|---|
| bx1 | 0.0797 | 0.1187 | 0.1681 | 0.2326 | 0.3204 | 0.4470 | 0.6452 | 0.7600 | 0.8673 | ||||||||||
| η | ηE | η | ηE | η | ηE | η | ηE | η | ηE | η | ηE | η | ηE | η | ηE | η | ηE | ||
| 293.15 | 4.214 | 2.981 | 6.814 | 5.469 | 10.169 | 8.681 | 14.010 | 12.335 | 16.750 | 14.822 | 15.539 | 13.245 | 9.712 | 6.845 | 7.129 | 3.931 | 5.383 | 1.875 | |
| 298.15 | 3.457 | 2.367 | 5.464 | 4.278 | 8.011 | 6.701 | 10.886 | 9.416 | 12.989 | 11.299 | 12.214 | 10.208 | 7.955 | 5.454 | 5.976 | 3.189 | 4.591 | 1.537 | |
| 303.15 | 2.869 | 1.900 | 4.446 | 3.392 | 6.398 | 5.237 | 8.571 | 7.271 | 10.197 | 8.707 | 9.704 | 7.941 | 6.565 | 4.374 | 5.031 | 2.593 | 3.937 | 1.267 | |
| 308.15 | 2.413 | 1.545 | 3.664 | 2.723 | 5.189 | 4.155 | 6.848 | 5.694 | 8.120 | 6.802 | 7.796 | 6.241 | 5.458 | 3.533 | 4.264 | 2.124 | 3.391 | 1.052 | |
| 313.15 | 2.055 | 1.272 | 3.060 | 2.215 | 4.262 | 3.336 | 5.548 | 4.517 | 6.540 | 5.366 | 6.340 | 4.961 | 4.577 | 2.877 | 3.637 | 1.750 | 2.937 | 0.876 | |
| 318.15 | 1.768 | 1.059 | 2.590 | 1.825 | 3.552 | 2.718 | 4.562 | 3.636 | 5.362 | 4.312 | 5.220 | 3.990 | 3.877 | 2.367 | 3.131 | 1.459 | 2.564 | 0.740 | |
| 323.15 | 1.536 | 0.890 | 2.216 | 1.521 | 2.999 | 2.244 | 3.794 | 2.958 | 4.442 | 3.497 | 4.340 | 3.239 | 3.307 | 1.959 | 2.708 | 1.218 | 2.249 | 0.625 | |
| 328.15 | 1.349 | 0.757 | 1.918 | 1.284 | 2.564 | 1.876 | 3.199 | 2.441 | 3.723 | 2.868 | 3.652 | 2.659 | 2.845 | 1.635 | 2.363 | 1.028 | 1.987 | 0.535 | |
| 333.15 | 1.193 | 0.649 | 1.676 | 1.094 | 2.215 | 1.586 | 2.725 | 2.034 | 3.151 | 2.375 | 3.099 | 2.200 | 2.462 | 1.371 | 2.071 | 0.870 | 1.765 | 0.460 | |
| 338.15 | 1.064 | 0.562 | 1.478 | 0.943 | 1.934 | 1.356 | 2.346 | 1.712 | 2.703 | 1.994 | 2.653 | 1.835 | 2.146 | 1.158 | 1.828 | 0.741 | 1.575 | 0.397 | |
| 343.15 | 0.955 | 0.490 | 1.315 | 0.821 | 1.701 | 1.169 | 2.038 | 1.457 | 2.324 | 1.676 | 2.289 | 1.544 | 1.882 | 0.985 | 1.621 | 0.637 | 1.413 | 0.347 | |
| 348.15 | 0.865 | 0.434 | 1.179 | 0.721 | 1.505 | 1.014 | 1.786 | 1.251 | 2.022 | 1.428 | 1.988 | 1.308 | 1.658 | 0.844 | 1.444 | 0.552 | 1.274 | 0.309 | |
| 353.15 | 0.790 | 0.388 | 1.064 | 0.638 | 1.341 | 0.886 | 1.572 | 1.078 | 1.770 | 1.223 | 1.739 | 1.115 | 1.468 | 0.725 | 1.291 | 0.478 | 1.151 | 0.274 | |
| 358.15 | 0.722 | 0.347 | 0.968 | 0.571 | 1.203 | 0.780 | 1.401 | 0.943 | 1.560 | 1.055 | 1.532 | 0.958 | 1.308 | 0.626 | 1.159 | 0.416 | 1.045 | 0.244 | |
| 363.15 | 0.674 | 0.323 | 0.884 | 0.514 | 1.080 | 0.686 | 1.251 | 0.826 | 1.385 | 0.917 | 1.358 | 0.829 | 1.170 | 0.544 | 1.046 | 0.365 | 0.954 | 0.221 | |
a mass fraction, b mole fraction of DMEA.
Table A7.
Measured viscosity (η/mPa·s) and deduced viscosity deviation (ηE/mPa·s) of DEEA (1) + H2O (2) mixtures.
Table A7.
Measured viscosity (η/mPa·s) and deduced viscosity deviation (ηE/mPa·s) of DEEA (1) + H2O (2) mixtures.
| T/K | aw1 | 0.30 | 0.40 | 0.50 | 0.60 | 0.70 | 0.80 | 0.90 | 0.94 | 0.97 | |||||||||
|---|---|---|---|---|---|---|---|---|---|---|---|---|---|---|---|---|---|---|---|
| bx1 | 0.0618 | 0.0930 | 0.1332 | 0.1874 | 0.2640 | 0.3808 | 0.5805 | 0.7066 | 0.8325 | ||||||||||
| η | ηE | η | ηE | η | ηE | η | ηE | η | ηE | η | ηE | η | ηE | η | ηE | η | ηE | ||
| 293.15 | 4.511 | 3.266 | 7.057 | 5.688 | 10.454 | 8.927 | 14.648 | 12.907 | 18.849 | 16.806 | 20.569 | 18.064 | 15.023 | 11.730 | 10.786 | 6.996 | 7.593 | 3.305 | |
| 298.15 | 3.666 | 2.573 | 5.616 | 4.421 | 8.157 | 6.829 | 11.239 | 9.734 | 14.255 | 12.499 | 15.446 | 11.561 | 8.767 | 8.548 | 5.340 | 6.191 | 2.570 | ||
| 303.15 | 3.025 | 2.059 | 4.536 | 3.484 | 6.477 | 5.315 | 8.731 | 7.420 | 10.922 | 9.401 | 11.757 | 13.307 | 9.009 | 6.623 | 6.905 | 4.173 | 5.092 | 2.016 | |
| 308.15 | 2.529 | 1.668 | 3.713 | 2.781 | 5.222 | 4.197 | 6.903 | 5.755 | 8.510 | 7.185 | 9.104 | 9.917 | 7.122 | 5.072 | 5.607 | 3.268 | 4.223 | 1.595 | |
| 313.15 | 2.143 | 1.371 | 3.090 | 2.257 | 4.223 | 3.312 | 5.546 | 4.531 | 6.740 | 5.577 | 7.161 | 7.512 | 5.711 | 3.938 | 4.609 | 2.592 | 3.536 | 1.276 | |
| 318.15 | 1.839 | 1.141 | 2.607 | 1.858 | 3.517 | 2.702 | 4.533 | 3.629 | 5.425 | 4.396 | 5.729 | 5.774 | 4.649 | 3.101 | 3.810 | 2.055 | 2.999 | 1.038 | |
| 323.15 | 1.597 | 0.964 | 2.226 | 1.549 | 2.964 | 2.230 | 3.750 | 2.940 | 4.432 | 3.514 | 4.650 | 4.509 | 3.822 | 2.461 | 3.184 | 1.646 | 2.560 | 0.845 | |
| 328.15 | 1.397 | 0.819 | 1.926 | 1.309 | 2.535 | 1.869 | 3.151 | 2.420 | 3.676 | 2.852 | 3.832 | 3.569 | 3.187 | 1.981 | 2.704 | 1.346 | 2.205 | 0.695 | |
| 333.15 | 1.238 | 0.707 | 1.678 | 1.115 | 2.189 | 1.583 | 2.675 | 2.013 | 3.086 | 2.343 | 3.196 | 2.867 | 2.697 | 1.624 | 2.302 | 1.097 | 1.919 | 0.582 | |
| 338.15 | 1.105 | 0.616 | 1.480 | 0.962 | 1.911 | 1.356 | 2.311 | 1.707 | 2.619 | 1.944 | 2.703 | 2.332 | 2.282 | 1.319 | 1.981 | 0.902 | 1.678 | 0.485 | |
| 343.15 | 0.998 | 0.545 | 1.314 | 0.836 | 1.682 | 1.171 | 2.010 | 1.456 | 2.265 | 1.649 | 2.304 | 1.922 | 1.967 | 1.097 | 1.717 | 0.746 | 1.477 | 0.405 | |
| 348.15 | 0.905 | 0.484 | 1.180 | 0.736 | 1.491 | 1.018 | 1.756 | 1.245 | 1.943 | 1.378 | 1.983 | 1.594 | 1.681 | 0.891 | 1.513 | 0.633 | 1.310 | 0.341 | |
| 353.15 | 0.834 | 0.441 | 1.076 | 0.663 | 1.330 | 0.892 | 1.545 | 1.073 | 1.697 | 1.177 | 1.717 | 1.335 | 1.471 | 0.751 | 1.342 | 0.542 | 1.172 | 0.293 | |
| 358.15 | 0.765 | 0.398 | 0.984 | 0.599 | 1.194 | 0.786 | 1.372 | 0.934 | 1.493 | 1.012 | 1.497 | 1.123 | 1.299 | 0.640 | 1.183 | 0.452 | 1.059 | 0.257 | |
| 363.15 | 0.703 | 0.359 | 0.906 | 0.546 | 1.077 | 0.697 | 1.221 | 0.814 | 1.316 | 0.871 | 1.321 | 0.950 | 1.154 | 0.549 | 1.052 | 0.384 | 0.961 | 0.230 | |
a mass fraction, b mole fraction of DEEA.
References
- Metz, B.; Davidson, O.; Coninck, H.D.; Loos, M.; Meyer, L. IPCC Special Report on Carbon Dioxide Capture and Storage. Cambridge University Press: New York, NY, USA, 2005. [Google Scholar]
- Nwaoha, C.; Tontiwachwuthikul, P.; Benamor, A. A comparative study of novel activated AMP using 1,5-diamino-2-methylpentane vs MEA solution for CO2 capture from gas-fired power plant. Fuel 2018, 234, 1089–1098. [Google Scholar] [CrossRef]
- Nwaoha, C.; Saiwan, C.; Supap, T.; Idem, R.; Tontiwachwuthikul, P.; Rongwong, W.; Al-Marri, M.J.; Benamor, A. Carbon dioxide (CO2) capture performance of aqueoustri-solvent blends containing 2-amino−2-methyl-1-propanol (AMP) and methyldiethanolamine (MDEA) promoted by diethylenetriamine (DETA). Int. J. Greenh. Gas Control 2016, 53, 292–304. [Google Scholar] [CrossRef]
- Kim, C.J.; Savage, D.W. Kinetics of carbon dioxide reaction with diethylaminoethanol in aqueous solutions. Chem. Eng. Sci. 1987, 42, 1481–1487. [Google Scholar] [CrossRef]
- Rinker, E.B.; Sami, S.A.; Sandall, O.C. Kinetics and modelling of carbon dioxide absorption into aqueous solutions of N-methyldiethanolamine. Chem. Eng. Sci. 1995, 50, 755–768. [Google Scholar] [CrossRef]
- Monteiro, J.G.M.S.; Pinto, D.D.D.; Zaidy, S.A.H.; Hartono, A.; Svendsen, H.F. VLE data and modelling of aqueous N,N-diethylethanolamine (DEEA) solutions. Int. J. Greenh. Gas Control 2013, 19, 432–440. [Google Scholar] [CrossRef] [Green Version]
- Henni, A.; Li, J.; Tontiwachwuthikul, P. Reaction kinetics of CO2 in aqueous 1-Amino-2-Propanol, 3-Amino-1-Propanol, and Dimethylmonoethanolamine solutions in the temperature range of 298–313 K using the stopped-flow technique. Ind. Eng. Chem. Res. 2008, 47, 2213–2220. [Google Scholar] [CrossRef]
- Zhang, J.; Fennell, P.S.; Trusler, J.P.M. Density and viscosity of partially carbonated aqueous tertiary Alkanolamine solutions at temperatures between (298.15 and 353.15) K. J. Chem. Eng. Data 2015, 60, 2392–2399. [Google Scholar] [CrossRef] [Green Version]
- Versteeg, G.F.; Van Swaaij, W.P.M. Solubility and diffusivity of acid gases (carbon dioxide, nitrous oxide) in aqueous alkanolamine solutions. J. Chem. Eng. Data 1988, 33, 29–34. [Google Scholar] [CrossRef] [Green Version]
- Aronu, U.E.; Hartono, A.; Svendsen, H.F. Density, viscosity, and N2O solubility of aqueous amino acid salt and amine amino acid salt solutions. J. Chem. Thermodyn. 2012, 45, 90–99. [Google Scholar] [CrossRef]
- Cleeton, C.; Kvam, O.; Rea, R.; Sarkisov, L.; De Angelis, M.G. Competitive H2S – CO2 absorption in reactive aqueous methyldiethanolamine solution: Prediction with ePC-SAFT. Fluid Phase Equilib. 2020, 511, 112453. [Google Scholar] [CrossRef]
- Wangler, A.; Sieder, G.; Ingram, T.; Heilig, M.; Held, C. Prediction of CO2 and H2S solubility and enthalpy of absorption in reacting N-methyldiethanolamine/water systems with ePC-SAFT. Fluid Phase Equilib. 2018, 461, 15–27. [Google Scholar] [CrossRef]
- Idris, Z.; Kummamuru, N.B.; Eimer, D.A. Viscosity measurement of unloaded and CO2-loaded aqueous monoethanolamine at higher concentrations. J. Mol. Liq. 2017, 243, 638–645. [Google Scholar] [CrossRef]
- JCGM. Evaluation of Measurement Data—Supplement 1 to the “Guide to the Expression of Uncertainty in Measurement”—Propagation of Distributions Using a Monte Carlo Method. Available online: https://www.bipm.org/utils/common/documents/jcgm/JCGM_101_2008_E.pdf (accessed on 3 January 2020).
- Ellison, S.L.R.; Williams, A. Quantifying Uncertainty in Analytical Measurement. Available online: https://www.eurachem.org/images/stories/Guides/pdf/QUAM2012_P1.pdf (accessed on 3 January 2020).
- Hawrylak, B.; Bruke, S.E.; Palepu, R. Partial molar and excess volumes and adiabatic compressibilities of binary mixtures of ethanolamines with water. J. Solut. Chem. 2000, 29, 575–593. [Google Scholar] [CrossRef]
- Maham, Y.; Teng, T.T.; Mather, A.E.; Hepler, L.G. Volumetric properties of (water + diethanolamine) systems. Can. J. Chem. 1995, 73, 1514–1519. [Google Scholar] [CrossRef]
- Maham, Y.; Teng, T.T.; Hepler, L.G.; Mather, A.E. Volumetric properties of aqueous solutions of monoethanolamine, mono- and dimethylethanolamines at temperatures from 5 to 80 °C I. Thermochim. Acta 2002, 386, 111–118. [Google Scholar] [CrossRef]
- Zhang, F.-Q.; Li, H.-P.; Dai, M.; Zhao, J.-P.; Chao, J.P. Volumetric properties of binary mixtures of water with ethanolamine alkyl derivatives. Thermochim. Acta 1995, 254, 347–357. [Google Scholar] [CrossRef]
- Lebrette, L.; Maham, Y.; Teng, T.T.; Hepler, L.G.; Mather, A.E. Volumetric properties of aqueous solutions of mono, and diethylethanolamines at temperatures from 5 to 80 °C II. Thermochim. Acta 2002, 386, 119–126. [Google Scholar] [CrossRef]
- Concepción, E.I.; Gómez-Hernández, Á.; Martín, M.C.; Segovia, J.J. Density and viscosity measurements of aqueous amines at high pressures: DEA-water, DMAE-water and TEA-water mixtures. J. Chem. Thermodyn. 2017, 112, 227–239. [Google Scholar] [CrossRef] [Green Version]
- Ma, D.; Liu, Q.; Zhu, C.; Feng, H.; Ma, Y. Volumetric and viscometric properties of ternary solution of (N-methyldiethanolamine + monoethanolamine + ethanol). J. Chem. Thermodyn. 2019, 134, 5–19. [Google Scholar] [CrossRef]
- Begum, S.K.; Clarke, R.J.; Ahmed, M.S.; Begum, S.; Saleh, M.A. Volumetric, viscosimetric and surface properties of aqueous solutions of triethylene glycol, tetraethylene glycol, and tetraethylene glycol dimethyl ether. J. Mol. Liq. 2013, 177, 11–18. [Google Scholar] [CrossRef]
- Rafiee, H.R.; Frouzesh, F. Volumetric properties for binary and ternary mixtures of allyl alcohol, 1,3-dichloro-2-propanol and 1-ethyl-3-methyl imidazolium ethyl sulfate [Emim][EtSO4] from T=298.15 to 318.15K at ambient pressure. Thermochim. Acta 2015, 611, 36–46. [Google Scholar] [CrossRef]
- Aminabhavi, T.M.; Aralaguppi, M.I.; Bindu, G.; Khinnavar, R.S. Densities, shear viscosities, refractive indices, and speeds of sound of Bis(2-methoxyethyl) Ether with Hexane, Heptane, Octane, and 2,2,4-Trimethylpentane in the temperature interval 298.15-318.15 K. J. Chem. Eng. Data 1994, 39, 522–528. [Google Scholar] [CrossRef]
- Harvey, A.H. Thermodynamic Properties of Water; NIST: Boulder, CO, USA, 1998. [Google Scholar]
- Hartono, A.; Svendsen, H.F. Density, viscosity, and excess properties of aqueous solution of diethylenetriamine (DETA). J. Chem. Thermodyn. 2009, 41, 973–979. [Google Scholar] [CrossRef]
- Redlich, O.; Kister, A.T. Algebraic representation of thermodynamic properties and the classification of solutions. Ind. Eng. Chem. 1948, 40, 345–348. [Google Scholar] [CrossRef]
- Maham, Y.; Teng, T.T.; Hepler, L.G.; Mather, A.E. Densities, excess molar volumes, and partial molar volumes for binary mixtures of Water with Monoethanolamine, Diethnolamine, and Triethanolamine from 25 to 80 °C. J. Solut. Chem. 1994, 23, 195–205. [Google Scholar] [CrossRef]
- Hepler, L.G. Thermal expansion and structure in water and aqueous solutions. Can. J. Chem. 1969, 47, 4613–4617. [Google Scholar] [CrossRef]
- Teng, T.T.; Maham, Y.; Hepler, L.G.; Mather, A.E. Viscosity of aqueous solutions of N-Methyldiethanolamine and of Diethanolamine. J. Chem. Eng. Data 1994, 39, 290–293. [Google Scholar] [CrossRef]
- Bernal-García, J.M.; Hall, K.R.; Estrada-Baltazar, A.; Iglesias-Silva, G.A. Density and viscosity of aqueous solutions of N,N-dimethylethanolamine at p = 0.1 MPa from T=(293.15 to 363.15) K. J. Chem. Thermodyn. 2005, 37, 762–767. [Google Scholar] [CrossRef]
- Maham, Y.; Lebrette, L.; Mather, A.E. Viscosities and excess properties of aqueous solutions of Mono- and Diethylethanolamines at temperatures between 298.15 and 353.15 K. J. Chem. Eng. Data 2002, 47, 550–553. [Google Scholar] [CrossRef]
- Korson, L.; Hansen, W.D.; Millero, F.J. Viscosity of water at various temperatures. J. Phys. Chem. 1969, 73, 34–39. [Google Scholar] [CrossRef]
- Kauzmann, W.; Eyring, H. The viscous flow of large molecules. J. Am. Chem. Soc. 1940, 62, 3113–3125. [Google Scholar] [CrossRef]
- Oskoei, A.G.; Safaei, N.; Ghasemi, J. Densities and viscosities for binary and ternary mixtures of 1, 4-Dioxane + 1-Hexanol + N,N-Dimethylaniline from T = (283.15 to 343.15) K. J. Chem. Eng. Data 2008, 53, 343–349. [Google Scholar] [CrossRef]
- Fort, R.J.; Moore, W.R. Viscosities of binary liquid mixtures. Trans. Faraday Soc. 1966, 62, 1112–1119. [Google Scholar] [CrossRef]
- Bhatia, S.C.; Bhatia, R.; Dubey, G.P. Studies on transport and thermodynamic properties of binary mixtures of octan-1-ol with chloroform, 1,2-dichloroethane and 1,1,2,2-tetrachloroethane at 298.15 and 308.15 K. J. Mol. Liq. 2009, 144, 163–171. [Google Scholar] [CrossRef]
- Grunberg, L.; Nissan, A.H. Mixture law for viscosity. Nature 1949, 164, 799–800. [Google Scholar] [CrossRef]
- Eyring, H. Viscosity, Plasticity, and Diffusion as example of absolute reaction rates. J. Chem. Phys. 1936, 4, 283–291. [Google Scholar] [CrossRef]
- Meyer, R.; Meyer, M.; Metzger, J.; Peneloux, A. Thermodynamic and physicochemical properties of binary solvent. J. Chim. Phys. Phys. Chim. Biol. 1971, 68, 406–412. [Google Scholar] [CrossRef]
- Kinart, C.M.; Kinart, W.J.; Ćwiklińska, A. 2-Methoxyethanol–Tetrahydrofuran–binary liquid system. Viscosities, densities, excess molar volumes and excess Gibbs activation energies of viscous flow at various temperatures. J. Therm. Anal. Calorim. 2002, 68, 307–317. [Google Scholar] [CrossRef]
- Oswal, S.; Rathnam, M.V. Viscosity data of binary mixtures: Ethyl acetate + cyclohexane, + benzene, + toluene, + ethylbenzene + carbon tetrachloride, and + chloroform at 303.15 K. Can. J. Chem. 1984, 62, 2851–2853. [Google Scholar] [CrossRef]
- Ćwiklińska, A.; Kinart, C.M. Thermodynamic and physicochemical properties of binary mixtures of nitromethane with {2-methoxyethanol+2-butoxyethanol} systems at T= (293.15, 298.15, 303.15, 308.15, and 313.15)K. J. Chem. Thermodyn. 2011, 43, 420–429. [Google Scholar] [CrossRef]
- Hartono, A.; Mba, E.O.; Svendsen, H.F. Physical properties of partially CO2 loaded aqueous monoethanolamine (MEA). J. Chem. Eng. Data 2014, 59, 1808–1816. [Google Scholar] [CrossRef]
- McAllister, R.A. The viscosity of liquid mixtures. AIChE J. 1960, 6, 427–431. [Google Scholar] [CrossRef]
- Karunarathne, S.S.; Øi, L.E. Density and viscosity correlations for aqueous 3-amino-1-propanol and monoethanol amine mixtures. Proceedings of SIMS 60, Västeräs, Sweden, 13–16 August 2019. [Google Scholar]
Figure 1.
(a) Excess molar volumes VE of MDEA (1) + H2O (2), ‘□’; DMEA (1) + H2O (2), ‘◊’ and DEEA (1) + H2O (2), ‘∆’ at 293.15 K, Correlation; “―”. (b) Excess molar volumes VE of MDEA (1) + H2O (2), ‘□’; DMEA (1) + H2O (2), ‘◊’ and DEEA (1) + H2O (2), ‘∆’ at 353.15 K, Correlation; “―”.
Figure 1.
(a) Excess molar volumes VE of MDEA (1) + H2O (2), ‘□’; DMEA (1) + H2O (2), ‘◊’ and DEEA (1) + H2O (2), ‘∆’ at 293.15 K, Correlation; “―”. (b) Excess molar volumes VE of MDEA (1) + H2O (2), ‘□’; DMEA (1) + H2O (2), ‘◊’ and DEEA (1) + H2O (2), ‘∆’ at 353.15 K, Correlation; “―”.

Figure 2.
(a) Partial molar volumes of MDEA in (MDEA + H2O), ‘□’; DMEA in (DMEA + H2O), ‘◊’ and DEEA in (DEEA + H2O), ‘∆’ at 298.15 K. (b) Partial molar volumes of MDEA in (MDEA + H2O), ‘□’; DMEA in (DMEA + H2O), ‘◊’ and DEEA in (DEEA + H2O), ‘∆’ at 353.15 K.
Figure 2.
(a) Partial molar volumes of MDEA in (MDEA + H2O), ‘□’; DMEA in (DMEA + H2O), ‘◊’ and DEEA in (DEEA + H2O), ‘∆’ at 298.15 K. (b) Partial molar volumes of MDEA in (MDEA + H2O), ‘□’; DMEA in (DMEA + H2O), ‘◊’ and DEEA in (DEEA + H2O), ‘∆’ at 353.15 K.


Figure 3.
Viscosities of MDEA (1) + H2O (2), ‘□’; DMEA (1) + H2O (2), ‘◊’ and DEEA (1) + H2O (2), ‘∆’ mixtures at 293.15 K, Correlation; “―”.
Figure 3.
Viscosities of MDEA (1) + H2O (2), ‘□’; DMEA (1) + H2O (2), ‘◊’ and DEEA (1) + H2O (2), ‘∆’ mixtures at 293.15 K, Correlation; “―”.

Figure 4.
(a–c) ηE, ln(ηγ) and ΔGE* of MDEA (1) + H2O (2), ‘□’; DMEA (1) + H2O (2), ‘◊’ and DEEA (1) + H2O (2), ‘∆’ mixtures at 293.15 K.
Figure 4.
(a–c) ηE, ln(ηγ) and ΔGE* of MDEA (1) + H2O (2), ‘□’; DMEA (1) + H2O (2), ‘◊’ and DEEA (1) + H2O (2), ‘∆’ mixtures at 293.15 K.

Figure 5.
Excess entropy of activation for viscous flow (ΔSE*) for MDEA (1) + H2O (2), ‘□’; DMEA (1) + H2O (2), ‘◊’ and DEEA (1) + H2O (2), ‘∆’ mixtures as a function of mole fractions.
Figure 5.
Excess entropy of activation for viscous flow (ΔSE*) for MDEA (1) + H2O (2), ‘□’; DMEA (1) + H2O (2), ‘◊’ and DEEA (1) + H2O (2), ‘∆’ mixtures as a function of mole fractions.

Table 1.
Molecular structures and IUPAC names of N-methyldiethanolamine (MDEA), Dimethylethanolamine (DMEA), and Diethylethanolamine (DEEA).
Table 1.
Molecular structures and IUPAC names of N-methyldiethanolamine (MDEA), Dimethylethanolamine (DMEA), and Diethylethanolamine (DEEA).
| Solvent with Common Name | Molecular Structure with IUPAC Name |
|---|---|
| N-methyldiethanolamine (MDEA) |  |
| 2-(2-Hydroxyethyl-methyl-amino)ethanol | |
| Dimethylethanolamine (DMEA) |  |
| 2-(Dimethylamino)ethanol | |
| Diethylethanolamine (DEEA) |  |
| 2-(Diethylamino)ethanol |
Table 2.
Material description. a
| Chemical Name | CAS No | Source | Purity a | Purification |
|---|---|---|---|---|
| MDEA | 105-59-9 | Merck KGaA | ≥98.0 | no |
| DEEA | 100-37-8 | Sigma-Aldrich | ≥99.5 | no |
| DMEA | 108-01-0 | Alfa Aesar | ≥99.0 | no |
a As mentioned by the supplier.
Table 3.
Measured density (ρ/kg·m−3) of pure amines MDEA, DMEA, and DEEA.
| T/K | MDEA | DMEA | DEEA | |||
|---|---|---|---|---|---|---|
| This Work | Literature | This Eork | Literature | This Work | Literature | |
| 293.15 | 1040.6 | 887.9 | 887.5 d | 884.3 | 884.2 d | |
| 298.15 | 1036.8 | 1036.8 a, 1035.9 b | 883.7 | 883.3 a 882.6 c 883.1 d | 879.7 | 879.5 a 879.5 d 879.3 e |
| 303.15 | 1033.1 | 1032.0 b | 879.4 | 878.4 c 878.9 d | 875.1 | 874.8 d 874.6 e |
| 308.15 | 1029.3 | 1029.0 a | 875.1 | 875.5 a | 870.4 | 871.4 a |
| 313.15 | 1025.5 | 1024.5 b | 870.8 | 869.9 c 870.3 d | 865.8 | 865.6 d 865.0 e |
| 318.15 | 1021.7 | 1022.6 a | 866.4 | 867.3 a | 861.1 | 861.8 a |
| 323.15 | 1017.9 | 1016.7 b | 862.0 | 856.3 | ||
| 328.15 | 1014.0 | 857.6 | 851.6 | |||
| 333.15 | 1010.2 | 1009.0 b | 853.1 | 851.9 c | 846.8 | 846.5 e |
| 338.15 | 1006.3 | 848.6 | 841.9 | |||
| 343.15 | 1002.4 | 1001.2 b | 843.8 | 837.1 | ||
| 348.15 | 998.5 | 839.6 | 832.3 | |||
| 353.15 | 994.6 | 993.7 b | 834.7 | 833.8 c | 827.4 | 827.2 e |
Table 4.
Temperature dependency of the Redlich–Kister coefficients (Ai) for the excess molar volume (106 · VE/m3 · mol−1) of different aqueous amine mixtures.
Table 4.
Temperature dependency of the Redlich–Kister coefficients (Ai) for the excess molar volume (106 · VE/m3 · mol−1) of different aqueous amine mixtures.
| Parameters | Mixtures | |||||
|---|---|---|---|---|---|---|
| MDEA (1) + H2O (2) | DMEA (1) + H2O (2) | DEEA (1) + H2O (2) | ||||
| a0 | a1 | a0 | a1 | a0 | a1 | |
| A0 | −7.847 | 0.0111 | −7.363 | 0.00313 | −10.120 | 0.00884 |
| A1 | 5.378 | −0.00932 | 6.103 | −0.01065 | 5.082 | −0.00770 |
| A2 | −2.584 | 0.00663 | −1.532 | 0.00017 | −2.175 | 0.00491 |
| A3 | 8.187 | −0.02062 | 18.490 | −0.05285 | 13.530 | −0.04196 |
| A4 | 1.599 | −0.00537 | −0.774 | 0.00274 | −2.203 | 0.00395 |
| A5 | −15.300 | 0.03798 | −29.660 | 0.08247 | −16.060 | 0.05570 |
| AARD (%) | 0.007 | 0.015 | 0.011 | |||
| AMD (kg·m3) | 0.97 | 1.04 | 0.80 | |||
Table 5.
Temperature dependency of the Redlich–Kister coefficients (Ai) for the density deviation ln(ργ) of different aqueous amine mixtures.
Table 5.
Temperature dependency of the Redlich–Kister coefficients (Ai) for the density deviation ln(ργ) of different aqueous amine mixtures.
| Parameters | Mixtures | |||||
|---|---|---|---|---|---|---|
| MDEA (1) + H2O (2) | DMEA (1) + H2O (2) | DEEA (1)+ H2O (2) | ||||
| a0 | a1 | a0 | a1 | a0 | a1 | |
| A0 | 0.3054 | −6.25 × 10⁻⁴ | 0.2197 | −9.27 × 10⁻⁴ | 0.2491 | −11.42 × 10⁻⁴ |
| A1 | −0.4206 | 8.48 × 10⁻⁴ | −0.3892 | 12 × 10−4 | −0.4277 | 14.91 × 10⁻⁴ |
| A2 | 0.4459 | −9.12 × 10⁻⁴ | 0.3690 | −10.5 × 10⁻⁴ | 0.5542 | −17.69 × 10⁻⁴ |
| AARD (%) | 0.1 | 0.03 | 0.04 | |||
| AMD (kg·m−3) | 3.0 | 1.5 | 2.7 | |||
Table 6.
Measured viscosity (η/mPa·s) of pure amines MDEA, DMEA, and DEEA.
| T/K | MDEA | DMEA | DEEA | |||
|---|---|---|---|---|---|---|
| This Work | Literature | This Work | Literature | This Work | Literature | |
| 293.15 | 100.72 | 3.89 | 4.95 | |||
| 298.15 | 75.90 | 77.19 a | 3.39 | 4.17 | 4.02 b | |
| 303.15 | 57.82 | 2.96 | 3.54 | 3.31 b | ||
| 308.15 | 44.62 | 2.59 | 3.01 | |||
| 313.15 | 34.89 | 34.11 a | 2.28 | 2.24 c | 2.58 | 2.41 b |
| 318.15 | 27.67 | 2.01 | 2.24 | |||
| 323.15 | 22.22 | 1.79 | 1.76 c | 1.95 | ||
| 328.15 | 18.10 | 1.60 | 1.71 | |||
| 333.15 | 14.89 | 14.30 a | 1.43 | 1.41 c | 1.51 | 1.44 b |
| 338.15 | 12.38 | 1.29 | 1.35 | |||
| 343.15 | 10.38 | 9.85 a | 1.17 | 1.16 c | 1.21 | |
| 348.15 | 8.78 | 1.05 | 1.09 | |||
| 353.15 | 7.48 | 7.12 a | 0.96 | 0.96 c | 0.98 | 0.93 b |
| 358.15 | 6.43 | 0.87 | 0.90 | |||
| 363.15 | 5.56 | 0.80 | 0.82 | |||
Table 7.
Coefficients (Ai) for the viscosity deviation ln(ηγ) of different aqueous amine mixtures.
| Parameters | Mixtures | ||
|---|---|---|---|
| MDEA (1) + H2O (2) | DMEA (1) + H2O (2) | DEEA (1) + H2O (2) | |
| A0 | 98.13 | 99.61 | 123.5 |
| A1 | −0.4163 | −0.4218 | −0.528 |
| A2 | 5.008 × 10⁻⁴ | 5.013 × 10⁻⁴ | 6.291 × 10⁻⁴ |
| A3 | −29.09 | −33.79 | −45.8 |
| A4 | 0.0838 | 0.1083 | 0.1498 |
| A5 | −10.47 | −14.69 | −18.31 |
| AARD (%) | 1.7 | 2.7 | 4.7 |
| AMD (mPa·s) | 6.4 | 1.3 | 2.4 |
Table 8.
Calculated parameters of McAllister’s three-body model.
| T/K | Mixtures | |||||
|---|---|---|---|---|---|---|
| MDEA (1) + H2O (2) | DMEA (1) + H2O (2) | DEEA (1) + H2O (2) | ||||
| 106 · v12 | 106 · v21 | 106 · v12 | 106 · v21 | 106 · v12 | 106 · v21 | |
| 293.15 | 44.0582 | 2089.1458 | 3.2724 | 596.7573 | 2.7885 | 1646.6703 |
| 298.15 | 33.9711 | 1340.1148 | 2.9023 | 385.8739 | 2.3762 | 1001.7568 |
| 303.15 | 26.1935 | 883.1637 | 2.6000 | 255.3182 | 2.0452 | 624.2248 |
| 308.15 | 20.3995 | 597.3544 | 2.3060 | 173.9052 | 1.7780 | 402.8284 |
| 313.15 | 16.2081 | 414.6814 | 2.0658 | 121.4510 | 1.5613 | 266.5363 |
| 318.15 | 13.0073 | 296.0447 | 1.8692 | 87.3140 | 1.3573 | 184.4744 |
| 323.15 | 10.4386 | 216.2663 | 1.6745 | 64.2968 | 1.1800 | 131.5663 |
| 328.15 | 8.5464 | 162.4728 | 1.5001 | 48.5945 | 1.0466 | 96.5934 |
| 333.15 | 7.0675 | 124.2767 | 1.3573 | 37.5439 | 0.9282 | 72.6396 |
| 338.15 | 5.8446 | 97.0776 | 1.2282 | 29.5331 | 0.8151 | 56.2896 |
| 343.15 | 4.8818 | 77.1314 | 1.1113 | 23.7008 | 0.7229 | 44.5010 |
| 348.15 | 4.2867 | 59.2349 | 1.0055 | 19.2115 | 0.6412 | 35.7128 |
| 353.15 | 3.6529 | 48.6431 | 0.9190 | 15.7291 | 0.5801 | 28.9483 |
| AARD (%) | 8.4 | 9.2 | 16 | |||
© 2020 by the authors. Licensee MDPI, Basel, Switzerland. This article is an open access article distributed under the terms and conditions of the Creative Commons Attribution (CC BY) license (http://creativecommons.org/licenses/by/4.0/).
Share and Cite
MDPI and ACS Style
Karunarathne, S.S.; Eimer, D.A.; Øi, L.E. Density, Viscosity, and Excess Properties of MDEA + H2O, DMEA + H2O, and DEEA + H2O Mixtures. Appl. Sci. 2020, 10, 3196. https://doi.org/10.3390/app10093196
AMA Style
Karunarathne SS, Eimer DA, Øi LE. Density, Viscosity, and Excess Properties of MDEA + H2O, DMEA + H2O, and DEEA + H2O Mixtures. Applied Sciences. 2020; 10(9):3196. https://doi.org/10.3390/app10093196
Chicago/Turabian StyleKarunarathne, Sumudu S., Dag A. Eimer, and Lars E. Øi. 2020. "Density, Viscosity, and Excess Properties of MDEA + H2O, DMEA + H2O, and DEEA + H2O Mixtures" Applied Sciences 10, no. 9: 3196. https://doi.org/10.3390/app10093196
Note that from the first issue of 2016, this journal uses article numbers instead of page numbers. See further details here.