Featured Application
A quick, green, and simple ultrasound-assisted microextraction was here developed and validated for a quick and simple evaluation of total phenolic content from almond oil residues for their valorization as a source of antioxidant compounds.
Abstract
Almond (Prunus dulcis (Mill.) D.A. Webb) is one of the most important nut crops both in terms of area and production. Over the last few decades, an important part of the beneficial actions for health associated with their consumption was attributed to the phenolic compounds, mainly accumulated in almond skin. Interestingly, after cold-pressed oil extraction, most of these antioxidant phenolic compounds are retained in a skin-enriched by-product, a so-called almond cold-pressed oil residue. In Morocco, the fifth highest ranking producer in the world, this production generates an important part of this valuable byproduct. In the present study, using a multivariate Box–Behnken design, an ultrasound-assisted extraction method of phenolic compounds from Moroccan almond cold-pressed oil residue was developed and validated. Response surface methodology resulted in the optimal extraction conditions: the use of aqueous ethanol 53.0% (v/v) as a green solvent, applying an ultrasound frequency of 27.0 kHz for an extraction duration of 29.4 min. The present ultrasound-assisted extraction allowed substantial gains in terms of extraction efficiency compared to conventional heat reflux extraction. Applied to three different local Beldi genotypes growing at three different experimental sites, the optimal conditions for ultrasound-assisted extraction led to a total phenolic content of 13.86 mg/g dry weight. HPLC analysis revealed that the main phenolic compounds from this valuable byproduct were: chlorogenic acid followed by protocatechuic acid, p-hydroxybenzoic acid, and p-coumaric acid. The accumulation of these phenolic compounds appeared to be more dependent on the genetic background than on the environmental impact here represented by the three experimental culture sites. Both in vitro cell free and cellular antioxidant assays were performed, and revealed the great potential of these extracts. In particular, correlation analysis provided evidence of the prominent roles of chlorogenic acid, protocatechuic acid, and p-hydroxybenzoic acid. To summarize, the validated ultrasound-assisted extraction method presented here is a quick, green, simple and efficient for the possible valorization of antioxidant phenolic compounds from Moroccan almond cold-pressed oil residues, making it possible to generate extracts with attractive antioxidant activities for future nutraceutical and/or cosmetic applications.
1. Introduction
Consumption of fruits, vegetables, nuts, and seeds has been associated with lower risks of chronic and degenerative diseases [1,2,3,4]. Particularly, given their many beneficial effects on human health, in recent decades, there has been growing interest in the consumption of nuts as a nutrient-rich food [3]. Produced and consumed worldwide, almond (Prunus dulcis (Mill.) D.A.Webb) is one of the most popular nuts. It can be consumed in the form of whole nuts, flour, and beverages proposed in the food industry. A large part of almond health benefits has been ascribed to their lipid profile [3,4]. Almond oil is also a sought-after and attractive component for many cosmetic formulations. Over the last few decades, the part of the beneficial actions for health, but also of the growing interest for industrial applications, ascribed to almond phenolics have become increasing [3,4,5].
The high antioxidant capacity of almond phenolics make it an attractive alternative to synthetic antioxidants. Synthetic antioxidants were largely used to maintain the oxidative stability of emulsions and commonly used in food products and pharmaceutical and cosmetic preparations. However, synthetic antioxidants such as butylated hydroxyanisole (BHA) or butylated hydroxytoluene (BHT) have adverse health effects, including carcinogenesis [6,7,8]. Therefore, the use of some of these synthetic antioxidants is now prohibited for food applications in Japan, Canada, and Europe, and they have been removed from what is generally recognized as a safe (GRAS) list. The replacement of these widely criticized synthetic molecules with natural molecules would meet the expectations of manufacturers and consumers. Therefore, it is now important to identify the natural antioxidants with a pronounced and safer radical scavenging capacity for consumers. Despite their distinct lipophilicity profile compared to BHA or BHT, some natural antioxidant phenolics have been shown to be as effective as these synthetic antioxidants in stabilizing nonpolar systems such as bulk oil or different emulsion types [9,10,11], in good agreement with the prediction of polar paradox theory [12]. Interestingly, after cold-pressed oil extraction, most of the antioxidant phenolic compounds accumulated in the almond skin are retained in a skin-enriched by-product [3,5,13], making this almond cold-pressed oil residue (AOR) an attractive raw material for extraction and the valorization of these natural antioxidant phenolics. In Morocco, the fifth highest ranking producer in the world, almond is the most important nut crop both in terms of area and production value. Several local genotypes, called Beldi, which means “from here” as opposed to acclimatized genotypes called Romi (i.e., from elsewhere) [14], are of special interest [15]. The almond plantations cover a total area of 150,000 ha for an average annual production estimated at 100,000 tons of unshelled products, of which 9% of this area which provides up to 14% of the Moroccan almond production is located in Eastern Morocco (Figure 1) [15]. This production generates an important part of byproducts, in particular of cold pressed almond oil residues. To date, these by-products of almond oil have been used primarily for animal feed, as litter or for energy production. However, upgrading to higher value-added sectors would significantly increase the revenue from this byproduct valuation. With an average growth rate of 5% per year since 2010 and a large profit margin, the cosmetics market is a dynamic industry. However, this sector is very competitive, with companies facing ever more restrictive environmental regulations (such as REACH in European Union), in addition to consumer pressures that push them to innovate and gradually shift to more natural products and green production methods. The functional properties of several oleaginous species of agro-waste, including their antioxidant activity, in relation to their high concentration in phenolic compounds, have been documented [9,13,16,17,18,19,20,21,22,23,24,25,26,27]. The application of the biorefinery principle to the recovery of natural antioxidants from almond by-products as cosmetic active ingredients would therefore represent a good opportunity for the almond sector compared to their current use.
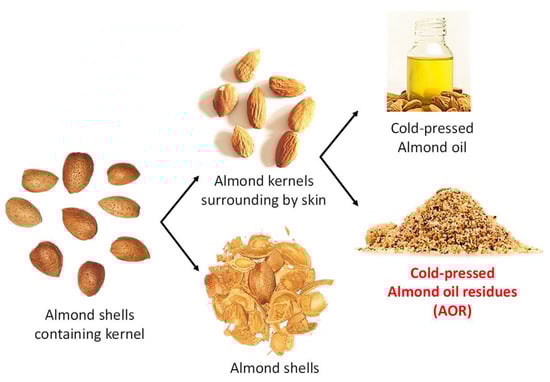
Figure 1.
Parts of almond fruits leading to cold-pressed almond oil and its residue (AOR) used as byproduct in the present study to extract phenolic compounds.
For optimal valorization of these natural co-products, the development of effective extraction methods is necessary. In the past, there were many methods developed for the extraction of natural antioxidants from various natural matrices based on conventional methods such as maceration or Soxhlet extraction. More recently, green extraction methods including microwave-assisted extraction or ultrasound-assisted extraction (USAE) have been found to be particularly effective [11,21,28,29,30]. These green extraction technologies have also aroused great interest for industrial applications, and USAE is now considered as one of the most efficient energy saving processes in terms of duration, selectivity, and reproducibility, operating under mid-extraction conditions [28]. It is accepted that the improvement in extraction efficiency obtained using the USAE is based on both acoustic cavitation and mechanical effects [28]. Indeed, ultrasound (US) produces an acoustic cavitation effect facilitating the penetration of the extraction solvent. Therefore, easier release of the intracellular contents of the plant material is observed through greater agitation of the solvent resulting in increased surface contact between the solvent and the target compound as well as increased solubility of the target compound in the solvent of extraction [28].
Here, we report on the development and validation of a USAE method for the extraction of antioxidant phenolic acids from an enriched skin fraction made up of cold pressed AOR from Bedli Moroccan genotypes produced in Eastern Morocco (Figure 1).
Recently, Prgomet et al. [13] have also developed a method for comparing the polyphenol fractions from different almond byproducts including the skin using almond varieties from Portugal, but using a conventional heat reflux method. An USAE method was developed by Kahlaoui et al. [18] for the extraction of polyphenols from another almond byproduct: the hulls (the part surrounding the shell itself surrounded by the thin skin; Figure 1) from Italian and Tunisian varieties. It is thus of special interest to compare our method optimized using a different genotype, but more importantly either a green extraction method or a different (by)product. The optimal extraction conditions of this USAE using ethanol as a solvent were obtained through a multivariate technique (Behnken–Box design) coupled with response surface methodology (RSM) and then validated according to international standards of the association of analytical communities (AOAC). This USAE was applied to investigate the influence of the genetic and environment on the phenolic contents by considering three different local Beldi genotypes growing at three different experimental sites. Both in vitro cell free and cellular antioxidant assays were performed to evaluate the evolution of antioxidant activity of the corresponding extracts. Finally, correlations linking phytochemical profile and antioxidant activities of the extracts are presented.
2. Materials and Methods
2.1. Chemicals and Reagents
Extraction solvents (ethanol and water) used in the present study were of analytical grade (Thermo Scientific, Illkirch, France). Reagents for antioxidant assays as well as standards (chlorogenic acid, p-coumaric acid, protocatechuic acid and p-hydroxybenzoic acid) were purchased from Merck (Saint-Quentin Fallavier, France).
2.2. Plant Materials and Culture Conditions
AOR were obtained from Moroccan almonds (local ecotypes Beldi) grown in 3 different pilot locations in the Eastern Morocco (Sidi Bouhria (SID; 34°44′13.6″ N, 002°20′15.0″ W); Ain Sfa (AIN; 34°46′42.4″ N, 002°09′28.9″ W); Rislane (RIS; 34°44′59.8″ N, 002°26′44.7″ W)) using growing conditions as previously described by Melhaoui et al. [15]. Almonds were then triturated using an oil screw press (KOMET DD85G, IBG Monforts Oekotec GmbH & Co. KG, Monchengladbach, Germany) and the residues were ground to ca. 100–150 µm particles using a blender equipped with rotating blades (Grindomix GM 200 blender, Retsch France, Eragny, France) used as raw materials for USAE optimization.
2.3. Ultrasound-Assisted Extraction Method Development
USAE was completed with an ultrasonic bath (USC1200TH, Prolabo, Sion, Switzerland) composed of a 300 × 240 × 200 mm (inner dimension) tank, with electric power of 400 W corresponding to an acoustic power of 1 W/cm2 and maximal heating power of 400 W. The variable frequencies of this device can be selected thanks to a frequency controller, and it also has a temperature regulator as well as an automatic digital timer. Each sample was placed in 50 mL quartz tubes equipped with a vapor condenser, and was suspended in 10 mL extraction solvent. A liquid to solid ratio of 10:1 mL/g DW (dry weight) was used and extraction was performed at 45 °C.
For Extraction optimization a Box–Behnken design was used and the resulting response surface plots drawn with the help of XLSTAT2019 software (Addinsoft, Paris, France). For this purpose, three variables (aqueous Ethanol (aqEtOH) concentration (X1), US frequency (X2), and extraction duration (X3)) were studied and coded at three levels (−1, 0 and +1) as described in Table 1:

Table 1.
Identity, code unit, coded levels, and actual experimental values of each variable used for USAE of TPC from almond oil residues.
The different batches were obtained by using the DOE (design of experiment) function of XLSTAT 2019 (Addinsoft, Paris, France), which take values of selective variables at different levels (Table 2). The experiments were carried out in triplicate. Equation of the model for the extraction of total phenolics from almond oil residues was calculated using the XLSTAT 2019 DOE analysis tool (Addinsoft, Paris, France). The corresponding response surface plots were obtained with 3D option of XLSTAT 2019 (Addinsoft, Paris, France).
Table 2.
Results of Box–Behnken experimental design of USAE of TPC from AOR.
2.4. Determination of Total Phenolic Content
After extraction, each extract was centrifuged for 15 min at 5000× g (Heraeus Biofuge Stratos, Thermo Scientific, Illkirch, France) and the resulting supernatant filtered using a syringe filter (0.45 µm, Merck Millipore, Molsheim, France) prior to analysis.
The total phenolic content (TPC) was determined spectrophotometrically using the Folin–Ciocalteu reagent (Merck, Saint-Quentin Fallavier, France) and according to the protocol adapted for a microplate reader described by Abbasi et al. [31]. Briefly, 10 µL of extract were homogenized with 180 µL of a mixture composed of 4% (w/v) Na2CO3 (prepared in NaOH 0.1 M), 0.02% (w/v) potassium sodium tartrate tetrahydrate and 0.02% CuSO4. Following a 10-min of incubation at 25 °C, 10 µL of the Folin–Ciocalteu reagent were added, and the homogenized mixture was incubated for 30 min at 25 °C. Absorbance was measured at 650 nm with a spectrophotometer (BioTek ELX800 Absorbance Microplate Reader, BioTek Instruments, Colmar, France). A standard curve (0–40 μg/mL; R2 = 0.998) of gallic acid (Merck, Saint-Quentin Fallavier, France) was used to express the TPC in mg of gallic acid equivalents per g DW (mg GAE/g DW).
2.5. Validation Parameters
Method validation was carried out using the recommendations of the association of analytical communities (AOAC) in terms of precision, repeatability, and recovery as described in detail in Corbin et al. [21].
For HPLC, 6-point calibration lines were obtained by means of diluted solutions of each authentic commercial standard (Merck, Saint-Quentin Fallavier, France). Each sample was injected three times, and arithmetic means were calculated to generate linear regression equations plotting was done by the peak areas (y) against the injected quantities (x) of each standard. Coefficients of determination (R2) were used for linearity verification. The limits of detection (LOD) and of quantification (LOQ) was calculated using signal-to-noise ratios of 3:1 and 10:1, respectively.
2.6. HPLC Analysis
After extraction, each extract was centrifuged for 15 min at 3000 rpm and the resulting supernatant filtered using a syringe filter (0.45 µm, Millipore, Molsheim, France) prior to analysis. Separation and identification of the main extract constituents was done by HPLC with a Varian system (Varian, Les Ulis, France) composed of: Prostar 230 pump, Metachem Degasit, Prostar 410 autosampler, Prostar 335 Photodiode Array Detector (PAD) and driven by Galaxie version 1.9.3.2 software (Varian, Les Ulis, France). A Purospher RP-18 column (250 × 4.0 mm internal diameter; 5 µm) (Merck Chemicals, Molsheim, France) was used for the separation performed at a temperature set at 35 °C. The mobile phase was a mixture of: (i) A, which was acidified HPLC grade water with acetic acid (0.2% (v/v)), and (ii) B, which was HPLC grade methanol. During the separation run, the mobile phase composition varied according to a nonlinear gradient as follows: 8% B (0 min), 12% B (11 min), 30% B (17 min), 33% B (28 min), 100% B (30–35 min), and 8% B (36 min) at a flow rate of 1 mL/min. Between each injection, a 10-min re-equilibration time was applied. The detection of compounds was set at 295 and 325 nm (corresponding to the λmax of the main compounds). Quantification was done based on assessment of retention times of commercial standards (Merck, Saint-Quentin Fallavier, France).
2.7. Antioxidant Activities
2.7.1. In Vitro Cell Free DPPH Free Radical Scavenging Assay
The in vitro cell free DPPH (2,2-diphenyl-1-picrylhydrazyl) assay was used to evaluate the free radical scavenging activity of the samples as described by the microplate protocol of Shah et al. [32].
2.7.2. In Vitro Cell Free ABTS Antioxidant In Vitro Cell Free Assay
ABTS (2,2-azinobis(3-ethylbenzthiazoline-6-sulphonic acid)) in vitro cell free antioxidant activity of each extract was determined as described by Ullah et al. [33].
2.7.3. Cupric Ion Reducing Antioxidant Capacity (CUPRAC) In Vitro Cell Free Assay
CUPRAC assay was performed in a microplate as described by Drouet et al. [8].
2.7.4. Determination of Membrane Lipid Peroxidation Using Thiobarbituric Acid-Reactive Substances (TBARS) Assay
An in cellulo antioxidant assay, using yeast cells, based on the measurement of membrane lipid peroxide, was carried out with the thiobarbituric acid (TBA; Merck, Saint-Quentin Fallavier, France) method as described by Garros et al. [34].
2.8. Statistical Analysis
Means and standard deviations of three to five independent replicates were used to present the data. Model analysis (ANOVA) and 3D plots resulting from the combination of variables were performed using XLSTAT 2019 and R analysis following the manufacturer’s instructions (Addinsoft, Paris, France). A Student’s t-test was performed for comparative statistical analysis of the impact of the different cultivation sites (XLSTAT 2019, Addinsoft, Paris, France). Correlation analysis was performed with Past 3.0 (Øyvind Hammer, Natural History Museum, University of Oslo, Oslo, Norway) using the Pearson parametric correlation test and visualized using Heatmapper [35]. Principal Component Analysis (PCA) was performed with Past 3.0 (Øyvind Hammer, Natural History Museum, University of Oslo, Oslo, Norway). Significant thresholds at p < 0.05 or p < 0.05, <0.01 and <0.001 were used for all statistical tests and represented by different letters or by *, ** and ***, respectively.
3. Results and Discussion
3.1. Development of the Ultrasound-Assisted Extraction Using Box–Behnken Design
Multivariate techniques are used very effectively to optimize the extraction method from complex plant matrices such as food products and by-products [36]. Among the different multivariate techniques, when three factors are considered, the Behnken–Box design is one of the most effective techniques [36,37]. The Behnken–Box matrix is a spherical and rotating design, which, viewed on a cube, consists of the central point and the middle of the edges [36,37]. Many parameters can influence the extraction of phenolic compounds from plant matrices [38], but three parameters are very widely distinguished when developing an USAE method: the type of solvent used, the frequency of ultrasound applied and the extraction time [11,21,30].
The choice of solvent is a crucial parameter to define when developing an extraction method. Various solvents, including methanol, ethanol, or acetone, are regularly used for the extraction of plant polyphenols [28,39]. Here, given our objective of developing an extraction method in accordance with green chemistry principles for future nutraceutical and/or cosmeceutical applications of the resulting extract, EtOH was considered as an extraction solvent. First, EtOH is one of the less toxic solvents for humans and more respectful of the environment than other organic solvents such as methanol for example [38,40]. In addition, its extraction capacity can easily be modulated by addition of water, making it an ideal solvent for the extraction of a wide range of variable polarity polyphenols. Finally, these two universal solvents (i.e., EtOH and water) are already widely used for various food and/or cosmetic applications [11,28,30,38,40].
US frequency is a crucial parameter to consider because of its significant impact on the extraction efficiency. Indeed, this parameter modulates the cavitation effect as well as the diffusion coefficient of the target compound in the extraction solvent. Consequently, it improves the solubilization of the compound in the extraction solvent, thus increasing the extraction efficiency [28]. In addition, increasing US frequency can also lead to a drastic reduction in extraction time, thereby reducing energy consumption, which is in accordance with the green chemistry principles [41]. However, depending on the compound and the plant matrix subjected to the extraction, application of high US frequency can alter the native structure of the compound, which not only decreases the extraction yield, but also considerably reduces its biological activity, thus negating any valuation interest [30]. Therefore, during the development of an USAE method, US frequency must be optimized very carefully depending on the compound, and the plant matrix subjected to the extraction.
Finally, regarding the extraction time, it is important to consider that its increase does not necessarily lead to any improvement in extraction yield, since, contrarily, a prolonged exposure to US can lead to the increased degradation of the compound [30]. In addition, in order to reduce the impact of energy consumption in the green chemistry context, optimizing the extraction time also appears to be essential [41].
Having these considerations in mind, in order to develop a rapid, green and efficient USAE of TPC for the valorization of AOR, we therefore considered a Behnken–Box matrix with the following three parameters: aqEtOH concentration (X1), ultrasound (US) frequency (X2), and extraction duration (X3) as described in Table 1.
Table 2 presents the experimental and predicted TPC obtained from almond oil residues for the 18 different observations (run ID) corresponding the different USAE conditions of the Behnken–Box matrix having been determined randomly (run order) after an in silico-assisted procedure generated by the XL-Stat2019.4.1 software.
Here, the TPC extracted from AOR ranged from: 5.03 mg/g DW (Obs3; obtained after 30 min extraction in water bath (no US application) using pure water as extraction solvent) to 11.44 mg/g DW (Obs16; obtained after 30 min at an ultrasonic bath running at a US frequency of 22.5 kHz using 50% (v/v) aqEtOH as extraction solvent) (Table 2). These results provide a first indication on the interest of using an ultrasound and on the choice of an extraction solvent. We noted a good repeatability of the central point (i.e., Obs4, 5, 9, 11, 16, and 18), with a mean TPC of 11.37 ± 0.05 mg/g DW corresponding to a relative standard deviation (RSD) of 0.47%, thus highlighting the high reliability of these results. Given the nature of the starting material used in the present study, this range of TPC is in fairly good agreement with the data in the literature obtained with almond and/or almond by-products from California, Portugal, Italia, and Tunisia [3,5,18,42].
A multiple regression analysis was applied to the model of the TPC as a function of the three different extraction variables. Under the described conditions, the TPC (YTPC, in mg/g DW) as a function of the three different extraction variables (Table 1) in the form of a polynomial equation was (Table 3):
YTPC = 11.370 − 0.354X1 + 0.690X2 + 0.166X3 − 3.554X12 − 1.756X22 − 1.724X32 − 0.540X1X2 − 0.743X1X3 + 0.485X2X3
Table 3.
Statistical analysis of the regression coefficients of USAE of TPC from AOR.
The statistical analysis of the regression coefficients confirmed the relevance of our choice in the extraction variables and their respective levels for the development of the present USAE method if we refer to the level of significance with which these variables influenced the extraction (Table 3). The linear coefficients X1 (aqEtOH concentration) and X2 (extraction time) were statistically highly significant at p < 0.001, with an X1 coefficient being negative (high EtOH concentration reduced TPC) and X2 being positive (application of US treatment had a positive effect on TPC). An extraction duration (X3) coefficient was also significant at p < 0.01, but with a coefficient value close to zero indicating that a prolonged extraction period can lead to poorer extraction yield as a consequence of degradation as described in the literature [30,41,43]. All the quadratic and interaction coefficients were statistically highly significant at p < 0.001, but their values negative or close to zero indicated a negative or a lower impact to the extraction efficient.
The results of the analysis of variance (ANOVA) and model fitting are presented in Table 4. An elevated F-value (567.558) and low p-value (p < 0.0001) indicated the statistically highly significance of the model that could predict TPC as a function of the variable values with a great precision. The low non-significant value obtained for the lack of fit confirmed this trend. The value for the determination coefficient (R2 = 0.997 (with adjusted value of 0.998) for the model as well as the coefficient value (CV = 0.976) indicated the precision of the model as well as the adequacy between the model and experimental values, respectively. The model precision in the prediction of the TPC is further depicted by the predicted vs. experimental TPC plot presented in Figure S1.
Table 4.
ANOVA of the predicted model used for USAE of TPC from almond residues.
To better understand the complexity of the model, 3D plots representing TPC as a function of the extraction parameters were drawn (Figure 1).
The calculated, but small, values of the linear coefficients of the second-order polynomial equation for X2 (US frequency) and X3 (extraction duration), as well as their interaction coefficient X2X3 (US frequency x duration) indicate that a controlled increase of these parameters will have a global favorable consequences for the TPC extracted from AOR. However, their small values, in association with the negative values calculated for their quadratic coefficients (X22 and X32, respectively), but also of all the coefficient involving aqEtOH concentration (i.e., linear coefficient X1, quadratic coefficient X12, and the interaction coefficients X1X2 and X1X3), indicate that the TPC extracted from AOR according to these extraction parameters will reach a maximum value before decreasing for high values of these parameters. These considerations were clearly observed on the 3D plots (Figure 2). For each 3D plot, a first tendency was observed with a higher TPC extracted from AOR with increased aqEtOH concentration, application of US as well as prolonged extraction time. However, after reaching a maximal value for TPC extracted from AOR, a further increase in the aqEtOH concentrations as well as application of higher US frequency and/or prolonged extraction duration resulted in a pronounced drop of the TPC (Figure 2).
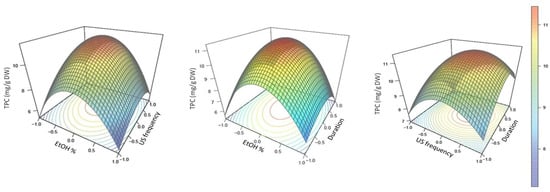
Figure 2.
Predicted surface response plots of the TPC extraction yield (in mg/g DW) as a function of aqEtOH concentration and US frequency, aqEtOH concentration and extraction duration, as well as US frequency and extraction duration.
In various concentrations in mixture with water, aqEtOH solutions have been widely used as eco-friendly solvents to extract a wide range of polyphenols from plant matrices [11,21,30,38,40] including various almond products [13,18,44]. However, to obtain optimal results, the concentration of aqEtOH must be adapted because it is very dependent on the polyphenolic compound(s) as well as on the plant matrix considered [28,38,40]. Alongside, it is clearly established that, during USAE, high US frequency associated with extended extraction duration could reveal destructive through the induction of polyphenols oxidation, in particular in the presence of water [21,28,30]. Consequently, if these parameters are not finely controlled (optimized), this can lead to a sharp reduction in the extraction yield, quantitatively but also qualitatively with a drastic decay observed in the biological interest of the sample extract [11,29,30]. Using the Box–Behnken matrix for optimizing these parameters and using the resulting adjusted second order polynomial equation, optimal conditions for the extraction of phenolics from our Moroccan AOR were: 53.0% (v/v) aqEtOH as solvent, 27.0 kHz for the US frequency and an extraction duration of 29.4 min. Using these optimal conditions resulted in a TPC of 11.63 ± 0.15 mg/g DW (Figure 2). The optimal aqEtOH concentration obtained here is in line with results obtained for almond phenolics extraction very recently described [13,18]), although the starting byproduct material or the extraction method used were different from our study.
The present method was then validated in respect with the AOAC standards. According to these standards, the parameter values of this validation procedure were adequate in terms of interday and intraday precision, but also repeatability and stability (Table 5). Indeed, the RSDs of both intraday and interday precisions were of 0.05 and 0.28%, respectively. The RSDs of the repeatability corresponding to five different extraction repeats of five samples from the same batch was of 1.30%. The recovery rates at three different addition levels of chlorogenic acid in the sample before extraction were between 100.26 and 101.13% reflect the accuracy of the present method.
Table 5.
Validation parameters of the developed method for quantifying TPC from almond residues.
The efficiency of the present USAE method was compared with conventional heat reflux extraction (HRE) using the same conditions, in particular an aqEtOH concentration (53.0% (v/v) and an extraction time of 29.4 min. The difference between USAE and HRE being the application of an US frequency of 27 kHz for the present optimized UASE extraction procedure, while no US was applied for the HRE protocol operating in a classical water bath. The comparison of these extractions is depicted in Figure 2. A significant gain of 30% in TPC extracted from AOR was observed with the optimized USAE (11.63 ± 0.15 mg/g DW) as compared to conventional HRE (8.96 ± 0.21 mg/g DW) (Figure 3). Increasing the extraction time for the HRE to one hour did not achieve performance levels similar to those obtained with USAE (9.24 ± 0.37 mg/g DW). Consequently, it appears that the USAE method developed in the present study is of real interest according to the principles of green chemistry [45], not only in terms of the use of a renewable green solvent, but also in terms of reducing the energy consumption. We hypothesize that this efficiency could be partly explained by the hot spot hypothesis indicating that the cavitation bubbles, after their collapse, act as a microreactor locally generating, in the surrounding solvent, a high temperature environment and pressure leading to more efficient rupture of the plant matrix subjected to extraction and increased release as well as solubilization of phenolic compounds [28].
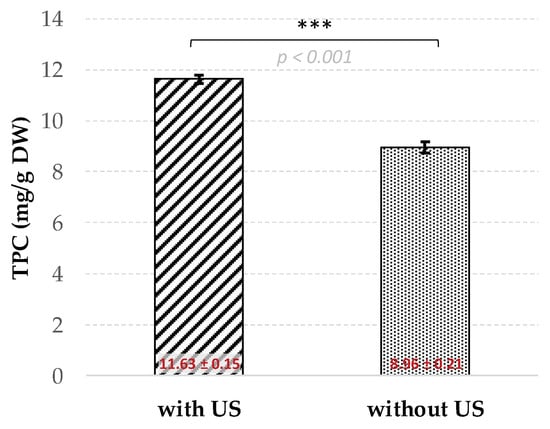
Figure 3.
TPC extracted from AOR using the optimal USAE (with US) conditions and comparison with conventional heat reflux method (HRE; without US). Means ± SD standard deviations of three independent extractions; *** significant at p < 0.001.
3.2. Application to the Analysis of Samples from Different Cultivation Sites
The present USAE was then applied to the quantification of phenolics in samples from three different local Beldi genotypes cultivated at three different locations in Eastern Morocco. In addition to the TPC, the concentration in protocatechuic acid, p-hydroxybenzoic acid, chlorogenic acid, and p-coumaric acid, reported as the main phenolic acids possibly accumulated in almond by-products [3,5,13,18,42,44,46], were also determined by HPLC after comparison with authentic commercial standards. Figure 4a shows a typical HPLC chromatogram, recorded at 325 nm, of the AOR extract obtained after USAE and showing the sepration of these four important phenolic acids: protocatechuic acid (1), p-hydroxybenzoic acid (2), chlorogenic acid (3), and p-coumaric acid (4) (Figure 4b).
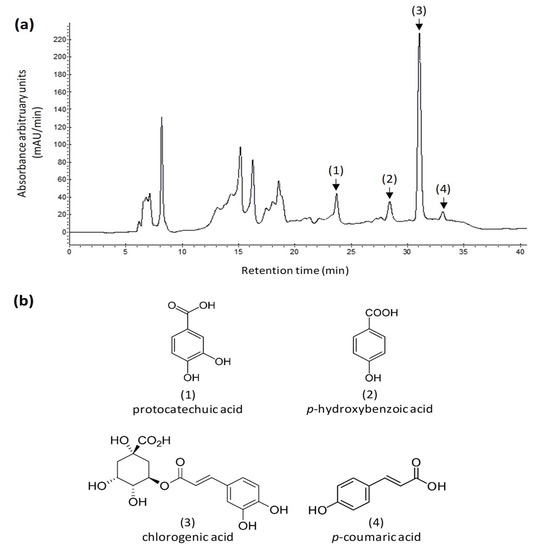
Figure 4.
(a) Representative HPLC chromatogram (here with detection set at 325 nm) of an extract prepared by USAE of AOR (Beldi cultivar) grown in the Ain Sfa (34°46′42.4″ N, 002°09′28.9″ W) pilot location in the eastern Morocco; (b) structures and their corresponding numbers on the HPLC chromatogram of the main phenolic compounds considered in this study: protocatechuic acid (1), p-hydroxybenzoic acid (2), chlorogenic acid (3), and p-coumaric acid (4).
In order to quantify these four phenolic compounds in different samples, 6-points calibration curves of the peak areas (y) against the injected amounts (x) of protocatechuic acid and p-hydroxybenzoic acid at 295 nm and chlorogenic acid and p-coumaric acid at 325 nm were obtained with a linearity over wide ranges from 0.5 to 200 mg/L of injected solutions and R2 greater than 0.999 (Table 6). The LODs ranged from 0.12 to 0.22 mg/mL, and LOQ from 0.38 to 0.73 mg/mL, for protocatechuic acid and chlorogenic acid, respectively (Table 6).
Table 6.
Quantification parameters of the HPLC method used to quantity protocatechuic acid, p-hydroxybenzoic acid, chlorogenic acid, and p-coumaric acid after their USAE from AOR.
Applied to the quantification of TPC, protocatechuic acid, p-hydroxybenzoic acid, chlorogenic acid and p-coumaric acid in AOR resulting from samples of three different native Beldi genotypes (#1 to #3) cultivated at three different pilot locations in the Eastern Morocco (Sidi Bouhria (SID); Ain Sfa (AIN); Rislane (RIS)), the results are presented in Table 7.
Table 7.
Variations in TPC, and protocatechuic acid, p-hydroxybenzoic acid, chlorogenic acid and p-coumaric acid contents in AOR from samples of three different native Beldi genotypes produced at three different pilot locations in the Eastern Morocco.
TPC ranged from 8.87 to 13.86 mg/g DW for extracts from samples AIN#1 and AIN#3, respectively; sample from genotype #3 cultivated at Ain Sfa being 56.25% richer in TPC than genotype #1 cultivated at the same location. The four quantified phenolic acids occurred for approximately 80% of the TPC. In decreasing contents: (1) chlorogenic acid was the main phenolic accumulated in the sample extracts with contents ranging from 5.29 ± 0.12 to 8.14 ± 0.10 mg/g DW for extracts from samples AIN#1 and AIN#3, respectively (sample from genotype #3 cultivated at Ain Sfa being 53.87% richer in chlorogenic acid than genotype #1 cultivated at the same location); (2) protocatechuic acid content ranged from 1.29 ± 0.06 to 2.03 ± 0.07 mg/g DW for extracts from samples AIN#1 and AIN#3, respectively (sample from genotype #3 cultivated at Ain Sfa being 57.36% richer in protocatechuic acid than genotype #1 cultivated at the same location, corresponding to the highest observed variation range); (3) p-hydroxybenzoic acid content ranged from 0.75 ± 0.03 to 1.13 ± 0.02 mg/g DW for extracts from samples AIN#1 and RIS#1 for the lowest content vs. sample AIN#3 for the highest content (sample from genotype #3 cultivated at Ain Sfa being 50.60% richer in p-hydroxybenzoic acid than genotype #1 cultivated both at Ain Sfa and Rislane); (4) p-coumaric acid content ranged from 0.21 ± 0.04 to 0.30 ± 0.02 mg/g DW for extracts from samples AIN#1 and AIN#3, respectively (sample from genotype #3 cultivated at Rislane being 42.85% richer in p-coumaric acid than genotype #1 cultivated at Ain Sfa, corresponding to the lowest observed variation range). The concentrations determined here for each phenolic compound were in the range of variations observed by Kahlaoui et al. [18] for different varieties of almond byproducts from Italia and Tunisia. Extraction of phenolic compounds from a variety of oilcakes such as hemp, canola, linseed, black cumin, sesame, fennel, sunflower, rapeseed, camelina, or milk thistle has been reported [9,11,16,17,20,21,22,24,25,26,27]. The TPC obtained from AOR using the present USAE method is at the top of the range compared to these other sources. Chlorogenic acid content has been reported to be high in sunflower oilcakes where its presence is problematic for the valorization of its derived protein meal by-product [26]. The other phenolic acids from AOR have been extracted from various oilcakes, such as flax, canola, and black cumin seedcakes for p-coumaric acid [9,20,21,24], black cumin, and camelina for p-hydroxybenzoic acid [9], while protocatechuic acid and p-hydroxybenzoic acid have been reported in camelina by-products [25]. Note that other types of phenolics such as lignans and or flavonoids in flax, sesame, and milk thistle seedcakes have been reported [16,21,22,23,24]. Interestingly, synergistic interactions between phenolic compounds could occur at concentrations found in nature for antioxidant activity [47]. Antagonism have been also described [47]. Therefore, the different compositions, but also the concentrations observed in different oilseed cakes, could result in different synergistic and/or antagonistic interactions towards their antioxidant capacity. This hypothesis is going to deserve future studies. However, it is also important to consider that these concentrations are subject to change as a result of both genetic and environmental influences as observed in milk thistle, flax, sesame, but also in some almond cultivars [34,48,49].
Indeed, it is generally accepted that the genetic background, but also the environmental conditions, such as the location (i.e., soil conditions) or the climate, could have a great influence on the accumulation of phenolic compounds [3,18,34,42,46,50]. The present preliminary results obtained from three native genotypes cultivated on the same year at three different location sites from Eastern Morocco suggested a prominent influence of genetic over environment, since the impact of the genotype was more important than the influence of the cultivation site. Indeed, for each considered cultivation sites, the genotype #1 accumulated more phenolic compounds than the genotype #3, whereas both the highest and the lowest accumulation were observed on the same location (i.e., Ain Sfa experimental site). Analyses of the variance (ANOVA) confirmed this absence of any significant influence of the cultivation site. Future works will be conducted with more genotypes as well as more experimental sites over several cultivation years to confirm or infirm this trend. However, the prominent influence of genetic background on the accumulation of phenolic compounds in almonds was reported by several authors [3,18,42,46], whereas the influence of environmental conditions on the same genotype was less studied. Bolling et al. [42] reported that the cultivation season influenced less polyphenolic accumulation than the genotype. The influence of cultivation site of the same genotype will deserve further works.
An improvement in the quantity of phenolic compounds produced in the future may also be envisaged, in the future, by combining this USAE with base or acid hydrolysis to release the wall-bound phenolics or extract further antioxidant compounds from lignin. A gain of 30% in chlorogenic acid content was reported in sunflower seed cakes after the release of wall-bound phenolics. Nonetheless, it has been stated that coupling US to base and/or acid extraction is highly destructive for some forms of phenolic compounds [22]. The use of cell wall degrading enzymes such as cellulase could be an alternative to destructive chemical hydrolysis [24]. USAE coupled with cellulase hydrolysis of phenolic compounds have been already reported [51]. Future works will be dedicated to exploring this possibility.
3.3. Determination of the Antioxidant Potential of the Extracts and Correlation Analysis
Our next goal was to ensure that the potential biological activities is retained during the USAE procedure. For this, we then determined the antioxidant potential of these nine characterized sample extracts from AOR by using both (1) in vitro cell free assays based on the chemistry of the antioxidant reaction with different mechanisms—either proton transfer or electron transfer based assays, as well as (2) in cellulo using eukaryotic yeast cells subjected to oxidative stress induced by UV either in the presence and absence of the extracts to have an idea of their cellular antioxidant potential. Indeed, if they were preserved, this antioxidant biological activity would be of such a nature as to be of interest for both future nutraceutical and/or cosmetic applications of these AOR extracts.
The protective antioxidant action developed by plant extracts can be influenced by many internal and external factors impacting their phytochemical compositions such as genetics (the use of different genotypes in our case) but also the environment (the use of different culture sites in our case) [3,18,34,42,46,50]. Furthermore, their antioxidant activity is generally based on complex mechanisms, which, in order to shorten, depending on the nature of the compounds present in the extract, can be based in particular on radical scavenging mechanisms. Here, to get an idea relating both to the antioxidant capacity but also to explore the possible mechanisms involved depending on the composition of the extract, we used three different in vitro cell-free assays: the DPPH, ABTS, and CUPRAC assays. These tests are based on different reaction mechanisms and could provide us a raw idea of the chemistry involved in the radical scavenging activity of the extract. Based on the chemical reaction involved, these in vitro cell free antioxidant assays can be roughly divided into different categories, with an ABTS assay based on a hydrogen atom transfer reaction (HAT), a CUPRAC assay based on an electron transfer reaction (ET), and the DPPH assay being considered as a mixed assay [52,53]. The results of these antioxidant assays expressed in µM of Trolox equivalent antioxidant capacity (TEAC) per gram DW for the nine extracts obtained after USAE of AOR are presented in Table 8.
Table 8.
Variations in in vitro cell free (ABTS, DPPH and CUPRAC) and cellular (TBARS) antioxidant potential of extracts obtained from USAE of AOR from three different native Beldi genotypes produced at three different pilot locations in Eastern Morocco.
Antioxidant activity ranged from 216.94 ± 12.32 to 401.52 ± 11.44 µM TEAC/g DW for ABTS assay, and from 275.84 ± 34.88 to 357.33 ± 24.24 µM TEAC/g DW using a DPPH assay. For these two in vitro cell free antioxidant assays, the AOR extract from the genotype #3 produced at Ain Sfa showed the highest antioxidant capacity, whereas the extract obtained from the genotype #1 produced at the same location displayed the lowest antioxidant values. On the contrary, results for CUPRAC assay, ranging from 129.69 ± 0.32 to 205.92 ± 17.11 µM TEAC/g DW, showed that this genotype #1 produced at Ain Sfa possessed the highest antioxidant capacity as compared to the genotype #3 from Sidi Bouhria.
Although interesting from a strictly predictive point of view based on chemical reactions, these in vitro tests do not necessarily have a great similarity with in vivo systems. The validity of these antioxidant data must therefore be considered as limited to an interpretation within the meaning of the chemical reactivity with respect to the considered radicals generated in vitro, and have to be confirmed in vivo. In order to have an improved understanding and better reflect the in vivo situation, the antioxidant activity of these nine extracts has also been studied further for their capacity to inhibit the lipid peroxidation membrane generated by oxidative stress induced by UV-C in yeast cells. Yeast cells represent an excellent model for assessing antioxidant capacity in vivo in the context of cellular oxidative stress [54]. It is indeed an attractive and reliable eukaryotic model, whose defense and adaptation mechanisms to oxidative stress are well known and can be extrapolated to human cells presenting mechanisms certainly more complex but well conserved with this model [55,56]. Here, measured in vivo anti-lipoperoxidation activity (inhibition of malondialdehyde (MDA) formation), determined using the TBARS assay, ranged from 50.62 ± 2.46 to 69.12 ± 0.34%. Therefore, this in vivo antioxidant evaluation assay confirmed the trend observed with the HAT-based in vitro assay, and confirmed that the AOR extract from the genotype #3 produced at Ain Sfa showed the highest antioxidant capacity, particularly as compared to extracts obtained from the genotype #1 produced at the same location.
As shown in Figure 5, higher antioxidant capacity measured with HAT-based antioxidant assay appeared systematically associated with a higher accumulation of phenolics, whereas association with the ET-based antioxidant assay (i.e., CUPRAC) appeared more complex and not directly linked to the accumulation of theses phenolics (Figure 5a).
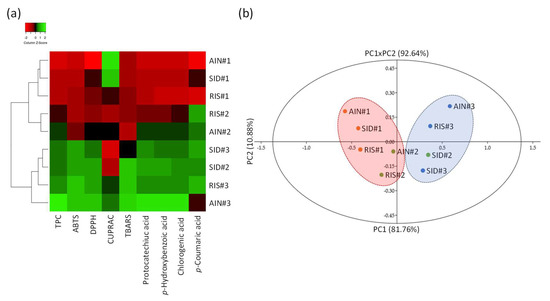
Figure 5.
(a) hierarchical clustering analysis (HCA) showing the relation between the phytochemical composition and antioxidant activity of each extracts from AOR of Eastern Morocco obtained by USAE; (b) principal component analysis (PCA) showing the discrimination of the different extracts from AOR of Eastern Morocco obtained by USAE.
Principal component analysis was performed to further discriminate these nine samples (Figure 5b). The resulting biplot representation accounts for 92.64% (F1 + F2) of the initial variability of the data as shown in Figure 4b. The discrimination occurs mainly in the first dimension (PC1) which explains 85.76% of the initial variability. The loading plots (F) confirmed the strong link between phytochemical composition, in particular the presence of the phenolics, and the HAT-based as well as cellular antioxidant capacity.
In order to link the antioxidant capacity to the presence of a particular phytochemical, a Pearson correlation analysis was applied (Figure 6).
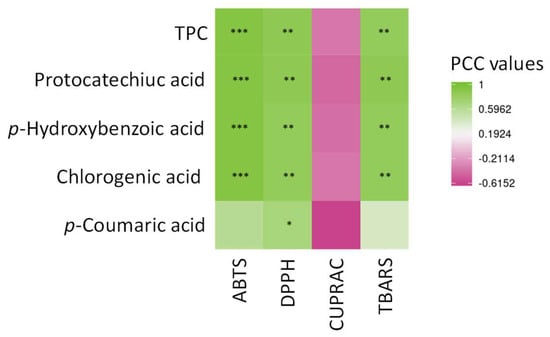
Figure 6.
Pearson correlation analysis (PCC) of the relation between the main phytochemicals (protocatechuic acid, p-hydroxybenzoic acid, chlorogenic acid and p-coumaric acid) from AOR extracts obtained after USAE and the different antioxidant assays (ABTS, DPPH, CUPRAC and TBARS). *** significant p < 0.001; ** significant p < 0.01; * significant p < 0.05; actual PCC values are indicated in Supplementary Materials Table S1.
This analysis provided evidence of the strong and highly significant correlation between both HAT-based in vitro assays as well as cellular antioxidant assay and TPC of the extract, in particular with the presence of chlorogenic acid, protocatechuic acid, and p-hydroxybenzoic acid (Figure 6, Table S1). The presence of p-coumaric acid was significantly correlated with a DPPH assay only. On the contrary, none of these phytochemicals, here analyzed, were significantly correlated with the in vitro ET-based antioxidant CUPRAC assay.
Altogether, these results showed a higher antioxidant activity, expressed in µM TEAC/g DW, determined with the ABTS and DPPH assays as compared to the CUPRAC assay. Therefore, these results suggested the prominence of the HAT- over the ET-based mechanism for the antioxidant action of these extracts. In good agreement, several authors have reported an antioxidant activity of extracts from various almond products based on HAT mechanism [18,42,44,46]. Similarly, a higher relation between HAT assay and phenolic acids as compared to flavonoids have been previously reported [52,57]. This observation is also in line with the results of Liang and Kitts [58] that reported a relatively stronger scavenging capacity of radicals generated by the ABTS and DPPH assays for chlorogenic acid, the main phenolic acid of our AOR extracts, and its derivatives. The authors attributed this observation to the available hydroxyl groups of these compounds. The presence of flavonoids has been also reported in almond products [13,18,42,44,46]. Here, we cannot exclude the presence of flavonoids potentially linked to the ET-based antioxidant activity evidenced by the CUPRAC assay. Prgomet et al. [13]) have reported in the presence of flavonoids in almond skin (i.e., isorhamnetin derivatives). Future works will be conducted to study in detail the flavonoid fraction of our AOR extracts. The cellular antioxidant assay using yeast further confirmed the interest of this system to study natural antioxidant from plant extracts [34,52] as also previously reported for other natural antioxidants such as thiamine and/or melatonin [55,56]. Natural antioxidants have aroused increasing interest over the past decade due to their possible use as an alternative to potentially dangerous synthetic antioxidants such as butylated hydroxyanisole (BHA) or butylated hydroxytoluene (BHT) in various food or cosmetic formulations [6,7,8]. Some natural antioxidant phenolics have already been shown to be as efficient in stabilizing nonpolar systems such as bulk oil or various types of emulsions as these synthetic antioxidants [7,9,10,11]. These preliminary results indicate a potential use as natural antioxidants of our AOR extracts generated by the present validated USAE.
4. Conclusions
P. dulcis or the so-called almond is a rich source of antioxidant phenolic compounds that are retained, after almond cold-pressed oil extraction, in a skin-enriched by-product which, thus, represent an attractive starting material for their extraction. As natural antioxidants, these phenolic compounds’ almond attracted much attention as alternatives to synthetic antioxidants in foods, pharmaceutical, and cosmetic preparations. Here, using a multivariate Box–Behnken design coupled with surface response methodology, we proposed an optimized and validated USAE of these phenolic compounds from cold-pressed AOR. Optimal conditions for USAE were: aqEtOH 53.0% (v/v) as green solvent, US frequency 27.0 kHz and extraction duration 29.4 min. Following its optimization, the present USAE method was validated according to international standards to ensure its precision and accuracy in the quantitation of total phenolic content. The efficiency of the present USAE has allowed substantial gains in terms of extraction efficiency compared to conventional heat reflux extraction—in particular by a strong reduction in extraction time, which is of particular interest in the context of green chemistry in terms of reduction of energy consumption, together with the use of a green extraction solvent. The application of this method already makes it possible to suggest a higher impact of the genetic background than of the environment on three genotypes cultivated on three experimental sites. This method therefore opens the door to more complete studies on this subject. Finally, both in vitro cell free and cellular antioxidant assays revealed the great potential of valorization of these extracts as a source of natural antioxidants. To summarize, the present extraction method allows a quick, green, simple, and efficient validated USAE for the possible valorization of antioxidant phenolic compounds from Moroccan almond cold-pressed oil residues, making it possible to generate extracts with attractive antioxidant activities for future nutraceutical and/or cosmetic applications.
Supplementary Materials
The following are available online at https://www.mdpi.com/2076-3417/10/9/3313/s1, Figure S1: Biplot representation of the linear relation between predicted vs. measured TPC in the 18 Box–Behnken design sample extracts; Figure S2: Loading scores of the first and second axis of the principal component analysis; Table S1: Actual values for PCC (Pearson Correlation Coefficient) showing the relation between the different phytochemicals and antioxidant assays.
Author Contributions
Conceptualization, D.T., A.E., M.A. (Mohamed Addi), and C.H.; Methodology, D.T., A.E., M.A. (Malika Abid), S.D., R.K.; L.G., A.K., M.A. (Mohamed Addi), and C.H.; Software, S.D.; Validation, M.A. (Mohamed Addi), C.H., D.T.; Formal analysis, M.A. (Mohamed Addi), C.H., S.D., and D.T.; Investigation, S.D., D.T., and R.K.; Resources, M.A. (Mohamed Addi) and C.H.; Data curation, M.A. (Mohamed Addi) and C.H.; Writing—original draft preparation, C.H.; Writing—review and editing, M.A. (Mohamed Addi), D.T., A.K., and C.H.; Visualization, C.H. and S.D.; Supervision, M.A. (Mohamed Addi) and C.H.; Project administration, M.A. (Mohamed Addi) and C.H.; Funding acquisition, M.A. (Mohamed Addi) and C.H. All authors have read and agreed to the published version of the manuscript.
Funding
This research was supported by Cosmetosciences, a global training and research program dedicated to the cosmetic industry. Located in the heart of the Cosmetic Valley, this program led by University of Orléans is funded by the Région Centre-Val de Loire.
Acknowledgments
D.T. gratefully acknowledges the support of French government via the French Embassy in Thailand in the form of Junior Research Fellowship Program 2018. S.D. and L.G. acknowledge the research fellowship of the Loire Valley Region. K.R. acknowledges the research fellowship from the Ministry of Science, Research and Technology of Iran.
Conflicts of Interest
The authors declare no conflict of interest.
References
- Oomah, D.B. Flaxseed as a functional food. J. Sci. Food Agric. 2001, 81, 889–894. [Google Scholar] [CrossRef]
- Nayak, B.; Liu, R.H.; Tang, J. Effect of Processing on Phenolic Antioxidants of Fruits, Vegetables, and Grains—A Review. Crit. Rev. Food Sci. Nutr. 2015, 55, 887–919. [Google Scholar] [CrossRef] [PubMed]
- Bolling, B.W. Almond polyphenols: Methods of analysis, contribution to food quality, and health promotion. Compr. Rev. Food Sci. Food Saf. 2017, 16, 346–368. [Google Scholar] [CrossRef]
- Barreca, D.; Nabavi, S.M.; Sureda, A.; Rasekhian, M.; Raciti, R.; Silva, A.S.; Annunziata, G.; Arnone, A.; Tenore, G.C.; Süntar, İ. Almonds (Prunus Dulcis Mill. DA Webb): A Source of Nutrients and Health-Promoting Compounds. Nutrients 2020, 12, 672. [Google Scholar] [CrossRef]
- Prgomet, I.; Gonçalves, B.; Domínguez-Perles, R.; Pascual-Seva, N.; Barros, A.I. Valorization challenges to almond residues: Phytochemical composition and functional application. Molecules 2017, 22, 1774. [Google Scholar] [CrossRef]
- Williams, G.M.; Iatropoulos, M.J.; Whysner, J. Safety Assessment of Butylated Hydroxyanisole and Butylated Hydroxytoluene as Antioxidant Food Additives. Food Chem. Toxicol. 1999, 37, 1027–1038. [Google Scholar] [CrossRef]
- Hano, C.; Corbin, C.; Drouet, S.; Quéro, A.; Rombaut, N.; Savoire, R.; Molinié, R.; Thomasset, B.; Mesnard, F.; Lainé, E. The lignan (+)-secoisolariciresinol extracted from flax hulls is an effective protectant of linseed oil and its emulsion against oxidative damage. Eur. J. Lipid Sci. Technol. 2017, 119, 1600219. [Google Scholar] [CrossRef]
- Drouet, S.; Doussot, J.; Garros, L.; Mathiron, D.; Bassard, S.; Favre-Réguillon, A.; Molinié, R.; Lainé, É.; Hano, C. Selective Synthesis of 3-O-Palmitoyl-Silybin, a New-to-Nature Flavonolignan with Increased Protective Action against Oxidative Damages in Lipophilic Media. Molecules 2018, 23, 2594. [Google Scholar] [CrossRef]
- Mariod, A.A.; Ibrahim, R.M.; Ismail, M.; Ismail, N. Antioxidant activity and phenolic content of phenolic rich fractions obtained from black cumin (Nigella sativa) seedcake. Food Chem. 2009, 116, 306–312. [Google Scholar] [CrossRef]
- Aditya, N.P.; Hamilton, I.E.; Norton, I.T. Amorphous nano-curcumin stabilized oil in water emulsion: Physico chemical characterization. Food Chem. 2017, 224, 191–200. [Google Scholar] [CrossRef]
- Drouet, S.; Leclerc, E.A.; Garros, L.; Tungmunnithum, D.; Kabra, A.; Abbasi, B.H.; Lainé, É.; Hano, C. A Green Ultrasound-Assisted Extraction Optimization of the Natural Antioxidant and Anti-Aging Flavonolignans from Milk Thistle Silybum marianum (L.) Gaertn. Fruits for Cosmetic Applications. Antioxidants 2019, 8, 304. [Google Scholar] [CrossRef] [PubMed]
- Porter, W.L.; Black, E.D.; Drolet, A.M. Use of polyamide oxidative fluorescence test on lipid emulsions: Contrast in relative effectiveness of antioxidants in bulk versus dispersed systems. J. Agric. Food Chem. 1989, 37, 615–624. [Google Scholar] [CrossRef]
- Prgomet, I.; Gonçalves, B.; Domínguez-Perles, R.; Pascual-Seva, N.; Barros, A.I. A Box-Behnken Design for Optimal Extraction of Phenolics from Almond By-products. Food Anal. Methods 2019, 12, 2009–2024. [Google Scholar] [CrossRef]
- Delplancke, M.; Aumeeruddy-Thomas, Y. Des semis et des clones. Rev. D’ethnoécologie 2017, 27. [Google Scholar] [CrossRef]
- Melhaoui, R.; Fauconnier, M.-L.; Sindic, M.; Addi, M.; Abid, M.; Mihamou, A.; Serghini-Caid, H.; Elamrani, A. Tocopherol Content of Almond Oils. Commun. Appl. Biol. Sci. 2018, 83, 75–77. [Google Scholar]
- Sarkis, J.R.; Michel, I.; Tessaro, I.C.; Marczak, L.D.F. Optimization of phenolics extraction from sesame seed cake. Sep. Purif. Technol. 2014, 122, 506–514. [Google Scholar] [CrossRef]
- Wang, F.; Hu, J.-H.; Guo, C.; Liu, C.-Z. Enhanced laccase production by Trametes versicolor using corn steep liquor as both nitrogen source and inducer. Bioresour. Technol. 2014, 166, 602–605. [Google Scholar] [CrossRef]
- Kahlaoui, M.; Borotto Dalla Vecchia, S.; Giovine, F.; Ben Haj Kbaier, H.; Bouzouita, N.; Barbosa Pereira, L.; Zeppa, G. Characterization of Polyphenolic Compounds Extracted from Different Varieties of Almond Hulls (Prunus dulcis L.). Antioxidants 2019, 8, 647. [Google Scholar] [CrossRef]
- Melhaoui, R.; Fauconnier, M.-L.; Sindic, M.; Addi, M.; Abid, M.; Mihamou, A.; Serghini-Caid, H.; Elamrani, A. Tocopherol content of almond oils produced in eastern Morocco. In Proceedings of the 23rd National Symposium for Applied Biological Sciences (NSABS), Brussels, Belgium, 8 February 2018; pp. 75–77. [Google Scholar]
- Teh, S.-S.; Bekhit, A.E.-D.; Birch, J. Antioxidative polyphenols from defatted oilseed cakes: Effect of solvents. Antioxidants 2014, 3, 67–80. [Google Scholar] [CrossRef]
- Corbin, C.; Fidel, T.; Leclerc, E.A.; Barakzoy, E.; Sagot, N.; Falguiéres, A.; Renouard, S.; Blondeau, J.; Ferroud, C.; Doussot, J.; et al. Development and validation of an efficient ultrasound assisted extraction of phenolic compounds from flax (Linum usitatissimum L.) seeds. Ultrason. Sonochem. 2015, 26, 176–185. [Google Scholar] [CrossRef]
- Fliniaux, O.; Corbin, C.; Ramsay, A.; Renouard, S.; Beejmohun, V.; Doussot, J.; Falguières, A.; Ferroud, C.; Lamblin, F.; Lainé, E.; et al. Microwave-Assisted Extraction of Herbacetin Diglucoside from Flax (Linum usitatissimum L.) Seed Cakes and Its Quantification using an RP-HPLC-UV System. Molecules 2014, 3025–3037. [Google Scholar] [CrossRef] [PubMed]
- Bourgeois, C.; Leclerc, É.A.; Corbin, C.; Doussot, J.; Serrano, V.; Vanier, J.R.; Seigneuret, J.M.; Auguin, D.; Pichon, C.; Lainé, É.; et al. Nettle (Urtica dioica L.) as a source of antioxidant and anti-aging phytochemicals for cosmetic applications. C. R. Chim. 2016, 19, 1090–1100. [Google Scholar] [CrossRef]
- Renouard, S.; Hano, C.; Corbin, C.; Fliniaux, O.; Lopez, T.; Montguillon, J.; Barakzoy, E.; Mesnard, F.; Lamblin, F.; Lainé, E. Cellulase-assisted release of secoisolariciresinol from extracts of flax (Linum usitatissimum) hulls and whole seeds. Food Chem. 2010, 122, 679–687. [Google Scholar] [CrossRef]
- Terpinc, P.; Polak, T.; Makuc, D.; Ulrih, N.P.; Abramovič, H. The occurrence and characterisation of phenolic compounds in Camelina sativa seed, cake and oil. Food Chem. 2012, 131, 580–589. [Google Scholar] [CrossRef]
- Wildermuth, S.R.; Young, E.E.; Were, L.M. Chlorogenic acid oxidation and its reaction with sunflower proteins to form green-colored complexes. Compr. Rev. Food Sci. Food Saf. 2016, 15, 829–843. [Google Scholar] [CrossRef]
- Ahmad, B.S.; Talou, T.; Saad, Z.; Hijazi, A.; Cerny, M.; Kanaan, H.; Chokr, A.; Merah, O. Fennel oil and by-products seed characterization and their potential applications. Ind. Crops Prod. 2018, 111, 92–98. [Google Scholar] [CrossRef]
- Lavilla, I.; Bendicho, C. Fundamentals of Ultrasound-Assisted Extraction. Water Extr. Bioact. Compd. From Plants Drug Dev. 2017, 291–316. [Google Scholar] [CrossRef]
- Medina-Torres, N.; Ayora-Talavera, T.; Espinosa-Andrews, H.; Sánchez-Contreras, A.; Pacheco, N. Ultrasound Assisted Extraction for the Recovery of Phenolic Compounds from Vegetable Sources. Agronomy 2017, 7, 47. [Google Scholar] [CrossRef]
- Tungmunnithum, D.; Garros, L.; Drouet, S.; Renouard, S.; Lainé, E.; Hano, C. Green Ultrasound Assisted Extraction of trans Rosmarinic Acid from Plectranthus scutellarioides (L.) R.Br. Leaves. Plants 2019, 8, 50. [Google Scholar] [CrossRef]
- Abbasi, B.H.; Siddiquah, A.; Tungmunnithum, D.; Bose, S.; Younas, M.; Garros, L.; Drouet, S.; Giglioli-Guivarc’h, N.; Hano, C. Isodon rugosus (Wall. ex Benth.) codd in vitro cultures: Establishment, phytochemical characterization and in vitro antioxidant and anti-aging activities. Int. J. Mol. Sci. 2019, 20, 452. [Google Scholar] [CrossRef]
- Shah, M.; Ullah, M.A.; Drouet, S.; Younas, M.; Tungmunnithum, D.; Giglioli-Guivarc’h, N.; Hano, C.; Abbasi, B.H. Interactive effects of light and melatonin on biosynthesis of silymarin and anti-inflammatory potential in callus cultures of silybum marianum (L.) gaertn. Molecules 2019, 24, 1207. [Google Scholar] [CrossRef] [PubMed]
- Ullah, M.A.; Tungmunnithum, D.; Garros, L.; Drouet, S.; Hano, C.; Abbasi, B.H. Effect of Ultraviolet-C Radiation and Melatonin Stress on Biosynthesis of Antioxidant and Antidiabetic Metabolites Produced in In Vitro Callus Cultures of Lepidium sativum L. Int. J. Mol. Sci. 2019, 20, 1787. [Google Scholar] [CrossRef] [PubMed]
- Garros, L.; Drouet, S.; Corbin, C.; Decourtil, C.; Fidel, T.; De Lacour, J.L.; Leclerc, E.A.; Renouard, S.; Tungmunnithum, D.; Doussot, J.; et al. Insight into the influence of cultivar type, cultivation year, and site on the lignans and related phenolic profiles, and the health-promoting antioxidant potential of flax (linum usitatissimum L.) seeds. Molecules 2018, 23, 2636. [Google Scholar] [CrossRef] [PubMed]
- Babicki, S.; Arndt, D.; Marcu, A.; Liang, Y.; Grant, J.R.; Maciejewski, A.; Wishart, D.S. Heatmapper: Web-enabled heat mapping for all. Nucleic Acids Res. 2016, 44, W147–W153. [Google Scholar] [CrossRef]
- Ferreira, S.L.C.; Silva Junior, M.M.; Felix, C.S.A.; da Silva, D.L.F.; Santos, A.S.; Santos Neto, J.H.; de Souza, C.T.; Cruz Junior, R.A.; Souza, A.S. Multivariate optimization techniques in food analysis—A review. Food Chem. 2019, 273, 3–8. [Google Scholar] [CrossRef]
- Ferreira, S.L.C.; Bruns, R.E.; Ferreira, H.S.; Matos, G.D.; David, J.M.; Brandão, G.C.; da Silva, E.G.P.; Portugal, L.A.; dos Reis, P.S.; Souza, A.S.; et al. Box-Behnken design: An alternative for the optimization of analytical methods. Anal. Chim. Acta 2007, 597, 179–186. [Google Scholar] [CrossRef]
- Chemat, F.; Abert-Vian, M.; Fabiano-Tixier, A.S.; Strube, J.; Uhlenbrock, L.; Gunjevic, V.; Cravotto, G. Green extraction of natural products. Origins, current status, and future challenges. Trends Anal. Chem. 2019, 118, 248–263. [Google Scholar] [CrossRef]
- Renouard, S.; Lopez, T.; Hendrawati, O.; Dupre, P.; Doussot, J.; Falguieres, A.; Ferroud, C.; Hagege, D.; Lamblin, F.; Laine, E.; et al. Podophyllotoxin and deoxypodophyllotoxin in juniperus bermudiana and 12 other juniperus species: Optimization of extraction, method validation, and quantification. J. Agric. Food Chem. 2011, 59. [Google Scholar] [CrossRef]
- Chemat, F.; Vian, M.A.; Cravotto, G. Green Extraction of Natural Products: Concept and Principles. Int. J. Mol. Sci. 2012, 13, 8615–8627. [Google Scholar] [CrossRef]
- Ameer, K.; Shahbaz, H.M.; Kwon, J.H. Green Extraction Methods for Polyphenols from Plant Matrices and Their Byproducts: A Review. Compr. Rev. Food Sci. Food Saf. 2017, 16, 295–315. [Google Scholar] [CrossRef]
- Bolling, B.W.; Blumberg, J.B.; Oliver Chen, C.-Y. The influence of roasting, pasteurisation, and storage on the polyphenol content and antioxidant capacity of California almond skins. Food Chem. 2010, 123, 1040–1047. [Google Scholar] [CrossRef] [PubMed]
- Beejmohun, V.; Fliniaux, O.; Grand, É.; Lamblin, F.; Bensaddek, L.; Christen, P.; Kovensky, J.; Fliniaux, M.-A.; Mesnard, F. Microwave-assisted extraction of the main phenolic compounds in flaxseed. Phytochem. Anal. 2007, 18, 275–282. [Google Scholar] [CrossRef] [PubMed]
- Rubilar, M.; Pinelo, M.; Shene, C.; Sineiro, J.; Nuñez, M.J. Separation and HPLC-MS Identification of Phenolic Antioxidants from Agricultural Residues: Almond Hulls and Grape Pomace. J. Agric. Food Chem. 2007, 55, 10101–10109. [Google Scholar] [CrossRef] [PubMed]
- Anastas, P.T.; Warner, J.C. Green Chemistry: Theory and Practice; Oxford University Press: Oxford, UK, 1998; ISBN 0198502346. [Google Scholar]
- Monagas, M.; Garrido, I.; Lebrón-Aguilar, R.; Bartolome, B.; Gómez-Cordovés, C. Almond (Prunus dulcis (Mill.) D.A. Webb) Skins as a Potential Source of Bioactive Polyphenols. J. Agric. Food Chem. 2007, 55, 8498–8507. [Google Scholar] [CrossRef] [PubMed]
- Freeman, B.L.; Eggett, D.L.; Parker, T.L. Synergistic and antagonistic interactions of phenolic compounds found in navel oranges. J. Food Sci. 2010, 75, C570–C576. [Google Scholar] [CrossRef]
- Pathak, N.; Rai, A.K.; Kumari, R.; Bhat, K. V Value addition in sesame: A perspective on bioactive components for enhancing utility and profitability. Pharmacogn. Rev. 2014, 8, 147. [Google Scholar]
- Drouet, S.; Abbasi, B.H.; Falguières, A.; Ahmad, W.; Sumaira; Ferroud, C.; Doussot, J.; Vanier, J.R.; Lainé, E.; Hano, C. Single laboratory validation of a quantitative core shell-based LC separation for the evaluation of silymarin variability and associated antioxidant activity of pakistani ecotypes of milk thistle (silybum marianum L.). Molecules 2018, 23, 904. [Google Scholar] [CrossRef]
- Dave Oomah, B.; Mazza, G.; Kenaschuk, E.O. Flavonoid content of flaxseed. Influence of cultivar and environment. Euphytica 1996, 90, 163–167. [Google Scholar] [CrossRef]
- Huang, D.; Zhou, X.; Si, J.; Gong, X.; Wang, S. Studies on cellulase-ultrasonic assisted extraction technology for flavonoids from Illicium verum residues. Chem. Cent. J. 2016, 10, 56. [Google Scholar] [CrossRef]
- Nazir, M.; Tungmunnithum, D.; Bose, S.; Drouet, S.; Garros, L.; Giglioli-Guivarc’h, N.; Abbasi, B.H.; Hano, C. Differential Production of Phenylpropanoid Metabolites in Callus Cultures of Ocimum basilicum L. With Distinct in Vitro Antioxidant Activities and in Vivo Protective Effects against UV stress. J. Agric. Food Chem. 2019, 67, 1847–1859. [Google Scholar] [CrossRef]
- Prior, R.L.; Wu, X.; Schaich, K. Standardized Methods for the Determination of Antioxidant Capacity and Phenolics in Foods and Dietary Supplements. J. Agric. Food Chem. 2005, 53, 4290–4302. [Google Scholar] [CrossRef] [PubMed]
- Steels, E.L.; Learmonth, R.P.; Watson, K. Stress tolerance and membrane lipid unsaturation in Saccharomyces cerevisiae grown aerobically or anaerobically. Microbiology 1994, 140 Pt 3, 569–576. [Google Scholar] [CrossRef]
- Wolak, N.; Kowalska, E.; Kozik, A.; Rapala-Kozik, M. Thiamine increases the resistance of baker’s yeast Saccharomyces cerevisiae against oxidative, osmotic and thermal stress, through mechanisms partly independent of thiamine diphosphate-bound enzymes. FEMS Yeast Res. 2014, 14, 1249–1262. [Google Scholar] [CrossRef] [PubMed]
- Bisquert, R.; Muñiz-Calvo, S.; Guillamón, J.M. Protective role of intracellular Melatonin against oxidative stress and UV radiation in Saccharomyces cerevisiae. Front. Microbiol. 2018, 9, 318. [Google Scholar] [CrossRef] [PubMed]
- Prior, R.L.; Cao, G.; Martin, A.; Sofic, E.; McEwen, J.; O’Brien, C.; Lischner, N.; Ehlenfeldt, M.; Kalt, W.; Krewer, G.; et al. Antioxidant Capacity As Influenced by Total Phenolic and Anthocyanin Content, Maturity, and Variety of Vaccinium Species. J. Agric. Food Chem. 1998, 46, 2686–2693. [Google Scholar] [CrossRef]
- Liang, N.; Kitts, D. Antioxidant Property of Coffee Components: Assessment of Methods that Define Mechanisms of Action. Molecules 2014, 19, 19180–19208. [Google Scholar] [CrossRef]
© 2020 by the authors. Licensee MDPI, Basel, Switzerland. This article is an open access article distributed under the terms and conditions of the Creative Commons Attribution (CC BY) license (http://creativecommons.org/licenses/by/4.0/).