Impacts of Upstream Structures on Downstream Discharge in the Transboundary Imjin River Basin, Korean Peninsula


Department of Civil & Environmental Engineering, Sejong University, 98 Gunja-Dong, Gwangjin-Gu, Seoul 143-747, Korea
*
Author to whom correspondence should be addressed.
Appl. Sci. 2020, 10(9), 3333; https://doi.org/10.3390/app10093333
Submission received: 6 March 2020
/
Revised: 5 May 2020
/
Accepted: 6 May 2020
/
Published: 11 May 2020
(This article belongs to the Special Issue Hydrologic and Water Resources Investigations and Modeling)
Abstract
:The transboundary river basin is a great challenge for water management and disaster reduction due to its specific characteristics. In this study, upstream impacts from natural and artificial sources on the downstream discharge on the Imjin river basin, the well-known transboundary region in the Korean peninsula, were evaluated using a hydrological model integrating a dam operation module at an hourly timescale. The module uses a concept of the AutoROM method as the operational rule to update the dam storage and decide water release. Dam storages were translated into water levels using a water level–storage curve. To quantify the impact of hydraulic structures on the Northern Imjin river basin, change in discharge was analyzed in four flood events (2009, 2010, 2011, and 2012). Dam failure scenarios were developed under conditions of the 2010 flood event, in which the releases of 100%, 80%, 50%, and 20% of water storage of Hwanggang dam were simulated. The results indicate that the amount of water released from upstream dams is the main cause of floods in the downstream region. To reduce the risk of floods in the downstream river basin, an optimal dam operation module and information on upstream dams play an important role and contribute to the effective use of water resources.
1. Introduction
Across the world, there are more than 260 rivers and lakes shared by countries, and they account for 40% of the Earth’s land surface and 60 percent of the global freshwater [1,2]. Transboundary rivers play a critical role in economic development by supporting the income and livelihood of roughly two billion people globally [3]. In recent decades, a number of large dams, which are indicated as being higher than 15 m or storing over 3 mcm [4], have been constructed in transboundary regions, such as the Toktogul dam (Kyrgyzstan, Central Asia), the Adjarala dam (Togo and Benin, West Africa), Hwanggang dam (North Korea, East Asia), the Tipaimukh dam (India, South Asia), and the Lower Sesan II dam (Cambodia, Southeast Asia), etc., providing many benefits for the regions, such as the supply of drinking and irrigation water, the generation of electric power, and flood protection. However, these constructions have shown not only their positive impacts but also the potential to create major flood waves capable of causing damage when a dam fails [5]. Failure of a dam could have disastrous consequences in downstream regions and countries [6]. Because of their advantages and disadvantages, as well as their far-reaching and often irreversible social and environmental impacts, dams have become the subject of controversy and debate [4].
In addition, due to a wide range of existing water resource issues, it is not possible to find a one-size-fits-all approach to basin management in the transboundary regions [7]. These problems are incurred from the differences in political, social, economic, and ecological drivers. The lessons from past dam failures in transboundary regions have been rarely learned, but their serious consequences have been recorded. For instance, in July 2018, flooding due to water released by a collapsed dam in southeastern Laos ruined thousands of hectares of agricultural land in An Giang, Dong Thap, and Long An provinces (Vietnam). As a result, water levels in Mekong tributaries have been rising seven to ten centimeters a day, and 27 Laotians were killed and thousands of people were displaced [8]. In September 2009, North Korea released a massive amount of water from Hwanggang dam without warning, causing extreme floods in South Korea and the death of 6 people; an estimated 40,000,000 short tons of water was dumped during the flood, causing the water level at the border of Gyeonggi-do to jump from 2.3 m to 4.6 m [9]. Furthermore, the physical characteristics of catchments increasingly change due to human activity, meaning dam failure disasters that threaten life are set to increase [10]. Hence, the evaluation of dam impacts on the discharge in downstream regions, especially in case of dam failures, is vital to take necessary response actions.
Recently, research topics related to modelling of catastrophic floods due to dam failure have become more attractive along with the explosion of large dam construction [11,12], gaining more attention in water management in the transboundary regions [13]. Floods due to dam failure are generally significantly larger than natural floods because of unexpected high peak in a very short duration and presence of an extremely high velocity flow due to large quantities of water being suddenly released [14]. Additionally, the impact of large dam outflow may cause changes in downstream hydrology and geomorphology such as change in total flows, change in seasonal timing of flows, short-term fluctuations in flows, change in extreme high and low of flow, channel erosion and deposition, riverbed composition, etc. [15,16,17], leading to more difficulty in flood forecasting and protection. The precision modelling of dam failure can lead to the development of an appropriate emergency action plan to minimize the impact of flooding. However, the model setup is challenging due to lack of data sharing among the countries occupying the transboundary rivers [18]. In fact, the absence of information sharing among riparian countries has led to many tensions in the past [19].
Multiple previous studies have tried to overcome these challenges by applying various methods and approaches. Lucas-Picher et al. [20] applied a high-resolution distributed hydrological model (HYDROTEL), which comprises several novel methods and data sets and a new optimization algorithm to simulate the multiyear mean annual hydrograph and 2011 flood of the Richelieu river basin (U.S.–Canada transboundary basin). Asghar et al. [21] used satellite-observed rainfall and numerical weather prediction (NWP) for hydrological forecasting in the transboundary sparsely gauged Chenab River basin in Pakistan and India to reproduce the exceptionally high flood in 2014. Mulligan et al. [22] presented the most comprehensive global georeferenced database of dams (GOODD), containing more than 38,000 dams as well as their associated catchments, which may be useful in machine learning approaches to dam identification. Kim et al. [9] presented methods of monitoring river basin development and water variability for the transboundary river in North and South Korea using satellite imaginary. The advantages and efficiency of using of satellite data in transboundary regions were also affirmed by Eldardiry and Hossain [23] in the study of a modeling framework to predict the current and future reservoir operating rules in the lower Nile basin using satellite observations and a macroscale hydrologic model (VIC). Such studies propose useful methods to characterize the transboundary basins only in the case that the reference data, such as in-situ or satellite data, were fully provided. In the case of inaccessible or cloud-cover regions, where the methods used become insufficient and unreliable, a flexible and customizable hydrological model could be an optimal solution to overcome the challenges, especially if integrated with geographic information system (GIS) techniques and applied along with a number of science-based assumptions based on real conditions of the regions.
In general, evaluating the impact of upstream dams in transboundary regions is one of the required steps to develop any flood mitigation, adaptation, and prevention plan in downstream basins, but this is still a large challenge due to various specific reasons. Thus, the objective of this study is to evaluate the impacts of upstream hydraulic structures on downstream discharge in the binational transboundary regions in two cases: (1) Normal conditions of dam operation and (2) Extreme conditions based on dam failure scenarios, with a case study of the Imjin river basin, South Korea. Using estimations of dam parameters from GIS techniques, the Sejong University Rainfall Runoff (SURR) open-source model integrating a dam operation module developed in this study shows an ability to simulate the sudden change in downstream discharge and water level due to the impact of the upstream dams. This provides useful information that can be applied in disaster prevention and river management in binational transboundary regions.
2. Study Area
The relation between North Korea and South Korea is complicated with extreme conflicts as the two nations were originally a single nation and have been divided since the Korean War in 1953. This sensitive relation requires studies focusing on the transboundary region between the two countries to be more considerate. The Imjin river, passing through North and South Korea, crossing the Demilitarized Zone (DMZ), and joining the Han River downstream of Seoul before emptying into Gyeonggi Bay in Yellow Sea, is the well-known Korean transboundary basin. It is the seventh largest river in Korea with a total basin area of 8139 km2 and a total length of 273.5 km (Figure 1a).
The Northern part of the Imjin river basin is predominantly mountainous, so the river gradient is relatively steep, and many streams pass through the valleys. The uppermost part, which heads from Hamgyeongnam-do Masikryoung Duryu mountains, varies in elevation from 1500–1800 m above sea level. Therefore, the inflow of water increasing dramatically due to the high amount of rainfall may cause flood damage downstream. Especially in recent decades, North Korea has constructed five dams upstream of the Imjin river, including Hwanggang dam, April 5 dam 1, April 5 dam 2, April 5 dam 3, and April 5 dam 4, of which the April 5 dam 1 and April 5 dam 2 are located in a tributary downstream of Hwanggang dam, whereas the April 5 dam 3 and April 5 dam 4 are located upstream of Hwanggang dam [9]. The largest multi-purpose dam, Hwanggang, which is located 42 km north of the DMZ, completed construction and started operating in North Korea in 2007.
In the Korean Peninsula, flood season normally lasts from the beginning of June through to the end of September, and in this season, high river discharge is naturally caused by a large amount of precipitation over the basin. Annual precipitation of the Imjin river basin is 1100 mm, with the highest hourly rainfall recorded at 120 mm [24]. About 74% of the total annual discharge occurs between June and September, roughly parallel to the monsoonal climate, with its wet summers and dry winters. Due to the high amount of precipitation, the Imjin river basin encounters a number of flood events during this time. After constructing a range of hydraulic structures in North Korea, the downstream is facing not only a natural flood hazard due to high rainfall but also an artificial flood risk from the dam.
Because of the situation of the study catchment, with two third of area placed in North Korea, the data in the Northern part of the basin are hard to access due to political boundaries for transboundary rivers. Additionally, Paju-si, a military zone located in this region that is used in river-crossing operations, is also influenced directly by flood hazards. The improvement of flood forecasting systems is intrinsically related to military operations. Nevertheless, the area includes 38 subbasins with 68 rain-gauge stations, three meteorological stations, and three flow stations (Figure 1b), in which all the hydrometeorological stations are located in the Southern area and there is no observation of weather or flow obtained in the Northern area due to limited accessible sources. Hydrological modelling for the Imjin river basin has become a specific challenge for South Korean scientists and engineers.
3. Materials and Methods
3.1. Hydrological Model
The hydrological model used in this study is Sejong University Rainfall Runoff (SURR) model, which was developed as an open-source package by the Water Resource and GIS Laboratory, Sejong University [25]. The model is a continuous hydrological model that is based on the event-oriented storage function [26]. The SURR model is a semi distributed rainfall runoff model that is able to estimate hydrological components such as soil moisture, actual evapotranspiration, as well as basin and channel discharge based on the connection of channel and basin storage function with the physical-based hydrological component calculation technique (Equations (1) and (2)) as follows:
where S(t) is water storage in the basin (m3) at time t; Q(t) is outflow of the storage basin (m3/s); Qsur is surface flow(m3/s); Qlat is lateral flow (m3/s); Qgw is groundwater flow (m3/s); Qsur(t − τ) + Qlat(t − τ) + Qgw(t − τ) is inflow of storage; Ksb is K coefficient and Psb is P coefficient, both are the storage function constants for the basin, in which Psb ranges from 0.5 to 1; Ksb is proposed by Nagai et al. [27] with Ksb = βA0.14 where A is watershed area (km2), and β is coefficient depending on the land conditions.
Hydrologic simulation in SURR involves topographic, soil, land use, and meteorological data. GIS data sets for soil type, vegetation cover, and land use were obtained from the food and agriculture organization (FAO), while orographic data (digital elevation model, DEM) were obtained from the United States Geological Survey (USGS) at a grid resolution of 30 m. Daily precipitation from 68 automated weather stations (AWS) in South Korea within the study catchment was obtained from the water resources management information system (WAMIS) to compute mean Areal precipitation (MAP), while air temperature, humidity, wind speed, and solar radiation from only 3 automated surface observing system (ASOS) stations obtained from the Korea Meteorological Administration (KMA) were used to calculate mean areal evapotranspiration (MAE) using the Penman–Monteith method for each subbasin. The rainfall and evapotranspiration data have hourly temporal resolution and are interpolated spatially by the Thiessen polygon method using GIS (Figure 1b).
To evaluate the impacts of upstream hydraulic structures on the downstream basin, in this study, the observed meteorological and hydrological data for 6 events, 2007, 2008, 2009, 2010, 2011, and 2012, were collected. Of these, the events in 2007 (23 July 2007~2 September 2007) and 2008 (1 July 2008~23 August 2008) were used for calibration, while the events in 2009 (21 June 2009~4 August 2009), 2010 (9 July 2010~17 September 2010), 2011 (15 June 2011~24 August 2011), and 2012 (1 July 2012~9 September 2012) were used for validating and evaluating dam impacts.
3.2. SURR Model Calibration and Validation
In the SURR model, the parameters are divided into two types, the physical and conceptual parameters. The physical parameters can be estimated based on the basin and channel characteristics; however, for determining the conceptual model, a calibration and validation process has to be undertaken. There are twelve conceptual parameters in the SURR model, in which only five parameters are sensitive in rainfall runoff simulation [24,25]. The SURR model was manually calibrated and validated using observed discharge at 3 flow stations, namely Gunnam, Jeonkok, and Jeogseong (Figure 1b). The efficiency criteria used to evaluate the model performance include the root mean square error (RMSE), Nash–Sutcliffe efficiency (NSE), correlation coefficient (CC) and relative error in volume (REV). The details of the model calibration and validation procedures and results of model performance evaluation were presented by Jabbari et al. [24].
The evaluation results show that the performance of the model is satisfactory for use in the simulation of streamflow in the study catchment, except for Gunnam station. There are two major reasons for the low performance of the model for Gunnam station. The first one is the high uncertainty of the data interpolated using Thiessen polygon method, as all observed data were only obtained for the Southern area, and the second one is the impact of the Northern upstream dam on the discharge at the station, which is discussed in the present study. According to Bae et al. [28], the average width of the uncertainty interval at Gunnam station was found to be significantly greater than those of the other stations due to the large bias between the mean rainfall and the corresponding interpolated MAP, contributing the high uncertainty intervals of discharge. The large difference in simulated and observed discharge in high flow events due to such reasons causes the high value of REV and the negative value of NSE.
In addition, information of the periods of releasing water from the dam in the Northern part was collected based on the sudden change of river water level and flow downstream of the dam. However, information of periods of storing water in the dam is difficult to define exactly; hence, to consider this kind of dam impact, flow rate at each station was calculated using Equation (3) and compared between observation and simulation for the same rainfall event after the model was calibrated.
where Runoff = Q/A (discharge/area) and Rainfall is mean areal precipitation (MAP) in the same period, and T is total simulation time in hour.
3.3. Dam Operation Module
A module called AutoROM was developed as a part of the SURR rainfall runoff model to simulate dam outflow based on the concept of the automatic reservoir operation method, which is a common method widely used to operate dams/reservoirs. In this method, it is assumed that the reservoir stores the total amount of inflows until the pool reaches the specific target level (or threshold water level) and then releases the total amount of inflows after reaching that level. The nonlinear relationship between water level and storage (H–S curve) is the key aspect of the method used to simulate dam outflow in this study. To develop this relationship for a transboundary region, where the data are generally scarce, such as Northern dams of the Imjin river basin, the GIS functional surface toolset was applied using features and various surface types. To apply this toolset, it is necessary to obtain the digital elevation model (DEM) data. Moreover, a decrease in accuracy of estimation due to the increase of DEM scale has been reported [29]. Hence, high resolution DEM data are required for the best estimation.
In order to examine the appropriateness and accuracy of the GIS Functional Surface toolset, the parameters of the Andong dam basin in South Korea were estimated and evaluated by comparison of data provided by the Korea National Committee on Large Dams (KNCOLD). The watershed area, total storage capacity, and the effective storage volume of Andong dam were calculated using the GIS Functional Surface toolset then compared with the provided parameters. The estimated results are 1574.74 km2, 1.19 km3, and 1.09 km3, and the provided parameters are 1584.00 km2, 1.25 km3, and 1.00 km3 for watershed area, total storage capacity, and the effective storage volume, respectively. The difference between estimated and provided parameters are −9.73 km2 (−0.61%), −0.06 km3 (−4.8%), and +0.09 km3 (+9%) for watershed area, total storage capacity, and the effective storage volume, respectively. The results indicate that the method of estimating the low capacity of the dam using the GIS functional surface toolset is appropriate.
Due to various specific reasons related to the binational transboundary region, it is difficult to collect all of the data required to apply the AutoROM method in the Northern part of the Imjin river basin. Hence, a number of assumptions are used to solve this problem, including: (1) All of the spillway structures considered in this study are free-orifice type; (2) the initial water level used in the model setup is equal to spillway height; (3) initial dam storage used in model setup is equal to storage corresponding to spillway height; and (4) if the dam level is below the spillway, only discharge for hydro power is considered. Based on these assumptions, the computation of dam outflow was developed using the theory of hydraulics of spillways with limited information of dams. From the nonlinear H–S curve estimated using the GIS toolset, water storage or water level at a certain level can be roughly linearly interpolated if either of the two variables is defined. The dam outflow was computed based on the change of storage and water level due to the inflow in case of dam water level over the specific target level.
To compute the dam outflow, the initial storage in each hour was computed using the relationship between water level and storage (H–S curve) for each hour based on Equation (4) as follows:
where Si(t0) is dam storage at initial condition; Hi(t0) is dam storage at initial condition; i is related to the value of H corresponding to the H–S curve; and Si+1, Si−1, Hi+1, and Hi−1 are defined using the H–S curve. The water storage was then computed from initial storage and inflow in the dam for each hour based on Equation (5) as follows:
where Si(t0 + 1) is water storage; I (t0 + 1) is inflow (averaged for 1 h); and i is related to the value of H corresponding to the H–S curve. The dam water level was then computed using the H–S curve based on Equation (6) as follows:
where Si(t0 + 1) is dam storage; Hi(t0 + 1) is dam water level; i is related to value of H corresponding to H–S curve; and Si+1, Si−1, Hi+1, and Hi−1 are defined using H–S curve. Then, dam water level was compared with threshold water level to consider dam outflow. Finally, the dam outflow was computed in 2 cases: Dam water level below threshold water level (Hi ≤ hthreshold) and dam water level over threshold water level (Hi > hthreshold).
Moreover, in the case of water level being below threshold water level, the purpose of a dam should be considered. For the single-purpose dam, in the model, hydroelectric discharge is set up as 0 m3/s. If the dam is a multi-purpose dam, the hydroelectric discharge is considered in the simulation. Thus, dam outflow is considered as follows:
- If water level is below spillway water level and dam inflow is greater or equal to hydroelectric discharge, then outflow is equal to hydroelectric discharge;
- If water level is below spillway water level and dam inflow is less than hydroelectric discharge, then outflow is equal to 0 m3/s;
- If water level is over spillway water level but below threshold water level, then outflow is considered as minimum discharge.
In the case of water level over threshold water level, hourly average dam outflow Qh was computed by averaging the summation of dam outflow Qs in 1 h, in which dam outflow Qs was computed based on the free-orifice equation (Equation (7)) as follows:
where Qh is hourly average dam outflow (m3/s); Qs is dam outflow (m3/s); H is height of the water level above the crest of spillway (m); L is crest width (m); and C is free-orifice discharge coefficient, approximated from Rehbock’s experimental formula [30].
4. Results and Discussion
4.1. Defining Dam Affected Periods
The flowrate of all events from 2007 to 2012 was computed based on Equation (3) in Section 3.2 and is shown in Table 1. It is clear to see that, in 2008, 2009, and 2010, especially in the 2008 event, the flow rate computed using observation data was smaller than other years. This may be due to the water storage of Hwanggang dam in those periods. This conjecture is reliable when referring to the observed rainfall in the same period at Gunnam station, where the streamflow was influenced directly and strongly by dam operation. In some events, the periods of storing water generally took place shortly before or after the period of releasing water from the dams.
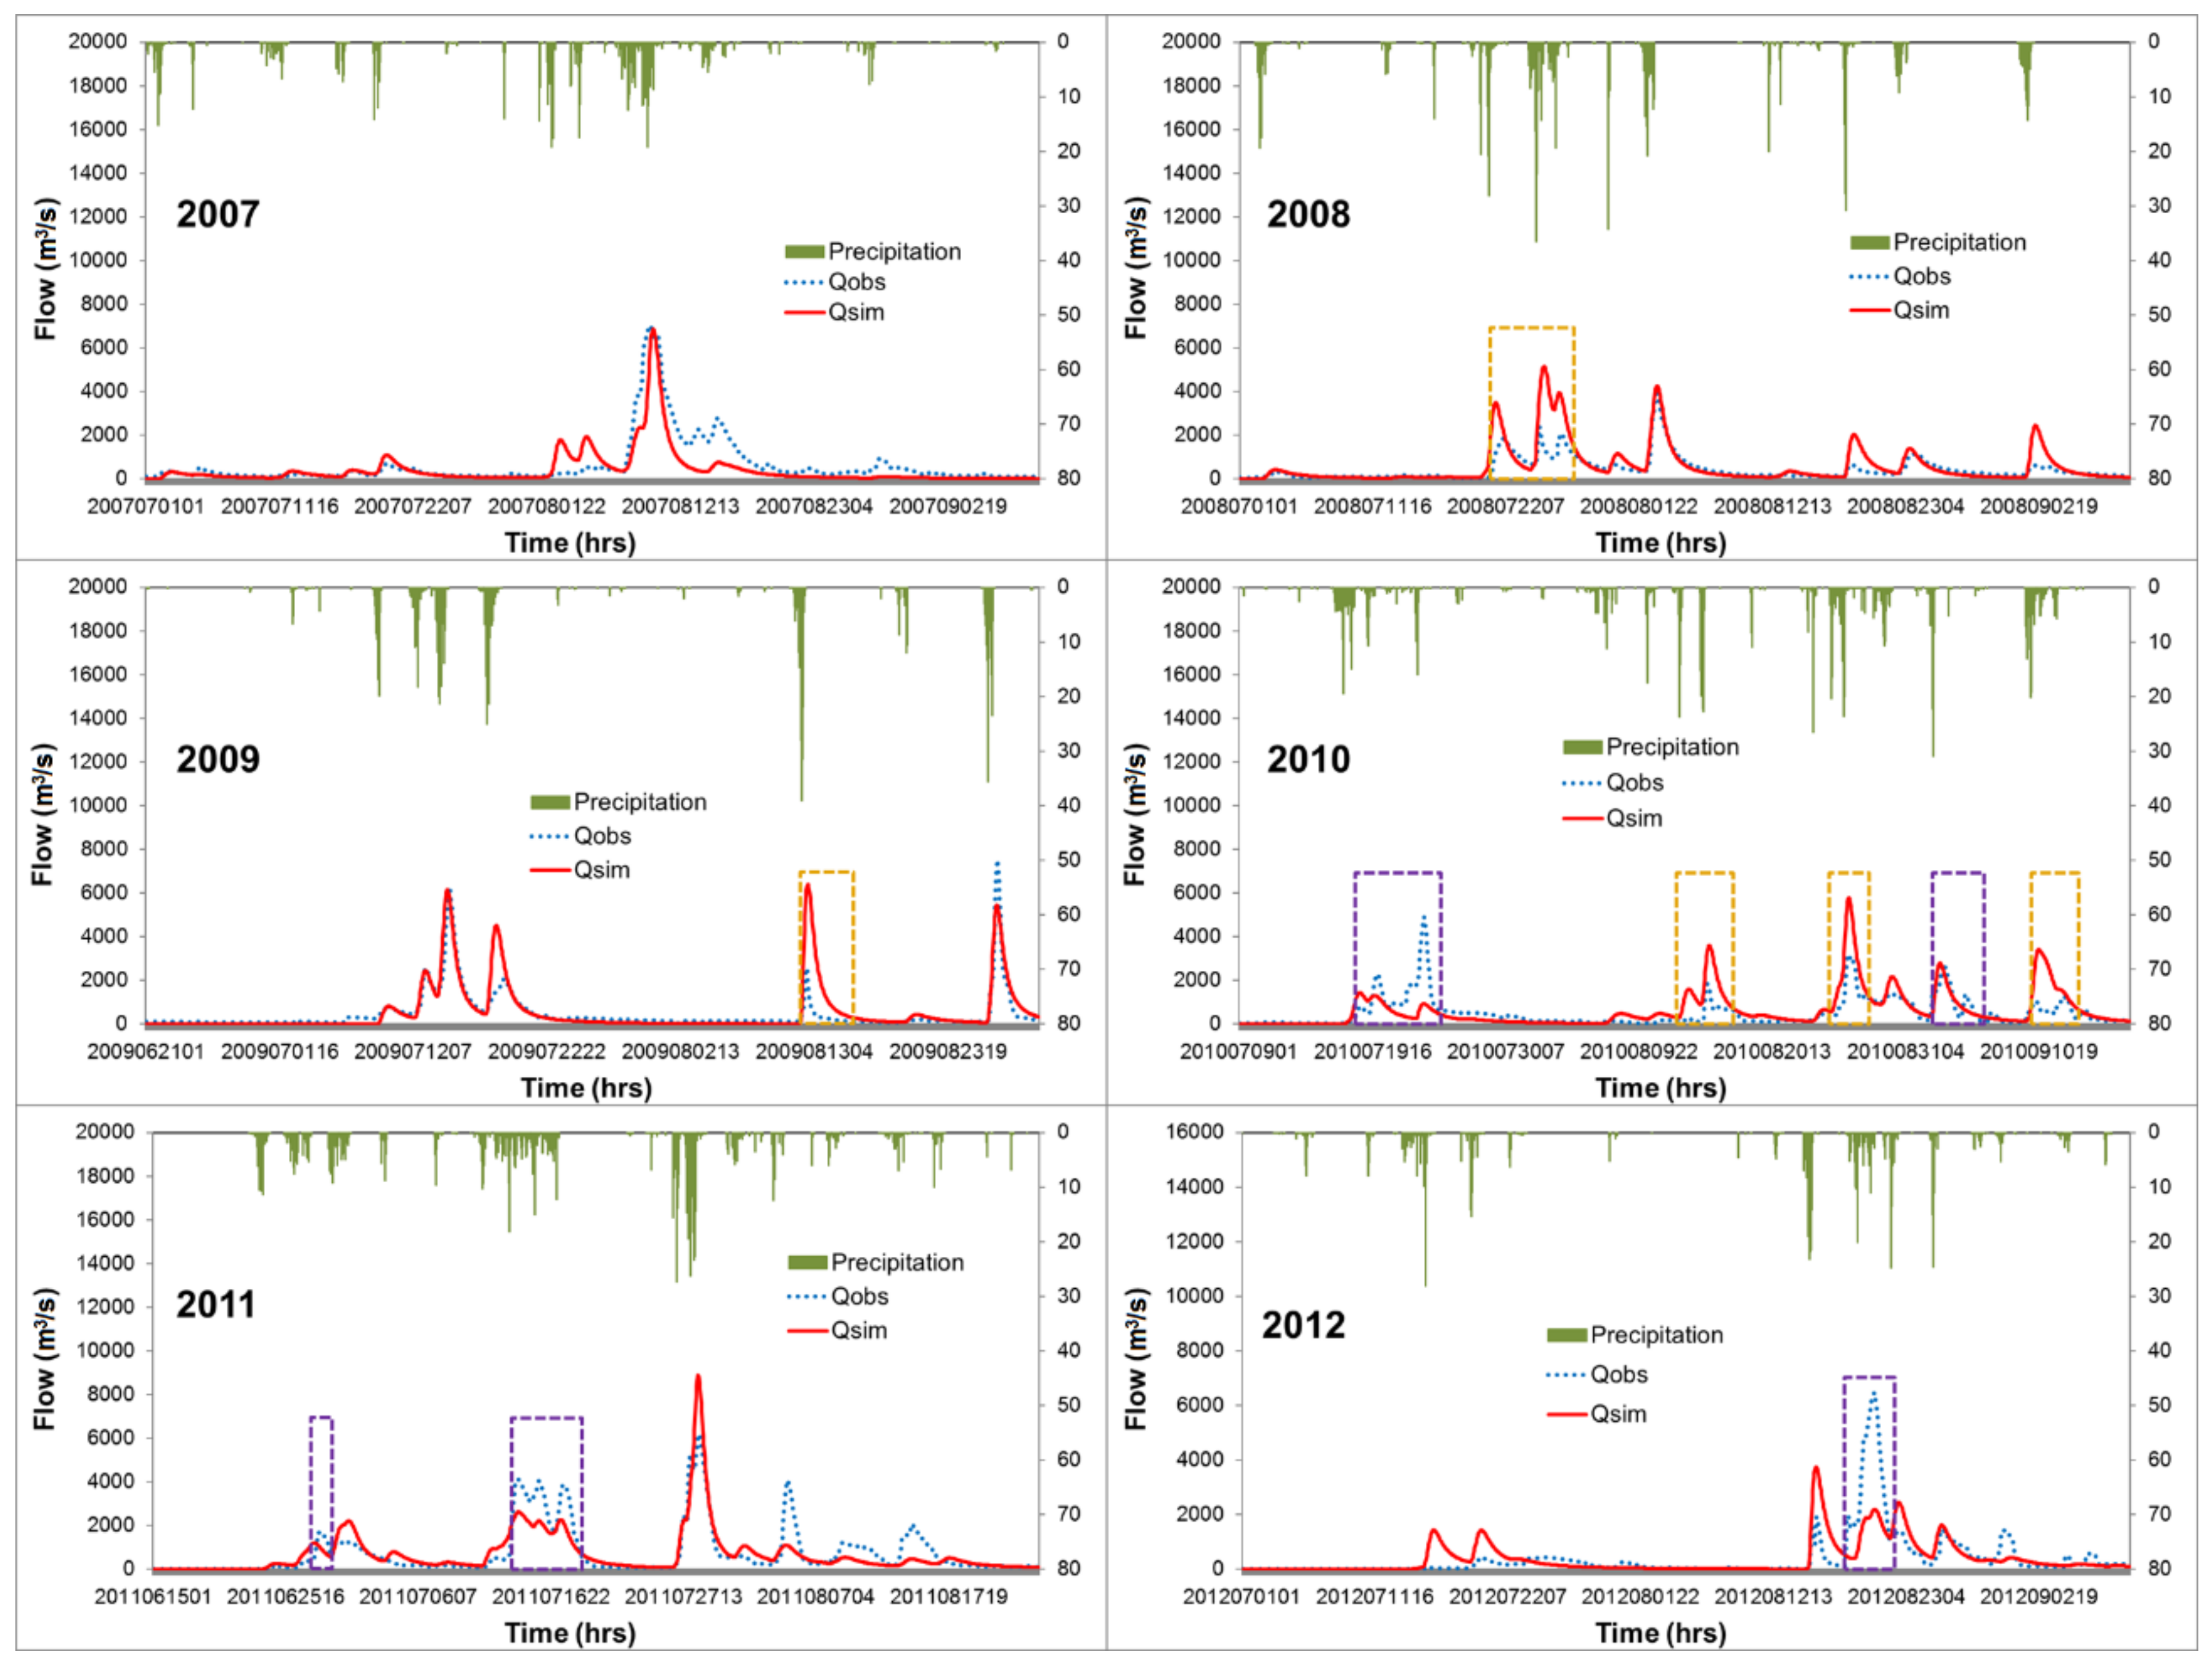
In Figure 2, the simulations reflect the behavior of river discharge corresponding to the amount of rainfall that fell in the event and do not consider the impact of the dam. Compared to simulations, in many rainfall events, the observed discharge is underestimated and does not correspond to the rainfall amount in the event, as indicated in the figure. Referring to the flow rate computed in Table 1, such underestimation is expected due to the loss of the water volume that was stored on the dam in the period.
The duration of release and storage of water from the dam is shown in Table 2. The duration of water storage is the time when the behavior of precipitation and streamflow at Gunnam station did not correspond. The periods are not coincident because the dam is generally storing water when not discharging.
4.2. Simulations of Dam Outflow
After examining the appropriateness of method used, the nonlinear relationship between water level and storage capacity (H–S curve) was developed using the GIS Functional Surface toolset based on the DEM data for 5 dams in North Korea including Hwanggang dam, April 5 dam 1, April 5 dam 2, April 5 dam 3, and April 5 dam 4 as shown in Table 3. These relationships were then applied in the model to simulate dam outflow as mentioned in Section 3.3.
The estimated results show the dominance of storage capacity of Hwanggang dam compared to other dams. This dam is a multi-purpose dam and is also reported to be the largest dam in North Korea and has strong effects on discharge variation and geomorphological change downstream of the Imjin river [9,31].
The dam is manually operated based on various rules of the North Korean government, with reference to the actual conditions of the dam. Hence, it is nearly impossible to automatically simulate dam outflow using a hydrologic model. However, using the duration of water release and storage in Hwanggang dam detailed in Section 4.1, the dam operation module in the model could be calibrated by changing threshold water level of the dam in the first timestep of each duration. The effectiveness of the dam operation module is evaluated by comparing observations and simulation using the dam-integrated SURR model at Gunnam station for events in 2009, 2010, 2011, and 2012 (Figure 3).
Figure 3 shows that the simulated discharges have high correlation with observations, especially in the events where it is confirmed that the streamflow is affected by the amount of water released from the Northern dams. These results prove that the dam consideration module is able to indicate good fit between observations and simulations if the information of dam operation is available.
To evaluate impacts of dam outflow in the Northern part of the Imjin basin on the Southern downstream region, it is necessary to consider inflow and outflow of Hwanggang—the largest dam in the Imjin river basin. The differences between inflow and outflow (so-called controlled discharge Qctr, with Qctr = Qinflow−Qoutflow) for events in 2009, 2010, 2011, and 2012 are shown in Figure 4. The differences between inflow and outflow of Hwanggang dam show the high capability of controlling discharge of the dam. The impacts of the dam become more significant during high rainfall. Referring to the dam affected period defined in Section 4.1, it is clear to see that using the dam operation, the water from the dam is able to change significantly the discharge in downstream basin, with the controlled discharge has a very wide range, from approximately −7000 to 6000 m3/s, where the negative value shows amount of water released and the positive value shows the amount of water stored.
After considering hydraulic structures, the contribution of dam outflows from the Northern part of the Imjin river basin is expected to dominate the downstream discharge at Gunnam station. For example, during the flood event in 2010, in the release period, the dam outflow from Hwanggang dam contributed 98.8% to the inflow in Gunnam station, whereas in the storing periods, the percentage of contribution was slightly decreased but still very high (98.3%). The contribution is similar for the other high flow events.
4.3. Dam Failure Scenarios
The danger of non-warning release from the dams in the northern part of the Imjin river basin has been recorded in history, but simulation still presents a number of limitations due to the lack of information of the northern part, and the simulated discharge may not reflect accurately the actual amount of discharge in the basin. In the release period, this may cause danger for those living downstream. Therefore, four dam failure scenarios were designed based on dam water level and amount of water released from the dam including: 100 percent, 80 percent, 50 percent, and 20 percent of maximum dam storage. The simulated results based on these four dam failure scenarios could help to recognize the potential hazard caused by dam impact of the northern part of the Imjin river basin.
Firstly, the water storage capacity of the dam was defined using the GIS Functional Surface toolset, then the remaining water storage was also defined based on the percentage of the water storage capacity corresponding to four flood scenarios. The threshold water level set up in the model was computed using the relationship between the water level and storage of Hwanggang dam calculated in Section 4.1. The amount released, remaining storage, and threshold water level corresponding to four flood scenarios are shown in Table 4.
To run all flood scenarios caused by dam failure, in this study, the event in 2010 was simulated with the starting time of the dam failure at 10:00 am on 2 September 2010. The simulation results of peak discharges in Gunnam station and Hwanggang dam are shown in Table 5, and simulated discharge at Gunnam station and outflow at Hwanggang dam based on four dam failure scenarios are illustrated in Figure 5.
The hazardous danger of dam failure is clearly shown in the case of 100% or 80% of the water amount being released from the dam, with the sudden increase of downstream discharge and the extremely high peak flow at Hwanggang dam and Gunnam station. In detail, for the case of 100% of the water amount being released from the dam, the discharge in Gunnam station increases rapidly and reaches the peak flow of 22,536.5 m3/s within only 2 hours after dam failure, more than eight times compared to the observed peak flow in the same period. For other flood scenarios, the peak flow in Gunnam is lower, and the time of peak becomes slower. Especially in the case of 20% of the water amount being released from the dam, the simulated peak flow is less than the observations, showing that in reality, during this event, the amount of water released from the dam is probably greater than 20% of its storage.
In Hwanggang dam, the threshold water level for dam safety can be changed in the range of 90 m to 105.8 m. When the dam level gets to the flood level at 103.7 m, it warns of an emergency case, and the dam may release a large amount of water stored in dam. For four designed flood events, the scenario of 100 percent of water being released is the most dangerous case with the peak flow of 36818.0 m3/s being obtained immediately after the failure. The case of 80% and the case of 50% are also hazardous with peak flows of 10605.1 and 4585.2 m3/s, more than three and 1.5 times that of the observed peak flow, respectively.
5. Conclusions
The Imjin river basin is the well-known Korean transboundary basin and has become one of the most considered study areas due to the conflict in geopolitical relationships between North and South Korea. As previously reported, due to the unexpected water release from Hwanggang dam, six South Koreans died on 6 September 2009, and a number of downstream properties were destroyed and damaged [9].
This study evaluated the impacts of Hwanggang dam on downstream discharge in South Korea using an open-source hydrological model (SURR) that integrated a dam operation module, which allows the simulation of hourly dam outflow using the concept of a common dam operation method along with a number of reliable assumptions. The results state that in data-scarce environments, such as transboundary river basins, flood risk is particularly high in the hydraulic structures downstream due to the absence of information sharing, early warning systems, and political consensus for flood defense. Even though loss of life recently decreased, property damage and disruptions are still significant. Therefore, there is a critical need to provide a method able to depict the main characteristics of floods in order to mitigate the damage.
The proposed approach represents a concept for evaluation of impacts from dam failure based on geoprocessing tools, an optimized hydrological model, and science-based assumptions. To apply this concept, the dam parameters and the relationship between water level and dam storage were estimated and developed using the GIS functional surface toolset. In particular the GIS Functional Surface toolset showed its appropriateness for use in calculating dam parameters in transboundary basins. Although the accuracy of this method depends highly on the resolution of DEM data, the estimation results using low resolution data are still in acceptable range.
The results indicate that the downstream discharge is significantly influenced by upstream human interventions, which cannot be considered in calibration and validation processes of the hydrologic model. Although the lack of data in the upstream basin leads to the low accuracy of calibrated parameters, corresponding to a high uncertainty in the streamflow simulations, using the simulation results, when considering the flowrate in each year and referring to amount of precipitation at the same time, the duration of water storage and water release from the upstream dam is probably defined.
The most notable point raised from this concept is that the hydrologic model is highly flexible and customizable and can be developed for multiple dam operations at different temporal resolutions of available data, wherein all the collected data can be utilized optimally. It also allows users to change the initial conditions of the dam whenever the dam information is obtained. The results demonstrate that the optimized model can serve to produce the risks of reported floods throughout transboundary regions and that the model is able to estimate flood risk due to upstream dam failure in different scenarios.
The results generated through the application of the proposed methodology provide a resource to better manage flood risk in transboundary regions, which currently deals with the limitations of observed data. Since GIS is a widely available resource in administrations and public entities that manage a variety of spatial data, a future work to develop might consist of the data available via satellite or survey. However, several limitations remain in the present study: (1) estimation of water storage changes over Hwanggang dam is highly affected by the resolution of DEM data, (2) the operation of Hwanggang dam is based on science-based assumptions with a limited understanding of upstream conditions, while in fact, it is manually operated, and (3) evaluations of impacts on other dams are not presented due to their relatively small size. Despite these limitations, this study could be useful in preventing and mitigating artificial floods from unexpected water releases from the northern dams.
Author Contributions
Conceptualization, D.T.T.H. and D.-H.B.; methodology, D.T.T.H.; validation, D.T.T.H. and S.-H.K.; formal analysis, D.T.T.H.; resources, D.T.T.H. and D.-H.B.; data curation, D.T.T.H and S.-H.K.; writing—original draft preparation, D.T-T-H.; writing—review & editing, D.T.T.H. and D.-H.B.; visualization, D.T.T.H and S.-H.K.; supervision, D.-H.B.; project administration, D.-H.B.; funding acquisition, D.-H.B. All authors have read and agreed to the published version of the manuscript.
Funding
This work was supported by KOREA HYDRO & NUCLEAR POWER CO., LTD. (No. H18S023000).
Conflicts of Interest
The authors declare no conflict of interest.
References
- Arjoon, D.; Tilmant, A.; Herrmann, M. Sharing water and benefits in transboundary river basins. Hydrol. Earth Syst. Sci. 2016, 20, 2135–2150. [Google Scholar] [CrossRef] [Green Version]
- Wolf, A.T.; Natharius, J.A.; Danielson, J.J.; Ward, B.S.; Pender, J.K. International river basins of the world. Int. J. Water Resour. Dev. 1999, 15, 387–427. [Google Scholar] [CrossRef]
- Paisley, R.K.; Henshaw, T.W. Transboundary governance of the Nile River Basin: Past, present and future. Environ. Dev. 2013, 7, 59–71. [Google Scholar] [CrossRef]
- World Commission on Dams. Dams and Development: A New Framework for Decision-Making; The Annual Report; Earthscan Publications Ltd.: London/Sterling, UK, 2000. [Google Scholar]
- Wahl, T.L. Prediction of Embankment Dam Breach Parameters—A Literature Review and Needs Assessment; Dam Safety Report No. DSO-98-004; US Dept of the Interior, Bureau of Reclamation: Denver, CO, USA, 1998.
- UNECE-UNESCAP. Strengthening Cooperation for Rational and Efficient Use of Water and Energy Resources in Central Asia; Report No GV.E.04.04; United Nations Publication: New York, NY, USA, 2004. [Google Scholar]
- Schreiner, B.; Mtsweni, A.; Pegram, G. An Institutional Framework for Stakeholder Participation in Transboundary Basins; Report No. 1758/1/10; Water Research Commission: Pretoria, South Africa, 2011. [Google Scholar]
- Fox, C.A.; Sneddon, C.S. Political Borders, Epistemological boundaries, and contested knowledges: Constructing dams and narratives in the Mekong River Basin. Water 2019, 11, 413. [Google Scholar] [CrossRef] [Green Version]
- Kim, D.H.; Lee, H.K.; Jung, H.C.; Hwang, E.H.; Hossain, F.; Bonnema, M.; Kang, D.H.; Getirana, A. Monitoring River Basin development and variation in water resources in transboundary Imjin River in North and South Korea using remote sensing. Remote Sens. 2020, 12, 195. [Google Scholar] [CrossRef] [Green Version]
- Jothityangkoon, C.; Hirunteeyakul, C.; Boonrawd, K.; Sivapalan, M. Assessing the impact of climate and land use changes on extreme floods in a large tropical catchment. J. Hydrol. 2013, 490, 88–105. [Google Scholar] [CrossRef]
- Glotov, V.E.; Chlachula, J.; Glotova, L.P.; Little, E. Causes and environmental impact of the gold-tailings dam failure at Karamken, the Russian Far East. Eng. Geol. 2018, 245, 236–247. [Google Scholar] [CrossRef]
- Munoz, D.H.; Constantinescu, G. 3-D dam break flow simulations in simplified and complex domains. Adv. Water Res. 2020, 137, 103510. [Google Scholar] [CrossRef]
- Rai, S.P.; Sharma, N.; Lohani, A.K. Novel approach for issues identification in transboundary water management using fuzzy c-means clustering. Appl. Water Sci. 2019, 9, 11. [Google Scholar] [CrossRef] [Green Version]
- Prakash, M.; Rothauge, K.; Cleary, P.W. Modelling the impact of dam failure scenarios on flood inundation using SPH. Appl. Math. Model. 2014, 38, 5515–5534. [Google Scholar] [CrossRef]
- Yang, Y.; Zhang, M.; Zhu, L.; Zhang, H.; Liu, W.; Wang, J. Impact of the operation of a large-scale reservoir on downstream river channel geomorphic adjustments: A case study of the Three Gorges. River Res. Appl. 2018, 34, 1315–1327. [Google Scholar] [CrossRef]
- Yu, X.; He, D.; Phousavanh, P. Transboundary environmental effects of hydropower: Sediment transport and geomorphology. In Balancing River Health and Hydropower Requirements in the Lancang River Basin; Springer: Berlin/Heidelberg, Germany, 2018; pp. 161–182. [Google Scholar]
- Luo, X.X.; Yang, S.L.; Zhang, J.B. The impact of the Three Gorges Dam on the downstream distribution and texture of sediments along the middle and lower Yangtze River (Changjiang) and its estuary, and subsequent sediment dispersal in the East China Sea. J. Geomorphol. 2012, 179, 126–140. [Google Scholar] [CrossRef]
- Metawie, A.F. History of co-operation in the Nile Basin. Int. J. Water Resour. Dev. 2004, 20, 47–63. [Google Scholar] [CrossRef]
- Balthrop, C.; Hossain, F. A review of state of the art on treaties in relation to management of transboundary flooding in international river basins and the Global Precipitation Measurement mission. Water Policy 2010, 12, 635–640. [Google Scholar] [CrossRef]
- Lucas-Picher, P.; Arsenault, R.; Poulin, A.; Ricard, S.; Lachance-Cloutier, S.; Turcotte, R. Application of a high-resolution distributed hydrological model on a U.S.-Canada transboundary basin: Simulation of the multiyear mean annual hydrograph and 2011 flood of the Richelieu River Basin. J. Adv. Model. Earth Syst. 2020, 12, e2019MS001709. [Google Scholar] [CrossRef] [Green Version]
- Asghar, M.R.; Ushiyama, T.; Riaz, M.; Miyamoto, M. Flood and inundation forecasting in the sparsely gauged transboundary chenab river basin using satellite rain and coupling meteorological and hydrological models. J. Hydrometeorol. 2019, 20, 2315–2330. [Google Scholar] [CrossRef]
- Mulligan, M.; van Soesbergen, A.; Sáenz, L. GOODD, a global dataset of more than 38,000 georeferenced dams. Scientific Data 2020, 7, 1–8. [Google Scholar] [CrossRef] [Green Version]
- Eldardiry, H.; Hossain, F. Understanding reservoir operating rules in the transboundary nile river basin using macroscale hydrologic modeling with satellite measurements. J. Hydrometeorol. 2019, 20, 2253–2269. [Google Scholar] [CrossRef]
- Jabbari, A.; So, J.M.; Bae, D.H. Precipitation forecast contribution assessment in the coupled meteo-hydrological models. Atmosphere 2020, 11, 34. [Google Scholar] [CrossRef] [Green Version]
- Bae, D.H.; Lee, B.J. Development of continuous rainfall-runoff model for flood forecasting on the Large-Scale Basin. J. Korea Water Resour. Assoc. 2011, 44, 398–406. [Google Scholar] [CrossRef]
- Kimura, T. The Flood Runoff Analysis Method by the Storage Function Model; The Public Works Research Institute, Ministry of Construction: Tokyo, Japan, 1961.
- Nagai, A.; Kadoya, M. Quasi optimization technique for parameter identification of the kinematic runoff model. Trans. Jpn. Soc. Irrig. Drain. Reclam. Eng. 1987, 127, 79–82. [Google Scholar]
- Bae, D.H.; Trinh, H.L.; Nguyen, H.M. Uncertainty estimation of the SURR model parameters and input data for the Imjin River basin using the GLUE method. J. Hydro Environ. Res. 2018, 20, 52–62. [Google Scholar] [CrossRef]
- Ouma, Y.O. Evaluation of Multiresolution Digital Elevation Model (DEM) from real-time kinematic GPS and ancillary data for reservoir storage capacity estimation. Hydrology 2016, 3, 16. [Google Scholar] [CrossRef] [Green Version]
- Rehbock, T. Discussion of E. W. Schoder and K. B. Turner’s “Precise weir measurements”. Trans. ASCE 93 1929, 1711, 1143–1162. [Google Scholar]
- Jang, S.K.; Lee, J.K.; Oh, J.H.; Lee, H.S. Drought and water deficit analysis in Imjin River Basin: Focusing on influence of Hwanggang Dam in North Korea. Crisisonomy 2016, 12, 79–95. [Google Scholar] [CrossRef]
Figure 1.
The Imjin river basin, Korean peninsula: (a) Subbasins, river network, and elevation (Digital Elevation Model, DEM); (b) Location of 68 rain-gauge stations, 3 meteorological stations, 3 flow stations, and Thiessen polygons.
Figure 1.
The Imjin river basin, Korean peninsula: (a) Subbasins, river network, and elevation (Digital Elevation Model, DEM); (b) Location of 68 rain-gauge stations, 3 meteorological stations, 3 flow stations, and Thiessen polygons.

Figure 2.
The simulated and observed discharges at Gunnam station in 6 flood events (2007, 2008, 2009, 2010, 2011, and 2012) without considering dam impact. The purple dotted line expresses the periods affected by the dam releasing water, and the orange dotted line expresses the suppositional periods affected by the dam storing water.

Figure 3.
The simulated and observed discharges at Gunnam station in 4 flood events (2009, 2010, 2011, and 2012) after considering dam impact.
Figure 3.
The simulated and observed discharges at Gunnam station in 4 flood events (2009, 2010, 2011, and 2012) after considering dam impact.

Figure 4.
The simulated and observed discharges at Gunnam station in 4 flood events (2009, 2010, 2011, and 2012) after considering dam impact.
Figure 4.
The simulated and observed discharges at Gunnam station in 4 flood events (2009, 2010, 2011, and 2012) after considering dam impact.

Figure 5.
Simulated outflow at Hwanggang dam (upper) and Simulated discharge at Gunnam station (lower) in 4 dam failure scenarios.
Figure 5.
Simulated outflow at Hwanggang dam (upper) and Simulated discharge at Gunnam station (lower) in 4 dam failure scenarios.


Table 1.
Flow rate (%) of 6 flood seasons from 2007 to 2012.
| Flow Rate (%) | Observation | Simulation | ||||
|---|---|---|---|---|---|---|
| Gunnam | Jeonkok | Jeogseong | Gunnam | Jeonkok | Jeogseong | |
| 2007 | 30.39 | 25.59 | 31.51 | 19.97 | 17.17 | 19.30 |
| 2008 | 15.77 | 19.83 | 19.64 | 21.61 | 20.51 | 21.30 |
| 2009 | 18.05 | 27.19 | 20.69 | 20.97 | 21.13 | 21.29 |
| 2010 | 17.92 | 33.32 | 23.68 | 22.10 | 21.70 | 21.80 |
| 2011 | 24.38 | 26.07 | 23.83 | 22.14 | 20.86 | 21.07 |
| 2012 | 19.51 | 20.66 | 19.40 | 18.95 | 16.38 | 18.39 |
Table 2.
Durations of water release and water storage in Hwanggang dam (The red letters express the durations where dam operation affected the simulation period).
Table 2.
Durations of water release and water storage in Hwanggang dam (The red letters express the durations where dam operation affected the simulation period).
| Year | Water Release | Water Storage | ||
|---|---|---|---|---|
| Starting Date | Ending Date | Starting Date | Ending Date | |
| 2007 | 17 May 2007 | 18 May 2007 | - | - |
| 2008 | No information | No information | 20 July 2008 25 July 2008 | 22 July 2008 27 July 2008 |
| 2009 | 6 September 2009 | No information | 12 August 2009 | 14 August 2009 |
| 2010 | 27 June 2010 18 July 2010 21 July 2010 4 September 2010 | 27 June 2010 19 July 2010 No information No information | 13 August 2010 25 August 2010 10 September 2010 | 17 August 2010 27 August 2010 12 September 2010 |
| 2011 | 27 June 2011 13 July 2011 | 30 June 2011 No information | - | - |
| 2012 | 19 August 2012 | No information | 16 August 2012 | 18 August 2012 |
Table 3.
Estimation of parameters for 5 dams in the Northern part of the Imjin river basin.
| Hwanggang Dam | April 5th Dam 1 | April 5th Dam 2 | April 5th Dam 3 | April 5th Dam 4 | |||||
|---|---|---|---|---|---|---|---|---|---|
| Water level (m) | Storage capacity (106 m3) | Water level (m) | Storage capacity (106 m3) | Water level (m) | Storage capacity (106 m3) | Water level (m) | Storage capacity (106 m3) | Water level (m) | Storage capacity (106 m3) |
| 73 | 0.0000 | 43 | 0.0037 | 60 | 1.8848 | 99 | 0.0401 | 106 | 0.6831 |
| 75 | 0.1422 | 44 | 0.0066 | 61 | 3.4020 | 100 | 0.0738 | 107 | 1.3976 |
| 80 | 5.7731 | 45 | 0.0106 | 62 | 5.3164 | 101 | 0.1150 | 108 | 2.3905 |
| 85 | 21.8952 | 46 | 0.0155 | 63 | 7.6350 | 102 | 0.1615 | 109 | 3.6719 |
| 90 | 62.3103 | 47 | 0.0214 | 64 | 10.3591 | 103 | 0.2151 | 110 | 5.1888 |
| 95 | 139.6445 | 48 | 0.0285 | 65 | 13.4803 | 104 | 0.2922 | 111 | 6.8918 |
| 100 | 268.3233 | 49 | 0.0740 | 66 | 16.9962 | 105 | 0.4493 | 112 | 8.7557 |
| 105 | 443.7489 | 50 | 0.3436 | 67 | 20.9344 | 106 | 0.7523 | 113 | 10.8043 |
| 110 | 648.8111 | 51 | 1.0540 | 68 | 25.3495 | 107 | 1.2675 | 114 | 13.1038 |
| 115 | 886.0903 | 52 | 2.3671 | 69 | 30.3062 | 108 | 2.0608 | 115 | 15.7358 |
| 120 | 1160.4178 | 53 | 4.4057 | 70 | 35.8663 | 109 | 3.1985 | 116 | 18.7718 |
| 125 | 1466.1082 | 54 | 7.2362 | 71 | 41.2492 | 110 | 4.7469 | 117 | 22.2773 |
Table 4.
Threshold water level corresponding to 4 dam failure scenarios.
| Scenarios | Dam Water Level (m) | Amount Released (106 m3) | Remaining Storage (106 m3) |
|---|---|---|---|
| 100% | 73 | 451.4 | 0 |
| 80% | 92.1 | 361.1 | 90.3 |
| 50% | 98.5 | 225.7 | 225.7 |
| 20% | 102.6 | 90.3 | 361.1 |
Table 5.
Peak discharge and time of peak in Gunnam station and Hwanggang dam in the 2010 event.
| Scenario | Peak Discharge in Gunnam (m3/s) | Time of Peak in Gunnam | Peak Discharge in Hwanggang (m3/s) | Time of Peak in Hwanggang | Percentage of Change Compared to Observation |
|---|---|---|---|---|---|
| Case 100% | 22,536.5 | 12:00 p.m. 2 September | 36,818.0 | 10:00 p.m. 2 September | 713.8 |
| Case 80% | 8070.0 | 14:00 p.m. 2 September | 10,605.1 | 10:00 p.m. 2 September | 191.2 |
| Case 50% | 4173.5 | 15:00 p.m. 2 September | 4585.2 | 10:00 p.m. 2 September | 50.6 |
| Case 20% | 2275.3 | 2:00 a.m. 3 September | 1975.6 | 3:00 a.m. 3 September | −17.9 |
© 2020 by the authors. Licensee MDPI, Basel, Switzerland. This article is an open access article distributed under the terms and conditions of the Creative Commons Attribution (CC BY) license (http://creativecommons.org/licenses/by/4.0/).
Share and Cite
MDPI and ACS Style
Ha, D.T.T.; Kim, S.-H.; Bae, D.-H. Impacts of Upstream Structures on Downstream Discharge in the Transboundary Imjin River Basin, Korean Peninsula. Appl. Sci. 2020, 10, 3333. https://doi.org/10.3390/app10093333
AMA Style
Ha DTT, Kim S-H, Bae D-H. Impacts of Upstream Structures on Downstream Discharge in the Transboundary Imjin River Basin, Korean Peninsula. Applied Sciences. 2020; 10(9):3333. https://doi.org/10.3390/app10093333
Chicago/Turabian StyleHa, Doan Thi Thu, Seon-Ho Kim, and Deg-Hyo Bae. 2020. "Impacts of Upstream Structures on Downstream Discharge in the Transboundary Imjin River Basin, Korean Peninsula" Applied Sciences 10, no. 9: 3333. https://doi.org/10.3390/app10093333
Note that from the first issue of 2016, this journal uses article numbers instead of page numbers. See further details here.