Article

Y2O3:Eu3+ Nanophosphor-Coated Mica or TiO2/Mica as Red-Emitting Pearl Pigment: Coating Factors, Luminescent and Gloss Properties

1
A Energy & Environment Division, Korea Institute of Ceramic Engineering & Technology (KICET), Jinju 52851, Gyeongsangnam-do, Korea
2
Graduate School of Convergence Science, Pusan National University, Geumjeong-gu, Pusan 46241, Korea
3
Department of Chemical Engineering, Kongju National University, Gongju 31080, Chungcheongnam-do, Korea
4
CQV Co., 144, Seongjung-Ro, Jincheon-Eup, Jincheon-gun 27845, Chungcheongbuk-do, Korea
*
Authors to whom correspondence should be addressed.
These authors contributed equally to this work.
Appl. Sci. 2021, 11(10), 4365; https://doi.org/10.3390/app11104365
Submission received: 12 April 2021 / Revised: 3 May 2021 / Accepted: 4 May 2021 / Published: 11 May 2021
(This article belongs to the Topic Metallurgical and Materials Engineering)

Abstract

:
Red-emitted Y2O3:Eu3+ nanophosphor coated on a mica flake (Y2O3:Eu@MF) or on TiO2 having a rutile crystalline mica flake (Y2O3:Eu@TMF) has been prepared by an electrostatic interaction with the wet-coating method for the purpose of a pigment with luminescent and gloss properties. Aggregated Y2O3:Eu3+, prepared by the template method, was dispersed into nanosol by a controlled bead-mill wet process. The (+) charged Y2O3:Eu3+ nanosol was effectively coated on the (−) charged mica flake (MF) or the TiO2/mica flake (TMF) by an electrostatic interaction between the Y2O3:Eu3+ nanoparticles and MF or TMF at pH 6–8. The coating factors of Y2O3:Eu@MF were also studied and optimized by controlling the pH, stirring temperature, calcination temperature, and coating amount of Y2O3:Eu3+. The Y2O3:Eu3+ was partially coated and optimized on the MF or TMF surface with a coating coverage of about 40–50% or 60–70%, respectively. Y2O3:Eu@MF and Y2O3:Eu@TMF were exhibiting the luminescent property of a red color under a 254 nm wavelength, and had a color purity of over 95% according to CIE chromaticity coordinates. These materials were characterized by X-ray diffraction, FE-SEM, zeta potential, and a fluorescence spectrometer. These materials with luminescent and gloss properties prepared in this work potentially meet their applications for security purposes.

1. Introduction

Europium-doped Y2O3 (Y2O3:Eu3+) is an important red phosphor, which is known for various applications due to its excellent optical properties. This kind of phosphor has been a great interest in fields such as transparent ceramics [1,2], white light-emitting diode phosphors [3], up-conversion, commercial lighting materials [3,4], plasma display panels, biomedical applications, sensors, cathode ray tubes, finger print detection [5], fluorescence sensors, medical images, illumination, and optical display technology [6]. These materials have also been used for security inks, security pigments, and biological diagnostics to prevent duplication [7]. This may be due to its luminescence properties, such as high quantum efficiency, brightness, color purity, and good absorption ability of UV radiation [8,9]. Y2O3:Eu3+ materials are being extensively studied owing to their better red emission, good thermal stability, uniformity, and better cohesion on substrate surfaces [10]. In order to obtain better luminescent properties, the phosphor materials should have a homogeneous distribution of the activator in the host matrix, with high crystallinity and phase purity [11]. Due to the aforementioned advantages, various methods have been employed for the synthesis of this material, including the sol-gel process, precipitation, hydrothermal, combustion, spray pyrolysis [12], and solid-state reaction (SSR) [10,11]. However, the products obtained by the SSR method have some disadvantages, such as non-homogeneous phase distribution, a bulky and non-uniform particle shape, which may degrade the luminescence properties of the phosphors. Such problems have been overcome by using a novel liquid-phase precursor approach or the confined space method using a template source, which may be a good way to prepare these materials with excellent luminescence properties [12,13].
Particle coating technology has applications in drug layering [14], security pigments [12], cosmetics [15], and specialty pigments. The coating ability can be controlled by employing electrostatic interaction, along with modifying the surface of particles before coating. As nanosized particles are unstable due to their high specific surface area, wet-in-wet coating is easier to be used for coating the base material surface equally in an aqueous environment. We have recently reported that lanthanide-based nanophosphor and its dispersed nanosol with good luminescent property have the potential to be applied for security purposes [16]. Mica flake coated by CeO2:Eu3+/Na+ as a red phosphor was produced as a security pigment that emits red light luminescent enough to be visible to the eyes [12,17]. We have also published the Gd2O3:Eu/Bi as a red-emitting nanophosphor coated on TiO2/mica as a pearl pigment for security purposes [18]. Generally, the pearl pigments have a two-dimensional substrate such as the mica flake with a low refractive index and TiO2 as a coating layer with a high refractive index. The pearl pigments are mainly used as a security material with gloss properties due to their unique sparkling and color change [18,19,20]. These materials are expected to be used as next-generation anti-counterfeiting pigments [12,18]. To make high luminescent pearl-type security materials, there are two ways, one is the pearl pigment should have an excellent fluorescent property and another way is to coat high luminescent nanophosphor on its surface. However, the coating of high luminescent nanophosphor is a good way to obtain a high luminescent security pigment.
Y2O3:Eu3+ shows a good red emission due to the Eu3+ under 254 nm UV excitation. In order to achieve better luminescent characteristics, the template method is considered to be a better synthesis technique to obtain a high luminescent nanophosphor. We have hypothesized to prepare Y2O3:Eu3+ by the template method and to convert it into a highly dispersed nanosol form under a controlled bead-mill wet process and to coat them on MF or TMF. The Y2O3:Eu3+ is experimentally to coated on MF or TMF by optimizing their coating factors, such as pH, stirring temperature, coating amount, and calcination temperature. Finally, the luminescent property of Y2O3:Eu@MF or Y2O3:Eu@TMF red phosphors was also investigated. However, no report has been published on preparing Y2O3:Eu3+ nanosol using the bead-mill wet process, and their coating on MF or TMF. Finally, this study confirmed that Y2O3:Eu3+ coated on MF or TMF can be applied for the preparation of a photo-functional security pigment with anti-counterfeiting properties.

2. Materials and Methods

2.1. Materials

In this work, all starting materials for the preparation of Y2O3:Eu3+ and its nanosol were used without further purification, yttrium oxide (Samchun Chem., Seoul, Korea, 99.99%) and europium oxide (Sigma-Aldrich, Aldrich, MN, USA, 99.99%). HNO3 (Daejung Chem., Shiheung, Korea, 60%) was used as the dissolution solvent. Distilled water was used throughout the experiments. Acrylate copolymer (BYK Co., Wesel, Germany) was used as the dispersing agent. Mica flake (MF, CQV Co., Seongjung-Ro, Korea, particle size: 9–45 µm) or TiO2 coated on mica flake (TMF, CQV Co., Seongjung-Ro, Korea, particle size: 5–35 µm) powders were supplied from CQV Co. Especially, TMF consists of the mica flake coated and covered completely by rutile phase TiO2 along with 50–70 nm thickness.

2.2. Preparation of Y2O3:Eu3+ Coated on MF or TMF

Aggregated Y2O3:Eu3+ nanoparticles were synthesized by a template method. The Y2O3:Eu3+ was dispersed into nanosol by bead-mill process [21]. The size of primary particles was in the range of 85–130 nm, while the concentration of nanosol after milling was 2 wt%. Y2O3:Eu@MF or Y2O3:Eu@TMF were prepared by wet coating method as described below. First, 10 g MF or TMF were added in 100 mL distilled water or ethanol and stirred for 20 min at room temperature. The initial pH of the solution was adjusted to 6–8, by adding 1 M HCl or NaOH, and stirred for 20 min. Y2O3:Eu3+ (50 mL) nanosol of 5–30 wt% (based on MF or TMF weight) was injected slowly with 0.2 mL/min feeding rate into the MF or TMF’s slurry along with stirring at 200 rpm. Finally, the mixture was again adjusted to pH 6–8, and then treated at 65–95 °C for 24 h. The resultant products were filtered and washed with distilled water and dried at 100 °C for 4 h. The dried powders were calcined at 600–850 °C for 4 h to coat tightly and enhance the luminescent property. In order to optimize the coating ability of the Y2O3:Eu3+ nanoparticle on the surface of MF or TMF, it was carried out by varying factors such as pH, Y2O3:Eu3+ coating amount, and reaction temperature, as summarized in Table 1. While the schematic diagram for the preparation of Y2O3:Eu@MF or Y2O3:Eu@TMF is shown in Figure 1.

2.3. Preparation of the Film of Y2O3:Eu@MF and Y2O3:Eu@TMF

In order to measure gloss property, the film of Y2O3:Eu@MF or Y2O3:Eu@TMF was prepared as describe below. The coating slurries of two kinds of powder were respectively added in NC (nitrocellulose) resin and stirred for 1 min at 3000 rpm by a speed mixing machine. The coating slurries were uniformly painted on an opacity chart (paper film supplied from CQV Co., Korea) with 200 μm thickness.

2.4. Characterization

The crystal phase of the Y2O3:Eu3+ and Y2O3:Eu@MF was identified by X-ray diffraction (XRD, DMAX 2500, Rigaku, Wilmington, MA, USA) measurement. Particle size distribution of Y2O3:Eu3+ nanosol was observed by a particle size analyzer (PSA, ELS-Z, Otsuka Electronics, Tokushima, Japan). The zeta potential of Y2O3:Eu3+, MF and TMF was analyzed by ELS-Z. To improve reliability of measurements, the average value was obtained by measuring 4 times. Field emission scanning electron microscopy (FE-SEM, JSM-6700F, JEOL, Akishima, Japan) was used to analyze the coating image and coverage of Y2O3:Eu3+ particles coated on MF or TMF surface. The emission or excitation spectra of all the prepared samples were measured by spectrophotometer (LS 50, PerkinElmer, Waltham, MA, USA). The gloss properties of these films prepared with MF, TMF, Y2O3:Eu@MF, and Y2O3:Eu@TMF were measured using a micro-TRI-gloss meter (BYK Gardner, Wesel, Germany). In this case, a glass plate with a refractive index of 1.567 was used as the standard sample. Gloss was measured by projecting a beam of light at 20°, 60°, and 85° angles onto the film surface.

3. Results

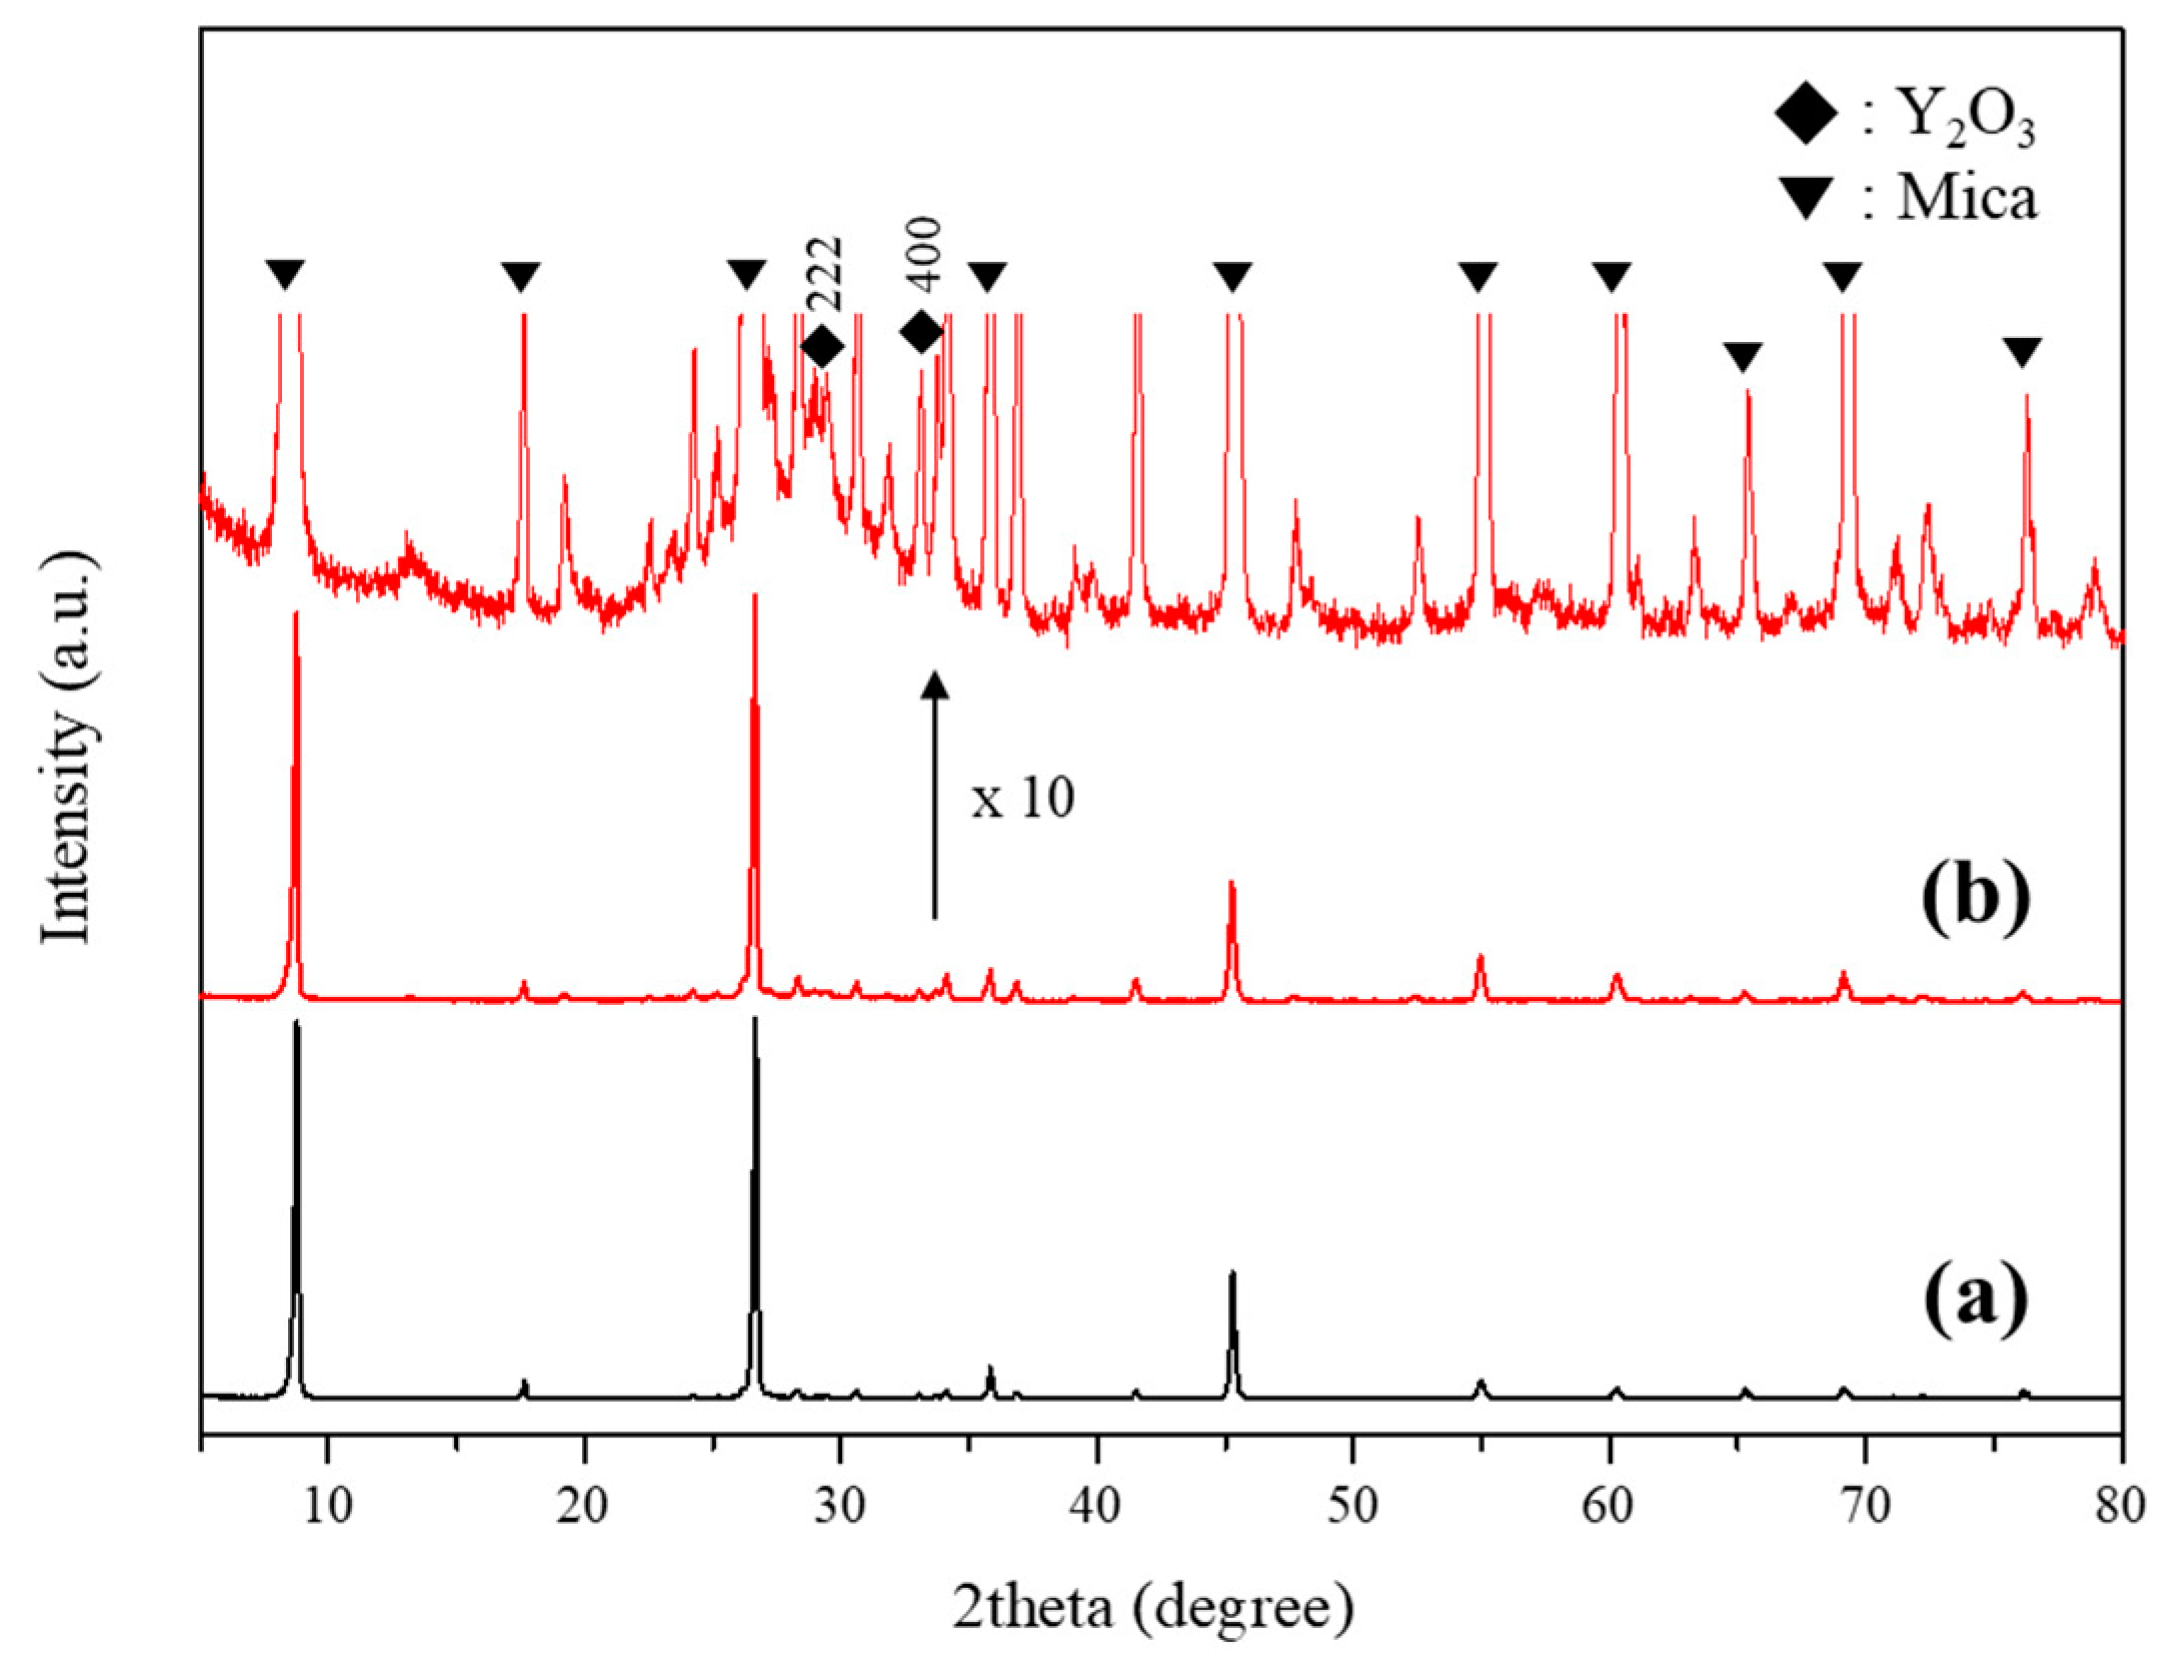
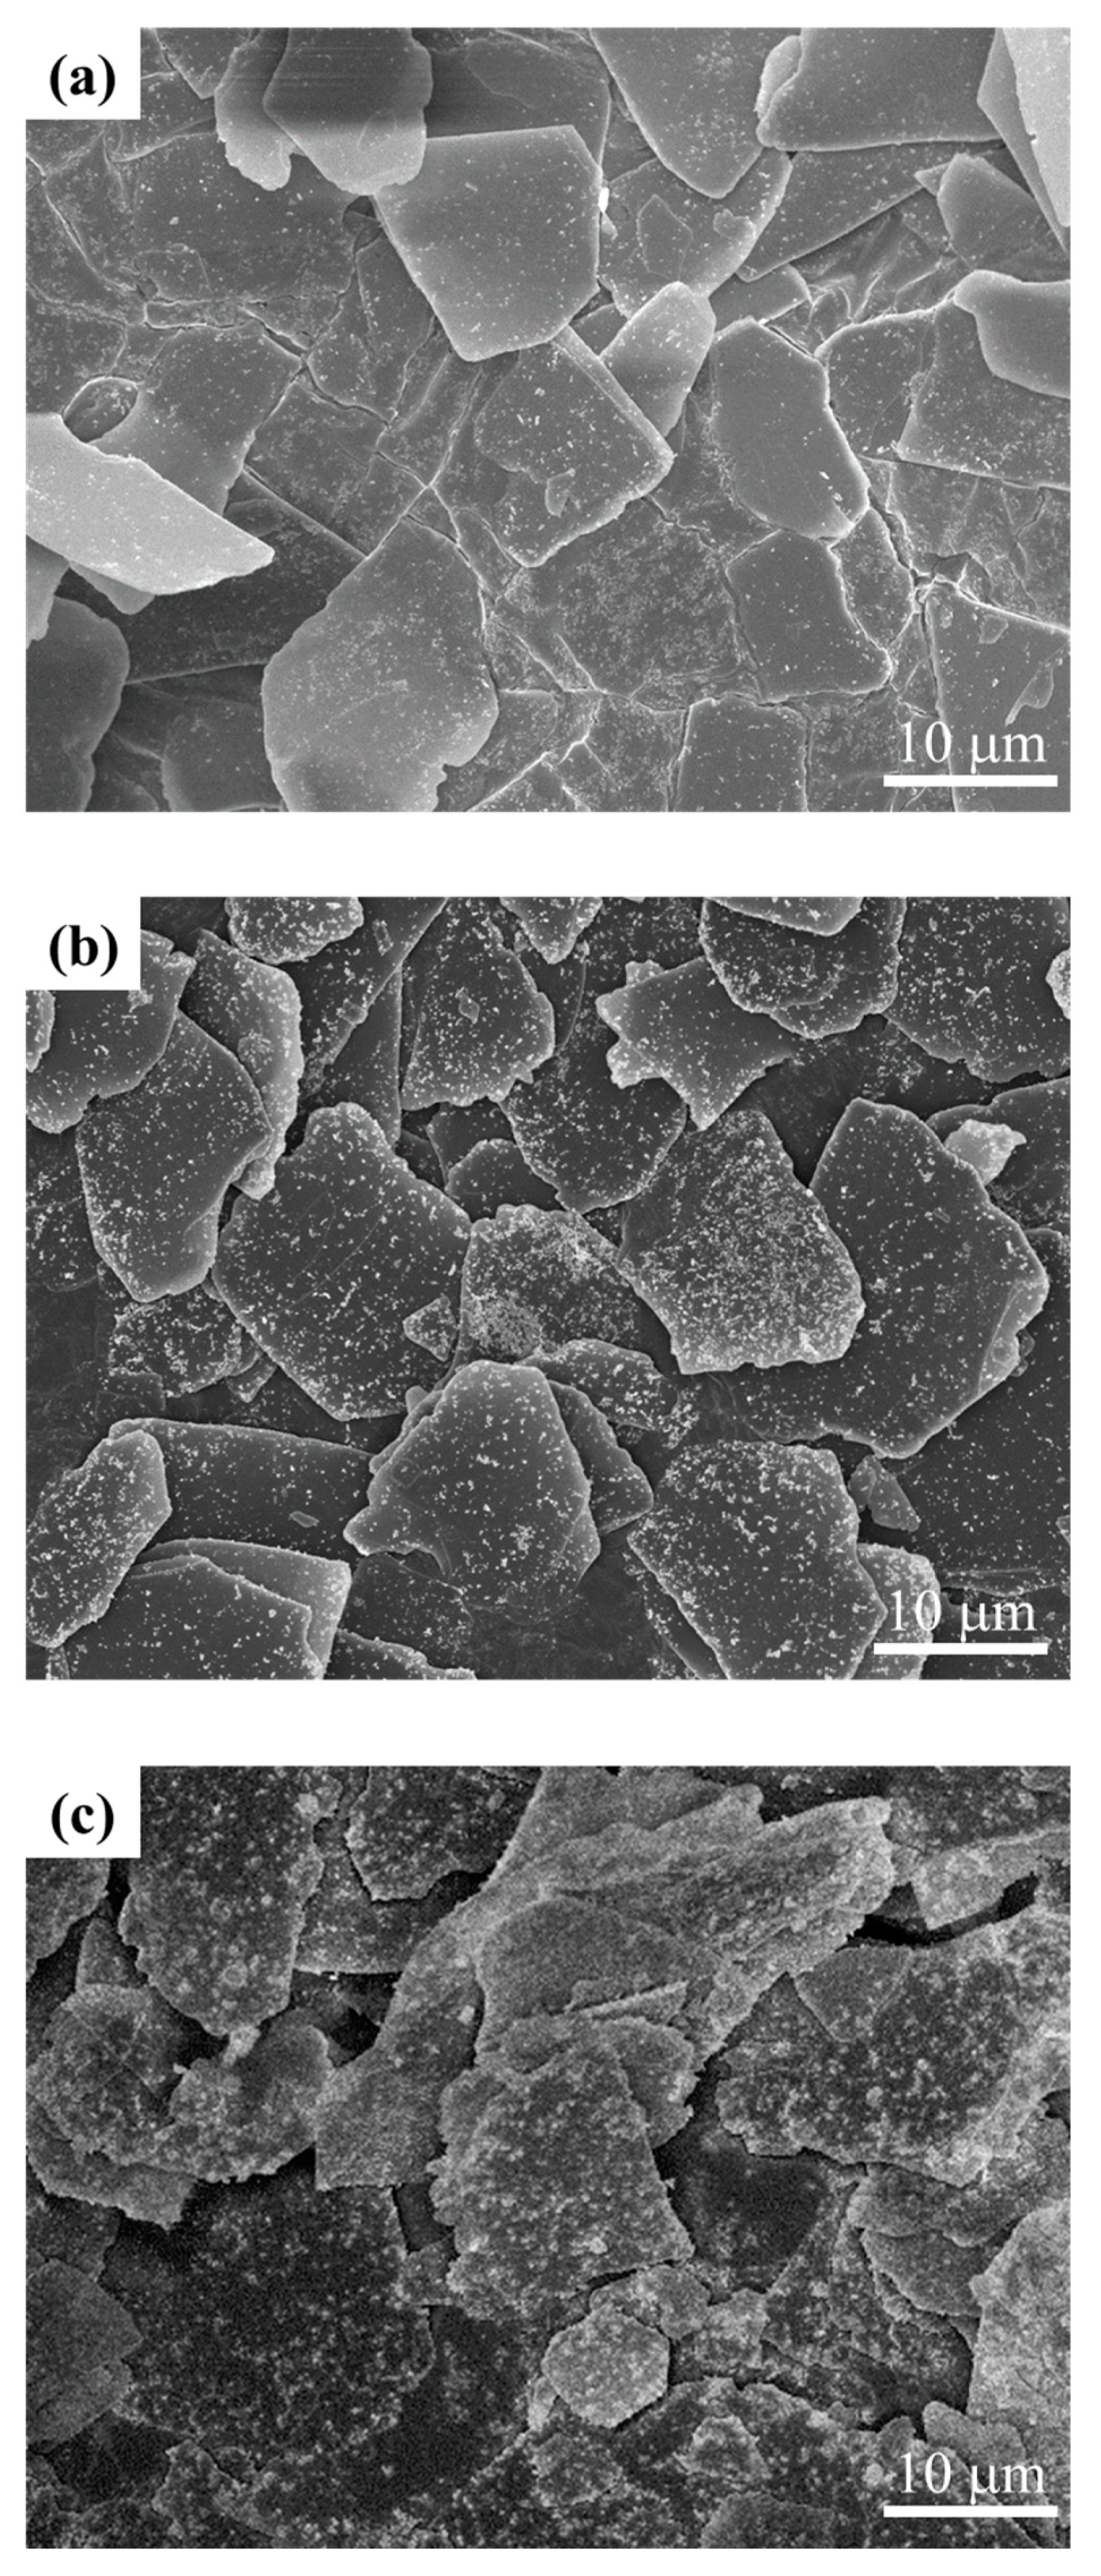
3.1. Y2O3:Eu@MF Prepared by the Variation in pH and Solvents

To disperse the aggregated Y2O3:Eu3+ nanophosphor prepared by the template method, the Y2O3:Eu3+ nanosol was prepared and optimized by controlling the solvents, pH, and a dispersant agent (acrylate copolymer) to improve the dispersibility under the bead-mill wet process.
Figure 2 displays the particle size distribution of the Y2O3:Eu3+ nanosol dispersed in ethanol or water. The nanosol dispersed in ethanol, as in Figure 2a, has around 134 nm of the median particle size (D50), whereas that in water, Figure 2b, has around 120 nm [21].
Here, the zeta potential of the Y2O3:Eu3+ dispersed in H2O is 40.4 mV, but 15.3 mV in ethanol. Generally, if the absolute value of the zeta potential is more than 30 mV, the dispersion stability is excellent due to the strong repulsive force between the particles [22]. It can be explained that the Y2O3:Eu3+ dispersed in H2O is more stable than that dispersed in ethanol. Also, H2O and ethanol are both hydrophilic. The difference of the dispersions in the two solutions is considered to be the relative polarity. While H2O has only a hydroxyl group which is hydrophilic, ethanol has a hydroxyl group and an alkyl group, which is lipophilic [23], so the difference in polarities is expected to have caused a difference in the dispersion stability.
To coat Y2O3:Eu3+ nanoparticles on the surface of the mica flake (MF), the electrostatic attraction between the two particles was observed via the zeta potential of Y2O3:Eu3+ and MF. Figure 3 shows the zeta potential curves of the MF and Y2O3:Eu3+ particles measured in the pH range of 1–10. In the case of MF, the zeta potential tends to decrease from +30 mV to −55 mV on increasing the pH from 1 to 10. The isoelectric point (IEP) of mica is at about a pH of 5.5. Y2O3:Eu3+ nanoparticles modified with an acrylic copolymer have a (+) charge in the entire pH range. Therefore, the coating process between Y2O3:Eu3+ and mica is considered to be the most effective in the pH range of 7–9, at which the potential difference is the highest.
Figure 4 displays the FE-SEM images of the Y2O3:Eu@MF red phosphors prepared by varying the pH of ethanol or water. Figure 4a,b show the surface of the Y2O3:Eu@MF at pH 7 and 8, respectively, in the ethanol system. It was confirmed that the coating coverage ratio of the Y2O3:Eu3+ particles on the surface of MF was about 5% or less. The sample prepared at pH 7 in the water system was about 1–5%, as depicted in Figure 4c. Interestingly, the sample prepared at pH 8 was coated with 30–40% coverage of Y2O3:Eu3+, as shown in Figure 4d. Under the condition of pH 8, the zeta potential difference between the surface charge of the (+) charged Y2O3:Eu3+ and the (−) charged mica was 85 mV. It means that the two particles interact more effectively and are coated to prepare Y2O3:Eu@MF. Therefore, Y2O3:Eu@MF was carried out at pH 8 in the water environment in order to optimize the coating ability of the Y2O3:Eu3+ nanoparticles.
Figure 5 shows the XRD patterns of MF and Y2O3:Eu@MF. MF was observed to be well crystallized, belonging to a phlogopite (JCPDS No. 16-0344) as depicted in Figure 5a,b shows that the enlarged XRD pattern of Y2O3:Eu@MF (10 wt%) is matched well with the cubic structure of Y2O3 (JCPDS No. 76-0151) along with a phlogopite Mica structure.
Figure 6 shows the photoluminescence (PL) spectra of the Y2O3:Eu@MF red phosphor prepared by the variation in the calcination temperature at pH 7 in ethanol and pH 8 in water. The PL measurement range was 400–800 nm and the emission spectrum was fixed and measured at the center wavelength of 254 nm as it is the dominant excitation peak. The emission spectra peak appeared at 560 nm to 635 nm, and the weak peak was also observed at 710 nm. The relative transition of various emission spectra was due to the transition of 5D07FJ (J = 0–4) in relation to the Eu3+ ions. The most intense peak at 611 nm, depicted in Figure 6, could be identified as the transition from the splitting level of 5D07F2 of the Eu3+ ions [24]. As shown in Figure 6a, the emitted red light was very weak and dark. On the other hand, a bright red emission is shown in the inserted photograph in Figure 6b. As a result, the luminescent intensity of Y2O3:Eu@MF, prepared with pH 8 in H2O, was higher than that of the sample prepared in ethanol.

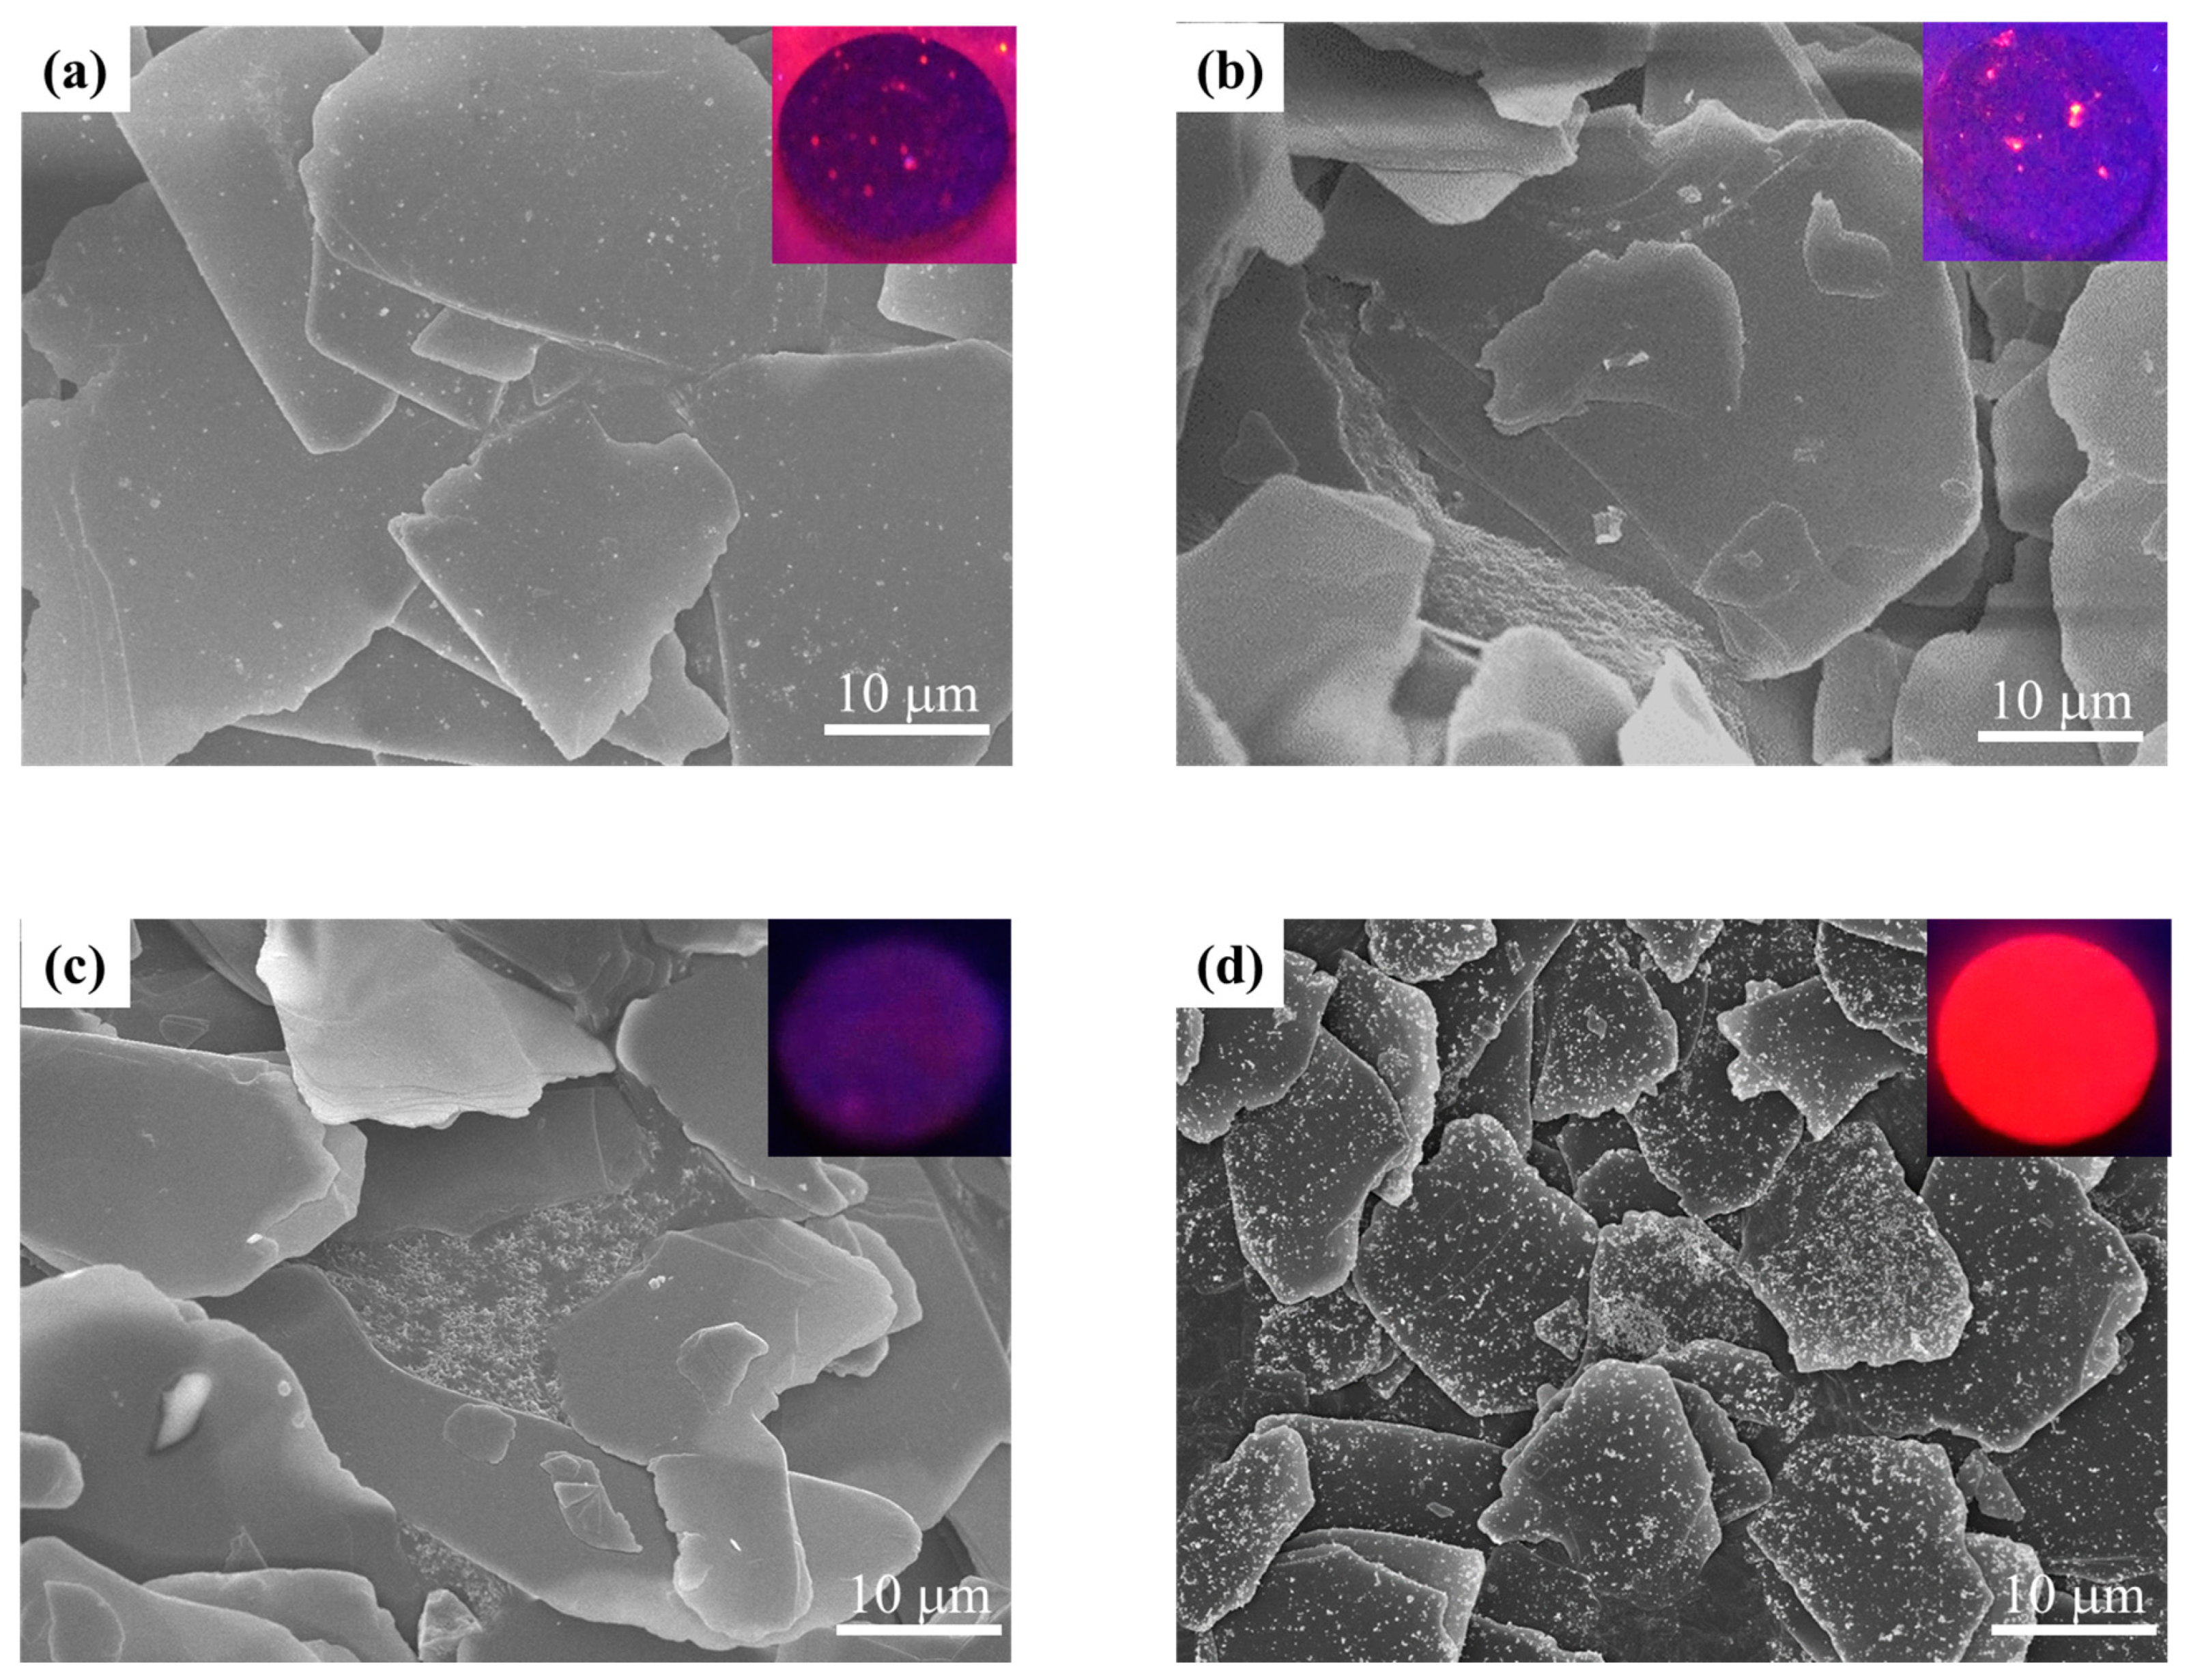
3.2. Y2O3:Eu@MF Prepared by Varying Coating Amount of Y2O3:Eu3+ and Temperatures

The Y2O3:Eu@MF was finally prepared and optimized by varying the loading amount of Y2O3:Eu3+, stirring temperature, and calcination temperature.
Figure 7 shows the FE-SEM images of Y2O3:Eu@MF prepared by 5, 10, and 20 wt% coatings of Y2O3:Eu3+ nanoparticles on mica in water. It can be seen that the Y2O3:Eu3+ nanoparticles having size less than 100 nm were individually coated on the mica flake (MF, 9–45 µm in size). As the coating amount of the nanoparticles was 5 wt% as shown in Figure 7a, the coating coverage of Y2O3:Eu@MF was about 10–20%. The coating coverage was calculated as the ratio of the coated nanoparticles area to the mica surface by the average value after manually mapping several sample images. The coating coverage has been increased with the increasing loading amount of the nanoparticles, as shown in Figure 7b. Herein, the coating coverage of Y2O3:Eu@MF (10 wt%) was about 40–50%. However, as the loading amount exceeded 10 wt%, the coating coverage of the nanoparticles on mica decreased because of the aggregation of the nanoparticles.
In order to investigate the coating property and ability of the stirring and calcination temperatures, Y2O3:Eu@MF was fixed and prepared at pH 8 as depicted in Figure 8 and Figure 9.
Figure 8 shows the FE-SEM images of the Y2O3:Eu@MF prepared with a 20 wt% loading amount of Y2O3:Eu3+ at stirring temperatures of 75, 85, and 95 °C, respectively. As the temperature increased, it was confirmed that the Y2O3:Eu3+ nanoparticles are effectively coated on the surface of MF. After the coating reaction completed in the initial solution at pH 8, the final pH of the resultant solution was slightly higher than pH 8 at 85 °C and 95 °C, but was slightly lower than pH 8 at 75 °C. As can be seen from the zeta potential curve in Figure 3, that the potential difference is larger and the coating property is better at pH 8. As the temperature increases, the ions in the solution move actively; this affects its pH. It is considered that the attractive force of the Y2O3:Eu3+ nanoparticles is strengthened as they get coated on the surface of MF. Especially, the results with a stirring temperature of 95 °C are not significantly different from those of 85 °C; the stirring temperature at 85 °C was considered to be the most suitable.
Figure 9 shows the FE-SEM images of the obtained Y2O3:Eu@MF for different calcination temperatures. Figure 9a clearly shows that the Y2O3:Eu@MF calcined at 650 °C is stably attached on the mica surface. Compared to the samples calcined at 750 °C, Figure 9b, and 850 °C, Figure 9c, it was found that the Y2O3:Eu3+ nanoparticles were detached from the mica surface. This phenomenon occurs due to the different thermal expansions of the Y2O3:Eu3+ nanoparticles and mica.
Figure 10 depicts the PL emission spectra fixed at 254 nm excitation of the Y2O3:Eu@MF powders as red phosphor shown in Figure 9. The emission intensity of the sample calcined at 650 °C was higher than that of the two samples calcined at 750 °C or 850 °C. The brightness of these red-emitted phosphors in the images inserted in Figure 9 is decreased accordingly with the increase in the calcination temperature. This result was considered to be proportional to the coating coverage or the number of Y2O3:Eu3+ nanoparticles coated on mica, and to be detached due to the difference in the coefficient of the thermal expansion between the Y2O3:Eu3+ and mica particles according to the increase in the temperature, as shown in Figure 9. Also, it was confirmed that the luminescent property of the nanoparticles with low crystallinity, caused by milling, increased with the increasing crystallinity of the coated nanoparticles after the calcination process of Y2O3:Eu@MF. Kim group had reported that the luminescent property of Y2O3:Eu3+ nanoparticles was recovered after the calcination process in spite of the decreased crystal structure of the nanoparticles due to the bead-mill process [21].
Figure 11a shows the cross-sectional FE-SEM image of the Y2O3:Eu@MF (10 wt%) particle, fixed in epoxy resin, captured to observe the coating thickness. The powder was mixed with epoxy resin and then dried and prepared to measure its coating thickness. Based on the FE-SEM image, it has been concluded that the MF coated with the Y2O3:Eu3+ nanoparticle was surrounded by epoxy resin. Herein, the bright plate of the top and bottom layer indicates epoxy resin and the dark middle layer consists of MF. The mica flake of the middle layer was coated by Y2O3:Eu3+ nanoparticles of the bright part. However, the coated nanoparticles on MF were observed only on the bottom side due to the covered epoxy plate on the top side. The thickness range of the mica and Y2O3:Eu3+ nanoparticles was about 284 nm, and 80–105 nm, respectively. Multi-elemental EDS mapping images of Y, Si, and Ti are shown in Figure 11a. Apparently, the corresponding Y and Si maps evidenced bright spots corresponding to the Y2O3:Eu red phosphor and mica area, and illustrated the coating layers of these elements in the field of view of the cross-section.
Figure 11b shows the cross-sectional FE-SEM image of the Y2O3:Eu@TMF (20 wt%) particle. The particle consists of the following three layers: the middle layer is the mica flake (MF) having about 314 nm thickness, and the TiO2 layers coated on the MF have about 58 nm thickness, while the outside layers (bright part) coated on TMF are coated with Y2O3 having about 162 nm thickness. For the MF or TMF information, these materials show different thicknesses (300–800 nm) depending on the observing spot. To identify the elements of coating layers, EDS mapping images of Y, Si, and Ti are shown in Figure 11b. The Si element of the mica layer and the Y element of the Y2O3:Eu3+ red phosphor layer were clearly identified, as compared to Figure 11a. The Ti element of the TiO2 layer coated on mica (TMF) is also clearly visible between the mica and the red phosphor layers. Therefore, it is demonstrated that the Y2O3:Eu3+ particles were coated on the TMF particles, as shown in Figure 11b and Figure 12b.

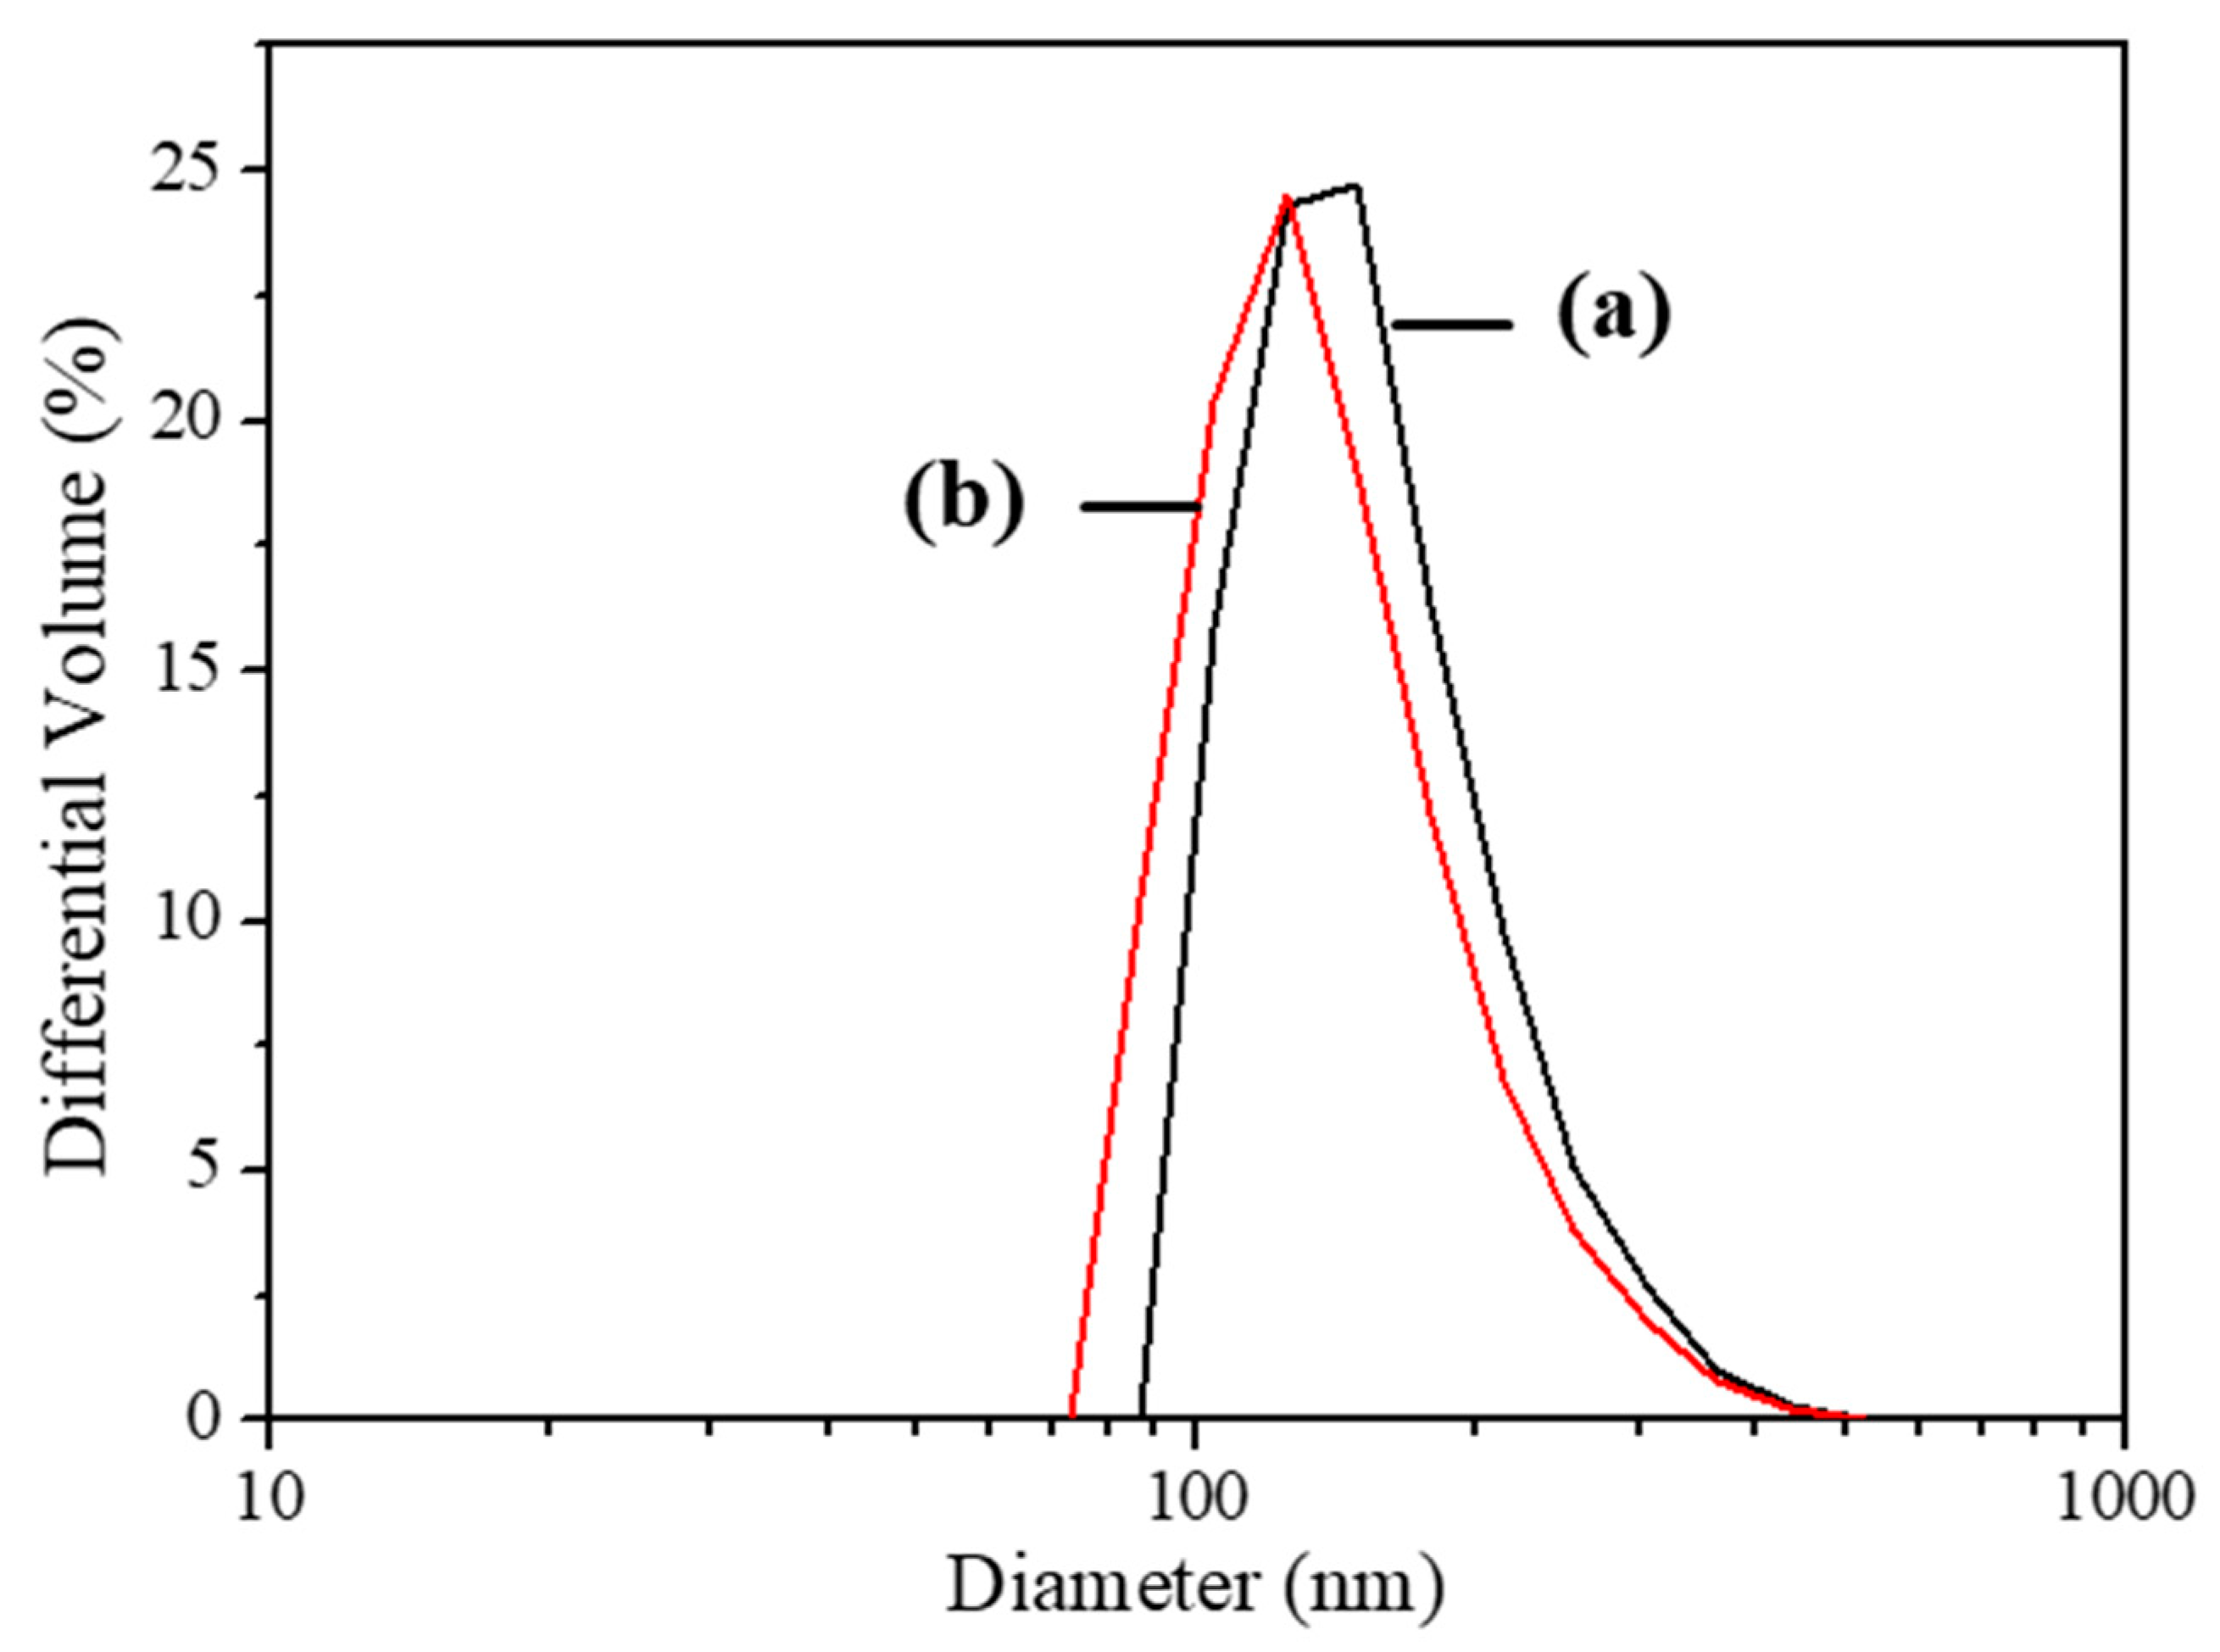
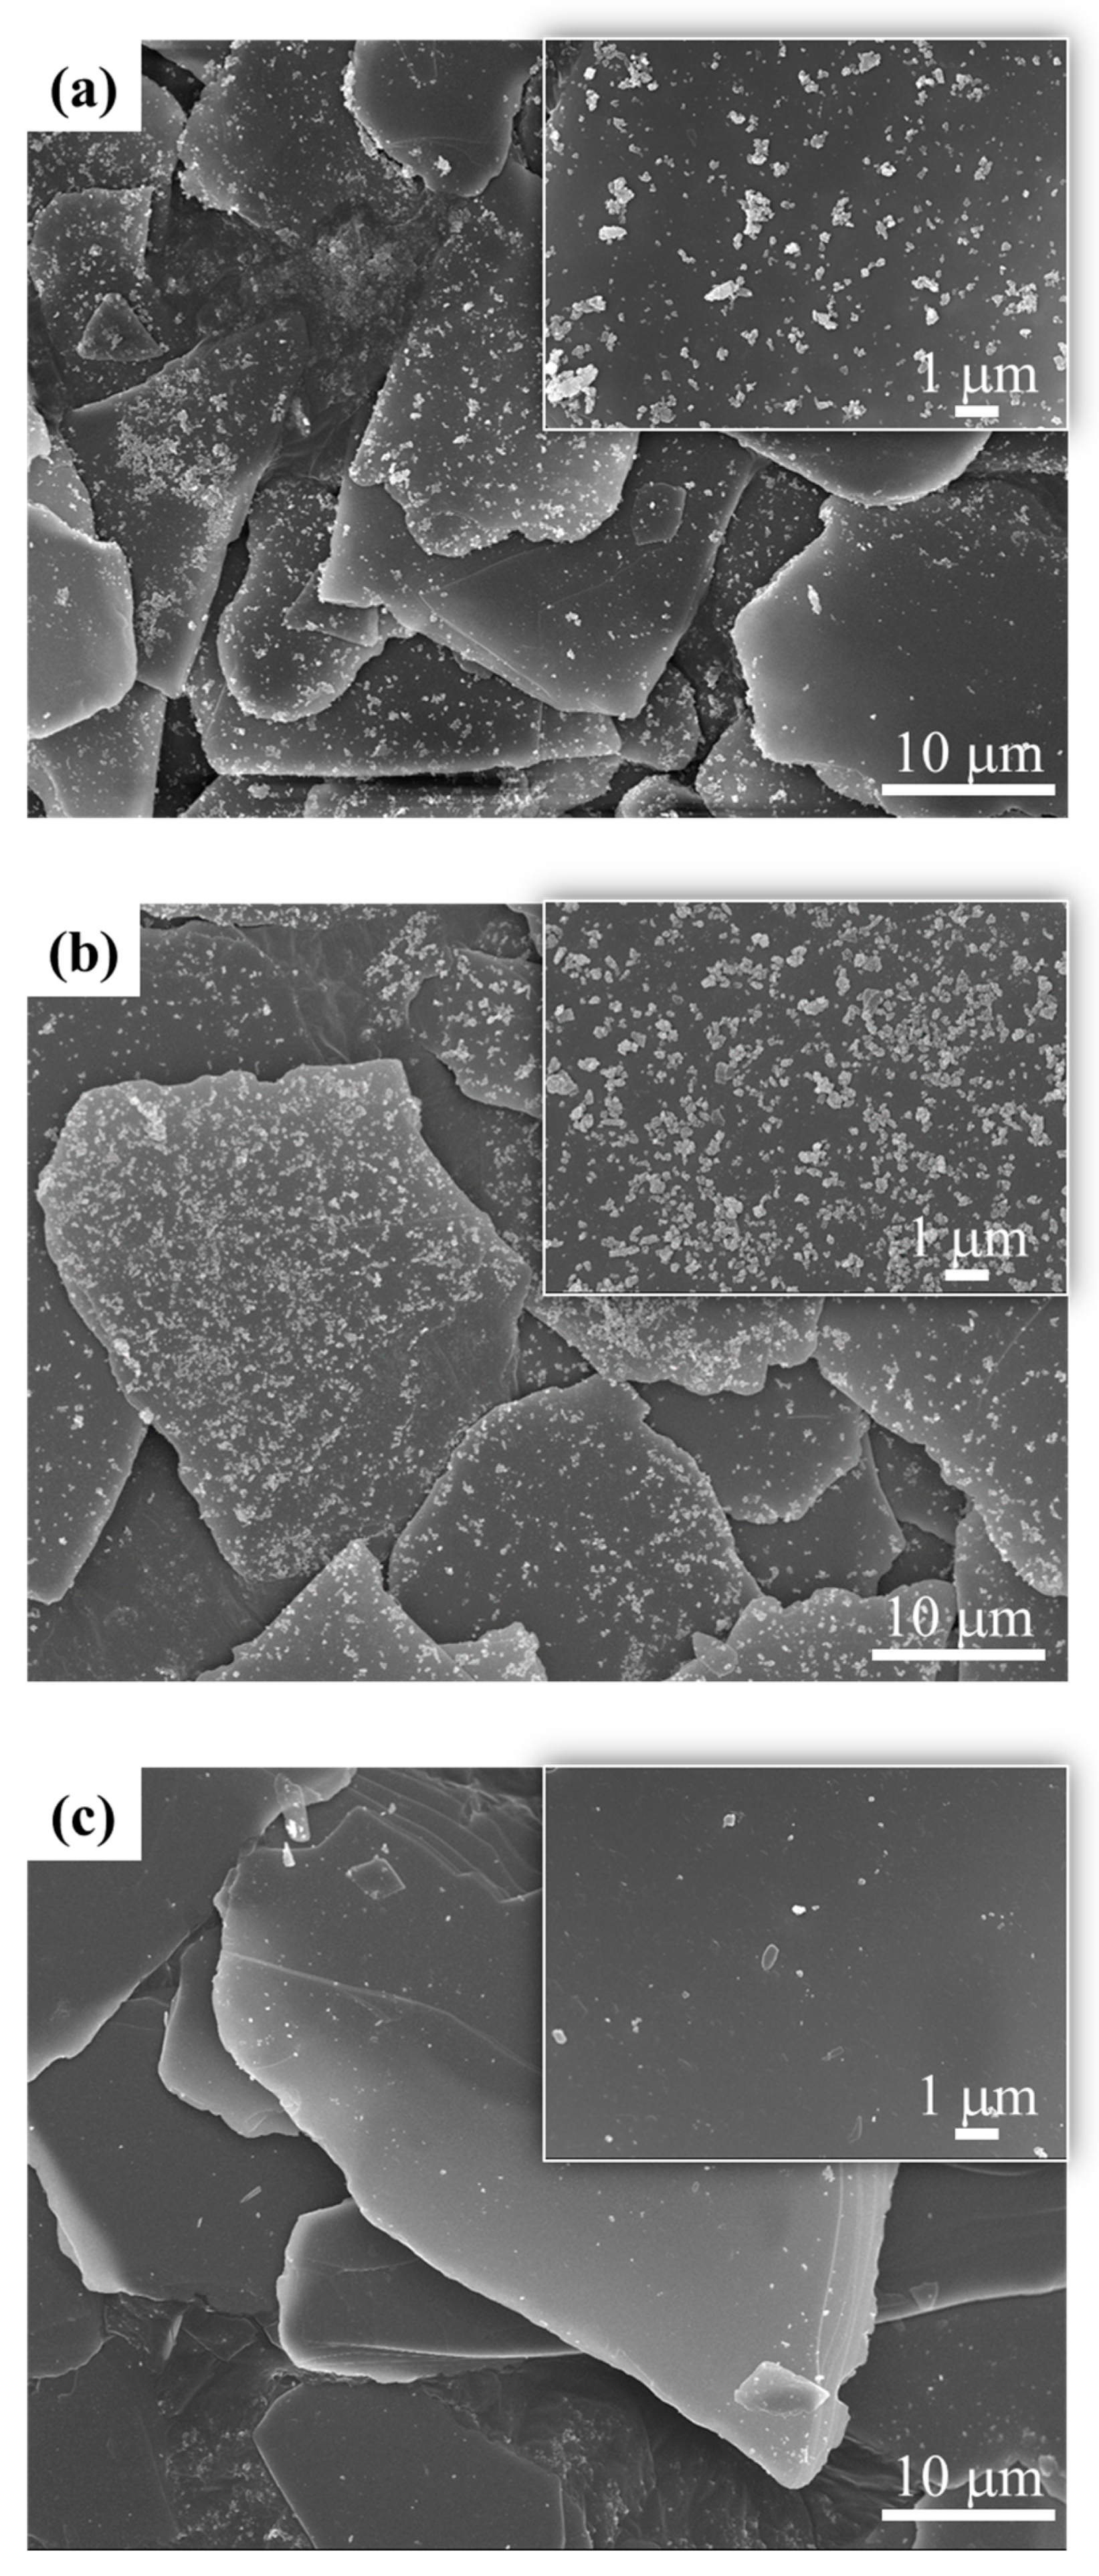
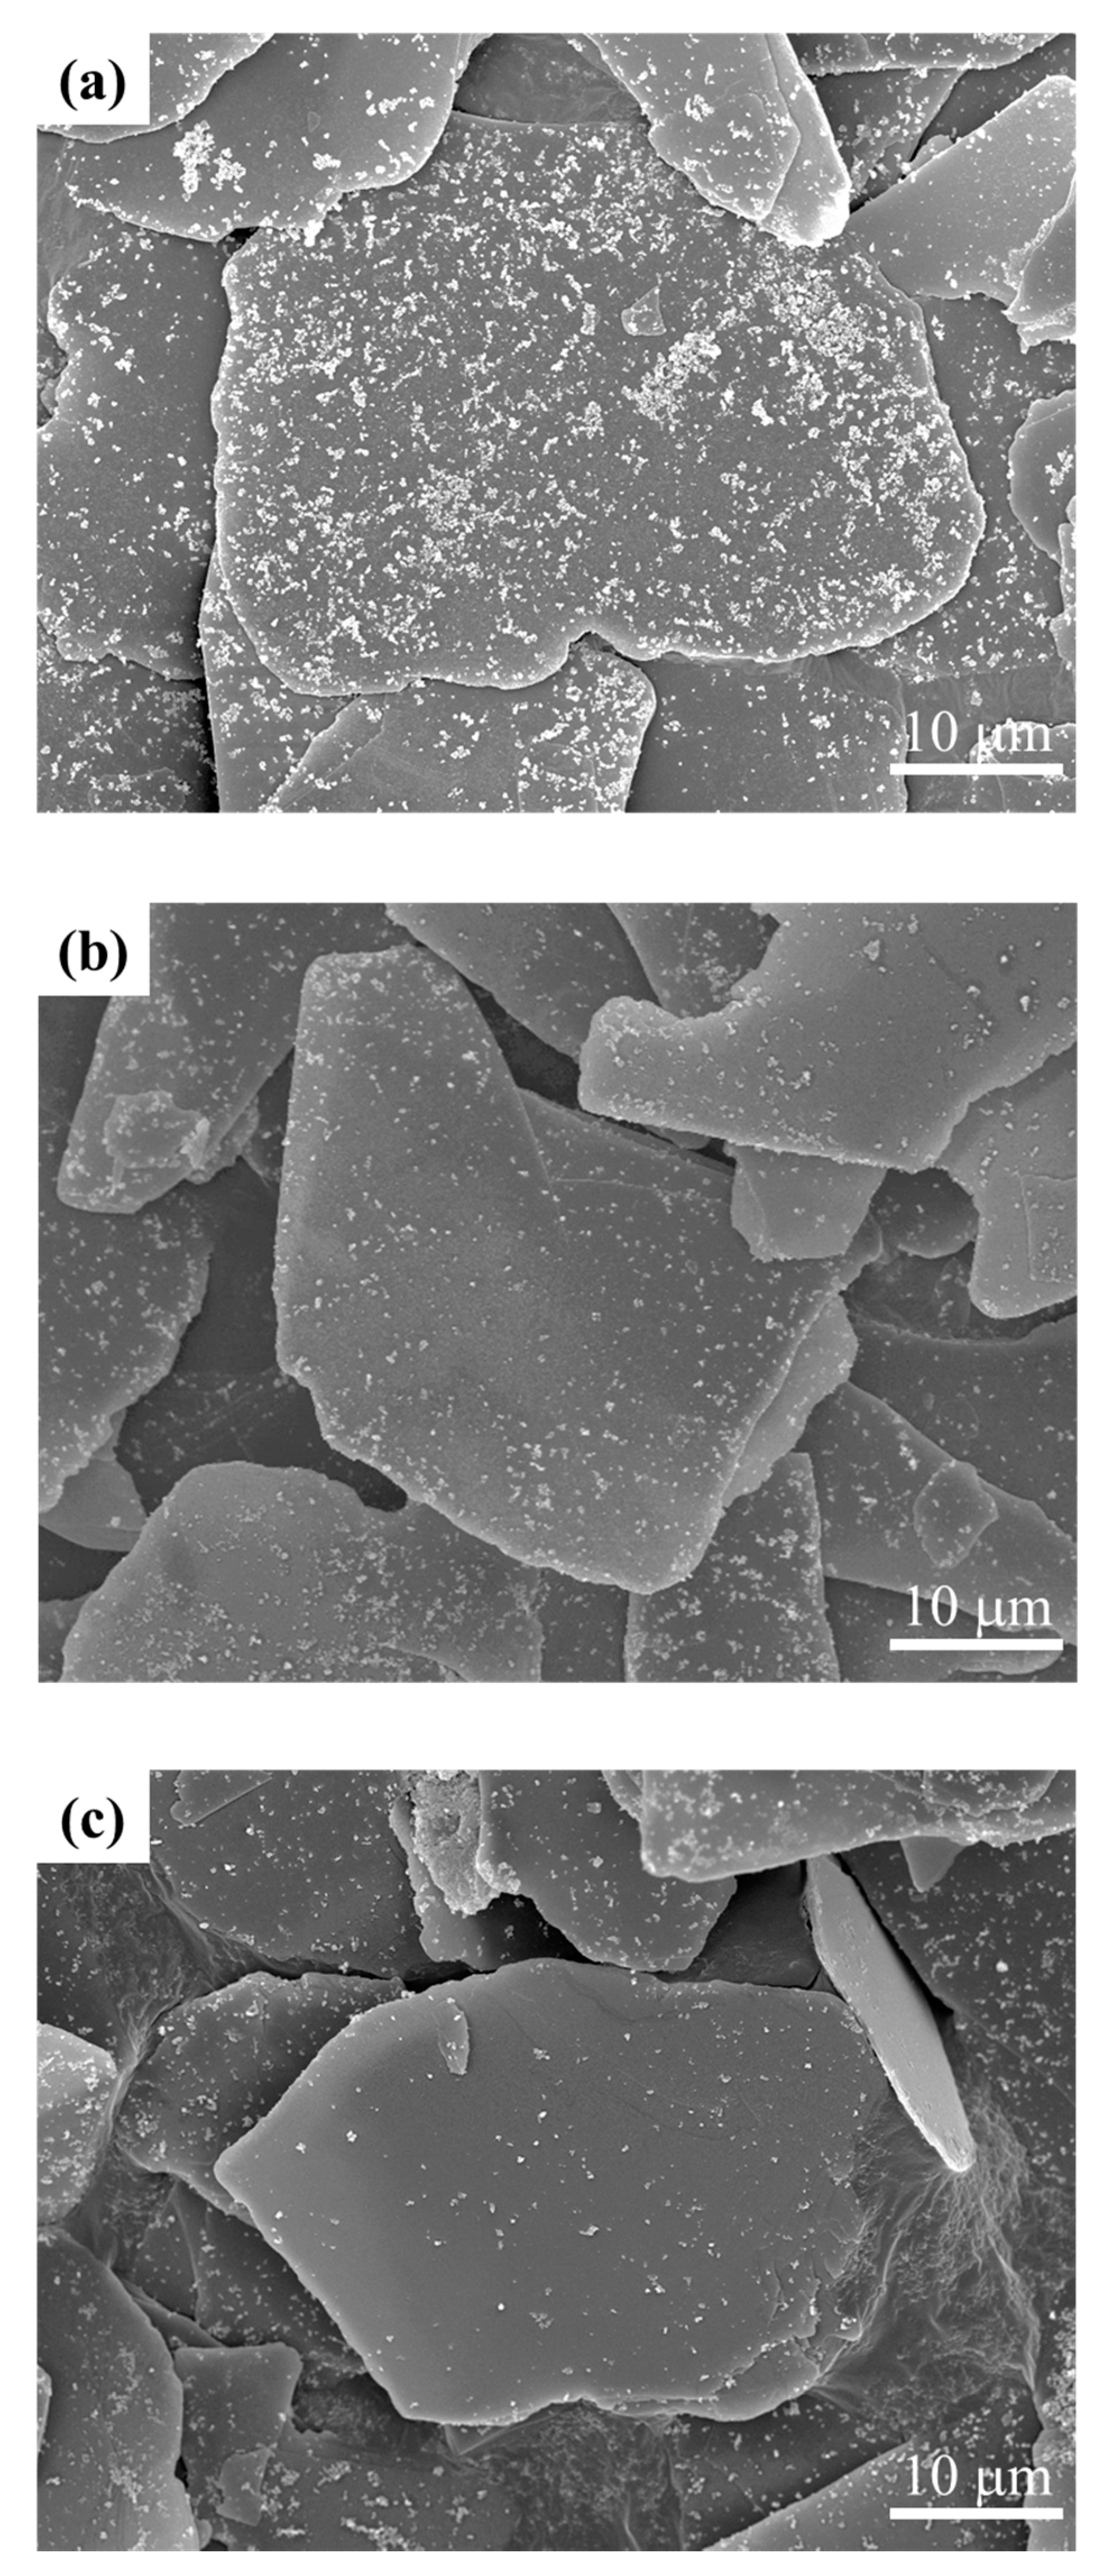
3.3. Preparation of Y2O3:Eu@TMF by Varying Loading Amount of Y2O3:Eu3+

TMF is a two-dimensional material that consists of a mica flake (MF) coated completely with TiO2 nanoparticles having a high refractive index. The pearl property of TMF can be controlled by the TiO2 coating layers. However, we required further experiments with Y2O3:Eu3+ loading amounts due to the wavelength overlaps between the UV absorption of TiO2 and the excitation of Y2O3:Eu3+ red phosphor [25].
Figure 12 shows the FE-SEM images of the Y2O3:Eu@TMF prepared by varying the Y2O3:Eu3+ loading amount from (a) 10, (b) 20, and (c) 30 wt%. In Figure 12a, the coating coverage of Y2O3:Eu@TMF (10 wt%) was about 10–30 %. The coating coverage of Y2O3:Eu@MF (20 wt%) in Figure 12b was about 60–70 %. Herein, the FE-SEM results confirm that the nanoparticles are effectively coated. However, the coating coverage was rapidly decreased at the 30 wt% loading amount of Y2O3:Eu3+ nanoparticles, and the agglomerated nanoparticles separated from TMF were observed as shown in Figure 12c. The cohesive ability between the Y2O3:Eu3+ nanoparticles are superior than that between the nanoparticles and TMF over 20 wt% loading.

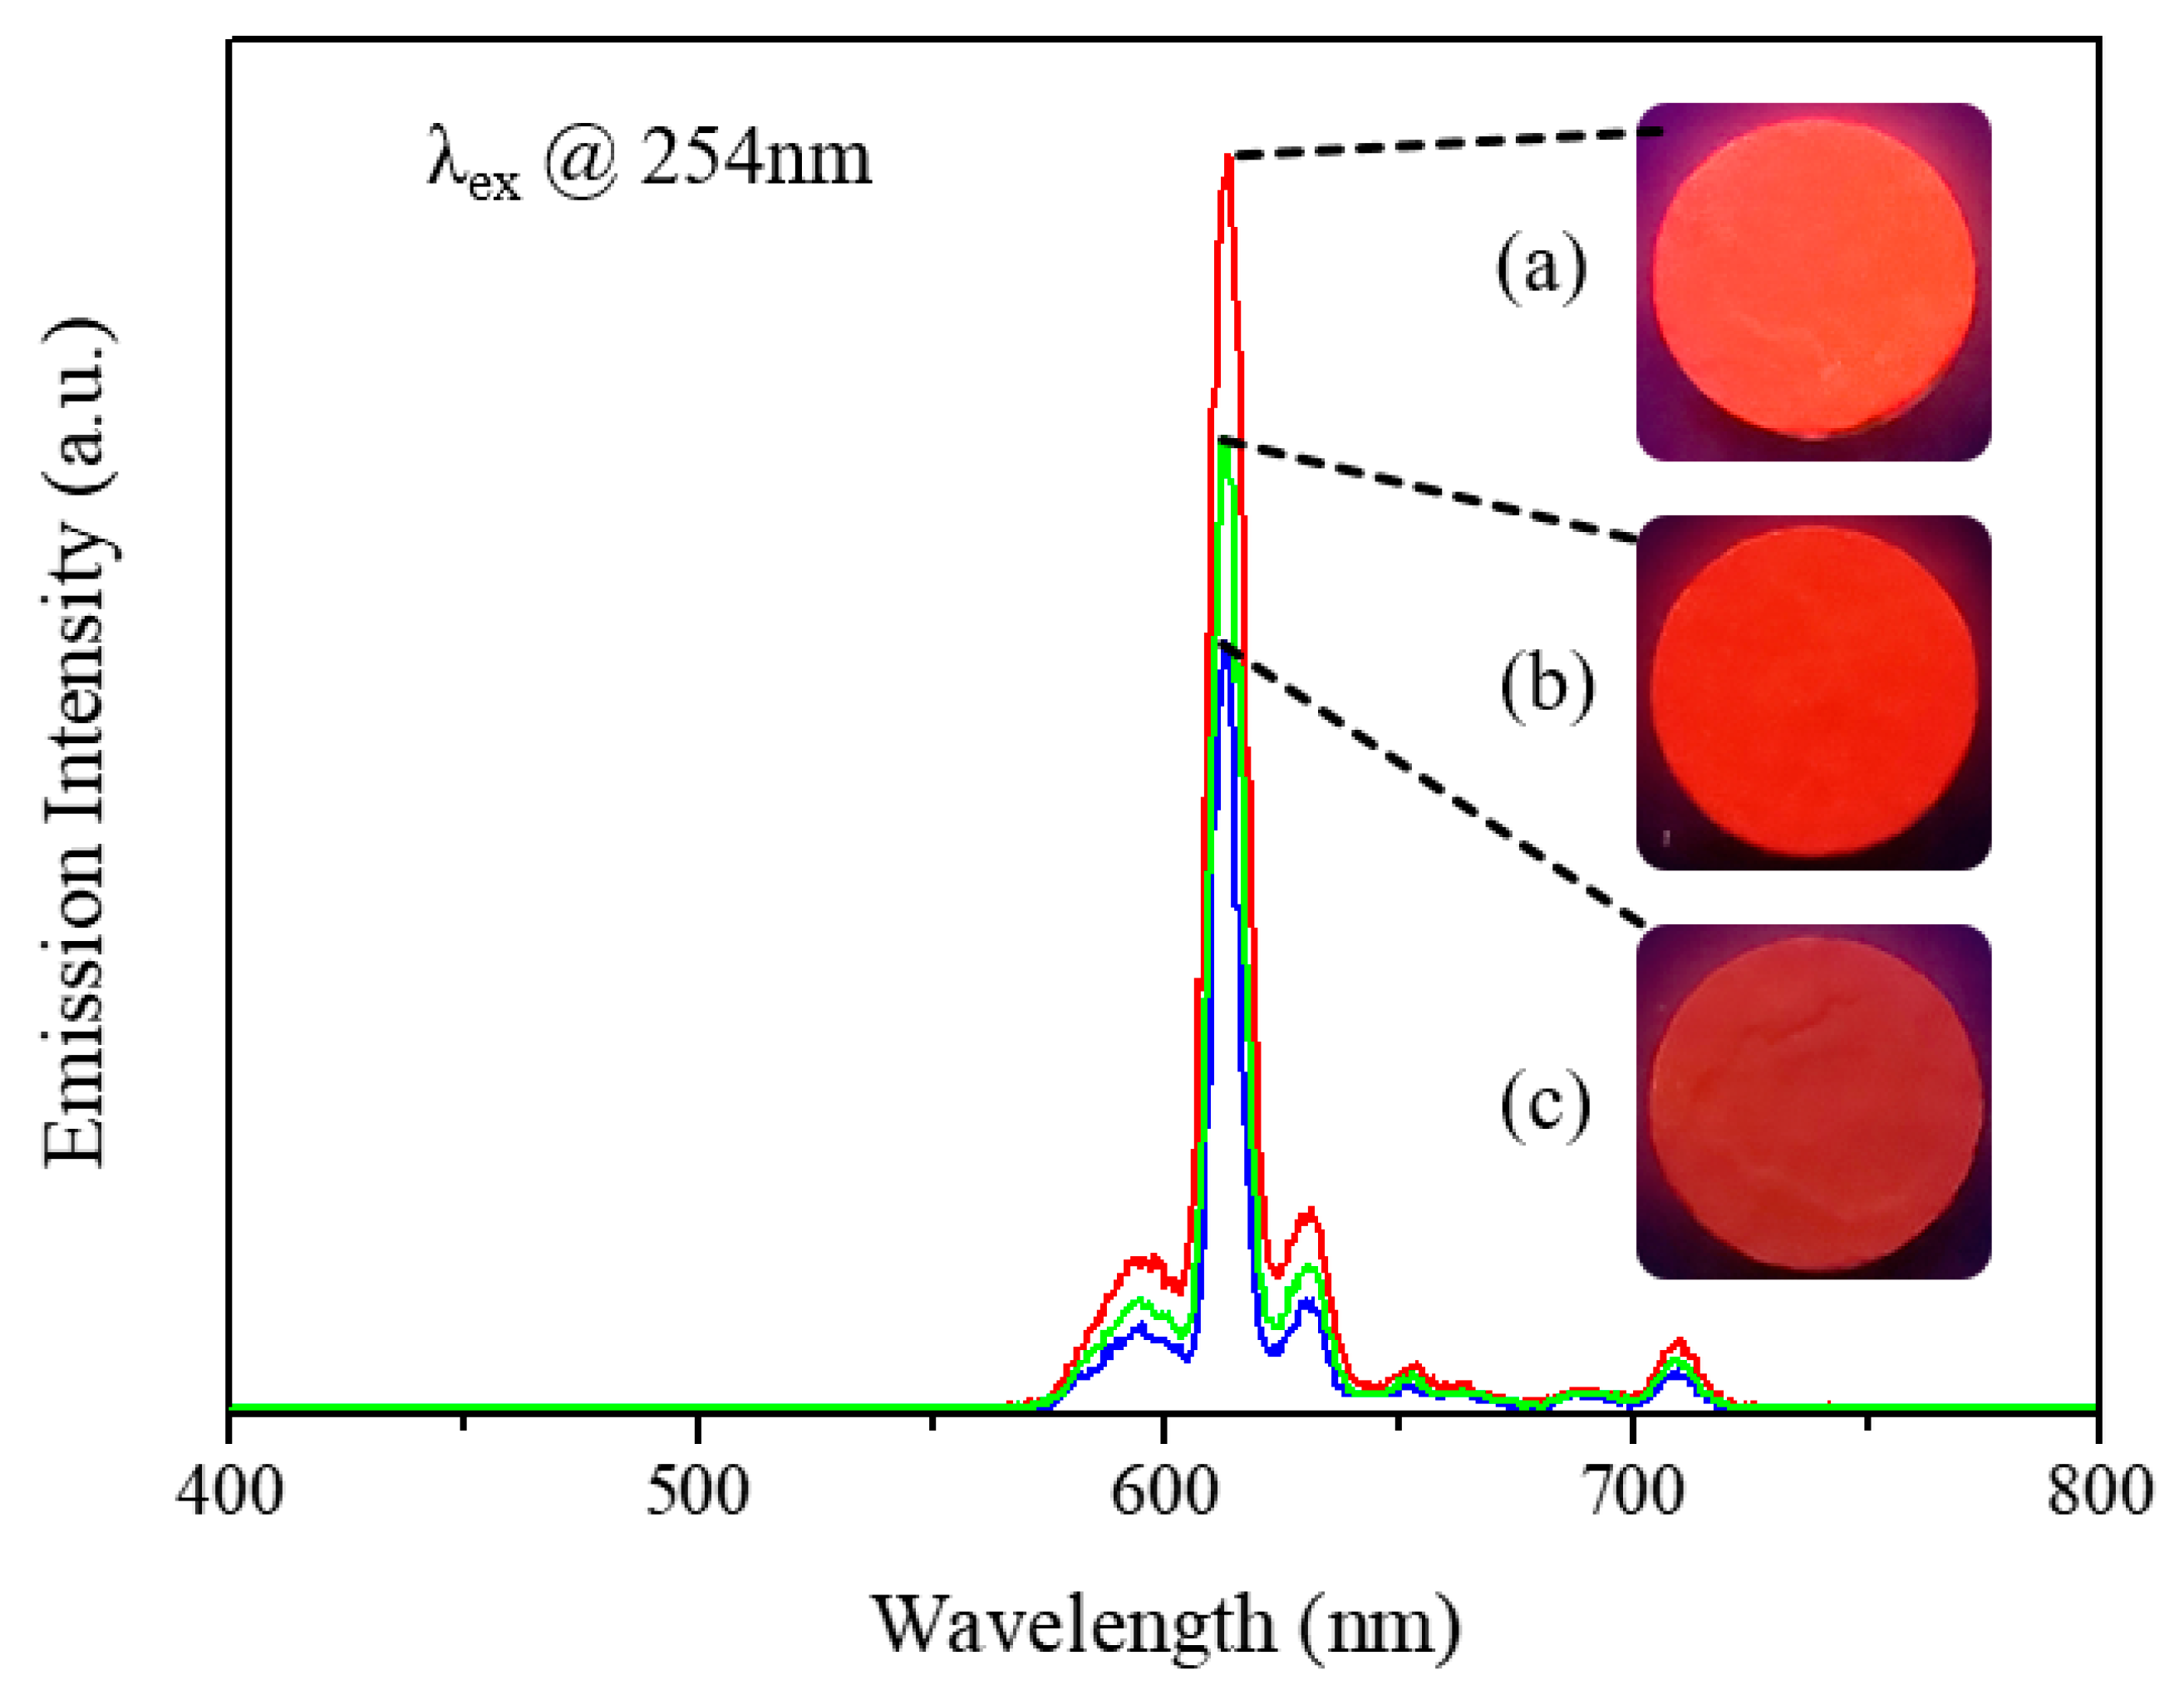
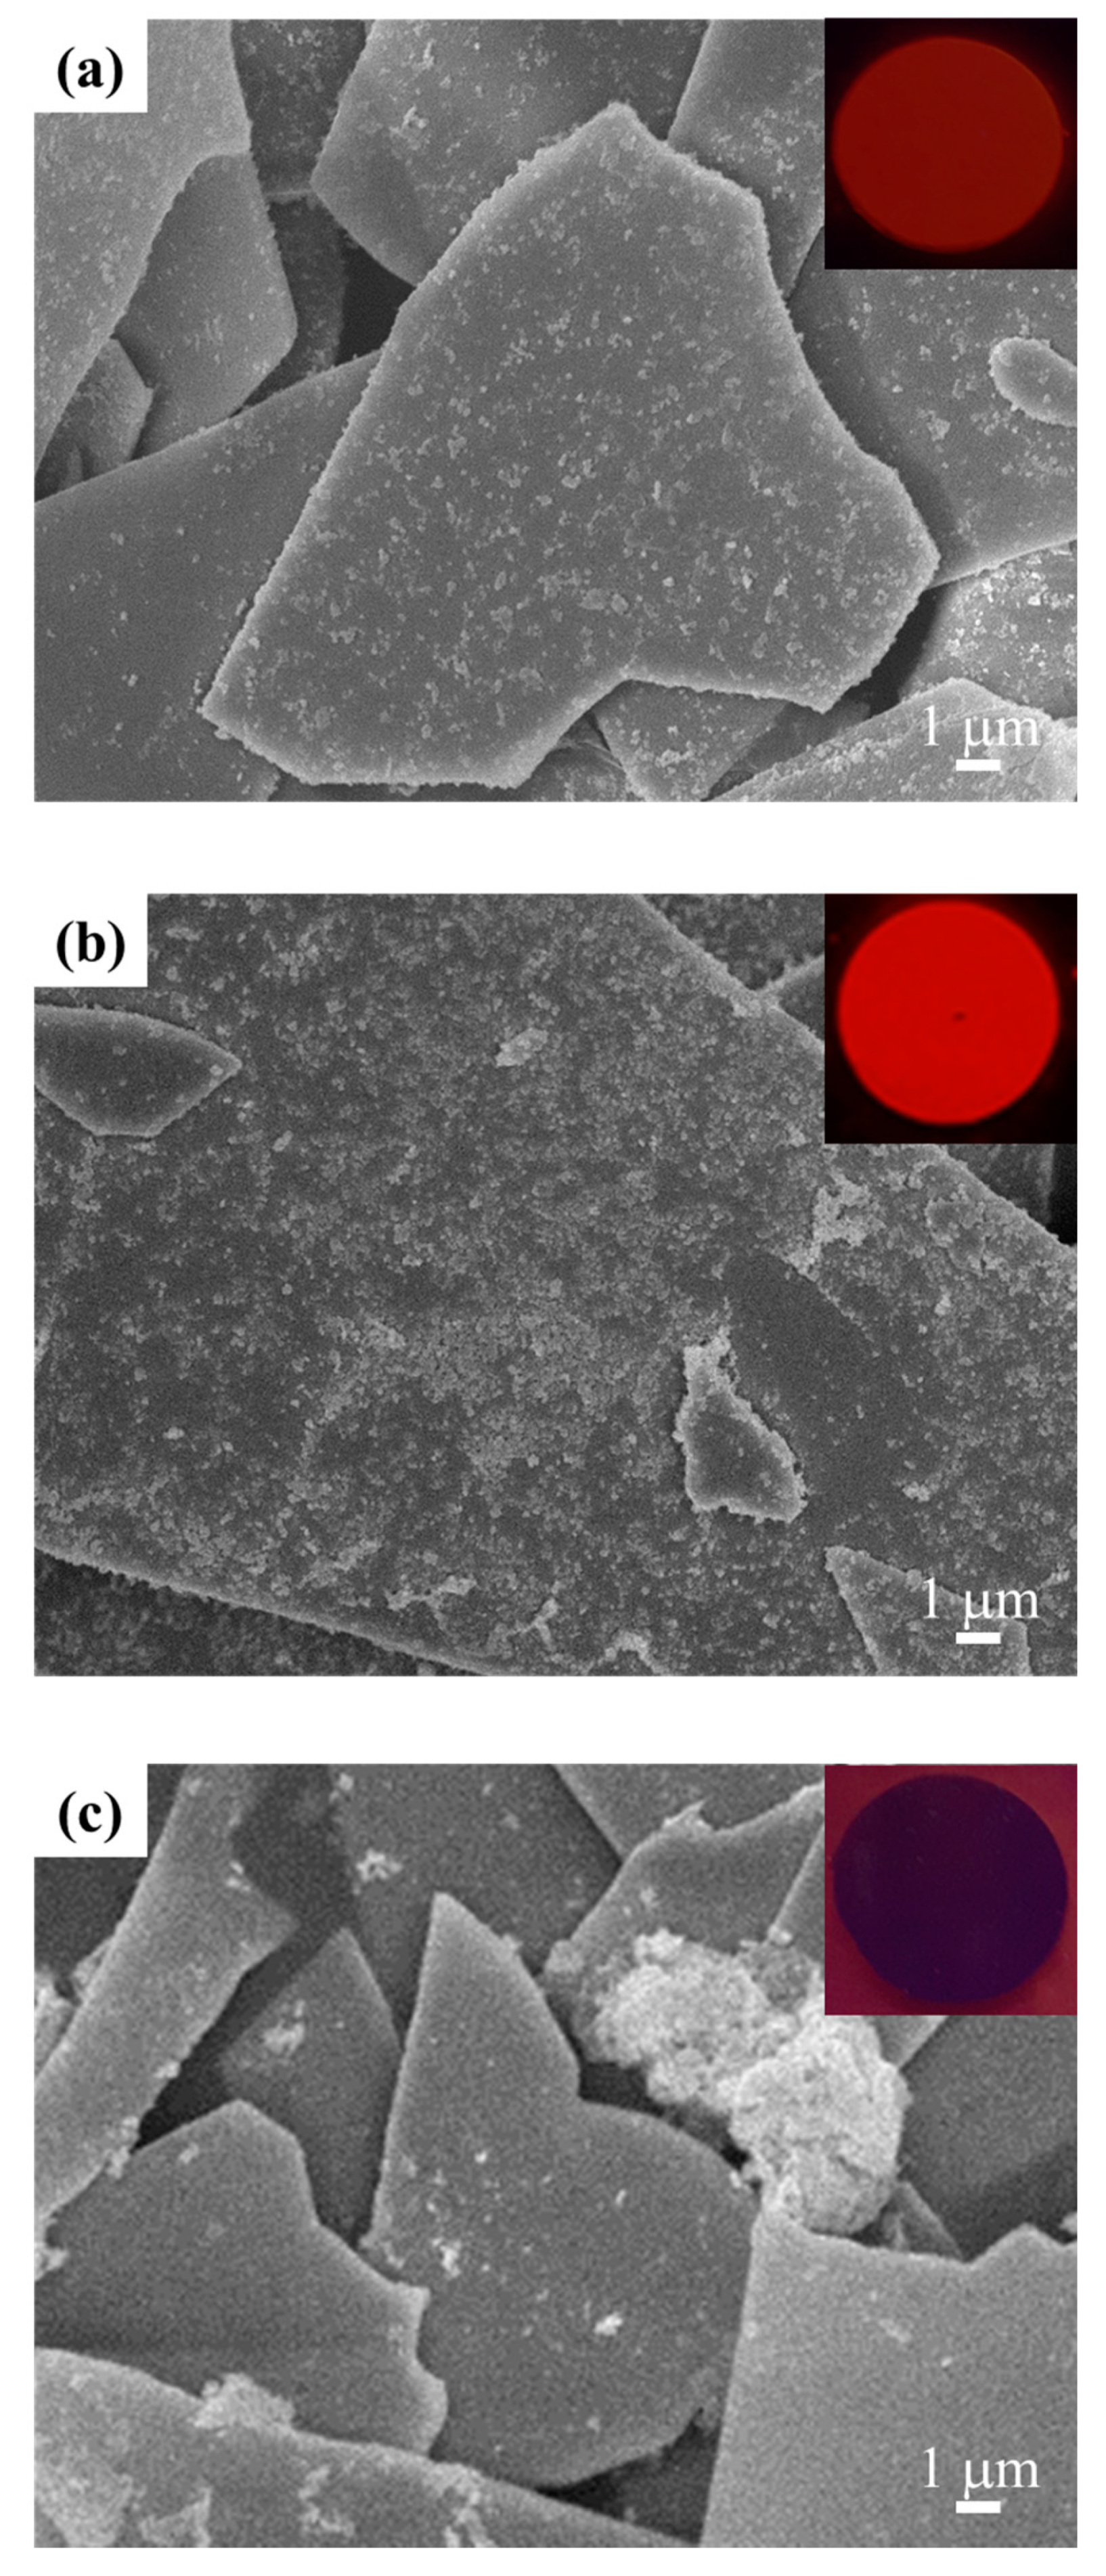
3.4. Gloss and Luminescent Properties of Security Pigment Films

We measured the gloss characteristics of the films, which contain MF, TMF, Y2O3:Eu@MF and Y2O3:Eu@TMF pigments, mixed with epoxy resin to observe their correlation with luminescent properties. Table 2 shows the gloss characteristics of Y2O3:Eu@MF and Y2O3:Eu@TMF. The gloss characteristics of TMF were higher at each angle than MF alone, which is believed to have a greater effect on TiO2. In addition, as the coating coverage of Y2O3:Eu3+ increases, the gloss characteristic decreases, which is thought to be the effect of Y2O3:Eu3+, which has a weak gloss characteristic due to the scattering of the coated particles.
Figure 13a,b display the correlation between the gloss values (85° angle) and the luminescent characteristics (λemmax around 611 nm) of a security pigment according to the variation in Y2O3:Eu3+ amount loaded on MF or TMF. The luminescent property of Y2O3:Eu@MF was overall better than that of Y2O3:Eu@TMF due to the absorption UV of the TiO2 layer coated on the MF surface. However, the gloss property of Y2O3:Eu@TMF, by TMF having the high reflective layer of TiO2 coated on MF, was higher compared with that of Y2O3:Eu@MF. Therefore, we studied to enhance the security level along with optimizing the gloss and luminescent property of Y2O3:Eu@TMF, which was prepared at Y2O3: Eu3+ loading amounts in the range of 15–25 wt%. Figure 13c shows the “KICET” mark printed on a black opacity chart using Y2O3:Eu@MF or Y2O3:Eu@TMF mixed with epoxy resin. One remarkable difference was observed in the mark under natural light. In the natural light, it is found that the gloss properties were stronger on the surface of Y2O3:Eu@TMF than on Y2O3:Eu@MF. On the other hand, the mark showed a red color under the portable UV lamp (λem = 254 nm), and its red luminescent became greater for Y2O3:Eu@MF than Y2O3:Eu@TMF. Given this, it is confirmed that the relation between the gloss and luminescent is coincident with Figure 13a,b and the mark is possible for the application as a security pigment with multi-function.

4. Conclusions

A mica flake (MF) coated with nanosized Y2O3:Eu3+ (Y2O3:Eu@MF) as a red nanophosphor, was prepared by electrostatic interaction of the particles under hydrothermal conditions. Y2O3:Eu@MF was prepared and optimized by varying the solvent, pH, stirring temperature, calcination temperature, and the loading amount of Y2O3:Eu3+. The optimized condition for Y2O3:Eu@MF was an 85 °C stirring temperature, pH 8, 10 wt% of loading amount of the Y2O3:Eu3+ nanoparticle, and a 650 °C calcination temperature. In particular, when the loading amount exceeded 10 wt%, the number of nanoparticles coated on MF was reduced. The reason is due to the aggregation of the nanoparticles rather than the interaction and deposition on the surface of MF. The Y2O3:Eu@MF calcined at 650 °C was also stably attached on the mica surface. It was confirmed that the luminescent property of the nanoparticle with low crystallinity caused by milling was recovered by increasing the crystallinity of the coated nanoparticles after the calcination process of Y2O3:Eu@MF. In the case of Y2O3:Eu@TMF, the material prepared at 20 wt% loading amount of the Y2O3:Eu3+ nanoparticle had the highest coating coverage and was optimized. The photoluminescence spectra revealed the strongest emission peak centered at 611 nm is due to movement of the Eu3+ ions from the 5D07F2. In cross-sectional images of FE-SEM, the thickness of the Y2O3:Eu3+ particles coated on MF or TMF was around 120–270 nm. As a security pigment, the luminescent property of the Y2O3:Eu@MF film was better overall than that of Y2O3:Eu@TMF due to the absorption UV of the TiO2 layer coated on the MF surface. However, the gloss property of the Y2O3:Eu@TMF film, by TMF having the high reflective layer of TiO2 coated on MF, was higher compared with that of Y2O3:Eu@MF. Especially, to improve the security level, the Y2O3:Eu@TMF (20 wt%) film was prepared and optimized with red phosphor materials (having luminescent property) and pearl materials (having gloss property). Therefore, these materials with luminescent and gloss properties prepared in this work potentially meet their applications for security purposes.

Author Contributions

S.-M.B. and M.U. processed the experimental data, performed the analysis. S.-M.B. wrote the manuscript with support from M.C.K., M.U. and D.-S.K., K.Y.J. and K.-J.K. contributed to sample preparation. K.Y.J. performed the measurements and analyzed the spectra. B.-K.C. and D.-S.K. helped supervise the project. B.-K.C. and K.-J.K. conceived the original idea. All authors provided critical feedback and helped shape the research, analysis and manuscript. All authors have read and agreed to the published version of the manuscript.

Funding

This research received no external funding.

Acknowledgments

This work was supported by the Research Fund of Advanced Technology Center (ATC) Project (Project no. 10052088) at Ministry of Trade, Industry and Energy (MOTIE).

Conflicts of Interest

The authors declare no conflict of interest.

References

  1. Wang, C.-N.; Li, Y.; Zhang, W.-P.; Yin, M. Effect of acidity on microstructure and spectroscopic properties of Y2O3:Eu3+ powders and ceramics. Spectrochim. Acta Part A Mol. Biomol. Spectrosc. 2010, 75, 8–13. [Google Scholar] [CrossRef] [PubMed]
  2. Kumar, Y.; Pal, M.; Herrera, M.; Mathew, X. Effect of Eu ion incorporation on the emission behavior of Y2O3 nanophosphors: A detailed study of structural and optical properties. Opt. Mater. 2016, 60, 159–168. [Google Scholar] [CrossRef]
  3. Qin, X.; Zhou, G.; Yang, H.; Yang, Y.; Zhang, J.; Wang, S. Synthesis and upconversion luminescence of monodispersed, submicron-sized Er3+:Y2O3 spherical phosphors. J. Alloys Compd. 2010, 493, 672–677. [Google Scholar] [CrossRef]
  4. Liang, H.; Zheng, Y.; Chen, G.; Wu, L.; Zhang, Z.; Cao, W. Enhancement of upconversion luminescence of Y2O3:Er3+ nanocrystals by codoping Li+–Zn2+. J. Alloys Compd. 2011, 509, 409–413. [Google Scholar] [CrossRef]
  5. Raju, G.S.R.; Pavitra, E.; Nagaraju, G.; Yu, J.S. Versatile properties of CaGd2ZnO5:Eu3+ nanophosphor: Its compatibility for lighting and optical display applications. J. Dalton Trans. 2015, 1790–1799. [Google Scholar] [CrossRef]
  6. Rakov, N.B.; Lozano, W.; Maciel, G.S.; De Araújo, C.B. Nonlinear luminescence in Eu3+-doped Y2O3 powders pumped at 355 nm. Chem. Phys. Lett. 2006, 428, 134–137. [Google Scholar] [CrossRef]
  7. Venkatachalaiah, K.N.; Nagabhushana, H.; Darshan, G.P.; Basavaraj, R.B.; Prasad, B.D. Novel and highly efficient red luminescent sensor based SiO2@Y2O3:Eu3+, M+ (M+ = Li, Na, K) composite core–shell fluorescent markers for latent fingerprint recognition, security ink and solid-state lightning applications. J. Sens. Actuator B-Chem. 2017, 310–325. [Google Scholar] [CrossRef]
  8. Khachatourian, A.M.; Golestani-Fard, F.; Sarpoolaky, H.; Vogt, C.; Vasileva, E.; Mensi, M.; Popov, S.; Toprak, M.S. Microwave synthesis of Y2O3:Eu3+ nanophosphors: A study on the influence of dopant concentration and calcination temperature on structural and photoluminescence properties. J. Lumin. 2016, 169, 1–8. [Google Scholar] [CrossRef]
  9. Li, Q.; Yuan, Y.; Chen, Z.; Jin, X.; Wei, T.-H.; Li, Y.; Qin, Y.; Sun, W. Core–Shell Nanophosphor Architecture: Toward Efficient Energy Transport in Inorganic/Organic Hybrid Solar Cells. ACS Appl. Mater. Interfaces 2014, 6, 12798–12807. [Google Scholar] [CrossRef]
  10. Ye, J.; Hongpeng, Z.; Dingfei, Z. Luminescence Properties of Eu/Tb Activated Y2O3 Phosphors Synthesized by Solid State Process. Rare Met. Mater. Eng. 2016, 45, 2790–2792. [Google Scholar] [CrossRef]
  11. Zambare, A.P.; Murthy, K.V.R. Photoluminescence studies of Eu doped Yttrium based phosphors. Arch. Phy. Res. 2011, 2, 46–50. [Google Scholar]
  12. Jung, K.Y.; Lee, J.C.; Kim, D.S.; Choi, B.-K.; Kang, W.-J. Co-doping effect of monovalent alkali metals on optical properties of CeO2:Eu nanophosphor prepared by spray pyrolysis and application for preparing pearlescent pigments with red emission. J. Lumin. 2017, 192, 1313–1321. [Google Scholar] [CrossRef]
  13. Fisher, M.J.; Wang, W.; Dorhout, P.K.; Fisher, E.R. Synthesis of LaPO4:Eu Nanostructures Using the Sol−Gel Template Method. J. Phys. Chem. C 2008, 112, 1901–1907. [Google Scholar] [CrossRef]
  14. Win, K.Y.; Feng, S.-S. Effects of particle size and surface coating on cellular uptake of polymeric nanoparticles for oral delivery of anticancer drugs. Biomaterials 2005, 26, 2713–2722. [Google Scholar] [CrossRef]
  15. Zhang, X.-T.; Sato, O.; Taguchi, M.; Einaga, Y.; Murakami, T.; Fujishima, A. Self-Cleaning Particle Coating with Antireflection Properties. Chem. Mater. 2005, 17, 696–700. [Google Scholar] [CrossRef]
  16. Ullah, M.; Ban, S.-M.; Kim, D.-S. Optimization of dispersed LaPO4:Tb nanosol and their photoluminescence properties. Opt. Mater. 2019, 97, 109366. [Google Scholar] [CrossRef]
  17. Min, B.H.; Lee, J.C.; Jung, K.Y.; Kim, D.S.; Choi, B.-K.; Kang, W.-J. An aerosol synthesized CeO2:Eu3+/Na+ red nanophosphor with enhanced photoluminescence. RSC Adv. 2016, 6, 81203–81210. [Google Scholar] [CrossRef]
  18. Jung, K.Y.; Han, J.H.; Kim, D.S.; Choi, B.-K.; Kang, W.-J. Aerosol Synthesis of Gd2O3:Eu/Bi Nanophosphor for Preparation of Photofunctional Pearl Pigment as Security Material. J. Korean Ceram. Soc. 2018, 55, 461–472. [Google Scholar] [CrossRef] [Green Version]
  19. Lee, S.J.; You, M.S.; Im, S.H. Formation of uniform TiO2 nanoshell on α-alumina nanoplates for effective metallic luster pigments. Korean J. Chem. Eng. 2016, 33, 2732–2737. [Google Scholar] [CrossRef]
  20. Tohidifar, M.; Taheri-Nassaj, E.; Alizadeh, P. Precursor content assessment and its influence on the optical interference of a nano-sized mica-hematite pearlescent pigment. Powder Technol. 2010, 204, 194–197. [Google Scholar] [CrossRef]
  21. Lee, H.J.; Ban, S.M.; Jung, K.-Y.; Choi, B.-K.; Kang, K.-J.; Kim, D.S. Nano Dispersion of Aggregated Y2O3:Eu Red Phosphor and Photoluminescent Properties of Its Nanosol. Korean J. Mater. Res. 2017, 27, 100–106. [Google Scholar] [CrossRef]
  22. Mengual, O.; Meunier, G.; Cayre, I.; Puech, K.; Snabre, P. Characterization of instability of concentrated dispersions by a new optical analyser: The TURBISCAN MA 1000. Colloids Surfaces A Physicochem. Eng. Asp. 1999, 111–123. [Google Scholar] [CrossRef]
  23. Zuend, A.; Marcolli, C.; Booth, A.M.; Lienhard, D.M.; Soonsin, V.; Krieger, U.K.; Topping, D.O.; McFiggans, G.; Peter, T.; Seinfeld, J.H. New and extended parameterization of the thermodynamic model AIOMFAC: Calculation of activity coefficients for organic-inorganic mixtures containing carboxyl, hydroxyl, carbonyl, ether, ester, alkenyl, alkyl, and aromatic functional groups. Atmos. Chem. Phys. Discuss. 2011, 11, 9155–9206. [Google Scholar] [CrossRef] [Green Version]
  24. Gupta, B.K.; Haranath, D.; Saini, S.; Singh, V.N.; Shanker, V. Synthesis and characterization of ultra-fine Y2O3:Eu3+ nanophosphors for luminescent security ink applications. Nanotechnology 2010, 21, 055607. [Google Scholar] [CrossRef] [PubMed]
  25. Su, C.Y.; Tang, H.Z.; Zhu, G.D.; Li, C.C.; Lin, C.K. The optical properties and sunscreen application of spherical h-BN-TiO2/mica composite powder. Ceram. Int. 2014, 4691–4696. [Google Scholar] [CrossRef]
Figure 1. Preparation process of Y2O3:Eu3+ red phosphor coated on MF or TMF.
Applsci 11 04365 g001
Figure 2. Median particle size (D50) of Y2O3:Eu3+ nanosol dispersed in (a) ethanol and (b) H2O as solvent.
Applsci 11 04365 g002
Figure 3. Zeta potential curves of (a) mica and (b) Y2O3:Eu3+ as a function of pH.
Applsci 11 04365 g003
Figure 4. FE-SEM images and inserted fluorescent pictures, of the powders exposed under UV lamp, of Y2O3:Eu@MF calcined at 650 °C after coating at (a) pH 7 and (b) pH 8 in ethanol, (c) pH 7, and (d) pH 8 in water.
Applsci 11 04365 g004
Figure 5. Powder XRD patterns of (a) mica flake and (b) Y2O3:Eu@MF (10 wt%).
Applsci 11 04365 g005
Figure 6. Photoluminescence spectra of Y2O3:Eu@mica red phosphor calcined at 650 °C after coating at (a) pH 7 in ethanol, and (b) at pH 8 in water.
Applsci 11 04365 g006
Figure 7. FE-SEM images of Y2O3:Eu@MF prepared by the variation in Y2O3:Eu3+ loading amount, (a) 5 wt%; (b) 10 wt%; and (c) 20 wt% (fixed at pH 8 under 85 °C in H2O).
Applsci 11 04365 g007
Figure 8. FE-SEM images of Y2O3:Eu@MF prepared by the variation in stirring temperature, (a) 75 °C; (b) 85 °C; and (c) 95 °C (fixed at pH 8 in H2O and Y2O3:Eu3+ loading amount 20 wt%).
Applsci 11 04365 g008
Figure 9. FE-SEM images of Y2O3:Eu@MF prepared at the following calcination temperatures: (a) 650 °C, (b) 750 °C, and (c) 850 °C, with the synthetic condition in Figure 8b.
Applsci 11 04365 g009
Figure 10. Photoluminescence spectra of Y2O3:Eu@MF red phosphor calcined at (a) 650 °C, (b) 750 °C, and (c) 850 °C in Figure 9.
Applsci 11 04365 g010
Figure 11. Cross-section FE-SEM images and EDS mapping of Y, Si and Ti elements in (a) Y2O3:Eu@MF (10 wt%) and (b) Y2O3:Eu@TMF (20 wt%).
Applsci 11 04365 g011
Figure 12. FE-SEM images and inserted fluorescent pictures, of the powders exposed under UV lamp, of Y2O3:Eu@TMF prepared by the variation in Y2O3:Eu3+ loading amount (a) 10 wt%, (b) 20 wt%, and (c) 30 wt% (fixed at pH 8 and 85 °C in H2O).
Applsci 11 04365 g012
Figure 13. Graph of relationship between gloss at 85° angle and luminescent property of (a) Y2O3:Eu@MF and (b) Y2O3:Eu@TMF, and (c) optical image of the “KICET” mark prepared pearl pigments mixed with epoxy resin under natural light and 254 nm portable UV lamp.
Applsci 11 04365 g013
Table 1. Coating conditions of Y2O3:Eu@MF and Y2O3:Eu@TMF red phosphors.
SampleCoating Condition
SolventY2O3:Eu3+ Loaded Amount Based on MF or TMF (wt%)pHStirring
Temperature (°C)
Calcination
Temperature (°C)
Y2O3:Eu@MFEthanol10765650
8
H2O785
8
5
20
1075
95
85750
850
Y2O3:Eu@TMF650
20
30
Table 2. Gloss values according to the variation in angle for the film prepared by MF, TMF, Y2O3:Eu@MF and Y2O3:Eu@TMF security pigments.
Gross of Angle20°60°85°
Sample *
MF4.817.119.3
Y2O3:Eu@MF10 wt% **3.914.815.6
20 wt%4.516.318.2
TMF17.858.362.9
Y2O3:Eu@TMF10 wt%14.242.651.1
20 wt%10.135.742.4
30 wt%15.355.159.5
* Film prepared by mixing sample and resin. ** Y2O3:Eu3+ loading amount on MF or TMF.
Publisher’s Note: MDPI stays neutral with regard to jurisdictional claims in published maps and institutional affiliations.

