Article

Validation of a TAM Extension in Agriculture: Exploring the Determinants of Acceptance of an e-Learning Platform

by
Ivonne Angelica Castiblanco Jimenez
*,
Laura Cristina Cepeda García
,
Federica Marcolin
,
Maria Grazia Violante
and
Enrico Vezzetti
Department of Management and Production Engineering, Politecnico di Torino, Corso Duca Degli Abruzzi 24, 10129 Torino, Italy
*
Author to whom correspondence should be addressed.
Appl. Sci. 2021, 11(10), 4672; https://doi.org/10.3390/app11104672
Submission received: 30 March 2021 / Revised: 10 May 2021 / Accepted: 18 May 2021 / Published: 20 May 2021
(This article belongs to the Collection The Application and Development of E-learning)

Abstract

:
Supporting education and training initiatives has been identified as an effective way to address Sustainable Development Challenges. In this sense, e-learning stands out as one of the most viable alternatives considering its advantages in terms of resources, time management, and geographical location. Understanding the reasons that move users to adopt these technologies is critical for achieving the desired social objectives. The Technology Acceptance Model (TAM) provides valuable guidelines to identify the variables shaping users’ acceptance of innovations. The present study aims to validate a TAM extension designed for FARMER 4.0, an e-learning application in the agricultural sector. Findings suggest that content quality (CQ) is the primary determinant of farmers’ and agricultural entrepreneurs’ perception of the tool’s usefulness (PU). Furthermore, experience (EXP) and self-efficacy (SE) shape potential users’ perceptions about ease of use (PEOU). This study offers helpful insight into the design and development of e-learning applications in the farming sector and provides empirical evidence of TAM’s validity to assess technology acceptance.

1. Introduction

Sustainable development, defined as the development that satisfies the present generations’ needs without sacrificing the available resources for future generations [1], entails inter-generational equity in social, economic, and environmental spheres. The design of initiatives addressing the three aspects is intricate and challenging [2] and requires the construction of specific scientific and technical capacities, methodologies, and competencies [3].
In an effort to support initiatives working around the Sustainable Development Goals established by the United Nations, the European Union designed and implemented the project Erasmus+ for the period 2014–2021. The Erasmus+ is a renewed effort after more than 25 years of European programs supporting education and training for youth. One of the program’s action lines, “Erasmus+: Grundtvig”, aimed to build an educational and continuous learning environment ideal for further developing European adult people’s talent, based on their current know-how and looking to develop new technical and technological skills. The financed projects aimed to solve some of the socio-economic challenges that European governments are facing and will continue to face during the next decade [4]. One of the initiatives that emerged as a response to the Erasmus+ call for innovation was FARMER 4.0. Rooted in the agricultural sector, FARMER 4.0 is an e-learning tool for farmers and agricultural entrepreneurs.
The e-learning approach adopted by FARMER 4.0 is an innovative alternative to promote the development of new agricultural skills. Supported by the Information and Communication Technologies (ICTs), online education gives access to up-to-date knowledge without affecting users’ daily productive activities [3,5,6,7,8], independently of geographical location [9]. From the perspective of sustainable development, e-learning initiatives should promote and improve continuing education, ensure the acquisition of sustainability-related knowledge and skills, and increase public awareness and understanding of sustainable development and its implications [3]. However, the ultimate value that users will obtain from tools like FARMER 4.0, and the achievement of Sustainable Development Goals will depend on the extent to which the target population effectively uses the technology [10].
Despite the increasing use of information systems (IS) in the agricultural sector [11] and the awareness of the benefits of ICTs applications in farming activities [12], previous works have revealed low acceptance and adoption of these technologies among farmers [13,14,15,16]. For this reason, understanding the aspects that move users to accept or reject these types of technologies is paramount [10].
On the grounds of this situation, the present research objective was to identify the potential factors behind the adoption of the e-learning tool FARMER 4.0. To this end, we conducted an empirical validation of the TAM initially proposed by Davis [17] and assessed the TAM extension developed by Castiblanco Jimenez et al. [18] for the context of the e-learning tool.
The paper starts with a brief description of FARMER 4.0 and the proposed TAM extension to assess farmers’ acceptance. (Section 2). Subsequently, Section 3 presents the stated hypothesis and the instrument used to test them. In Section 4, results obtained after constructs and model validation are displayed. Finally, in Section 5, we summarize the practical implications of findings, and in Section 6, conclusions are reported.

2. Research Background

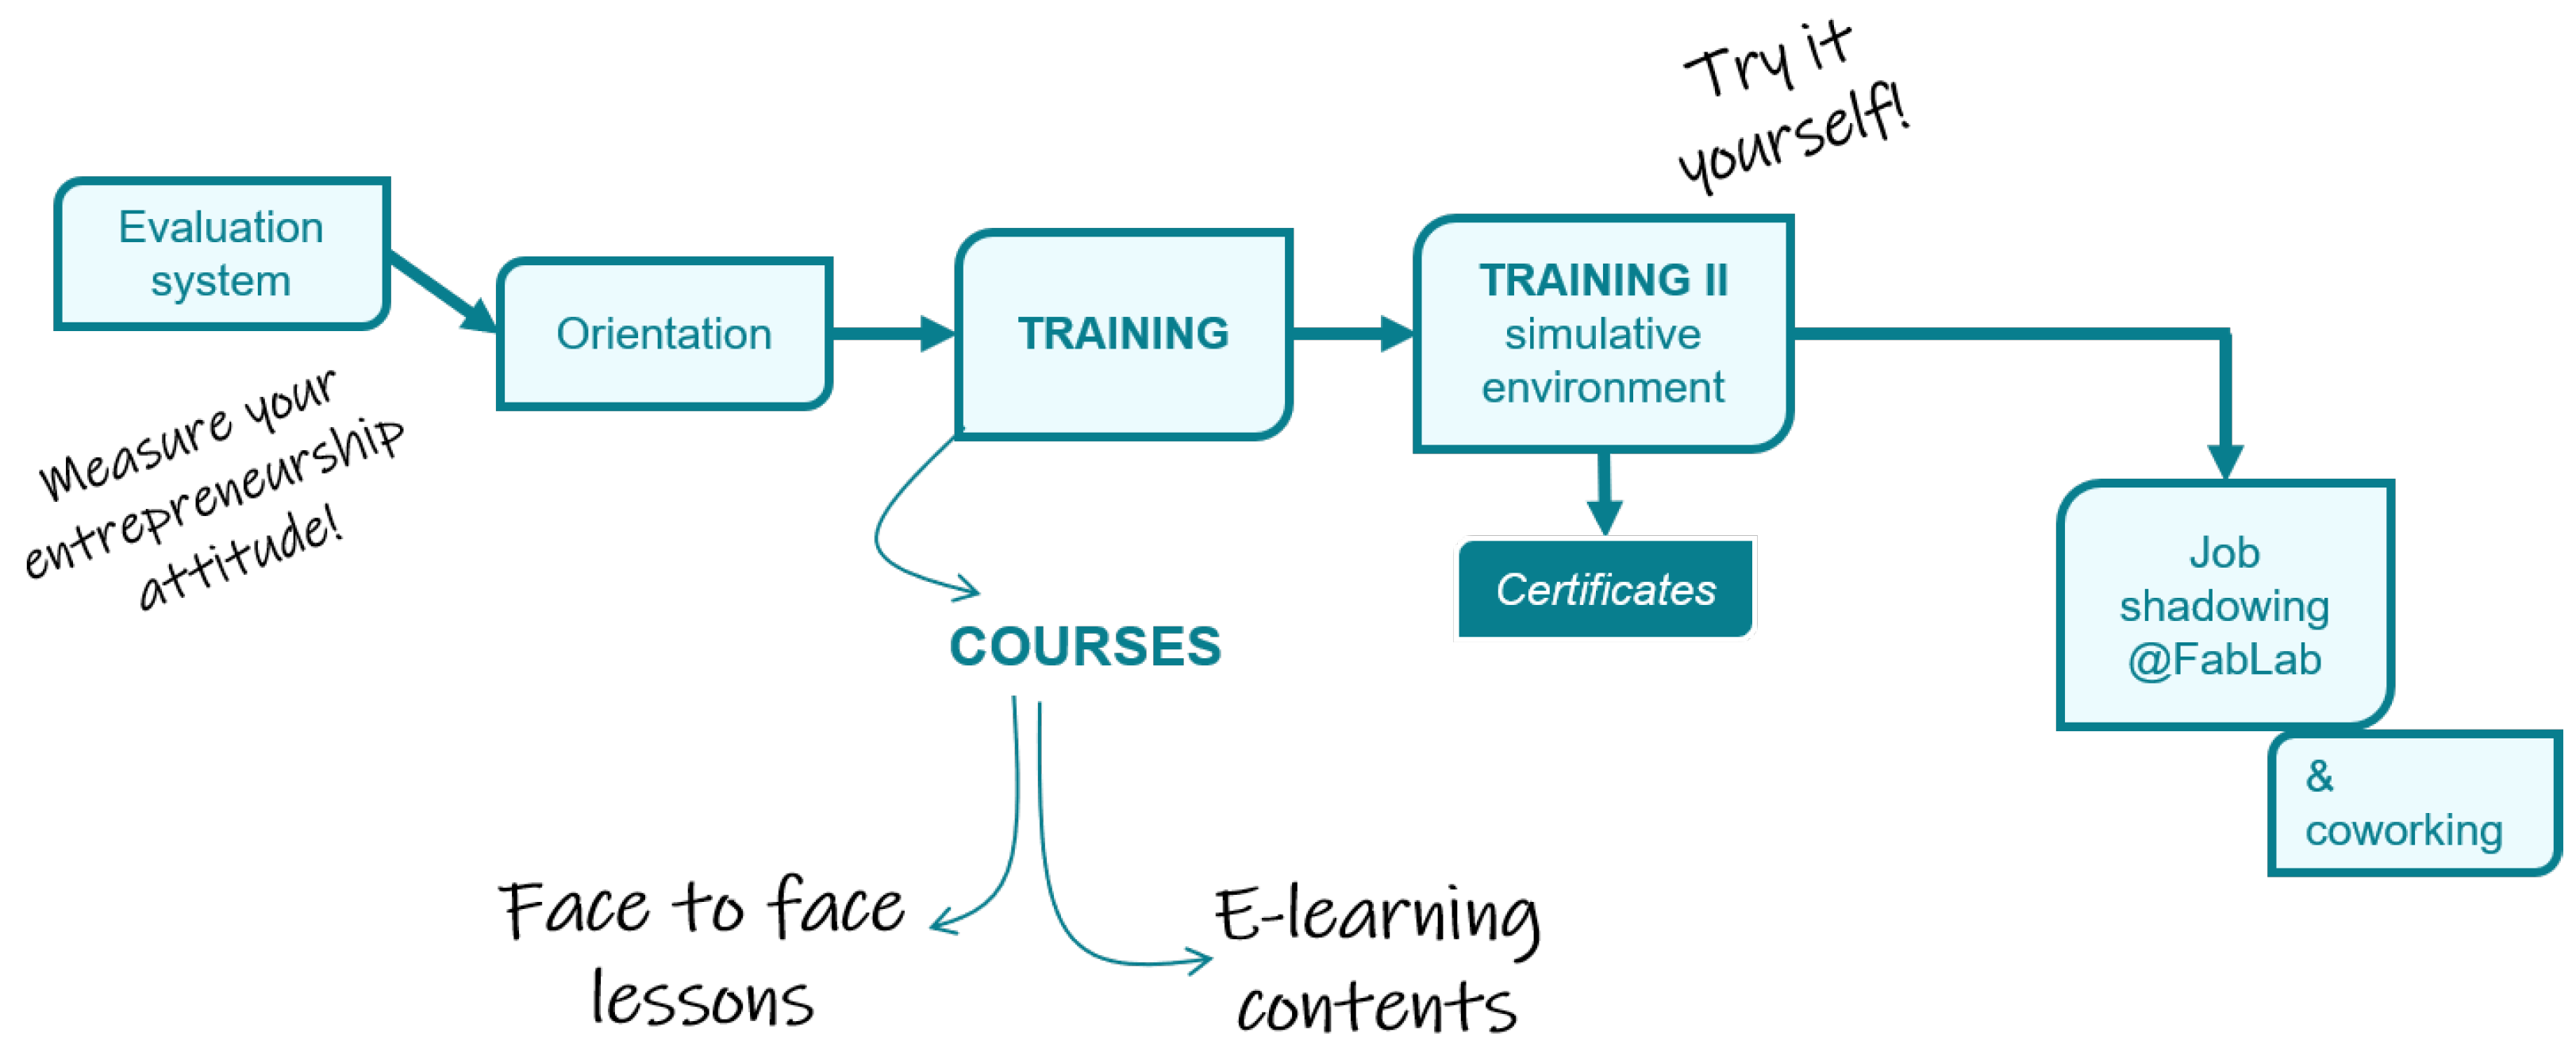
2.1. Context of the Study

The e-learning tool FARMER 4.0-’Farmer teaching and training laboratories’ was designed to help farmers and agricultural entrepreneurs to develop the technological skills they need to succeed in the new digital era. Moreover, the learning model built around the learning system seeks to facilitate the transference of traditional farming skills to protect and strengthen the competitive advantage while facing non-EU markets.
Conscious of the variety of action fields in the farming activities and aware of the technologies shaping the sector’s future, the system proposes an initial assessment of the current knowledge base and then suggests the most convenient learning path (Figure 1). After the initial mapping of the strengths and weaknesses, the training model gives free access to a set of training modules jointly developed through face-to-face interactions and e-learning sessions. The topics covered by the modules include computer-aided technologies, additive Manufacturing—3D Printing, agricultural entrepreneurship, internationalization and sustainability, Social Networking for Global Farm 4.0, and online communication tools and techniques. Experiential learning is also offered throughout virtual environments (3D models in Virtual Reality laboratories), job shadowing, and inter-generational co-working laboratories known as Fab Labs.
Available in five languages, the website (Figure 2) represents a potential facilitator to harness the opportunities offered by modern digital manufacturing technologies helping farmers to create new prototypes, tools, and practices that shape the agricultural sector’s future without sacrificing the local capacities and knowledge but rather reinforcing them.

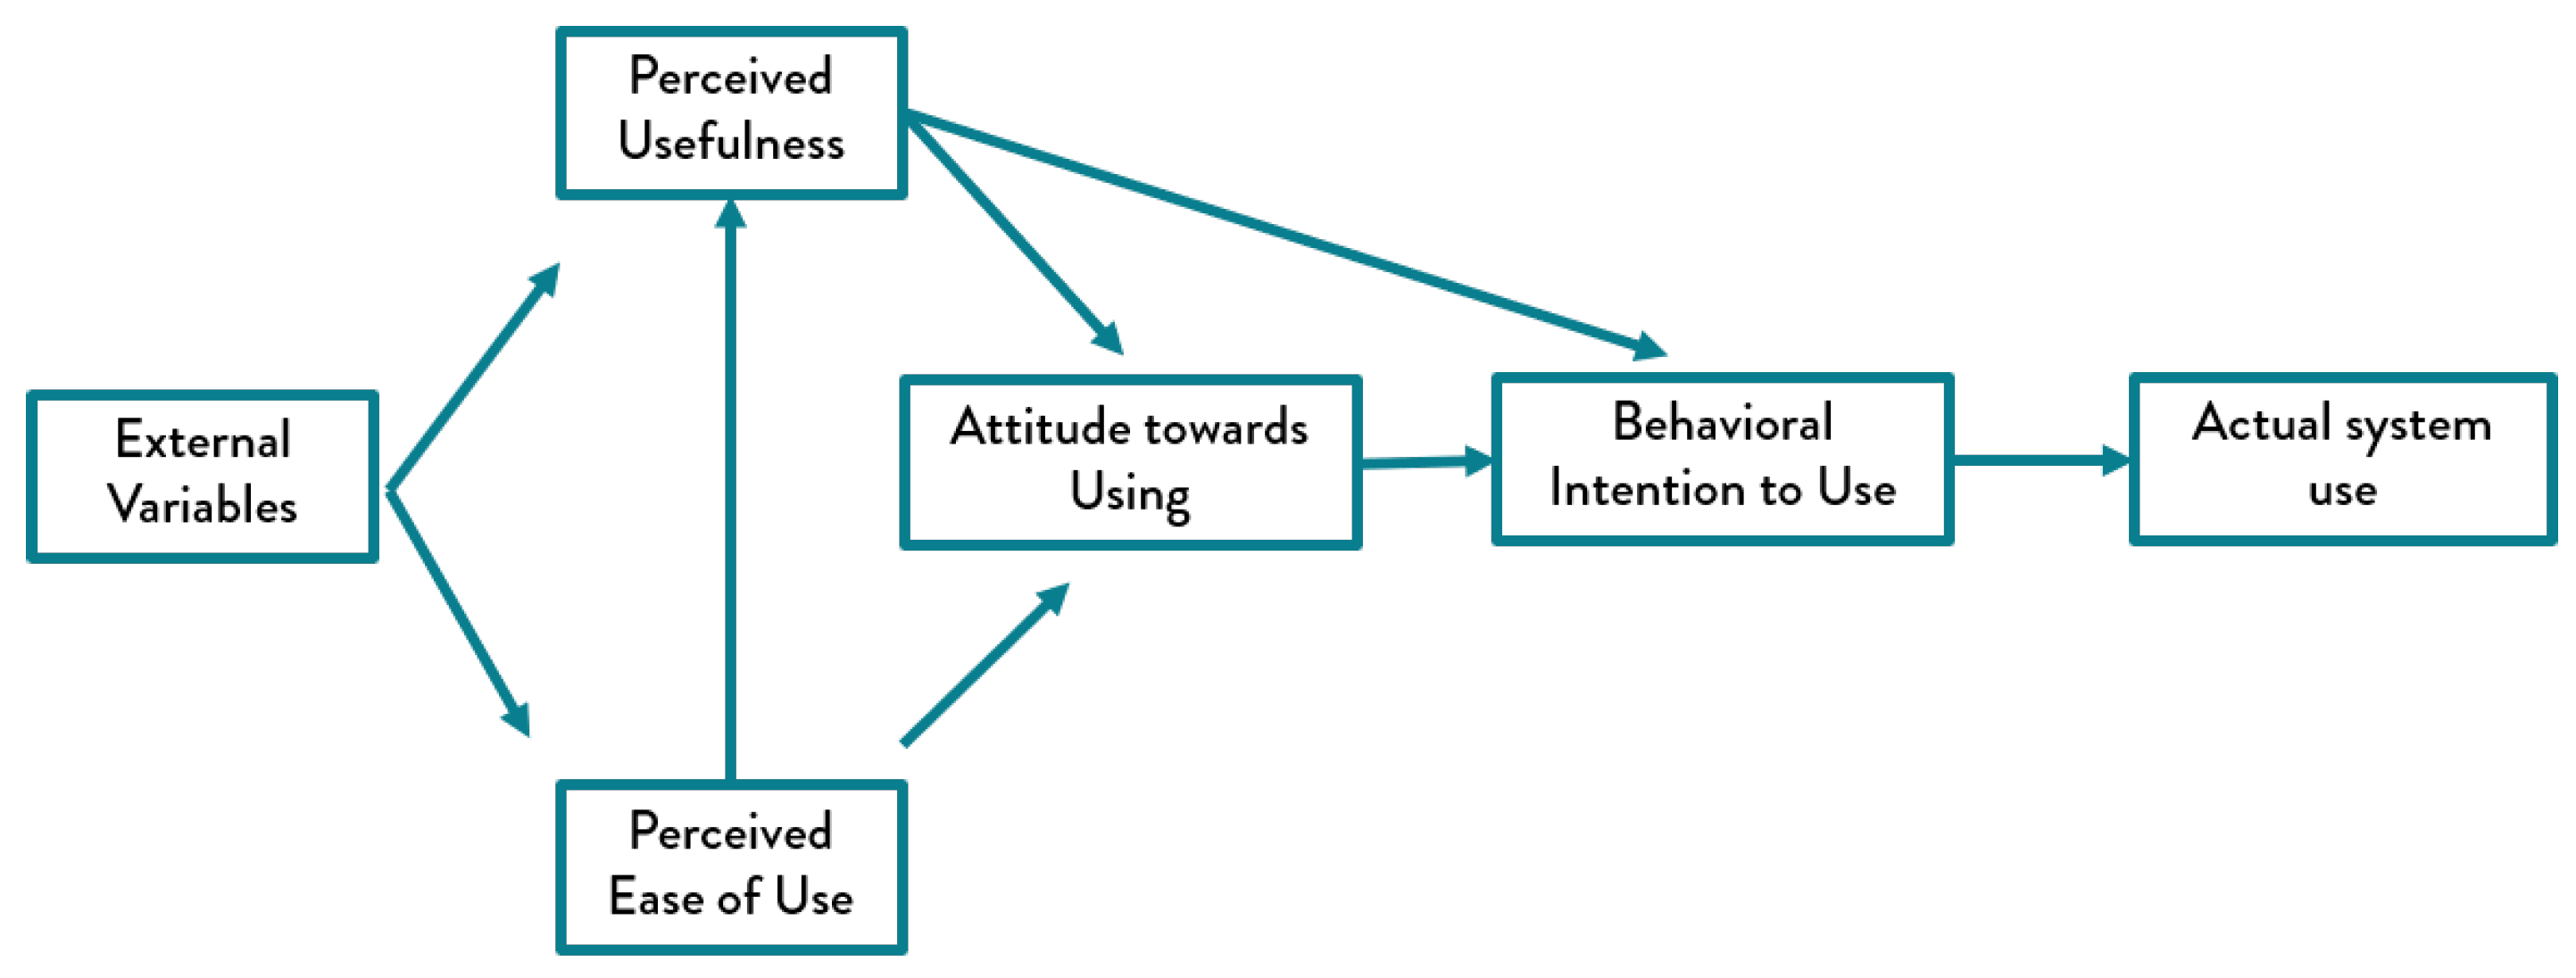
2.2. The Technology Acceptance Model

The adoption of new products and systems is the pinnacle of a successful design process. To increase the likelihood of success, in the last few decades, designers and academics have developed human-centered approaches to better understand what moves users to accept innovation, especially considering the fast pace of development of ICTs and their increasing influence in daily activities [19].
The pioneering theories and frameworks in the literature explaining user’s motivations towards technology use based their hypotheses on the field of psychology [19]. The frameworks that have received more attention from the academic community are the Theory of Reasoned Act (TRA) [20]; the Model of PC Utilization (MPCU) [21], the Technology Acceptance Model (TAM) [17], the Social Cognitive Theory (SCT) [22], the Theory of Planned Behavior (TPB) [23], the Innovation Diffusion Theory (IDT) [24], the Theory of Task-technology fit (TTF) [25], and the Unified Theory of Acceptance and Use of Technology (UTAUT) [26]. Very often, the above-mentioned models and theories borrow elements from previous and complementary frameworks to achieve a better prediction of technology adoption as the Unified Theory of Acceptance and Use of Technology. However, for the assessment of Information Systems acceptance, the most diffused model is the TAM and its subsequent versions [11,27].
The Technology Acceptance Model (TAM) was initially proposed by Davis [17] to explain and predict computer technology adoption. In this model, Davis stated that for technology to be accepted, the performance of a given activity should be superior with the use of the technology than without it, and the value-added should be easy to identify. Furthermore, the second determinant of acceptance was the easiness of use of the technology; the more effortless the use, the higher the chances of using it daily. Those two main determinants, namely perceived usefulness (PU) and perceived ease of use (PEOU), are responsible for the attitude users formed about the convenience of the technology, which in turn shape their intention to adopt it or not. The strength of the intention will determine the final acceptance.
In the initial TAM version, highly influenced by the TRA [20], Davis theorized the existence of a causal relationship between the two main determinants, PU and PEOU, and the Attitude towards use (ATT). The role of Behavioral Intention (BI) was considered in a subsequent TAM version thanks to the contributions of the authors of the TPB. BI was included to represent humans’ rational behavior of using the available information to decide whether to do something or refrain themselves. The first modified version of the TAM is shown in Figure 3.
As TAM research’s body increased, so did the exploration of the social and cognitive processes responsible for PU and PEOU. Subsequent work by Venkatesh and Davis [28] complemented the framework by going further on the analysis of Perceived Usefulness. Their findings suggest that social factors such as social pressure or social norm and image, as well as result-oriented aspects such as job relevance, output quality, and result demonstrability could have an incidence in the perception of usefulness, mediated in some cases for previous experience with similar technologies. This extended model is known as TAM 2. A third general version, TAM 3, was proposed by Venkatesh and Bala [29]. This version posits computer self-efficacy, external control, anxiety, playfulness, perceived enjoyment, and usability, as determinants of PEOU. Moreover, TAM 3 provides theoretical support indicating the mutual independence of factors influencing Perceived Ease of Use and those determining Perceived Usefulness. Thanks to the flexibility of the TAM, several different extensions have been proposed based on the research objectives, context, and the nature of the technology. The validity of the TAM has been confirmed not only in information systems applications but also to assess the adoption of wearable technologies [30], health [31], energy services [32], financial services [33], and e-learning [34], among many others.

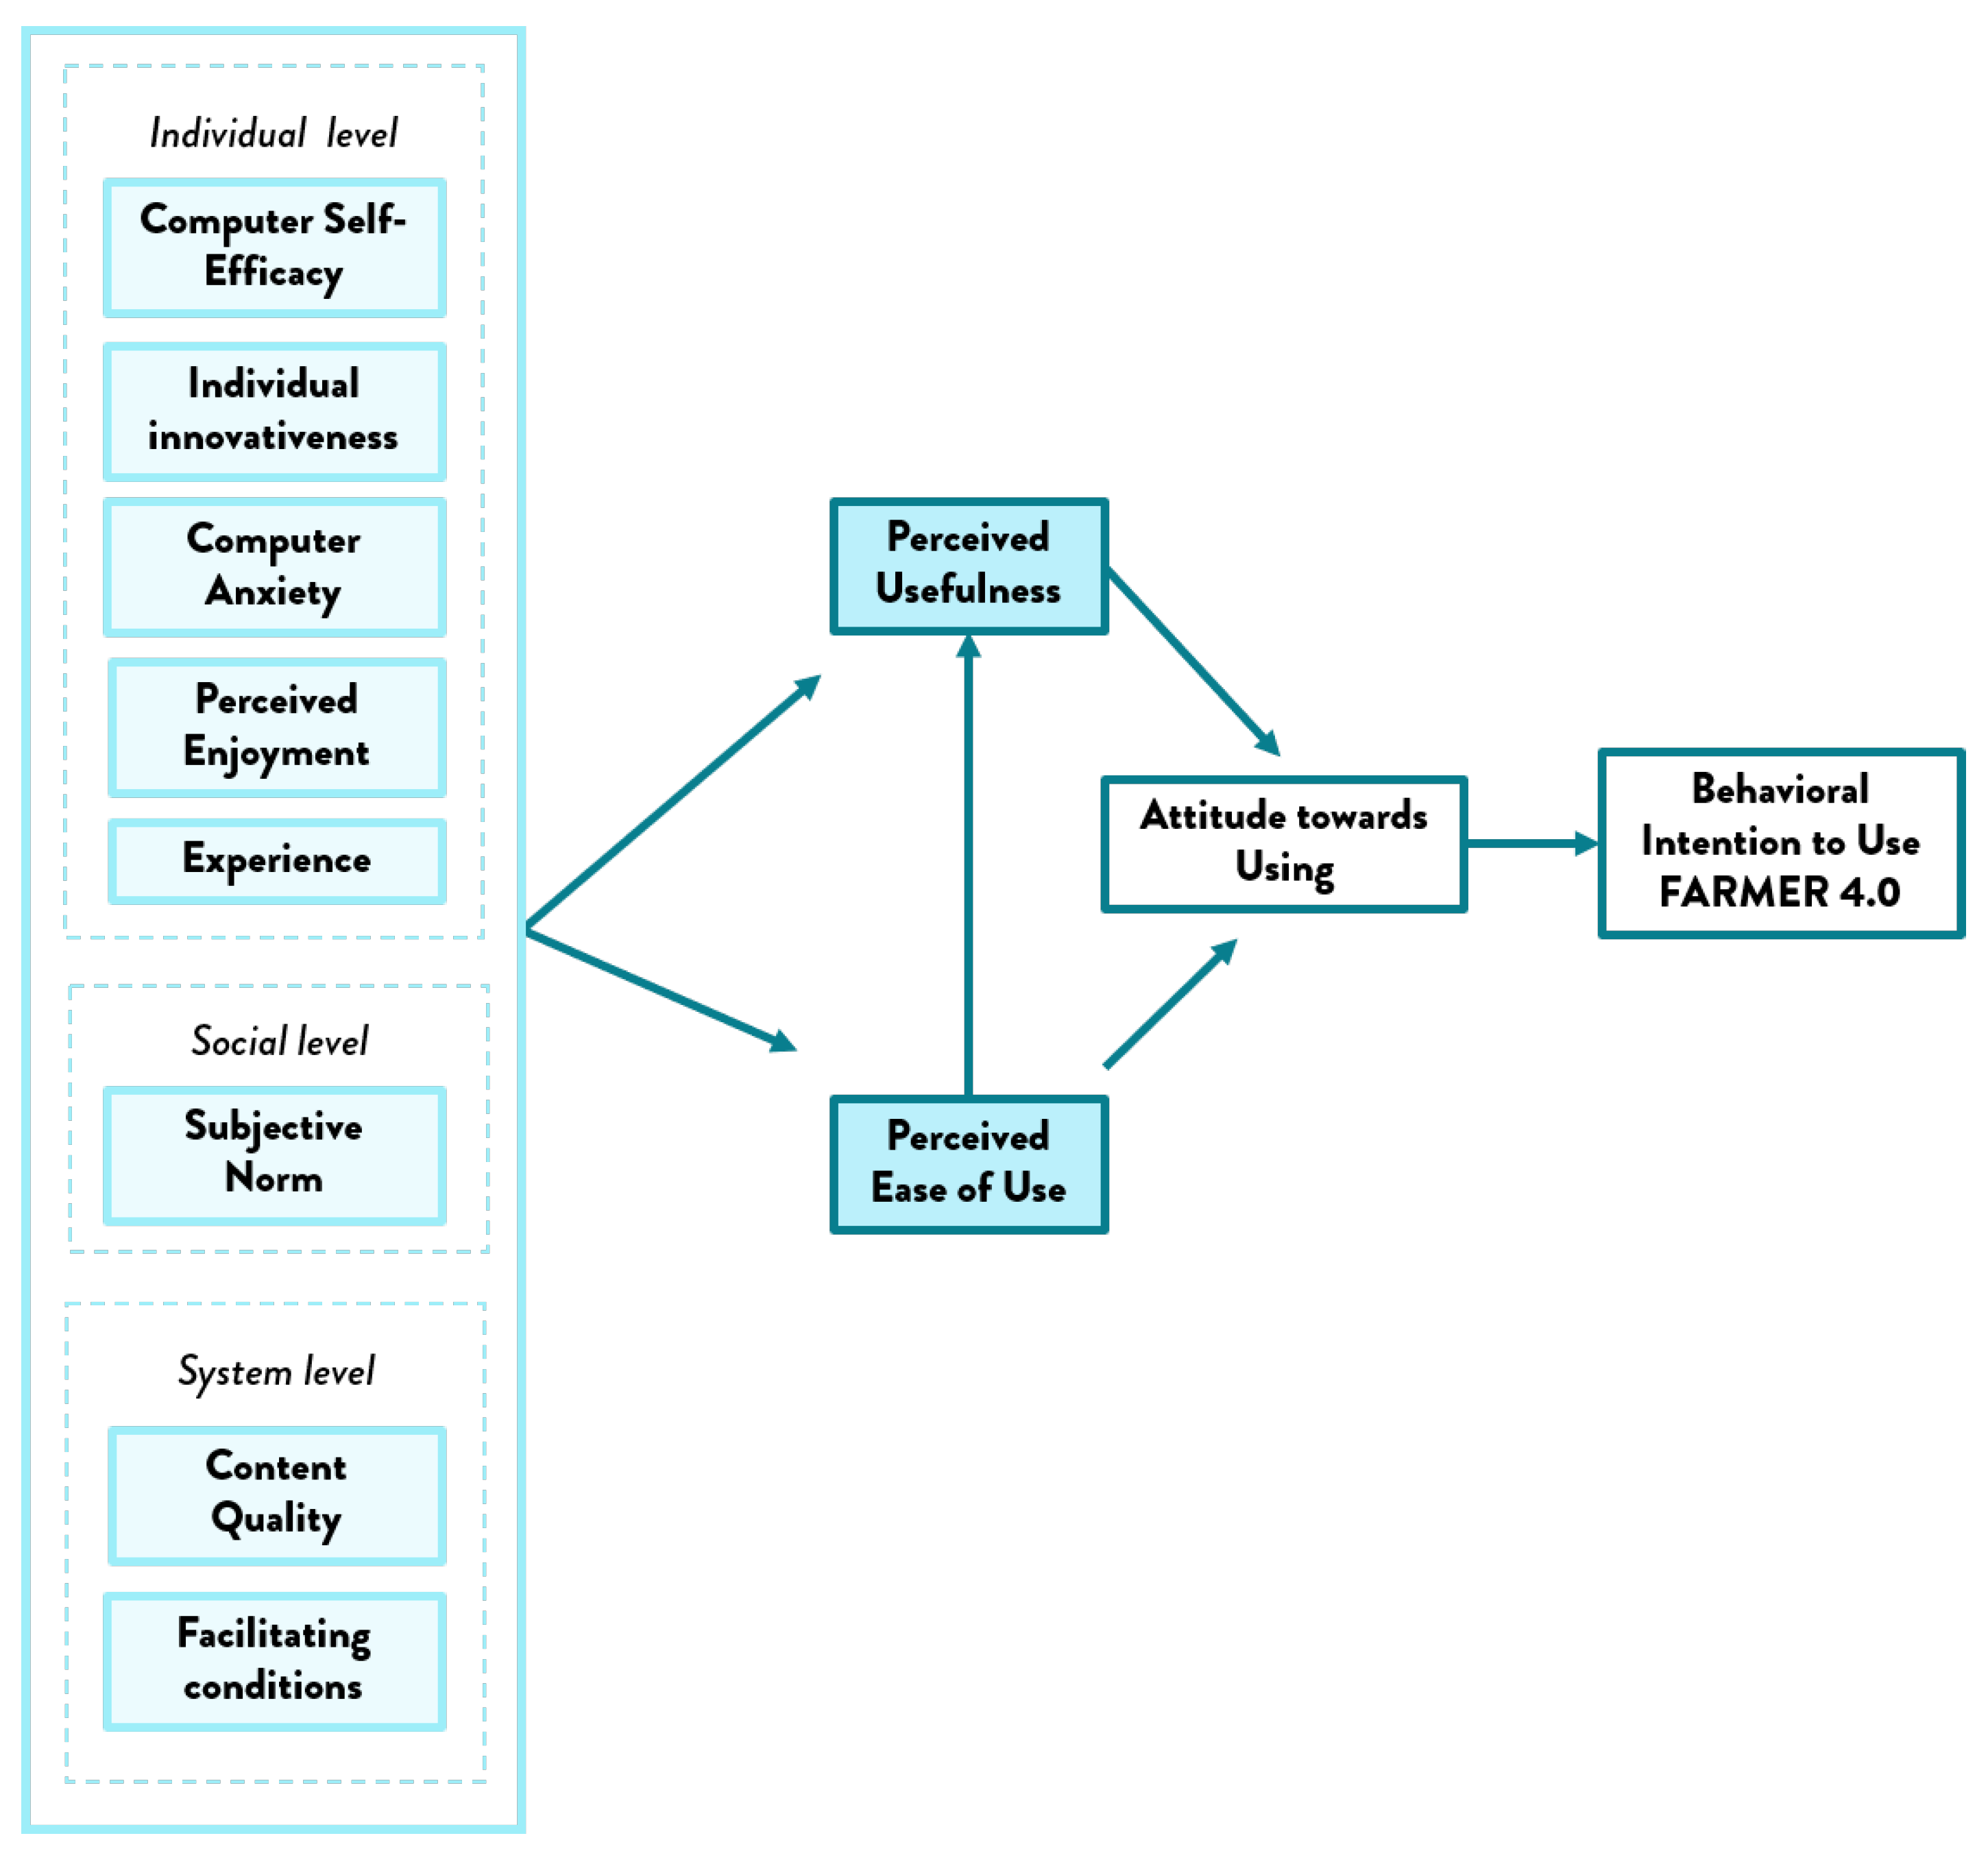
The Technology Acceptance Model Extension for FARMER 4.0

Dodero et al. [35] pointed out the complexity of e-learning systems due to the diversified nature of projects, the stakeholders, and system features and highlighted the importance of specific methodological approaches for an accurate design, development, and assessment. This perspective is very pertinent considering the intricate context of the e-learning platform FARMER 4.0 and the associated learning by doing training model in a relatively low technological sector like farming. For this reason, Castiblanco Jimenez et al. [18] conducted a literature review on TAM applications in the three sectors that converge in the e-learning tool—agriculture, e-learning, and virtual reality—aiming at identifying the external variables to include in a TAM extension to assess the adoption of FARMER 4.0. Using the Quality Function Deployment (QFD) as organizing framework, the authors identified the research problematics and the most commonly used external variables included to assess technology acceptance. One of the research categories and the one that fits the context of FARMER 4.0 is ”Technology acceptance when the technology is a platform or system”. Findings suggest that the most common external variables included in this type of TAM extensions were anxiety, content quality, experience, facilitating conditions, individual innovativeness, perceived enjoyment, self-efficacy, and social norm. Table 1 presents the definitions of these variables. The TAM extension proposed by Castiblanco Jimenez et al. [18] and later validated in the present study, is shown in Figure 4.

3. Method

The validation of the TAM extension in the context of FARMER 4.0 followed a quantitative method. Further details concerning the model to be validated, the associated research hypothesis, the questionnaire, and the data collection and construct validation processes are presented in the following subsections.

3.1. Hypothesis

In line with the findings of Castiblanco Jimenez et al. [18], we stated the hypothesis listed in Table 2. We expected farmers perceptions about the Ease of Use (PEOU) and the quality of the content (CQ) to have a strong positive influence on the Perceived Usefulness (PU) of the e-learning tool FARMER 4.0 (H10; H1a). The constructs experience (EXP), facilitating conditions (FC), individual innovativeness (II), perceived enjoyment (PE), self-efficacy (SE), and social norm (SN) were expected to have a medium positive impact on PU (H2a; H3a; H4a; H5a; H6a; H7a). A low negative influence of Anxiety (ANX) on PU was also predicted (H8a). Furthermore, the external variables with strong positive impact on Perceived Ease of Use were expected to be content quality (CQ), experience (EXP), perceived enjoyment (PE), and self-efficacy (SE) (H1b; H2b; H5b; H6b). PEOU was also expected to be moderately influenced by facilitating conditions (FC), social norm (SN), and anxiety (ANX) (H3b; H7b; H8b) and only slightly influenced by individual innovativeness (II) (H4b). Additional hypothesis were included to test the predictive power of PU and PEOU on the attitude towards use (ATT) ((H9a; H9b) and to measure the influence of ATT on the ultimate behavioral intention of farmers to use the FARMER 4.0 e-learning tool (H11). The strength of the relationships will be validated on the basis of path coefficients according to the criteria established by Cohen [50]. Path coefficients reporting values below or equal to 0.10 denote a low influence. External variables reporting path coefficients ranging from 0.1 to 0.30 included will be considered as having a moderate predictive power. Finally, higher path coefficients entail a strong causal relationship.

3.2. Description of the Questionnaire

The development of the questionnaire used in the present study followed an initial screening of the items included in similar TAM validations. After further analysis on their relevance and pertinence, 36 items were retained and adapted in wording to fit the context of the FARMER 4.0.
The questionnaire was structured in four sections. In the first section, a general description of the purpose of the study together with a mini-guide on the system usage was given. Respondents were also provided with the link to access FARMER 4.0 website and were asked to explore it. Within the second section, we asked participants for their consent for personal data processing in line with data protection regulations. The third section included demographic questions about age, gender, education level, computer use frequency, and previous experience in e-learning systems and farming activities. Finally, the fourth section included 36 items aiming to assess BI (3 items), ATT (3 items), PU (3 items), PEOU (3 items), ANX (3 items), CQ (3 items), EXP (3 items), FC (3 items), II (3 items), PE (3 items), SE (3 items), and SN (3 items). Each item was measured using a seven-point Likert Scale, being 1 = strongly disagree; 2 = moderately disagree; 3 = somewhat disagree; 4 = neutral; 5 = somewhat agree; 6 = moderately agree, and 7 = strongly agree. Items are listed in the Appendix A.
The items selected for the present research were applied in previous TAM studies showing an adequate validity and reliability for the contexts of application. Items initially in English were translated into Italian. The adequacy of the translation was verified by Italian researchers. The analyzed variables and the source from which items were adopted are listed in Table 3.

3.3. Data Collection

Our target was people with experience in farming-related activities. Similarly to Pappas et al. [68], we gathered an initial sample of 42 people by using convenience snowball sampling. Considering the restrictions associated with personal encounters in times of COVID-19, and in line with a vast majority of TAM validations [69], we used an online survey for data collection.
The designed questionnaire was sent using the Google survey tool. Responses were collected from mid-January to the end of April 2021. All 42 questionnaires were complete and valid.

4. Results

Demographic information was summarized using the IBM Statistical Package for Social Science (SPSS) software, similarly to Makransky and Lilleholt [70]. Results are depicted in Table 4. A slight majority of respondents were females (23 out of 42). A high educational level and high frequency of computer use were reported by participants. Twenty-one percent of respondents have experience in agricultural activities of more than 20 years, whereas the 45% have less than 5 years of experience in farming-related activities.
To further examine the causal relationships between the proposed model’s variables and the corresponding path coefficients, the Structural Equation Modeling (SEM) approach was considered the most appropriate. The SEM is a set of techniques that, by combining factor analysis and multiple regression analysis, allow the study of relationships between one or more independent variables and one or more dependent variables [71].
The discussion by Bagozzi [72] reported by Chau [73], and more recently by Al-Gahtani [74], exploring the several advantages of the SEM in similar studies, supports the use of the SEM techniques for the present research. Some of the reasons that favor the implementation of SEM over other multiple regression analyses (MRA) include the possibility to make explicit a research theory by defining it in specific constructs, formulate hypotheses about existing relationships between the different constructs, and test the theory and the designed measurements. The software used to adopt the SEM approach in the present work was the Smart PLS version 3. This software is based on least-squares estimation to adopt the SEM (PLS-SEM). The PLS-SEM was preferred as the analysis method for this study considering the minimal demands on measurement scales, the sample size, the number of constructs [74,75], and its increasing popularity to analyze path-coefficients in research models [76].
For a suitable PLS assessment, Aparicio et al. [77] suggested that the sample size should satisfy at least one of the following conditions: (i) be ten times the largest number of items or questions used to measure one construct, or (ii) be ten times the largest number of paths associated with a particular construct. In our case study, the highest number of questions to measure one construct was three, entailing a minimum sample size of 30 to satisfy one of these conditions. Therefore, our sample, consisting of 42 respondents, is acceptable. Furthermore, a weaker rule also suggested by Chin et al. [78] is to multiply the number of questions or the number of paths by five instead of ten. Using this rule, we manage to satisfy both conditions as the larger number of paths in our case study is eight, resulting in a minimum suggested number of 40.
The proposed model’s testing followed a two-step approach as in the work by Rezaei et al. [79], following the suggestion made by Bamberg [80]. According to this approach, the first step corresponds to the verification of the quality of the instrument (questionnaire) used to validate the model (measurement model). The second step evaluates the hypothetical relationships among the constructs (structural model).

4.1. Measurement Model Validation

The quality of the items was assessed in terms of their reliability and validity. Reliability refers to the extent to which a test is likely to yield the same results in case of repetition. On the other hand, the validity reflects the level at which an item effectively measures what it wants to measure [81].
Construct validity and reliability were evaluated in terms of internal consistency through Cronbach’s Alpha (CA), the Average Variance Extracted (AVE), and the composite reliability (CR). Similarly to the study by Rajan and Baral [82], we verified the following criteria suggested by Hair et al. [83] to ensure the validity and reliability of the measured constructs in the present study.
  • Item loadings should exceed 0.7 [84,85].
  • Composite reliability (CR) must be greater than 0.7 [86,87].
  • The average variance extracted (AVE) for each factor should be larger than 0.5 [88].
  • Cronbach’s coefficient alpha (CA) should be above 0.7 [89].
The discriminant validity (DV) is also frequently reported in similar TAM validations as in the work by Cidral et al. [90]. The discriminant validity examines the extent to which the scale measuring a specific construct is different from the ones of other constructs [88]. Based on the criterion established by Fornell and Larcker [88], a model has acceptable discriminant validity if the variance that a variable has with its constructs is higher than the variance shared by the variable with the others.
After running the PLS algorithm, some of the items showed loadings below 0.7, the minimum suggested to ensure reliability, and therefore were no longer considered. A second calculation was run after dropping the items EXP2, EXP3, and PEOU3. Results of the second run are depicted in Table 5.
Mean scores for almost all the variables were higher than the midpoint value of the scale, 3.5, except for anxiety. This indicates that most of the respondents did not experience stress of negative feelings when interacting with the e-learning tool. Standard deviation values ranged from 1.002 to 1.661, showing that values are moderately spread around the mean.
All the constructs showed satisfactory levels of validity and reliability. Loadings of all items were higher than 0.7. Composite reliability for all constructs was above the 0.7 threshold, with values from 0.870 to 1.000. AVE scores ranged from 0.692 to 1.000, exceeding the 0.5 as suggested by the literature. Cronbach’s Alphas were higher than 0.7, ranging from 0.777 to 1.000. Discriminant validity of the model was also satisfactory as shown in Table 6. The square root of the AVE of each variable (value in the diagonal) is higher than the other correlation values. Therefore, the measurement model was validated.

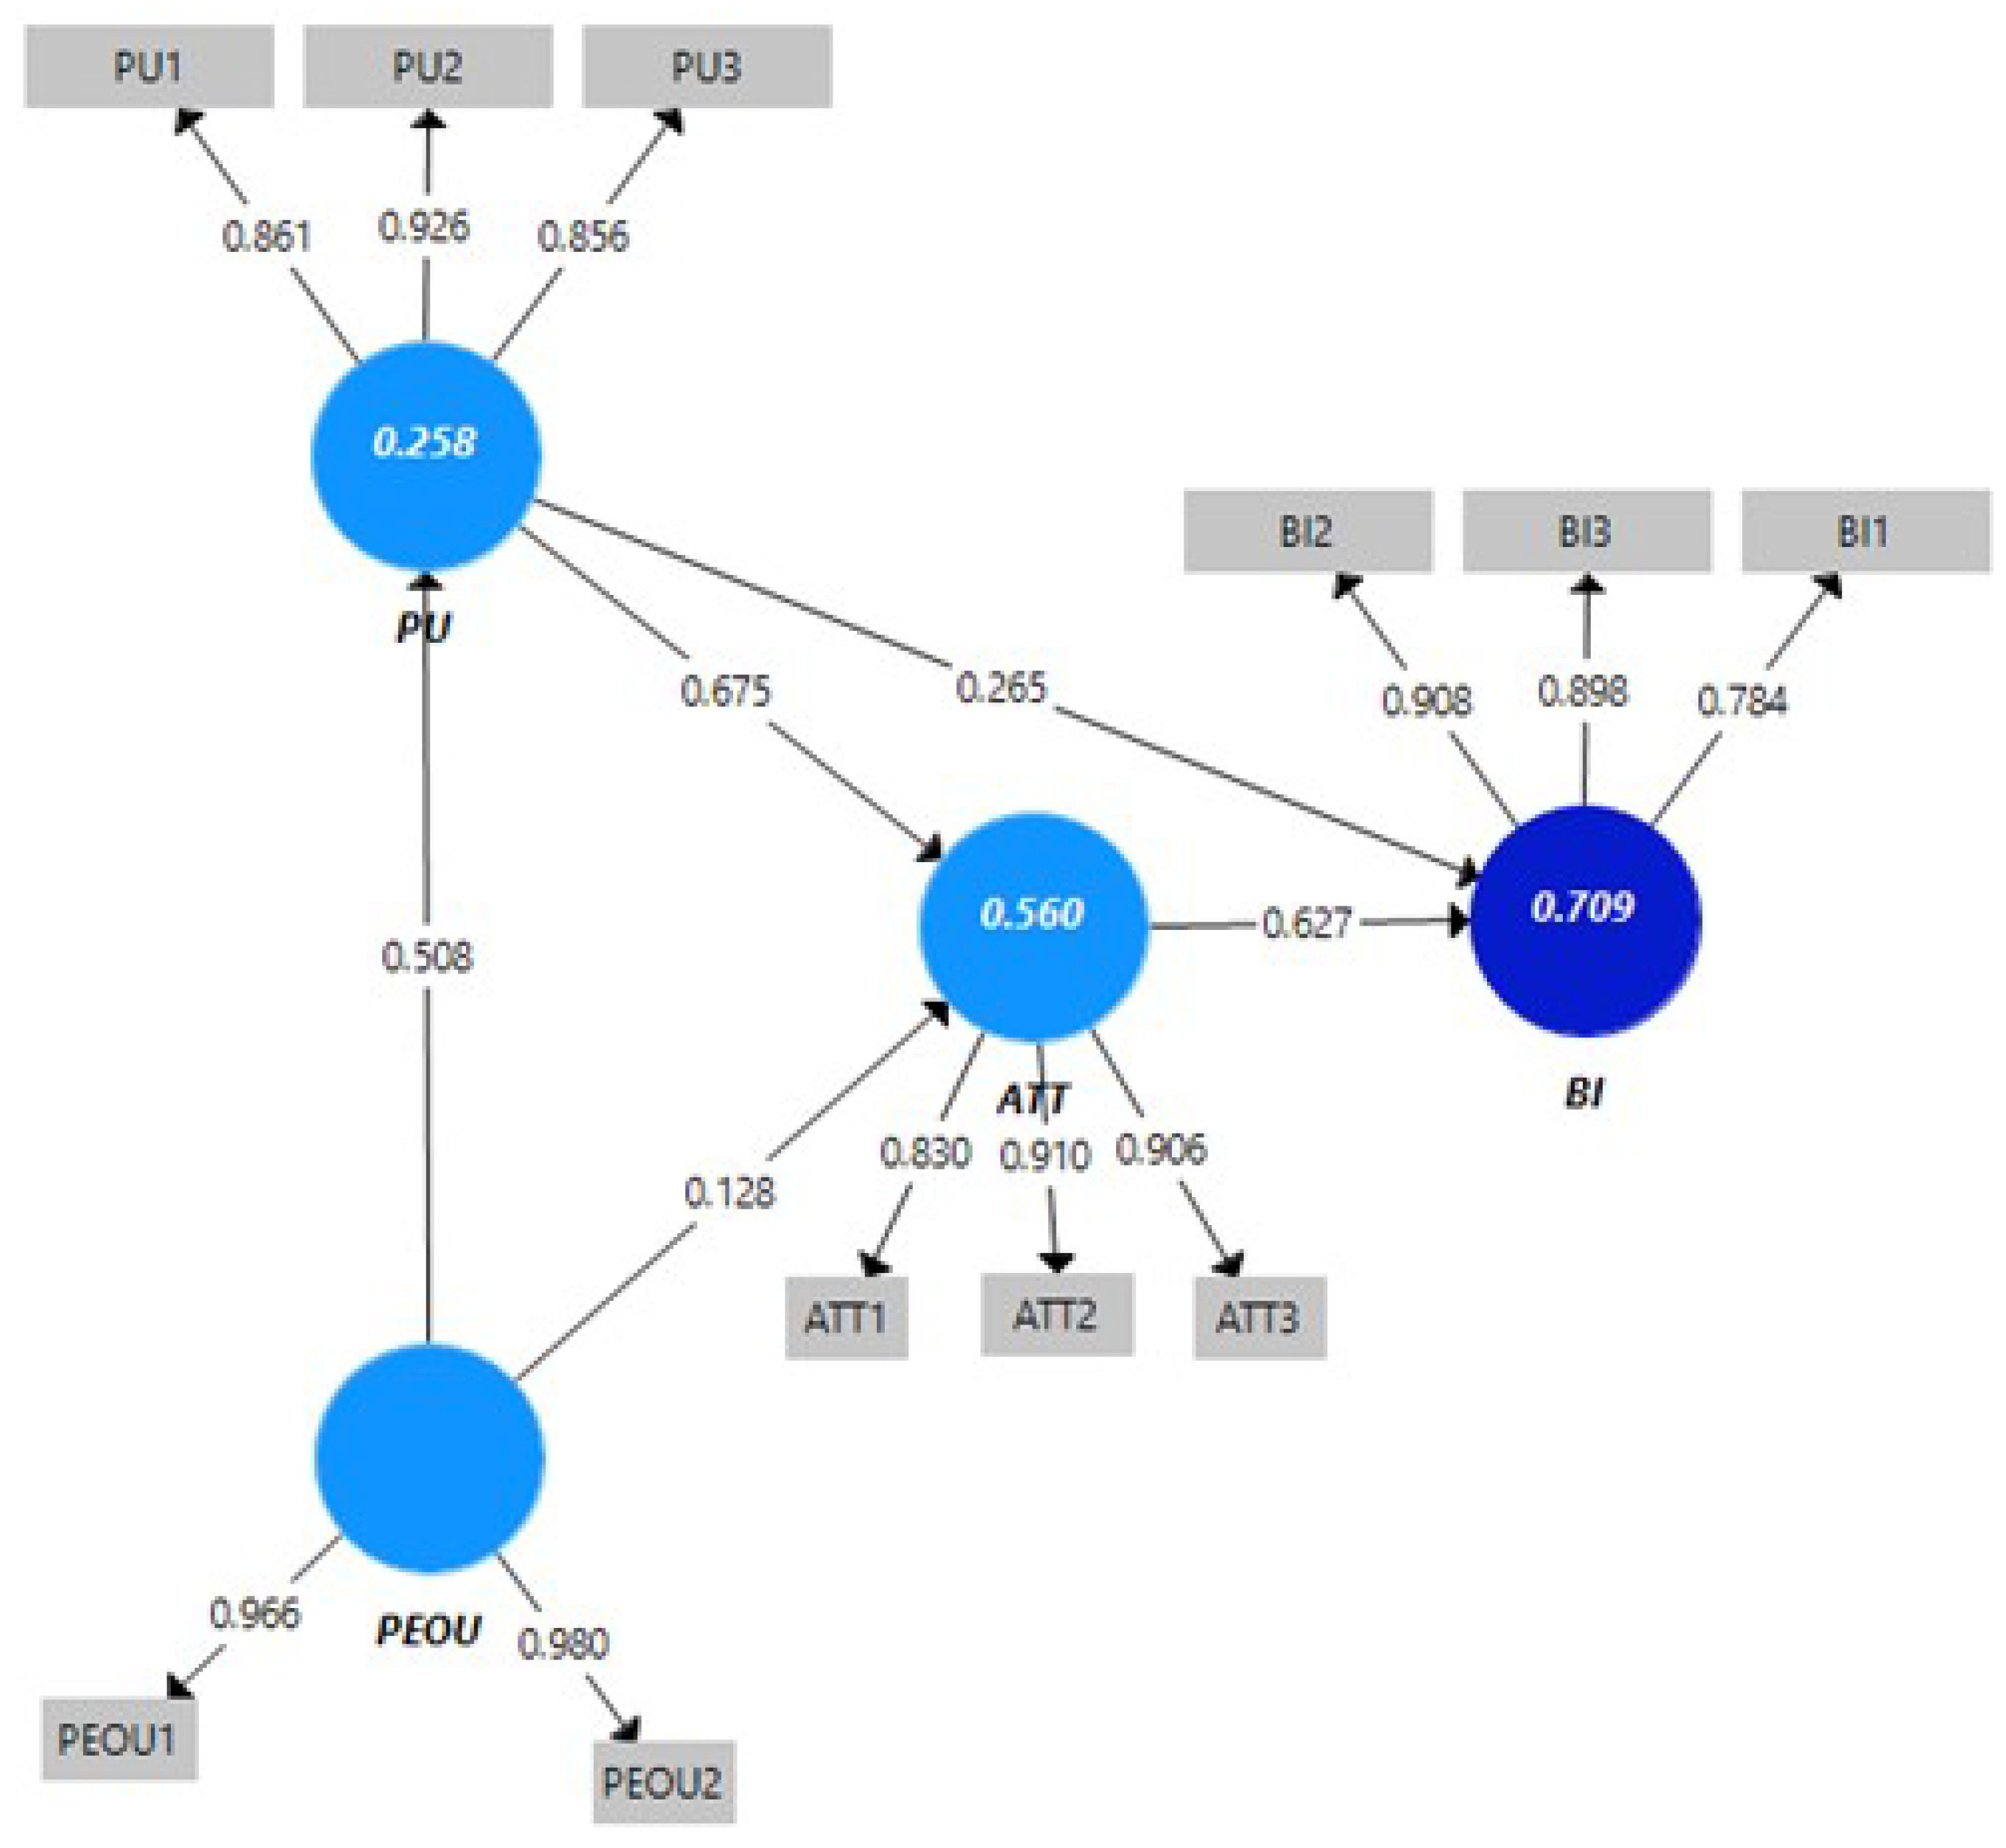
4.2. Structural Model Validation

For the examination of the model fit, the function of Bootstrapping of the Smart PLS Software was used. This function allows verifying the significance of the relationships among the different variables. In this case study, the test used 5000 sub-samples with 0.05 of significance level in one-tailed test, similarly to Estriegana et al. [91]. We started by analyzing the TAM as proposed by Davis et al. [55], and then we moved to the extended TAM version designed for the context of FARMER 4.0.
To determine the predictive power of the model, the coefficient of determination was considered. The coefficient of determination (R 2 ) measures the percentage of the variance of the dependent variable that can be attributed to the independent variable. Falk and Miller [92] suggested that for a model to have a minimum explanatory power, R 2 should be significant (t > 1.64) and greater than 0.10. Values of R 2 range from 0 to 1, and the higher the value, the better. Table 7 shows the R 2 values considering only the original TAM. All values were above 0.10, reflecting an acceptable predictive power.
The TAM, as proposed by Davis [17] (see Figure 5), is able to explain 70.9% of the variance of farmers behavioral intention (BI) to use the e-learning tool. Furthermore, 56% of farmers’ attitude towards use (ATT) is explained jointly by Perceived Usefulness (PU) and Perceived Ease of Use (PEOU). PEOU is apparently responsible for 25.8% of the variance of PU.
Path coefficients are numerically represented on the arrows connecting the different variables in Figure 5. The strength of path coefficients (SPC) and their significance are shown in Table 8. Farmers’ attitude towards the e-learning tool influences their intention to use it ( β = 0.627), jointly with their perceptions about the usefulness of the tool ( β = 0.265). In turn, the attitude towards using the e-learning tool (ATT) is strongly affected by PU ( β = 0.675), but the effect of PEOU on the ATT is weak and statistically not significant ( β = 0.128. No sig.). Finally, PEOU has a positive and significant effect on PU ( β = 0.508). This initial analysis suggests that farmers give the utmost importance to the perceived usefulness of innovations or technologies when considering using them. For the specific context of the study, the TAM version proposed by Davis et al. [55] does not hold entirely. However, it is still a valid aid to describe the adoption behavior of the e-learning tool FARMER 4.0.
After validating the TAM as proposed by Davis et al. in 1989, we assessed the proposed TAM extension following the same process. However, the model as proposed in Figure 4 showed a neutral fit considering the observed data ( χ 2 = 977.492; NFI = 0.534; the closer the Normed fit index (NFI) to 1, the better the fit [93]). For this reason, similarly to Naspetti et al. [94], we implemented the post hoc model-fitting strategy suggested by Byrne [95] to modify the model and obtain a better fit. Following this model-fitting strategy, every external variable and the corresponding paths were incorporated to the TAM variables and then tested. After several iterations and based on other statistical and theoretical considerations, only the most significant constructs and paths were retained. The final model, presented in Figure 6, showed a significantly better fit ( χ 2 = 262.742; NFI = 0.682). The associated determination coefficients (R 2 ), as well as path coefficients, are presented in Table 9 and Table 10.
In this new TAM extension, taking into account the results of the initial TAM validation, the relationship between PEOU and ATT was removed as it was found to be not significant. However, PEOU was found to have a moderate influence on farmers BI to use the e-learning tool ( β = 0.274). PEOU is influenced strongly by SE ( β = 0.480) and EXP ( β = 0.454), which jointly explain approximately 72.9% of its variance. The main determinant of PU was found to be CQ ( β = 0.632), and both CQ and PEOU ( β = 0.238), are responsible for 58.3% of PU variance. PU is strongly associated with farmers’ attitude towards use ( β = 0.742) and explains 55.1% of ATT variance. In general, the model is able to explain 73.2% of farmers’ intention to use the platform. The strongest determinant of BI is ATT ( β = 0.694).
Based on this new TAM extension and considering the criteria established by Cohen [50], self-efficacy and experience have a strong positive causal relationship with PEOU (H6b and H2b). CQ has a strong positive impact on PU (H1a). PU showed a strong effect on ATT (H9a), which in turn has a strong effect on BI (H11). The casual relationship between PEOU and BI was not included in any of the hypothesis, but it was found to exist and be moderate.
This adjusted and validated TAM extension allows the identification of critical drivers of acceptance for FARMER 4.0. Furthermore, the revised model offers a more reliable perspective when designing e-learning systems in future agricultural applications to foster users’ acceptance.

5. Discussion

Survey results evidenced that farmers and agricultural entrepreneurs have a positive attitude towards the e-learning tool (ATT) and manifested the intention to use it (BI). Among the two main TAM determinants, respondents perceived the tool to be more useful (PU) than easy to use (PEOU).
The system’s most highly feature rated was the quality of the content (CQ) offered through the several courses. A positive perception about the available help and guidelines offered by FARMER 4.0 to facilitate navigation (FC) was also noted. Concerning personal traits, participants manifested at a moderate level to enjoy using the platform (PE). Most of the respondents displayed acceptable levels of experience using similar e-learning platforms (EXP). This was reflected in low levels of anxiety (ANX) and acceptable self-efficacy (SE) reported by individuals when exploring the tool. As for the social level, interviewees declared that their closest social sphere would also approve the tool’s use (SN).
The TAM proved to be a very helpful theoretical approach to explain farmers’ intention to use the FARMER 4.0 e-learning environment. Accordingly, farmers’ perception about the usefulness of the tool (PU) was found to have a strong and significant impact on their attitude towards use (ATT), which stands out as the primary determinant of farmers’ intention to use (BI).
The TAM extension built by Castiblanco Jimenez et al. [18] based on the literature showed an improvable model fit for the current context of analysis. For this reason, we identified a new TAM extension that better suits the FARMER 4.0 context. The final model showed that potential users of FARMER 4.0 will perceive the e-learning tool to be useful (PU), depending on their perceptions about the quality of the content (CQ) in terms of its relevance and its alignment with their specific information needs. To a lesser extent, PU was also influenced by the PEOU. In turn, PEOU was found to be determined by experience (EXP) and self-efficacy (SE), two variables highly correlated among them. Similar results were reported by Chang et al. [96] and Calisir et al. [97].
Model validation results also suggest that PEOU is a predictor of behavioral intention (BI) rather than a determinant of ATT. The absence of significant causal effect of PEOU on ATT is in line with the results obtained by Tarhini et al. [98] or by Davis [51], who later re-considered the model by eliminating ATT [99]. However, unlike previous studies, ATT seems to mediate PU and BI’s relationship, like in work by Vidanapathirana et al. [100].
To sum up, farmers’ intention (BI) to use the e-learning platform FARMER 4.0 will mainly depend on their ability to interact with the several features (PEOU) and the attitude (ATT) they have formed about how advantageous the platform is. Important external variables that shape farmers’ perceptions about the usefulness (PU) and ease of use (PEOU) of the e-learning tool are self-efficacy (SE), previous experience with similar systems (EXP), and the quality and pertinence of the information available (CQ). Although relatively different from the initially proposed TAM extension, the model offers better adequacy, keeping a reduced number of constructs. Improvement efforts addressing the pinpointed variables will be more appreciated for users of FARMER 4.0 and similar e-learning systems.

6. Conclusions

The present study corresponds to the validation phase of a project aimed at evaluating farmers and agricultural entrepreneurs’ intention to use an e-learning platform. This paper’s general objective was to assess technology acceptance through the validation of an extended TAM version previously proposed by Castiblanco Jimenez et al. for the specific context of FARMER 4.0.
After an initial analysis of the TAM proposed by Davis et al., almost all the relationships were validated except for the effect of perceived ease of use (PEOU) on the attitude (ATT). Findings suggest that the degree to which farmers perceive the system as easy to use (PEOU) will affect their idea about its usefulness (PU). If they perceive the tool as useful (PU), they will have a positive attitude towards it (ATT) and therefore will have the intention to use it (BI).
As a technology acceptance measurement tool, the TAM provides flexibility to explore several extensions and find the one that better fits the technology context. This aspect of the model is advantageous considering the increasing complexity and variety of contexts in which e-learning tools are being applied. Although the initial TAM extension provided a neutral fit for FARMER 4.0, it offers a handy starting point to assess technology acceptance in agriculture, e-learning, and similar sectors.
In our case study, further analysis showed that farmers perceived the tool to be useful (PU) based on the content’s quality (CQ). On the other hand, the perception about ease of use (PEOU) was influenced by farmers’ experience with similar systems (EXP) and their confidence in their skills to explore and use the system and overcome any problem they might face when using the platform (SE). Positive perceptions about the usefulness of the tool (PU) have a positive effect on farmer’s attitudes (ATT). Subsequently, the attitude (ATT) stands out as the main driver of intention to use (BI). The ease of use (PEOU) will also reinforce the intention to use FARMER 4.0 (BI). The design and development of future e-learning initiatives should give special attention to the identified factors to increase the likelihood of technology adoption.
Although the sample size of 42 was suitable for the PLS assessment, replicating the analysis with a larger sample size is advisable to confirm and complement the obtained results once all the modules in the five languages are complete. However, infrastructure and resource-related barriers should be overcome to make the most out of the platform. Yumashev et al. [101] pointed out the importance of facilitating access to electricity and internet connectivity in rural areas where target users develop their daily activities. Improvements in those directions will increase the incentives to adopt technological tools like e-learning in the agricultural context.
Finally, it is crucial to consider the ongoing generational shift in farming activities and how tools like FARMER 4.0 can support it. Sroka et al. [102] found out that high levels of education among farmers can accelerate generational changes. In this sense, access to e-learning tools with farming-related content could speed up the transition to the so-called agriculture 4.0, taking advantage of young people’s propensity to adopt technological solutions in their daily lives. The increasing interest of young adults in farming-related activities, as evidenced by 45% of respondents with ages between 20 and 35 years, represents an opportunity to further develop e-learning applications in the agricultural sector.

Author Contributions

Conceptualization, L.C.C.G., I.A.C.J., F.M. and M.G.V.; data curation, L.C.C.G. and I.A.C.J.; formal analysis, L.C.C.G., I.A.C.J., F.M., and M.G.V.; funding acquisition, M.G.V.; investigation, L.C.C.G. and I.A.C.J.; methodology, I.A.C.J. and L.C.C.G.; supervision, F.M., M.G.V., I.A.C.J., and E.V.; visualization, F.M., I.A.C.J., and L.C.C.G.; writing—original draft, L.C.C.G. and I.A.C.J.; writing—review and editing, L.C.C.G., I.A.C.J., F.M., M.G.V., and E.V. All authors have read and agreed to the published version of the manuscript.

Funding

This work was supported by European Erasmus+ project “Farmer 4.0”, project number: 2018-1-IT01-KA202-006775.

Institutional Review Board Statement

Not applicable.

Informed Consent Statement

Not applicable.

Data Availability Statement

Not applicable.

Conflicts of Interest

The authors declare no conflict of interest. The funders had no role in the design of the study; in the collection, analyses, or interpretation of data; in the writing of the manuscript, or in the decision to publish the results.

Abbreviations

The following abbreviations are used in this manuscript:
TAMTechnology Acceptance Model
TPBTheory of Planned Behavior
TRATheory of Reasoned Act
MPCUModel of PC Utilization
SCTSocial Cognitive Theory
IDTInnovation Diffusion Theory
TTFTask Technology Fit
UTAUTUnified Theory of Acceptance and Use of Technology
ICTInformation and Communication Technologies
E-learningElectronic Learning
VRVirtual Reality
PUPerceived Usefulness
PEOUPerceived Ease of Use
BIBehavioral Intention
ATTAttitude Towards Use
ANXAnxiety
CQContent Quality
EXPExperience
FCFacilitating Conditions
IIIndividual Innovativeness
PEPerceived Enjoyment
SESelf-efficacy
SNSocial Norm

Appendix A. Questionnaire for TAM Validation in the e-Learning Tool Farmer 4.0

The following statements describe the outcomes that people might experience as a result of exploring the Farmer 4.0 learning environment. For each item indicate whether you agree or disagree, being 1 = strongly disagree; 2 = moderately disagree; 3 = somewhat disagree; 4 = neutral; 5 = somewhat agree; 6 = moderately agree, and 7 = strongly agree.

Appendix A.1. Behavioral Intention

The Behavioral Intention refers to your willingness to use the Farmer 4.0 learning environment.
Assuming that I have access to the learning tool:
  • I intend to use the Farmer 4.0 learning environment within the foreseeable future.
  • I will recommend others to use the Farmer 4.0 learning environment to access farming related content.
  • Overall, I think that using the Farmer 4.0 learning environment is advantageous.

Appendix A.2. Attitude towards Using

This part of the questionnaire explores your general perspective about using the website:
  • In my opinion, it is very desirable and worthwhile to use the Farmer 4.0 learning environment for farming and related purposes.
  • Overall, I have positive feelings towards the Farmer 4.0 learning environment.
  • Overall, I feel that the Farmer 4.0 learning environment is a good and attractive learning environment.

Appendix A.3. Perceived Usefulness

The following questions ask you about the degree to which you believe that using the Farmer 4.0 would enhance your performance in farming and agricultural activities:
  • Using the Farmer 4.0 learning environment would provide service and information very useful in my farming activities.
  • Using the Farmer 4.0 learning environment would improve my performance in farming activities.
  • Overall, I find the Farmer 4.0 learning environment useful.

Appendix A.4. Perceived Ease of Use

The following statements describe your beliefs about the effort you need to do in order to make a good use of the system:
  • I believe using the Farmer 4.0 learning environment would be easy for me.
  • I believe using the Farmer 4.0 learning environment would be clear and understandable.
  • Interacting with the Farmer 4.0 learning environment requires a lot of my mental effort.

Appendix A.5. Anxiety

This part of the questionnaire asks you about the feelings your might experience when using the system:
  • The Farmer 4.0 learning environment is somewhat intimidating to me.
  • Using the Farmer 4.0 learning environment makes me feel uncomfortable.
  • Generally, the use of learning websites stresses me out.

Appendix A.6. Content Quality

The following questions try to identify the degree to which the information provided by Farmer 4.0 fits your needs:
  • The Farmer 4.0 learning environment provides up-to-date information and content that is relevant to my needs and interests.
  • I think that the information I will get from the Farmer 4.0 learning environment is valuable.
  • The Farmer 4.0 learning environment presents the information in an appropriate format.

Appendix A.7. Experience

Now we want to know how previous interactions with similar systems might influence your opinions about the ease of use and usefulness of FARMER 4.0:
  • I have the knowledge and experience necessary to use the Farmer 4.0 learning environment.
  • I feel that my ability to determine the ease of use of the Farmer 4.0 learning environment is determined by my past experiences with similar systems.
  • I feel that my ability to determine the usefulness of the Farmer 4.0 learning environment is determined by my past experiences with similar systems.

Appendix A.8. Facilitating Conditions

The following statements assess the resources and information available to provide help and guidance when using the platform:
  • The Farmer 4.0 learning environment provides helpful guidance in performing tasks.
  • Guidelines and demonstrations on using the Farmer 4.0 learning environment are easily accessible.
  • A specific person or group is available for assistance with any difficulties related with the use of the Farmer 4.0 learning environment.

Appendix A.9. Individual Innovativeness

This part of the survey asks you about how prone you are to try and to adopt new technologies when they appear:
  • Among my peers, I am usually the first to try out new technologies.
  • I like to experiment with new learning systems.
  • I think I would use a learning system for farming related activities, even if I did not know anyone who had done it before.

Appendix A.10. Perceived Enjoyment

The following questions ask you about how pleasant and entertaining you find the e-learning tool:
  • I believe I would find using the Farmer 4.0 learning environment enjoyable.
  • The use of the Farmer 4.0 learning environment arouses my curiosity.
  • My imagination is stimulated by using the Farmer 4.0 learning environment.

Appendix A.11. Self-Efficacy

This part of the questionnaire asks you about your ability to use an unfamiliar software or system:
  • I feel confident finding the information I need using the Farmer 4.0 learning environment.
  • I know I can use the Farmer 4.0 learning environment even if I have not used a system like it before.
  • I am positive that I can overcome any obstacles when using the Farmer 4.0 learning environment.

Appendix A.12. Social Norm

Finally, we want to know the potential role of your personal relationships in the adoption of the FARMER 4.0:
  • People who are important to me would probably suggest the use of the Farmer 4.0 learning environment.
  • Other people beliefs about the Farmer 4.0 learning environment encourage me to use it.
  • I think that most people who are important to me would favor the adoption of the Farmer 4.0 learning environment in my farming activities.

References

  1. Brundtland, G.H. Our common future—Call for action. Environ. Conserv. 1987, 14, 291–294. [Google Scholar] [CrossRef]
  2. Gupta, J.; Vegelin, C. Sustainable development goals and inclusive development. Int. Environ. Agreem. Politics Law Econ. 2016, 16, 433–448. [Google Scholar] [CrossRef] [Green Version]
  3. Nie, D.; Panfilova, E.; Samusenkov, V.; Mikhaylov, A. E-Learning Financing Models in Russia for Sustainable Development. Sustainability 2020, 12, 4412. [Google Scholar] [CrossRef]
  4. Commission, E. Erasmus+ Programme Guide 2020. 2020. Available online: https://ec.europa.eu/programmes/erasmus-plus/sites/default/files/erasmus_programme_guide_2020_v3_en.pdf (accessed on 25 August 2012).
  5. Aggarwal, V. E-Learning for Skill Training: Applications and Best Practices for the Public Sector. Available at SSRN 3026964. 2017. Available online: https://papers.ssrn.com/sol3/papers.cfm?abstract_id=3026964 (accessed on 24 October 2017).
  6. Alexe, C.G.; Alexe, C.M. E-Learning-Facilitator Tool for the Development of Technological Entrepreneurship. eLearn. Softw. Educ. 2019, 2, 177–183. [Google Scholar]
  7. Catana, A.; Manea, D.; Titan, E. The contribution of the e-learning projects to the quality of life in four regions for development during the programming period 2007–2013, romania. eLearn. Softw. Educ. 2017, 1, 351–356. [Google Scholar]
  8. Chipere, N. A framework for developing sustainable e-learning programmes. Open Learn. J. Open Distance E-Learn. 2017, 32, 36–55. [Google Scholar] [CrossRef]
  9. Lin, C.H.; Wang, W.C.; Liu, C.Y.; Pan, P.N.; Pan, H.R. Research into the E-learning model of agriculture technology companies: Analysis by deep learning. Agronomy 2019, 9, 83. [Google Scholar] [CrossRef] [Green Version]
  10. Abdullah, F.; Ward, R. Developing a General Extended Technology Acceptance Model for E-Learning (GETAMEL) by analysing commonly used external factors. Comput. Hum. Behav. 2016, 56, 238–256. [Google Scholar] [CrossRef]
  11. Mercurio, D.I.; Hernandez, A.A. Understanding User Acceptance of Information System for Sweet Potato Variety and Disease Classification: An Empirical Examination with an Extended Technology Acceptance Model. In Proceedings of the 2020 16th IEEE International Colloquium on Signal Processing & Its Applications (CSPA), Langkawi, Malaysia, 28–29 February 2020; pp. 272–277. [Google Scholar]
  12. Caffaro, F.; Cremasco, M.M.; Roccato, M.; Cavallo, E. Drivers of farmers’ intention to adopt technological innovations in Italy: The role of information sources, perceived usefulness, and perceived ease of use. J. Rural. Stud. 2020, 76, 264–271. [Google Scholar] [CrossRef]
  13. Cavallo, E.; Ferrari, E.; Bollani, L.; Coccia, M. Attitudes and behaviour of adopters of technological innovations in agricultural tractors: A case study in Italian agricultural system. Agric. Syst. 2014, 130, 44–54. [Google Scholar] [CrossRef]
  14. Cullen, R.; Forbes, S.L.; Grout, R. Non-adoption of environmental innovations in wine growing. N. Z. J. Crop Hortic. Sci. 2013, 41, 41–48. [Google Scholar] [CrossRef]
  15. Sneddon, J.; Soutar, G.; Mazzarol, T. Modelling the faddish, fashionable and efficient diffusion of agricultural technologies: A case study of the diffusion of wool testing technology in Australia. Technol. Forecast. Soc. Chang. 2011, 78, 468–480. [Google Scholar] [CrossRef]
  16. Wheeler, S.A. What influences agricultural professionals’ views towards organic agriculture? Ecol. Econ. 2008, 65, 145–154. [Google Scholar] [CrossRef]
  17. Davis, F.D. A Technology Acceptance Model for Empirically Testing New End-User Information Systems: Theory and Results. Ph.D. Thesis, Massachusetts Institute of Technology, Cambridge, MA, USA, 1985. [Google Scholar]
  18. Castiblanco Jimenez, I.A.; Cepeda García, L.C.; Violante, M.G.; Marcolin, F.; Vezzetti, E. Commonly Used External TAM Variables in e-Learning, Agriculture and Virtual Reality Applications. Future Internet 2021, 13, 7. [Google Scholar] [CrossRef]
  19. Marangunić, N.; Granić, A. Technology acceptance model: A literature review from 1986 to 2013. Univers. Access Inf. Soc. 2015, 14, 81–95. [Google Scholar] [CrossRef]
  20. Fishbein, M.; Ajzen, I. Belief, Attitude, Intention, and Behavior: An Introduction to Theory and Research. 1977. Available online: https://www.jstor.org/stable/40237022?seq=1 (accessed on 3 March 2020).
  21. Triandis, H.C. Values, attitudes, and interpersonal behavior. In Nebraska Symposium on Motivation; University of Nebraska Press: Lincoln, NE, USA, 1979. [Google Scholar]
  22. Bandura, A. Social Foundations of Thought and Action; American Psychological Association: Englewood Cliffs, NJ, USA, 1986. [Google Scholar]
  23. Ajzen, I. The theory of planned behavior. Organ. Behav. Hum. Decis. Process. 1991, 50, 179–211. [Google Scholar] [CrossRef]
  24. Rogers, E.M. Diffusion of Innovations: Modifications of a model for telecommunications. In Die Diffusion von Innovationen in der Telekommunikation; Springer: Berlin/Heidelberg, Germany, 1995; pp. 25–38. [Google Scholar]
  25. Goodhue, D.L.; Thompson, R.L. Task-technology fit and individual performance. MIS Q. 1995, 19, 213–236. [Google Scholar] [CrossRef]
  26. Venkatesh, V.; Morris, M.G.; Davis, G.B.; Davis, F.D. User acceptance of information technology: Toward a unified view. MIS Q. 2003, 27, 425–478. [Google Scholar] [CrossRef] [Green Version]
  27. Giovanis, A.N.; Binioris, S.; Polychronopoulos, G. An extension of TAM model with IDT and security/privacy risk in the adoption of internet banking services in Greece. EuroMed J. Bus. 2012, 7, 24–53. [Google Scholar] [CrossRef]
  28. Venkatesh, V.; Davis, F.D. A theoretical extension of the technology acceptance model: Four longitudinal field studies. Manag. Sci. 2000, 46, 186–204. [Google Scholar] [CrossRef] [Green Version]
  29. Venkatesh, V.; Bala, H. Technology acceptance model 3 and a research agenda on interventions. Decis. Sci. 2008, 39, 273–315. [Google Scholar] [CrossRef] [Green Version]
  30. Chuah, S.H.W.; Rauschnabel, P.A.; Krey, N.; Nguyen, B.; Ramayah, T.; Lade, S. Wearable technologies: The role of usefulness and visibility in smartwatch adoption. Comput. Hum. Behav. 2016, 65, 276–284. [Google Scholar] [CrossRef]
  31. Chen, K.; Chan, A.H.S. Gerontechnology acceptance by elderly Hong Kong Chinese: A senior technology acceptance model (STAM). Ergonomics 2014, 57, 635–652. [Google Scholar] [CrossRef]
  32. Chen, C.F.; Xu, X.; Arpan, L. Between the technology acceptance model and sustainable energy technology acceptance model: Investigating smart meter acceptance in the United States. Energy Res. Soc. Sci. 2017, 25, 93–104. [Google Scholar] [CrossRef]
  33. Muñoz-Leiva, F.; Climent-Climent, S.; Liébana-Cabanillas, F. Determinants of intention to use the mobile banking apps: An extension of the classic TAM model. Span. J. Mark. ESIC 2017, 21, 25–38. [Google Scholar] [CrossRef]
  34. Salloum, S.A.; Alhamad, A.Q.M.; Al-Emran, M.; Monem, A.A.; Shaalan, K. Exploring students’ acceptance of e-learning through the development of a comprehensive technology acceptance model. IEEE Access 2019, 7, 128445–128462. [Google Scholar] [CrossRef]
  35. Dodero, J.M.; García-Peñalvo, F.J.; González, C.; Moreno-Ger, P.; Redondo, M.A.; Sarasa-Cabezuelo, A.; Sierra, J.L. Development of e-learning solutions: Different approaches, a common mission. IEEE Rev. Iberoam. Tecnol. Del Aprendiz. 2014, 9, 72–80. [Google Scholar] [CrossRef]
  36. Venkatesh, V. Determinants of perceived ease of use: Integrating control, intrinsic motivation, and emotion into the technology acceptance model. Inf. Syst. Res. 2000, 11, 342–365. [Google Scholar] [CrossRef] [Green Version]
  37. Lee, B.C.; Yoon, J.O.; Lee, I. Learners’ acceptance of e-learning in South Korea: Theories and results. Comput. Educ. 2009, 53, 1320–1329. [Google Scholar] [CrossRef]
  38. Lee, Y.C. An empirical investigation into factors influencing the adoption of an e-learning system. Online Inf. Rev. 2006, 30, 517–541. [Google Scholar] [CrossRef] [Green Version]
  39. Binyamin, S.S.; Rutter, M.; Smith, S. Extending the technology acceptance model to understand students’ use of learning management systems in Saudi higher education. Int. J. Emerg. Technol. Learn. (iJET) 2019, 14, 4–21. [Google Scholar] [CrossRef]
  40. Thompson, R.; Compeau, D.; Higgins, C. Intentions to use information technologies: An integrative model. J. Organ. End User Comput. (JOEUC) 2006, 18, 25–46. [Google Scholar] [CrossRef] [Green Version]
  41. Fazio, R.H.; Zanna, M.P. Direct experience and attitude-behavior consistency. In Advances in Experimental Social Psychology; Elsevier: Amsterdam, The Netherlands, 1981; Volume 14, pp. 161–202. [Google Scholar]
  42. Karahanna, E.; Straub, D.W.; Chervany, N.L. Information technology adoption across time: A cross-sectional comparison of pre-adoption and post-adoption beliefs. MIS Q. 1999, 23, 183–213. [Google Scholar] [CrossRef]
  43. Agarwal, R.; Prasad, J. A conceptual and operational definition of personal innovativeness in the domain of information technology. Inf. Syst. Res. 1998, 9, 204–215. [Google Scholar] [CrossRef]
  44. Liu, Y.; Li, H.; Carlsson, C. Factors driving the adoption of m-learning: An empirical study. Comput. Educ. 2010, 55, 1211–1219. [Google Scholar] [CrossRef]
  45. Park, Y.; Son, H.; Kim, C. Investigating the determinants of construction professionals’ acceptance of web-based training: An extension of the technology acceptance model. Autom. Constr. 2012, 22, 377–386. [Google Scholar] [CrossRef]
  46. Sánchez-Prieto, J.C.; Olmos-Migueláñez, S.; García-Peñalvo, F.J. Informal tools in formal contexts: Development of a model to assess the acceptance of mobile technologies among teachers. Comput. Hum. Behav. 2016, 55, 519–528. [Google Scholar] [CrossRef]
  47. Compeau, D.R.; Higgins, C.A. Application of social cognitive theory to training for computer skills. Inf. Syst. Res. 1995, 6, 118–143. [Google Scholar] [CrossRef]
  48. Compeau, D.R.; Higgins, C.A. Computer self-efficacy: Development of a measure and initial test. MIS Q. 1995, 19, 189–211. [Google Scholar] [CrossRef] [Green Version]
  49. Elliott, K.M.; Hall, M.C.; Meng, J.G. Consumers’ intention to use self-scanning technology: The role of technology readiness and perceptions toward self-service technology. Acad. Mark. Stud. J. 2013, 17, 129. [Google Scholar]
  50. Cohen, J. A power primer. Psychol. Bull. 1992, 112, 155. [Google Scholar] [CrossRef] [PubMed]
  51. Davis, F.D. Perceived usefulness, perceived ease of use, and user acceptance of information technology. MIS Q. 1989, 13, 319–340. [Google Scholar] [CrossRef] [Green Version]
  52. Taylor, S.; Todd, P.A. Understanding information technology usage: A test of competing models. Inf. Syst. Res. 1995, 6, 144–176. [Google Scholar] [CrossRef]
  53. Gangwar, H.; Date, H.; Ramaswamy, R. Understanding determinants of cloud computing adoption using an integrated TAM-TOE model. J. Enterp. Inf. Manag. 2015, 28, 107–130. [Google Scholar] [CrossRef]
  54. Fathema, N.; Shannon, D.; Ross, M. Expanding the Technology Acceptance Model (TAM) to examine faculty use of Learning Management Systems (LMSs) in higher education institutions. J. Online Learn. Teach. 2015, 11, 2. [Google Scholar]
  55. Davis, F.D.; Bagozzi, R.P.; Warshaw, P.R. User acceptance of computer technology: A comparison of two theoretical models. Manag. Sci. 1989, 35, 982–1003. [Google Scholar] [CrossRef] [Green Version]
  56. Manis, K.T.; Choi, D. The virtual reality hardware acceptance model (VR-HAM): Extending and individuating the technology acceptance model (TAM) for virtual reality hardware. J. Bus. Res. 2019, 100, 503–513. [Google Scholar] [CrossRef]
  57. Teo, T. Modelling technology acceptance in education: A study of pre-service teachers. Comput. Educ. 2009, 52, 302–312. [Google Scholar] [CrossRef]
  58. Faqih, K.M.; Jaradat, M.I.R.M. Assessing the moderating effect of gender differences and individualism-collectivism at individual-level on the adoption of mobile commerce technology: TAM3 perspective. J. Retail. Consum. Serv. 2015, 22, 37–52. [Google Scholar] [CrossRef]
  59. Sánchez-Prieto, J.C.; Olmos-Migueláñez, S.; García-Peñalvo, F.J. MLearning and pre-service teachers: An assessment of the behavioral intention using an expanded TAM model. Comput. Hum. Behav. 2017, 72, 644–654. [Google Scholar] [CrossRef]
  60. Lee, D.Y.; Lehto, M.R. User acceptance of YouTube for procedural learning: An extension of the Technology Acceptance Model. Comput. Educ. 2013, 61, 193–208. [Google Scholar] [CrossRef]
  61. Cheong, J.H.; Park, M.C. Mobile internet acceptance in Korea. Internet Res. 2005, 15, 125–140. [Google Scholar] [CrossRef]
  62. Alharbi, S.; Drew, S. Using the technology acceptance model in understanding academics’ behavioural intention to use learning management systems. Int. J. Adv. Comput. Sci. Appl. 2014, 5, 143–155. [Google Scholar] [CrossRef]
  63. Cheung, R.; Vogel, D. Predicting user acceptance of collaborative technologies: An extension of the technology acceptance model for e-learning. Comput. Educ. 2013, 63, 160–175. [Google Scholar] [CrossRef]
  64. Natarajan, T.; Balasubramanian, S.A.; Kasilingam, D.L. Understanding the intention to use mobile shopping applications and its influence on price sensitivity. J. Retail. Consum. Serv. 2017, 37, 8–22. [Google Scholar] [CrossRef]
  65. Lee, Y.H.; Hsieh, Y.C.; Chen, Y.H. An investigation of employees’ use of e-learning systems: Applying the technology acceptance model. Behav. Inf. Technol. 2013, 32, 173–189. [Google Scholar] [CrossRef]
  66. Koenig-Lewis, N.; Marquet, M.; Palmer, A.; Zhao, A.L. Enjoyment and social influence: Predicting mobile payment adoption. Serv. Ind. J. 2015, 35, 537–554. [Google Scholar] [CrossRef]
  67. Wu, B.; Chen, X. Continuance intention to use MOOCs: Integrating the technology acceptance model (TAM) and task technology fit (TTF) model. Comput. Hum. Behav. 2017, 67, 221–232. [Google Scholar] [CrossRef]
  68. Pappas, I.O.; Kourouthanassis, P.E.; Giannakos, M.N.; Chrissikopoulos, V. Explaining online shopping behavior with fsQCA: The role of cognitive and affective perceptions. J. Bus. Res. 2016, 69, 794–803. [Google Scholar] [CrossRef]
  69. Newsted, P.R.; Huff, S.L.; Munro, M.C. Survey instruments in information systems. MIS Q. 1998, 22, 553. [Google Scholar] [CrossRef]
  70. Makransky, G.; Lilleholt, L. A structural equation modeling investigation of the emotional value of immersive virtual reality in education. Educ. Technol. Res. Dev. 2018, 66, 1141–1164. [Google Scholar] [CrossRef]
  71. Ullman, J.B.; Bentler, P.M. Structural equation modeling. In Handbook of Psychology; Wiley: Hoboken, NJ, USA, 2003; pp. 607–634. [Google Scholar]
  72. Bagozzi, R.P. Causal Models in Marketing; Wiley: Hoboken, NJ, USA, 1980. [Google Scholar]
  73. Chau, P.Y. Reexamining a model for evaluating information center success using a structural equation modeling approach. Decis. Sci. 1997, 28, 309–334. [Google Scholar] [CrossRef]
  74. Al-Gahtani, S.S. Empirical investigation of e-learning acceptance and assimilation: A structural equation model. Appl. Comput. Inform. 2016, 12, 27–50. [Google Scholar] [CrossRef] [Green Version]
  75. Chin, W.; Marcolin, B.; Newsted, P. A partial least squares latent variable modelling approach for measuring interaction effects: Results from a Carlo simulation study and voice mail emotion/adoption study. In Proceedings of the 17th International Conference on Information Systems, Cleveland, OH, USA, 16–18 December 1996. [Google Scholar]
  76. Tarhini, A.; Hone, K.; Liu, X. Measuring the moderating effect of gender and age on e-learning acceptance in England: A structural equation modeling approach for an extended technology acceptance model. J. Educ. Comput. Res. 2014, 51, 163–184. [Google Scholar] [CrossRef]
  77. Aparicio, M.; Bacao, F.; Oliveira, T. Cultural impacts on e-learning systems’ success. Internet High. Educ. 2016, 31, 58–70. [Google Scholar] [CrossRef] [Green Version]
  78. Chin, W.W.; Marcolin, B.L.; Newsted, P.R. A partial least squares latent variable modeling approach for measuring interaction effects: Results from a Monte Carlo simulation study and an electronic-mail emotion/adoption study. Inf. Syst. Res. 2003, 14, 189–217. [Google Scholar] [CrossRef] [Green Version]
  79. Rezaei, R.; Safa, L.; Ganjkhanloo, M.M. Understanding farmers’ ecological conservation behavior regarding the use of integrated pest management-an application of the technology acceptance model. Glob. Ecol. Conserv. 2020, 22, e00941. [Google Scholar] [CrossRef]
  80. Bamberg, S. How does environmental concern influence specific environmentally related behaviors? A new answer to an old question. J. Environ. Psychol. 2003, 23, 21–32. [Google Scholar] [CrossRef]
  81. Carmines, E.G.; Zeller, R.A. Reliability and Validity Assessment; Sage Publications: New York, NY, USA, 1979. [Google Scholar]
  82. Rajan, C.A.; Baral, R. Adoption of ERP system: An empirical study of factors influencing the usage of ERP and its impact on end user. IIMB Manag. Rev. 2015, 27, 105–117. [Google Scholar] [CrossRef] [Green Version]
  83. Hair, J.F.; Black, W.C.; Babin, B.J.; Anderson, R.E.; Tatham, R.L. Multivariate Data Analysis; Prentice Hall: Upper Saddle River, NJ, USA, 1998; Volume 5. [Google Scholar]
  84. Gefen, D.; Straub, D.; Boudreau, M.C. Structural equation modeling and regression: Guidelines for research practice. Commun. Assoc. Inf. Syst. 2000, 4, 7. [Google Scholar] [CrossRef] [Green Version]
  85. Yoo, Y.; Alavi, M. Media and group cohesion: Relative influences on social presence, task participation, and group consensus. MIS Q. 2001, 25, 371–390. [Google Scholar] [CrossRef]
  86. Nunnally, J.C. Psychometric Theory, 2nd ed.; Sage Publications: New York, NY, USA, 1978. [Google Scholar]
  87. Hair, J.; Anderson, R.; Tatham, R.; Black, W. Factorial analysis. In Multivariate Data Analysis, 5th ed.; Prentice Hall: Upper Saddle River, NJ, USA, 1998. [Google Scholar]
  88. Fornell, C.; Larcker, D.F. Evaluating structural equation models with unobservable variables and measurement error. J. Mark. Res. 1981, 18, 39–50. [Google Scholar] [CrossRef]
  89. Palant, J. SPSS Survival Manual: A Step by Step Guide to Data Analysis Using IBM Spss. 2013. Available online: https://www.routledge.com/SPSS-Survival-Manual-A-step-by-step-guide-to-data-analysis-using-IBM-SPSS/Pallant/p/book/9781760875534# (accessed on 3 March 2020).
  90. Cidral, W.A.; Oliveira, T.; Di Felice, M.; Aparicio, M. E-learning success determinants: Brazilian empirical study. Comput. Educ. 2018, 122, 273–290. [Google Scholar] [CrossRef] [Green Version]
  91. Estriegana, R.; Medina-Merodio, J.A.; Barchino, R. Student acceptance of virtual laboratory and practical work: An extension of the technology acceptance model. Comput. Educ. 2019, 135, 1–14. [Google Scholar] [CrossRef]
  92. Falk, R.F.; Miller, N.B. A Primer for Soft Modeling; University of Akron Press: Akron, OH, USA, 1992. [Google Scholar]
  93. Bentler, P.M.; Bonett, D.G. Significance tests and goodness of fit in the analysis of covariance structures. Psychol. Bull. 1980, 88, 588. [Google Scholar] [CrossRef]
  94. Naspetti, S.; Mandolesi, S.; Buysse, J.; Latvala, T.; Nicholas, P.; Padel, S.; Van Loo, E.J.; Zanoli, R. Determinants of the acceptance of sustainable production strategies among dairy farmers: Development and testing of a modified technology acceptance model. Sustainability 2017, 9, 1805. [Google Scholar] [CrossRef] [Green Version]
  95. Byrne, B.M. Structural Equation Modeling with Mplus: Basic Concepts, Applications, and Programming; Routledge: London, UK, 2013. [Google Scholar]
  96. Chang, C.T.; Hajiyev, J.; Su, C.R. Examining the students’ behavioral intention to use e-learning in Azerbaijan: The general extended technology acceptance model for e-learning approach. Comput. Educ. 2017, 111, 128–143. [Google Scholar] [CrossRef]
  97. Calisir, F.; Altin Gumussoy, C.; Bayraktaroglu, A.E.; Karaali, D. Predicting the intention to use a web-based learning system: Perceived content quality, anxiety, perceived system quality, image, and the technology acceptance model. Hum. Factors Ergon. Manuf. Serv. Ind. 2014, 24, 515–531. [Google Scholar] [CrossRef]
  98. Tarhini, A.; Hassouna, M.; Abbasi, M.S.; Orozco, J. Towards the Acceptance of RSS to Support Learning: An empirical study to validate the Technology Acceptance Model in Lebanon. Electron. J. E-Learn. 2015, 13, 30–41. [Google Scholar]
  99. Venkatesh, V.; Davis, F.D. A model of the antecedents of perceived ease of use: Development and test. Decis. Sci. 1996, 27, 451–481. [Google Scholar] [CrossRef]
  100. Vidanapathirana, N.; Hirimburegama, K.; Hirimburegama, W.; Nelka, S. Exploring farmers acceptance of e-learning using Technology Acceptance Model-case study in Sri Lanka. In Proceedings of the EDULEARN15 Conference, Barcelona, Spain, 6–8 July 2015. [Google Scholar]
  101. Yumashev, A.; Ślusarczyk, B.; Kondrashev, S.; Mikhaylov, A. Global Indicators of Sustainable Development: Evaluation of the Influence of the Human Development Index on Consumption and Quality of Energy. Energies 2020, 13, 2768. [Google Scholar] [CrossRef]
  102. Sroka, W.; Dudek, M.; Wojewodzic, T.; Król, K. Generational Changes in Agriculture: The Influence of Farm Characteristics and Socio-Economic Factors. Agriculture 2019, 9, 264. [Google Scholar] [CrossRef] [Green Version]
Figure 1. E-learning model FARMER 4.0.
Applsci 11 04672 g001
Figure 2. FARMER 4.0 Moodle.
Applsci 11 04672 g002
Figure 3. Technology Acceptance Model.
Applsci 11 04672 g003
Figure 4. Technology Acceptance Model extension to validate.
Applsci 11 04672 g004
Figure 5. TAM validation.
Applsci 11 04672 g005
Figure 6. Modified TAM extension for Farmer 4.0.
Applsci 11 04672 g006
Table 1. Definitions of the external variables included in the TAM extension.
VariableDefinition
Anxiety (ANX)Negative and stressful feelings that users might experience when using the technology [29,36].
Content quality (CQ)Pertinence of the information offered by the system concerning user needs [37]; organization, relevance, and actuality [38]; and comprehensibility of the language used [39].
Experience (EXP)Previous interactions with similar systems and the accumulated knowledge [40,41,42].
Facilitating conditions (FC)Technical assistance and available resources and infrastructure that facilitate the use of technology [26].
Individual innovativeness (II)Personal inclination towards early adoption of technology [43,44].
Perceived enjoyment (PE)Degree to which the use of the system is entertaining and pleasant independently of any other consequence derived from the usage [36,45,46].
Self-efficacy (SE)User’s confidence that he/she has the knowledge and skills needed to accomplish a task using the technology and overcome any potential difficulties [47,48,49].
Social norm (SN)The extent to which significant others may encourage or deter the use of technology [20,23,28].
Table 2. Research hypothesis.
HypothesisDefinition
H1(H1a).Content quality will have a positive influence on PU
(H1b).Content quality will have a positive influence on PEOU
H2(H2a).Experience will have a positive influence on PU
(H2b).Experience will have a positive influence on PEOU
H3(H3a).Facilitating conditions will have a positive influence on PU
(H3b).Facilitating conditions will have a positive influence on PEOU
H4(H4a).Individual innovativeness will have a positive influence on PU
(H4b).Individual innovativeness will have a positive influence on PEOU
H5(H5a).Perceived enjoyment will have a positive influence on PU
(H5b).Perceived enjoyment will have a positive influence on PEOU
H6(H6a).Self-efficacy will have a positive influence on PU
(H6b).Self-efficacy will have a positive influence on PEOU
H7(H7a).Social norm will have a positive influence on PU
(H7b).Social norm will have a positive influence on PEOU
H8(H8a).Anxiety will have a negative influence on PU
(H8b).Anxiety will have a negative influence on PEOU
H9(H9a).Perceived Usefulness (PU) will have a positive influence on attitude towards using (ATT)
(H9b).Perceived Ease of Use (PEOU) will have a positive influence on attitude towards using (ATT)
H10Perceived Ease of Use (PEOU) will have a positive influence on PU
H11Attitude towards using (ATT) will have a positive influence on the Behavioral Intention to Use the e-learning tool FARMER 4.0
Table 3. Questionnaire items source.
VariableItems Source
Behavioral Intention (BI)Davis [51], Taylor and Todd [52], Gangwar et al. [53]
Attitude Towards Using (ATU)Davis [51], Fathema et al. [54], Chuah et al. [30].
Perceived Usefulness (PU)Davis [51], Chuah et al. [30], Davis et al. [55].
Perceived Ease of Use (PEOU)Davis [51], Manis and Choi [56], Venkatesh et al. [26], Teo [57].
Anxiety (ANX)Venkatesh et al. [26], Venkatesh and Bala [29], Faqih and Jaradat [58], Sánchez-Prieto et al. [59].
Content Quality (CQ)Lee and Lehto [60], Cheong and Park [61], Salloum et al. [34].
Experience (EXP)Taylor and Todd [52], Alharbi and Drew [62].
Facilitating Conditions (FC)Davis [51], Fathema et al. [54], Cheung and Vogel [63].
Individual Innovativeness (II)Agarwal and Prasad [43], Natarajan et al. [64].
Perceived Enjoyment (PE)Manis and Choi [56], Salloum et al. [34].
Self-Efficacy (SE)Sánchez-Prieto et al. [59], Lee and Lehto [60], Venkatesh [36], Lee et al. [65], Compeau and Higgins [48].
Social Norm (SN)Koenig-Lewis et al. [66], Wu and Chen [67].
Table 4. Basic information of the sample.
Characteristic FrequencyPercentage
GenderFemale2355%
Male1945%
Age20–35 years1945%
36–50 years819%
More than 50 years1536%
Education LevelLiterate w/o qualification37%
School512%
Graduate1638%
Post-Graduate1843%
Frequency of computer useHigh2457%
Moderate921%
Low614%
Sparse37%
Experience in similar systemsNo1331%
Yes2969%
Experience in agro-activitiesMore than 20 years921%
11–20 years614%
5–10 years819%
Less than 5 years1945%
Total of participants 42100.0%
Table 5. Constructs reliability and validity.
VariableItemsMeanVarianceSTDEVCAAVECR
ANX32.7142.7851.6610.9190.8600.949
ATT35.9291.0151.0020.8580.7800.914
BI35.7781.3331.1410.8320.7480.899
CQ35.6591.2591.1210.8310.7470.899
EXP15.1432.5111.5841.0001.0001.000
FC35.5951.0611.0270.7770.6920.870
II35.2382.6851.6350.9050.8400.940
PE35.5951.2341.1060.8630.7830.915
PEOU24.9442.4911.5700.9450.9480.973
PU35.7541.2831.1300.8580.7790.913
SE35.1902.2731.5070.9180.8590.948
SN35.3971.7131.3070.8440.7640.907
Table 6. Correlation between constructs and the square root of AVEs.
ANXATTBICQEXPFCIIPEPEOUPUSESN
ANX0.928
ATT−0.3070.883
BI−0.3920.8240.865
CQ−0.1700.7340.7210.864
EXP−0.4060.4220.4850.1721.000
FC−0.4100.7040.6950.7130.2920.832
II−0.5710.3590.4660.2660.6890.3060.916
PE−0.4150.7270.7720.8090.4260.6370.5630.885
PEOU−0.4850.4640.5880.4280.7760.3960.7130.6460.974
PU−0.2510.7340.7230.7230.3640.6210.5490.8340.5050.882
SE−0.5440.5030.5730.5190.6720.4730.8370.7360.7840.6870.927
SN−0.3990.7350.8540.7850.4620.6730.4340.8280.6320.7480.6160.874
Table 7. TAM Davis et al. in the context of FARMER 4.0: Structural Model.
VariableR 2 MeanSTDEVT Stat.p ValueSignificant
ATT0.5600.5930.0916.1450.000Yes
BI0.7090.7270.05712.3570.000Yes
PU0.2580.2730.1012.5530.005Yes
Table 8. Original TAM: path significance using percentile bootstrap 95% confidence interval.
PathSPCMeanSTDEVT Stat.p ValueSignificant
ATT → BI0.6270.6420.1095.7710.000Yes
PEOU → ATT0.1280.1240.1760.7260.234No
PEOU → PU0.5080.5120.1015.0230.000Yes
PU → ATT0.6750.6800.0907.4900.000Yes
PU → BI0.2650.2540.1391.9080.028Yes
Table 9. New Extended TAM: Structural Model.
VariableR 2 MeanSTDEVT Stat.p ValueSignificant
ATT0.5510.5620.0707.8660.000Yes
BI0.7320.7450.04516.2010.000Yes
PEOU0.7290.7430.06311.6050.000Yes
PU0.5830.6120.1264.6400.000Yes
Table 10. New TAM Extension: path significance using percentile bootstrap 95% confidence interval.
HResultsPathSPCMeanSTDEVT Stat.p ValueSignificant
H11AcceptedATT → BI0.6940.6970.0709.8580.000Yes
H1aAcceptedCQ → PU0.6320.6440.1175.3900.000Yes
H2bAcceptedEXP → PEOU0.4540.4520.1283.5390.000Yes
N/AN/APEOU → BI0.2740.2790.0693.9530.000Yes
H10AcceptedPEOU → PU0.2380.2370.1042.3020.011Yes
H9aAcceptedPU → ATT0.7420.7480.04715.7600.000Yes
H6bAcceptedSE → PEOU0.4800.4870.1243.8820.000Yes
Publisher’s Note: MDPI stays neutral with regard to jurisdictional claims in published maps and institutional affiliations.

