1. Introduction
The metrological investigation of sprays is of great interest for a number of technical applications such as fuel injectors or drying processes in the food and pharmaceutical industries, including spray and freeze drying, with regard to the evaporation and particle formation process. However, since it is hardly possible to track and analyze the ongoing mechanisms for a single droplet over the entire spray process, studies of the drying process of single droplets have proven to be particularly suitable. In general, single droplet experiments can be divided into techniques with and without physical contact of the experimental apparatus to the evaporating droplet. Typical contact techniques, including the sessile droplet method [
1] or suspension from a glass filament [
2], bring some disadvantages such as the lack of free rotation, bubble formation or heat conduction between the droplet and the fixture. To circumvent these problems, levitation methods such as optical levitation [
3], electromagnetic levitation [
4] and acoustic levitation via an ultrasonic field are applied. In particular, the latter method, where a liquid sample is levitated in one of the nodal points of a standing acoustic wave, which is established between an ultrasonic transducer and a reflector, has proven to be particularly suitable and is frequently used for single droplet analysis [
2,
5,
6]. This is due to its comparatively low acquisition and operating costs, as well as the fact that acoustic levitation does not require any special physical properties of the sample [
7].
The investigation of the evaporation of acoustically levitated single droplets is usually performed using imaging techniques. Here, the evaporation rate is determined by measuring the droplet diameter, via images of the drying droplet, and applying the so-called
law [
2]. According to this law, the normalized squared equivalent diameter
decreases linearly during a single droplet drying process [
8], with
being the momentary equivalent diameter and
being the initial equivalent diameter of the injected droplet. This technique is used for the analysis of pure liquid droplets [
2,
9], multicomponent droplets [
5], as well as for droplets from solutions [
6,
10]. However, the imaging procedure also has disadvantages. For example, the optical system must be calibrated in advance for absolute measurements [
2]. Furthermore, the imaging determination of the volume decrease for a complete drying of solution droplets is limited. The reason for this is that the drying progress of solutions can be divided into two phases, which are separated by the so-called critical point of drying. This point marks the formation of a solid particle surface and, therefore, no changes in volume are detectable anymore while the evaporation of the solvent proceeds [
11]. In principle, the evaporation rate can be calculated from the vertical position of the particle in the standing ultrasonic wave, but, to the best of our knowledge, this method is neither reliable nor easily reproducible [
12,
13]. To monitor the entire drying process, even after the critical point of drying, Groenewold et al. [
14] used a dew point hygrometer to measure the moisture content of the exhaust air of the levitator chamber. With this setup, they could measure water concentrations down to a few 100 ppm [
14].
In order to determine low species concentrations in general and low water concentrations in particular, tunable diode laser absorption spectroscopy (TDLAS) has proven to be a particularly suitable measurement method. For example, TDLAS has already been used to detect water concentrations down to 10 ppm in internal combustion engines [
15], for atmospheric humidity sensing [
16], for studying drying processes of wood [
17], and for water transpiration rate measurements on plant leaves [
18]. Moreover, Wunderle et al. [
19] used TDLAS in combination with acoustic levitation to investigate the mass transport between liquid pure water droplets and the surrounding gas by directly measuring the absolute concentration field around a single levitated droplet. With this in situ approach, an absorption length of only 4 cm could be achieved, resulting in a concentration resolution of 67 ppm [
19]. Typical spectral regions for the measurement of water via TDLAS are the overtone band at 1.4 µm (7140 cm
−1), the combination band at 1.8 µm (5555 cm
−1) or the first fundamental oscillation band at 2.6 µm (3850 cm
−1) [
20]. Although the combination band and the fundamental band are two and 20 times stronger than the overtone band, respectively, the latter is often used for water vapor detection as the optical components are very advanced due to the intensive usage of this band in optical telecommunication techniques [
21].
In this paper, we describe a novel approach to study the drying process of levitated single droplets of pure liquids as well as droplets of protein solutions using tunable diode laser absorption spectroscopy. To that end, we applied a self-developed TDLAS system to an acoustic levitator and measured the exhaust gas coming from the levitation chamber in terms of its water content by analyzing the 110 → 211 transition at 1369.97 nm (7299.43 cm
−1) in the 1.4 µm (7140 cm
−1) overtone band. This extractive approach of analyzing the exhaust gas of an acoustic levitator enables the use of a multipass cell of the Herriott type [
22] to extend the absorption length to a path length of 18 m. This allows the detection range to be increased and the lowest possible water content to be determined, especially towards the end of the drying process. With this newly developed setup, we can investigate the whole drying process of levitated microdroplets from pure water as well as from protein solutions, including after the critical point of drying, and can determine the water concentration in the exhaust gas with a resolution of 1.7 ppm.
2. Materials and Methods
As the basic principle of TDLAS has been explained in the literature in detail [
15,
16,
18,
20,
23], only the basics of this technique will be briefly reviewed here. TDLAS is based on the detection of the molecule-specific attenuation of a fast and continuously tunable, spectral narrowband laser beam as it passes through the measurement volume to be investigated. The laser wavelength is thereby tuned by the periodic modulation of the operating current over an isolated molecular absorption line [
24]. In our case, for measuring the amount of water in our drying gas from a levitated droplet, we have chosen the 110 → 211 transition at 1396.97 nm (7299.43 cm
−1) in the 1.4 µm (7140 cm
−1) overtone band. This well-described transition has already been used previously in several publications [
20,
21,
25] and is free from possible spectral interference, especially by other water lines or CO2. To describe the attenuation of the laser light caused by the water molecules, an extended version of the Lambert–Beer law can be used [
23]:
Here,
is the initial intensity,
the detected intensity after passing the absorbing medium of absorption length
, and
the number density of absorbing molecules. The absorption line is characterized by the temperature-dependent line strength
and the area-normalized shape function
, which is centered at the wavelength of
. Furthermore,
and
consider spectrally broadband transmission losses and possible background radiation hitting the detector, respectively. By resolving equation (1) for the absorber number density
and spectrally integrating over the absorption line profile, the absorber density can be calculated by [
18]:
When looking at Equation (2), it can be seen that no calibration of the measurement system with a reference gas is necessary, since all quantities are either measured by the detector (
, come from a spectroscopic database (
such as HITRAN16 [
26], or are derived from the experimental conditions or supporting measurements (
). In particular, the dynamic tuning coefficient of the laser
is of great importance as normalization of the line area is only valid in the wavelength domain. Thus, the absorption signal has to be transferred from the time domain to the wavelength domain while considering the dynamic tuning behavior
of the diode laser [
27]. In our case, the dynamic tuning coefficient is determined continuously by evaluating the wavelength-dependent transmission through a Fabry–Pérot etalon [
20]. Based on the absorber number density
, the water mole fraction
can be calculated by applying the ideal gas law. Additionally, the water mass flow
in the exhaust gas can be derived by taking the nitrogen volume flow into account [
23]. The initial volume
of the injected droplet can be calculated by integrating the measured mass flow over the entire evaporation process.
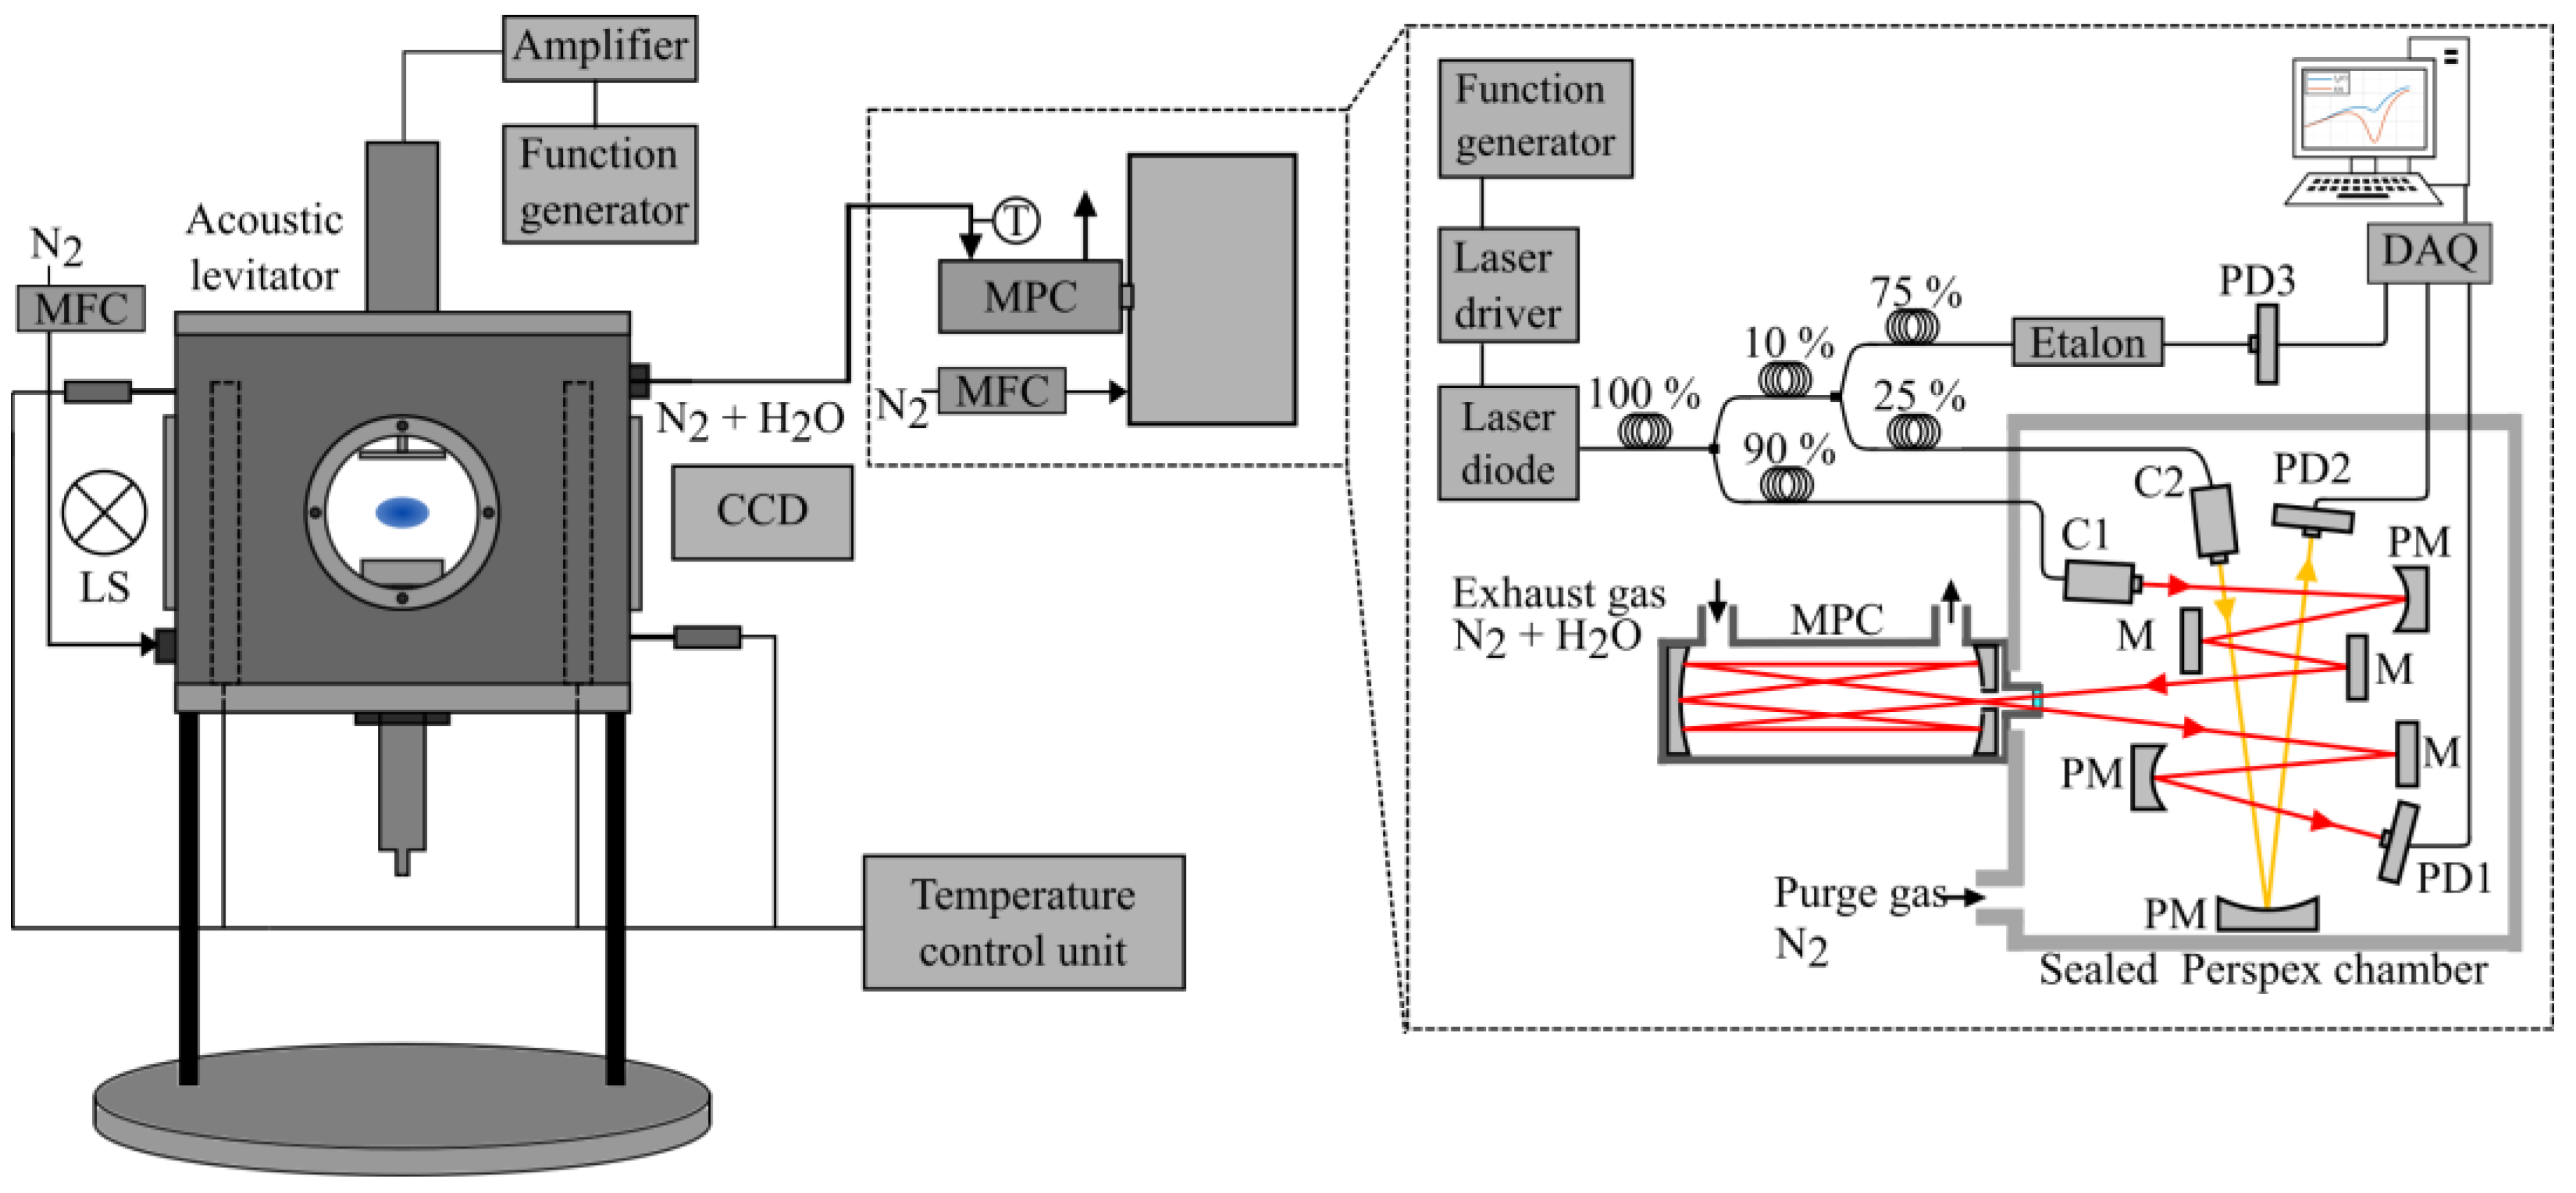
Using this principle, we developed our TDLAS-based hygrometer for the investigation of the drying process of acoustically levitated droplets. The general setup of the hygrometer applied to the acoustic levitator is depicted in
Figure 1. In order to carry out the evaporation experiments of the microdroplets under defined conditions, the acoustic levitator (Borosa Acoustic Levitation L200, Bochum, Germany) is surrounded by a heating chamber consisting of eight heating cartridges and two type-K thermocouples to adjust a constant drying temperature. The acoustic levitator is controlled by a function generator (GW Instek AFG-2005, New-Taipei City, Taiwan) and an amplifier (Keysight Technologies 33502A, Santa Rosa, CA, USA) and levitates the droplets at a working frequency of around 39 kHz, depending on the set drying temperature. During the single droplet drying, the heating chamber is flushed with a stream of nitrogen (Linde Nitrogen 5.0, Pullach, Germany) at a flow rate of 1 nL/min. The exhaust air from the levitation chamber is directed to the TDLAS hygrometer. To monitor the evaporation process, images of the drying droplets are acquired using a shadowgraphy setup, consisting of a light source (LS, SCHOTT KL 1500 electronic, Mainz, Germany) for the back light illumination of the droplet and a CCD camera (CCD, JAI AG CV-M4, Copenhagen, Denmark).
The central part of the hygrometer is the single mode fiber-coupled diode laser (NTT Electronics NLK1B5EAAA, Yokohama, Japan) with its emission wavelength centered around the 110
211 transition at 1396.97 nm. The distributed feedback (DFB) laser is mounted on a Peltier cooled 14-pin butterfly laser mount (Arroyo Instruments 205 TEC Butterfly LaserMount, San Luis, CA, USA), and is temperature-stabilized and powered by a combined laser driver (Arroyo Instruments 6305 ComboSource, San Luis, CA, USA). In order to tune the laser across the absorption line, a function generator (Fluke Calibration Type 271, Eindhoven, The Netherlands) supplies a triangular current modulation from 30 mA to 80 mA at 26 °C diode temperature with a frequency of 2 Hz. The emitted and fiber-coupled laser light is then split approximately into 90%, 7.5% and 2.5% fractions by a series connection of two 1 × 2 fiber optical splitters (Thorlabs TW1430R2A1 and TW1430R3A1, Newton, NJ, USA). The 7.5% part is coupled into a fiber-Fabry–Pérot interferometer (Etalon; Micron Optics FFP-I, Roanoke, VA, USA) and the transmitted light is detected by an amplified InGaAs-detector (PD3; Thorlabs PDA10CF-EC, Newton, NJ, USA) to determine the dynamic tuning coefficient
of the laser. The remaining two fractions of 90% and 2.5% are guided into a sealed Perspex chamber, where they are transferred into the free space by two fiber collimators (C1, C2; Thorlabs CFC5-C (C1) and F260APC-C (C2), Newton, NJ, USA). The Perspex chamber is continuously purged with nitrogen (Linde Nitrogen 5.0, Pullach, Germany), but it is almost impossible to keep it completely free of water. Therefore, the latter part, illustrated as orange line in
Figure 1, is used as a reference signal
to monitor the remaining amount of water vapor in the free space region inside the Perspex chamber, allowing for a correction of the measured water mole fractions in the MPC by the corresponding amount. After an absorption length of 40 cm through the Perspex chamber, the light is detected by an amplified InGaAs-detector (PD2; Thorlabs PDA10CF-EC, Newton, NJ, USA). The 90% fraction, illustrated as red line in
Figure 1, is used to determine the amount of water in the exhaust gas coming from the acoustic levitator. To that end, the laser beam is guided by a combination of mirrors (M; PM) into an astigmatic multipass cell of the Herriott type (MPC; Aerodyne Research Inc. AMAC-36LW, Billerica, MA, USA). This cell, with a mirror spacing of 20 cm and a volume of 300 mL, enables absorption lengths of 18 m or 36 m depending on the angle of incidence. In our case, with an angle of incidence of 2.6°, an absorption length of 18 m is realized due to the total number of reflections being 90. The exiting laser light is focused analogously onto an amplified InGaAs-detector (PD1; Thorlabs PDA10CF-EC, Newton, NJ, USA) via a parabolic mirror. The amplified signals from the three detectors (PD1-3) are fed via a connector block (National Instruments CB-68 LP, Austin, TX, USA) into an AD converter card (National Instruments PCIe-6351, Austin, TX, USA) connected to a personal computer. In order to minimize the influence of the unavoidable adsorption of water on surfaces, appropriate materials were used and constant experimental conditions were ensured. For example, hydrophobic PTFE tubing was used for the connection between the levitator chamber and the MPC, and the connections were kept as short as possible. All further, not explicitly mentioned optics and glass fibers were optimized for the specific wavelength.
For the measurements, which are all carried out at ambient pressure, the levitation cell is first set to the desired drying temperature at a constant nitrogen flow rate of 1.0 nL/min until a stationary condition regarding the cell temperature and remaining amount of water vapor is reached. Simultaneously, the Perspex chamber is purged with nitrogen at a flow rate of 1.0 nL/min. At reaching stationary conditions a measurement of the background signal
is carried out, since the drying gas flow is not completely free of water. Subsequently, a droplet is injected by hand into the acoustic levitator using a microvolume syringe, and the measurement signal
is recorded continuously over the whole drying process. In order to obtain the water mole fraction of the evaporating droplet from
, it is necessary to correct the absolute measured water mole fraction by the corresponding proportions of (i) the remaining water mole fraction at the beginning of the measurement (background signal
) and (ii) the water mole fraction in the Perspex chamber in front of the MPC (reference signal
). The background water mole is a constant value determined by 30 consecutive averaged background signals
prior to a droplet drying experiment, whereas the water mole fraction in the Perspex chamber is continuously co-determined via the reference signal
. The injection volume of the pure water and protein solution droplets is about 4 µL, which is determined gravimetrically with an accuracy of 1.7%. For the drying of the protein solution droplets, the model protein lysozyme was used. This protein was chosen because it has already been used several times in the literature to investigate different drying processes [
28,
29]. The samples were freshly prepared by dissolving a corresponding amount of lysozyme, in distilled water, to a concentration of 10 wt%.
Figure 2 shows typical unprocessed single scan detector signals from the measurement path through the multipass cell (blue) at different times of the drying process (drying time: 250 s, 500 s, 750 s and 1000 s), the reference path through the Perspex chamber (red), the interference signal from the Fabry–Pérot-etalon (yellow), as well as a simulated baseline (black), to demonstrate the baseline slope caused by the triangular laser current modulation.
The etalon signal shows the transmission maxima caused by the wavelength modulation of the laser and clearly shows an increase in the temporal occurrence of the interference maxima. The spectral spacing of the maxima results from the free spectral range (FSR), which is determined by the design of the etalon and is 0.800 GHz (approx. 0.005 nm) in this work. Knowing the wavelength at the beginning of the modulation, the emission frequency of the DFB laser can be determined at the points in time where the maxima occur. By fitting a model equation to these wavelength markers using the Levenberg–Marquardt algorithm [
30], the wavelength can be determined at any point in time during the scan.
The single scan measurement signals of the multipass cell and the reference signal of the Perspex chamber clearly show the dominant baseline slope due to the triangular amplitude modulation of the laser by the current tuning. The difference in the total transmission of the signals is due to the different absorption paths as well as broadband scattering and effects of optical components (mirrors, fibers and windows), but is taken into account in the evaluation for each absorption profile. Furthermore, the signals show differently pronounced water absorption in the range of 1370 nm, depending on the respective water concentration in the exhaust air of the acoustic levitator. To extract the H2O absorption line area from the raw signal, a polynomial baseline (including all disturbing effects mentioned before), as well as a Voigt line shape, was fitted to the measured spectra using a non-linear Levenberg–Marquardt algorithm [
31,
32,
33]. In order to determine the Voigt line shape, we chose an empirical approximation proposed by Liu et al. [
31], which describes the Voigt profile as the weighted sum of a Lorentzian and a Gaussian function as follows:
In this model equation, the weighting factors
and
are third order polynomials and can be calculated with the dimensionless profile parameter
using Equations (4)–(6).
The profile parameter
is computed from the half width at half maximum (HWHM) of the Doppler broadened, Gaussian line shape
, and the HWHM of the collision broadened, Lorentzian line shape
.
denotes the HWHM of the resulting Voigt profile and was approximated using the method of Olivero and Longbothum [
34].
From the derived line areas, the absorber number densities are calculated by applying the extended Lambert–Beer law (Equation (2)). The temperature-dependent line strength
was taken from HITRAN16 [
26]. In order to derive the mole fractions from the determined number densities via the ideal gas law, the gas temperature was measured and the gas pressure was assumed to be constant at 1 atm (atmospheric conditions, 1013.25 hPa). This evaluation procedure has already been used several times in the literature and is described in detail [
15,
16,
20].
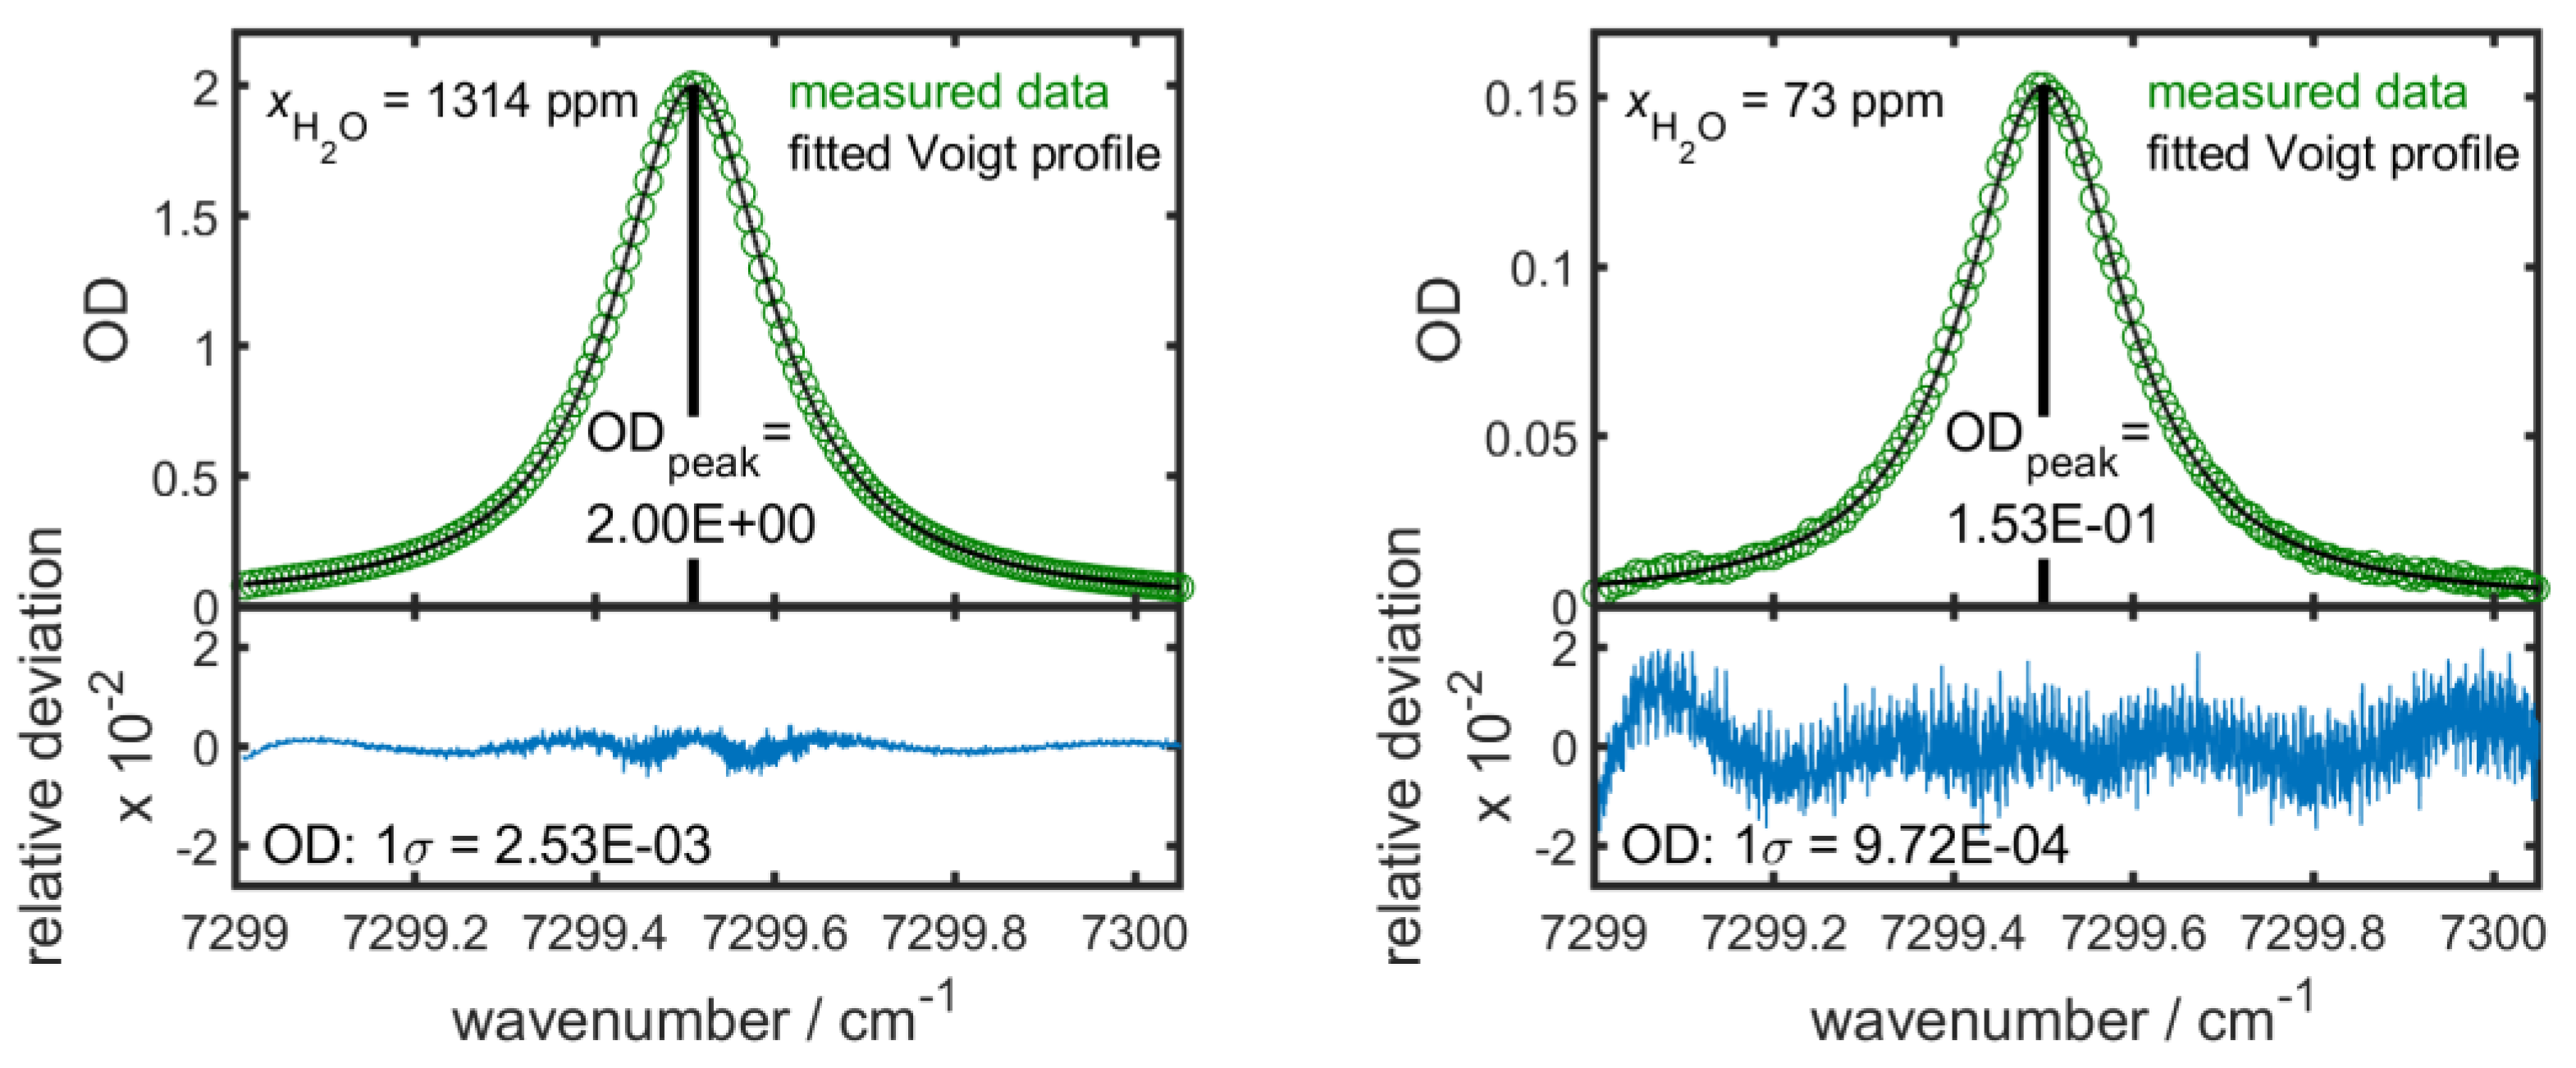
Figure 3 shows the extracted water absorption line of a single measured scan, and the fitted data for a high water concentration (left) and for a low water concentration (right), as they occur during a single droplet drying experiment, plotted as optical density (
) over a linear wavenumber scale, after the removal of amplitude modulation and correction for offset and transmission fluctuations.
The two water absorption lines in
Figure 3 show good agreement between measured and fitted data. The relative deviation between the measured absorption line profile and the fitted Voigt profile is plotted under the absorption profiles. Here, a larger deviation can be seen at lower concentrations due to stronger noise. In addition, small systematic residual deviations can be seen in both curves. These deviations have already been observed and discussed by Bucholz et al. [
23] and are due to the Voigt profile used, which potentially does not optimally reproduce the absorption line. Applying higher-order line models such as the Galatry model or the speed-dependent Voigt profile might further reduce the residual [
35,
36]; however, the required spectral line parameters for solving these models are not yet available in the corresponding spectral line databases [
23].
From
Figure 3, the signal-to-noise ratio (SNR) can be calculated for every scan where the signal is defined as the peak absorption
) and the noise is defined by the standard deviation (
of the absolute residual. This leads to SNR (
values of 791 and 154 for high and low water vapor concentrations, respectively. Dividing the measured water mole fractions of 1314 ppm and 73 ppm by the calculated SNR, a single scan H
2O resolution of 1.7 ppm and 0.47 ppm, or a path length and measurement bandwidth normalized resolution of 21.6 ppm m Hz
−0.5 and 6.0 ppm m Hz
−0.5, can be derived for high and low concentrations, respectively.
To assess the temporal stability of the measurement system and the evaluation method, 100 consecutive scans were detected under constant conditions and evaluated. To cover the expected measuring range for the single droplet drying experiments, the measuring system was flushed with dehumidified air from the house mains (upper detection range) and with pure nitrogen (lower detection range). For the upper detection range, this results in an average water mole fraction of 1259 ppm with a standard deviation of 1.0 ppm, whereas a mean water mole fraction of 17 ppm with a standard deviation of 1.0 ppm was determined for the lower detection range. The maximum possible water mass fraction that can be detected with the present setup is 2775 ppm with a single scan SNR of 220.
3. Results and Discussion
As an initial application of the TDLAS hygrometer, we investigated the drying process of an acoustically levitated droplet of pure distilled water. The drying experiment was performed at a drying temperature of 60 °C at a constant nitrogen flow rate of 1.0 nL/min. For the manual injection of the droplet into the acoustic levitator, the heating chamber had to be opened. In order to prevent, to the greatest possible extent, the ambient air from entering the levitator and the MPC, the connection between the levitator chamber and the MPC was interrupted by a valve. After the droplet was successfully levitated, the valve was opened and the TDLAS measurements were performed at a laser scan frequency of 2 Hz.
Figure 4 shows the results for the measured water mass flow from the exhaust gas of the droplet drying process and the normalized squared equivalent radius calculated from the initial droplet volume (top left), the measured water concentration in the Perspex chamber (bottom left) and images of the levitated droplets at different stages of the drying process (right).
The steep rise of the water mass flow in
Figure 4a marks the opening of the valve between the levitation chamber and the MPC. The mass flow increases within a few seconds until it reaches an almost constant level of approx.
. The slight fluctuations at around 100 s, 200 s and also 280 s are due to the levitation process. The distance between the ultrasonic transducer and the reflector must be optimized from time to time to ensure a stable levitation process and to prevent the droplet from falling out. This process influences the shape of the droplet and, therefore, the size of the droplet’s surface, which is immediately noticeable in the detected mass flow. The different shapes that a droplet can take during a drying process can also be seen in
Figure 4b on the right-hand side in the top row. After about 290 s, a noticeable decrease in the mass flow and, therefore, a decrease in the drying speed can be observed. This constant decrease in mass flow continues until approx. 600 s, and then a second reduction in the mass flow takes place. From this point on, the droplet is completely evaporated, and the remaining water vapor is slowly flushed out of the levitator chamber (see
Figure 4b, bottom row). By integrating the measured mass flow over the drying time, an initial droplet volume of 4.17 µL can be calculated (as described in the section before) for the injected pure water droplet. Thus, the measured volume is about 4.3% higher than the injected volume. This slight deviation is due to the injection process, as the levitator chamber is opened during this process and the ingress of ambient air cannot be completely avoided. The water vapor concentration in the free space part in the Perspex chamber remains constant throughout the entire drying process. Starting from this initial droplet volume of 4.17 µL, the normalized squared equivalence radius
and its evolution over the drying time can be calculated (see green curve,
Figure 4a). Considering the evaporation process of the levitated droplet between 50 s and 550 s, it can be seen that this evaporation process can be adequately qualitatively described by the
law, which states that the normalized squared equivalent radius decreases linearly during the drying of single droplets [
8]. However, since further water is detected in the exhaust gas of the chamber even after complete evaporation of the droplet, the normalized squared equivalent radius does not assume the value zero after completion of the evaporation, but continues to decrease with a smaller gradient. In this part of the curve, visualized as a dashed green line, the graph should not be given a physical interpretation; it is provided only for completeness. It is important to note that the graph of the normalized squared equivalent radius does not reflect the instantaneous radius, but this curve is used to demonstrate that the drying process can be described by the
law despite the droplet deformations that occur.
Analogous to the drying of the pure water droplets, the drying experiments of the protein solutions were carried out. The results for the measured water mass flow from the exhaust gas of the protein solution droplet drying process and the normalized squared equivalent radius calculated from the initial droplet volume (top left), the measured water concentration in the Perspex chamber (bottom left) and images of the levitated droplets at different stages of the drying process (right) are shown in
Figure 5.
The measured water mass flow shows a sharp increase directly after opening the valve and then stays almost constant, as with the pure water droplet shown above. The prominent peak after reaching the plateau is due to the readjustment of the levitator. In comparison to the pure water droplet, a decrease in the mass flow can be observed in the protein solution droplet from around 200 s. This first decrease is due to the start of the formation of a protein shell, which can be seen on the lower droplet surface in the image of the droplet at 200 s in
Figure 5b (first row, third image). From then on, as the formation of the protein shell continues, the mass flux further decreases until a sharp drop in mass flux occurs at about 450 s. This steep drop marks the critical point of the drying process, where a complete protein shell is formed and changes in the volume of the droplet are no longer detectable (see bottom row,
Figure 5b). These results agree very well with the observations of Schiffter and Lee [
13], who investigated the evaporation behavior and particle formation process of acoustically levitated droplets from solutions. At about 550 s, a further decrease in the mass flow can be seen, where we assume the particle to be completely dried, and the remaining water vapor in the levitation chamber is slowly flushed out. Analogous to the pure water droplet, an initial droplet volume of 4.15 µL and the normalized squared equivalent radius can be calculated for the levitated protein solution droplet, visualized as a green curve in
Figure 5a. After opening the valve, a linear decrease in the normalized radius can be observed up to the critical point at about 450s, which also corresponds qualitatively to the
law. Seemingly, there is a further decrease also after the critical point, where a dried particle with a constant volume and, therefore, a constant droplet radius is expected. This effect is a result from the calculation from the further detected mass flow as the levitator chamber is flushed out. In this part of the curve, the radius should not be given a physical interpretation; it is provided only for completeness.
In extension of these measurements, further drying experiments of droplets from identical protein solutions were carried out at drying temperatures of 40 °C and 80 °C, respectively. In addition to the mass flow at 60 °C (blue), the analogously determined mass flows at the other drying temperatures of 40 °C (yellow) and 80 °C (red) (top) as well as the corresponding normalized squared equivalent radii (bottom) calculated from the initial droplet volumes are shown below in
Figure 6.
The general features of the drying behavior are also evident at other drying temperatures. It can be clearly seen with drying at 80 °C that, compared to drying at 60 °C, a stronger increase takes place after the valve is opened and a higher maximum mass flow is achieved. There is a short region of high flow rates with a somewhat fluctuating behavior, which is due to the less stable levitation and the necessity of continuous readjustments of the levitator; this is unavoidable at higher temperatures. Due to this faster drying, there is a sharp decrease in the mass flow after about 250 s, which corresponds to reaching the critical point. Then, a change in mass flow can be observed as well. From about 400 s onwards, it can be assumed that the droplet is completely dry and the levitator chamber is flushed out. The lower drying temperature of 40 °C (yellow) results in a smaller rise and lower mass flow rates compared to the higher temperatures. The mass flow behavior is almost constant over the first 500 s of drying and then decreases slightly until the critical point of drying at about 800 s is reached. The steep decrease in the mass flow is much smaller compared to the higher temperatures and there is a further decrease in the mass flow shortly thereafter. From this point on, again the particle is completely dried and residual water is flushed out from the chamber. The measured volumes of the three dried droplets are all in the same range, with the smallest volume being measured at the lowest drying temperature of the performed experiments. The reason for this could be the quicker injection process of the droplet into the levitator chamber, as a more stable levitation is observed at lower temperatures. This behavior is also evident when looking at the curves as a whole, as the least amount of readjustment is required at 40 °C, resulting in the smoothest curve. Looking at the curves of the normalized squared equivalence radius of the different drying temperatures (
Figure 6 bottom), a linear decrease, similar to the one at 60 °C drying temperature, can also be seen at 80 °C and 40 °C until the critical point is reached, which is qualitatively explained by the
law. As the drying temperature decreases, a smaller gradient can be observed, which results in a significantly slower occurrence of the critical point. However, at lower evaporation temperatures, it is evident that more water has to evaporate from the droplet to reach the critical point of the drying process. As with the drying at 60 °C described above, the further decrease in the radius after reaching the critical point results from the calculation of the further detected mass flow and, therefore, the radius in the dashed part of the curves should not be interpreted physically.
In order to evaluate the reproducibility of the developed measuring system,
Figure 7, below, shows the measured mass flows (top) and the calculated normalized squared radii of equivalence (bottom) of three dried protein solution droplets at a drying temperature of 80 °C.
When looking at the mass flows, it becomes clear that they correspond very well both qualitatively and quantitatively for all three drying processes, which indicates the good reproducibility of the single droplet drying experiments. However, the influence of the levitation process on the droplet and, thus, on the drying process is also evident here. Levitation always requires optimization of the levitation conditions, which affects the shape of the droplet and, consequently, the droplet surface, and is reflected in the detected mass flow. The deviations of the determined initial volumes of the droplets are due to the injection process, as described above, which needs to be optimized in the future. This good reproducibility is even more evident in the curves of the normalized squared radii of equivalence (
Figure 7 bottom). As described above, the curves should only be given a physical interpretation in the area of the solid lines. Here, all three drying experiments show an almost identical course of the radius, which speaks for constant experimental conditions with regard to drying temperature and initial droplet volume.


