
Fatigue Design of Steel Bridge Deck Asphalt Pavement Based on Nonlinear Damage Accumulation Theory

1
School of Transportation and Civil Engineering, Nantong University, Nantong 226019, China
2
Intelligent Transportation System Research Center, Southeast University, Nanjing 210096, China
3
Medical School, Nantong University, Nantong 226019, China
*
Author to whom correspondence should be addressed.
Appl. Sci. 2021, 11(12), 5668; https://doi.org/10.3390/app11125668
Submission received: 8 May 2021
/
Revised: 10 June 2021
/
Accepted: 14 June 2021
/
Published: 18 June 2021
Abstract
:Based on the nonlinear damage theory, this paper aims to explore the fatigue performance of steel bridge deck asphalt pavement under multistage fatigue load. Manson–Halford cumulative damage model and the modified model were introduced to describe loading sequence effects, and interactions between multiple loads were represented in stress ratio. The fatigue life prediction method of steel bridge deck asphalt pavement was put forward, considering loading sequence effects and load interactions. The fatigue design of steel bridge deck asphalt pavement was investigated with the fatigue life prediction model. The effects of different load levels and loading sequence on the fatigue design parameters stress ratio of steel bridge deck asphalt pavement were studied. The design results were compared with experimental results, and the prediction results were based on traditional Miner’s theory. The analysis results showed that the fatigue life prediction method based on the nonlinear cumulative damage theory can effectively design and analyze the fatigue characteristics of asphalt pavement of steel bridge deck with high accuracy and reliability. The fatigue life prediction model of steel bridge deck asphalt pavement can well reflect loading sequence effects and load interactions. In addition, the design model has relatively few parameters; therefore, it can be applied to practical engineering design.
1. Introduction
With the rapid development of highway construction worldwide, the continuous construction of expressways and long-span steel bridges has become a technical problem in highway construction. Asphalt mixture has excellent pavement performance, which has been widely used in the pavement engineering of high-grade highway and steel bridge decks, in which microcracks will appear after the action of load and gradually expand with the periodic action of the load because of rich micro defects, eventually leading to the damage of asphalt materials [1,2,3]. Fatigue damage and cracking of asphalt mixtures have become major diseases affecting service functions of bridges [4]. In recent years, the deck pavements of some expressways have been damaged, especially in super-large bridges, which are important traffic hubs in the traffic network. Closed traffic for maintenance will seriously affect traffic functions and produce adverse social impact [5,6]. Therefore, the study on fatigue damage characteristics of steel bridge deck pavement system has a certain theoretical value and engineering significance [7,8,9].
During the design phase, stress ratio can be obtained through fatigue life analysis, and quality and inspection grades of asphalt pavement are determined combined with safety requirements [10], among which the determination of stress state grade is the most critical step and a key link of fatigue design [11]. How to evaluate and analyze the fatigue strength of steel bridge deck asphalt pavement effectively, obtain the fatigue stress parameters for analysis reasonably, and calculate the actual stress ratio are the primary tasks for fatigue design of steel bridge deck asphalt pavement structure [12]. In the design and analysis of fatigue life of steel bridge deck asphalt pavement, the method based on the S–N curve, combined with fatigue cumulative damage theory, is one of the two main categories of methods currently applied [13]. As for its prediction, the analysis of fatigue damage accumulation is one of the key problems. Palmgren–Miner’s linear cumulative damage theory (Miner’s rule) is used in most fatigue assessment systems for steel bridge deck asphalt pavement nowadays, which is relatively simple in calculation and has been widely used in engineering [14]. However, Miner’s rules have ignored the loading sequence of cyclic loads and the influence between loads, which cannot guarantee the accuracy of fatigue life prediction, which often cannot meet the engineering requirements [15]. A large number of test data and engineering practices have also shown that loading sequence effects and load interaction effects cannot be ignored in the fatigue life prediction [16,17]. At present, most studies on fatigue characteristics of steel bridge deck asphalt pavement have ignored the loading sequence of cyclic loads and the influence between loads [18,19,20]. Therefore, when the method design based on the S–N curve combined with fatigue cumulative damage theory is adopted, it is necessary to conduct a deeper study on the fatigue cumulative damage law, which is an important topic, and to try to adopt the nonlinear cumulative damage theory or improve the Miner’s rules to make up for its deficiencies [21,22].
Based on the nonlinear cumulative damage theory, there are many theoretical models for fatigue design analysis, which mainly include nonlinear damage accumulation theory based on damage curve method, nonlinear damage accumulation theory based on continuous damage mechanics, nonlinear damage accumulation theory based on energy method, nonlinear damage accumulation theory based on physical property degradation, nonlinear damage accumulation theory considering load interactions, etc. [23]. Manson and Halford have presented the relationship between crack length and cycle ratio, as well as the calculation method of parameters, so as to establish a relatively complete Manson–Halford model [24,25]. The model can describe loading sequence effects well, requiring fewer material parameters, which can predict the fatigue life of steel bridge deck asphalt pavement with complex loading states. However, the model does not consider load interactions, and therefore, the accuracy of prediction cannot be guaranteed. In the current related studies considering load interactions, most of the existing nonlinear cumulative damage theoretical models are expressed in stress ratio, such as the Freudenthal–Heller model, Corten–Dolan model, etc. How to describe loading sequence effects and load interactions reasonably, establish a reasonable fatigue analysis model, and give more accurate analysis and judgment on fatigue problems in steel bridge deck asphalt pavement structure are part of an engineering problem that researchers have tried to solve for a long time [26,27]. At present, there are relatively few nonlinear cumulative damage models considering loading sequence effects and load interactions, which are even fewer in terms of those applied directly to fatigue design.
In view of the above considerations, Manson–Halford cumulative damage theory was introduced to solve fatigue design problems of steel bridge deck asphalt pavement, and a fatigue design model of steel bridge deck asphalt pavement based on the nonlinear damage theory was established by considering loading sequence effects and load interactions [28,29,30]. The fatigue design of typical steel bridge deck asphalt pavement under multistage loading was carried out, and the design results were compared with those based on traditional Miner’s theory. It is verified that the fatigue design model of steel bridge deck asphalt pavement can effectively design the structural fatigue, which can analyze loading sequence effects and load interactions as well, with high accuracy and high credibility.
2. Nonlinear Damage Theory
At first, Marco and Starkey proposed the nonlinear damage accumulation theory based on the damage curve method. Manson and Halford established the fatigue cumulative damage model (Manson–Halford model, also known as the M–H model), which was obtained
with
the damage curve method. In this model, the relationship between crack length and cycle ratio can be defined as
below.
where
is the crack length,
is the characteristic defect length, at the moment of impending cracking,
is the number of cycles to reach a certain crack length, and is the fatigue life corresponding to load levels.
The damage degree can be expressed as the functions of
crack length and cycle ratio as follows:
where is the damage degree and at the moment of impending cracking.
Based on the parameters and damage theories above, the cumulative damage is shown in
Figure 1
due to multistage loading. First, the stress level was applied for times. Then, another stress level was applied instead of the stress level , followed by times. The total cumulative damage can be deduced as follows.
According to the damage characteristics of the material, the damage should be equal at points A and B, as shown in
Figure 1.
Based on Equation (2), it can be calculated that the damage corresponding to the stress level acting on is equivalent to the damage corresponding to the stress level acting on , which can be expressed as follows:
When the stress level
acts on
times, the total damage amount can be written as
Similarly, corresponding to the action of load level 3 and above, its cumulative damage can be expressed as
follows:
Consequently,
when the cumulative damage
reached the critical value, fatigue damage occurred to the material.
When the stress levels at all levels were the same, the fatigue life of the corresponding stress at all levels
was also the same, and then Equation (6) degenerated into a linear cumulative damage model.
3. Calculation of Equivalent Stress
Based on the linear Miner’s theory, the calculation formula of equivalent stress can be derived as follows:
where is the number of graded stress cycles; is the number of cycles required; is the equivalent number of cycles; is the material fatigue parameters; is the equivalent stress; is the reverse slope of the S–N curve.
The calculation of equivalent stress can be deduced as follows:
where is various stress levels as the range of stress variation.
Miner’s cumulative damage is independent of the loading sequence, which is similar to the calculation of equivalent stress according to Equation (9). However, many experiments have shown that the damage is related to the loading sequence. When the loading sequence of first a low load and then a high load is adopted, the low load has a certain training effect, and the fatigue life can be increased. When the sequence of first a high load and then a low load is adopted, the high load has the damaging effect, the crack will form in advance, and the low load in the later period will make the crack propagate and shorten the fatigue life. Therefore, in the fatigue design, the loading sequence effects should be considered, and the design should be carried out according to the nonlinear cumulative damage model.
The M–H model can well consider the loading sequence effects. Combined with Equation (7) and the cumulative damage model shown in Equation (6), the calculation formula based on nonlinear cumulative damage can be achieved after loading classification as follows [18]:
Correspondingly, the calculation formula for the equivalent stress
at all levels can be expressed through the following derivation of Equation (8):
Due to , Equation (11) can be expressed as
The final equivalent stress calculation formula can be obtained after sorting out Equation (12).
Define the exponent term
as follows:
Equation (13) can be deduced as
Based on
the
M–H model, Equation (15) gives the calculation formula of equivalent stress calculated by nonlinear cumulative damage theory. In the formula, parameter C is the constant corresponding to the S–N curve.
Equation (15) for the calculation of the equivalent stress only considers the loading sequence effects and does not consider load interactions. Therefore, it is difficult to guarantee the accuracy of its prediction analysis. In order to improve the accuracy of the analysis further, the stress ratio is adopted to reflect load interactions. The modified M–H model method in reference [25] is introduced to modify the exponential parameter . After that,
Equation (14) can be shown as
By substituting Equation (16) into Equation (15), the equivalent stress calculation formula based on the modified M–H model can be obtained as follows:
Based on the modified M–H model, Equation (17) is the calculation formula for the equivalent stress calculated by the nonlinear cumulative damage theory. In this model, if the load and damage change, the fatigue damage will accumulate with nonlinear characteristics. When the loading sequence changes, the cumulative damage also changes. Therefore, the equivalent stress obtained by Equation (17) takes both the loading sequence effects and load interactions into account.
4. Fatigue Performance Estimation
When designing the fatigue life of steel bridge deck asphalt concrete pavement, the stress states can be calculated directly based on the nominal stress for typical pavement structures [31]. In the design analysis, the two most critical steps are to calculate the fatigue strength value under a given number of cycles and the actual stress variation range under the fatigue load. According to these two calculated values, strength checking, stress ratio calculation, and stress state grade evaluation can be carried out further. With the above derivation, the specific steps for fatigue life design based on the nonlinear damage accumulation theory are as follows.
- (1)
- (2)
- Calculate the actual stress variation range under fatigue load, namely, the equivalent stress variation range
- (3)
- Check the strength based on the fatigue strength value and the equivalent stress range
- (4)
- Calculate the stress ratio of asphalt pavement structure from the fatigue strength value and the equivalent stress variation range
- (5)
- Determine the grade of stress states according to the stress ratio.
5. Engineering Application Examples
The fatigue life cases in the literature [31] were adopted, and the structure shown in Figure 2 is as follows: the thickness of steel bridge deck motherboard and asphalt pavement is T1 = 14 mm and T2 = 50 mm, the width of the motherboard is W = 100 mm, and the length is L = 380 mm. The structure was subjected to variable amplitude loading, and its stress grade, acting frequency, and design life are shown in Table 1. This paper aimed to design and analyze the fatigue life of asphalt pavement structure, calculate its stress ratio, and determine its stress state grade.
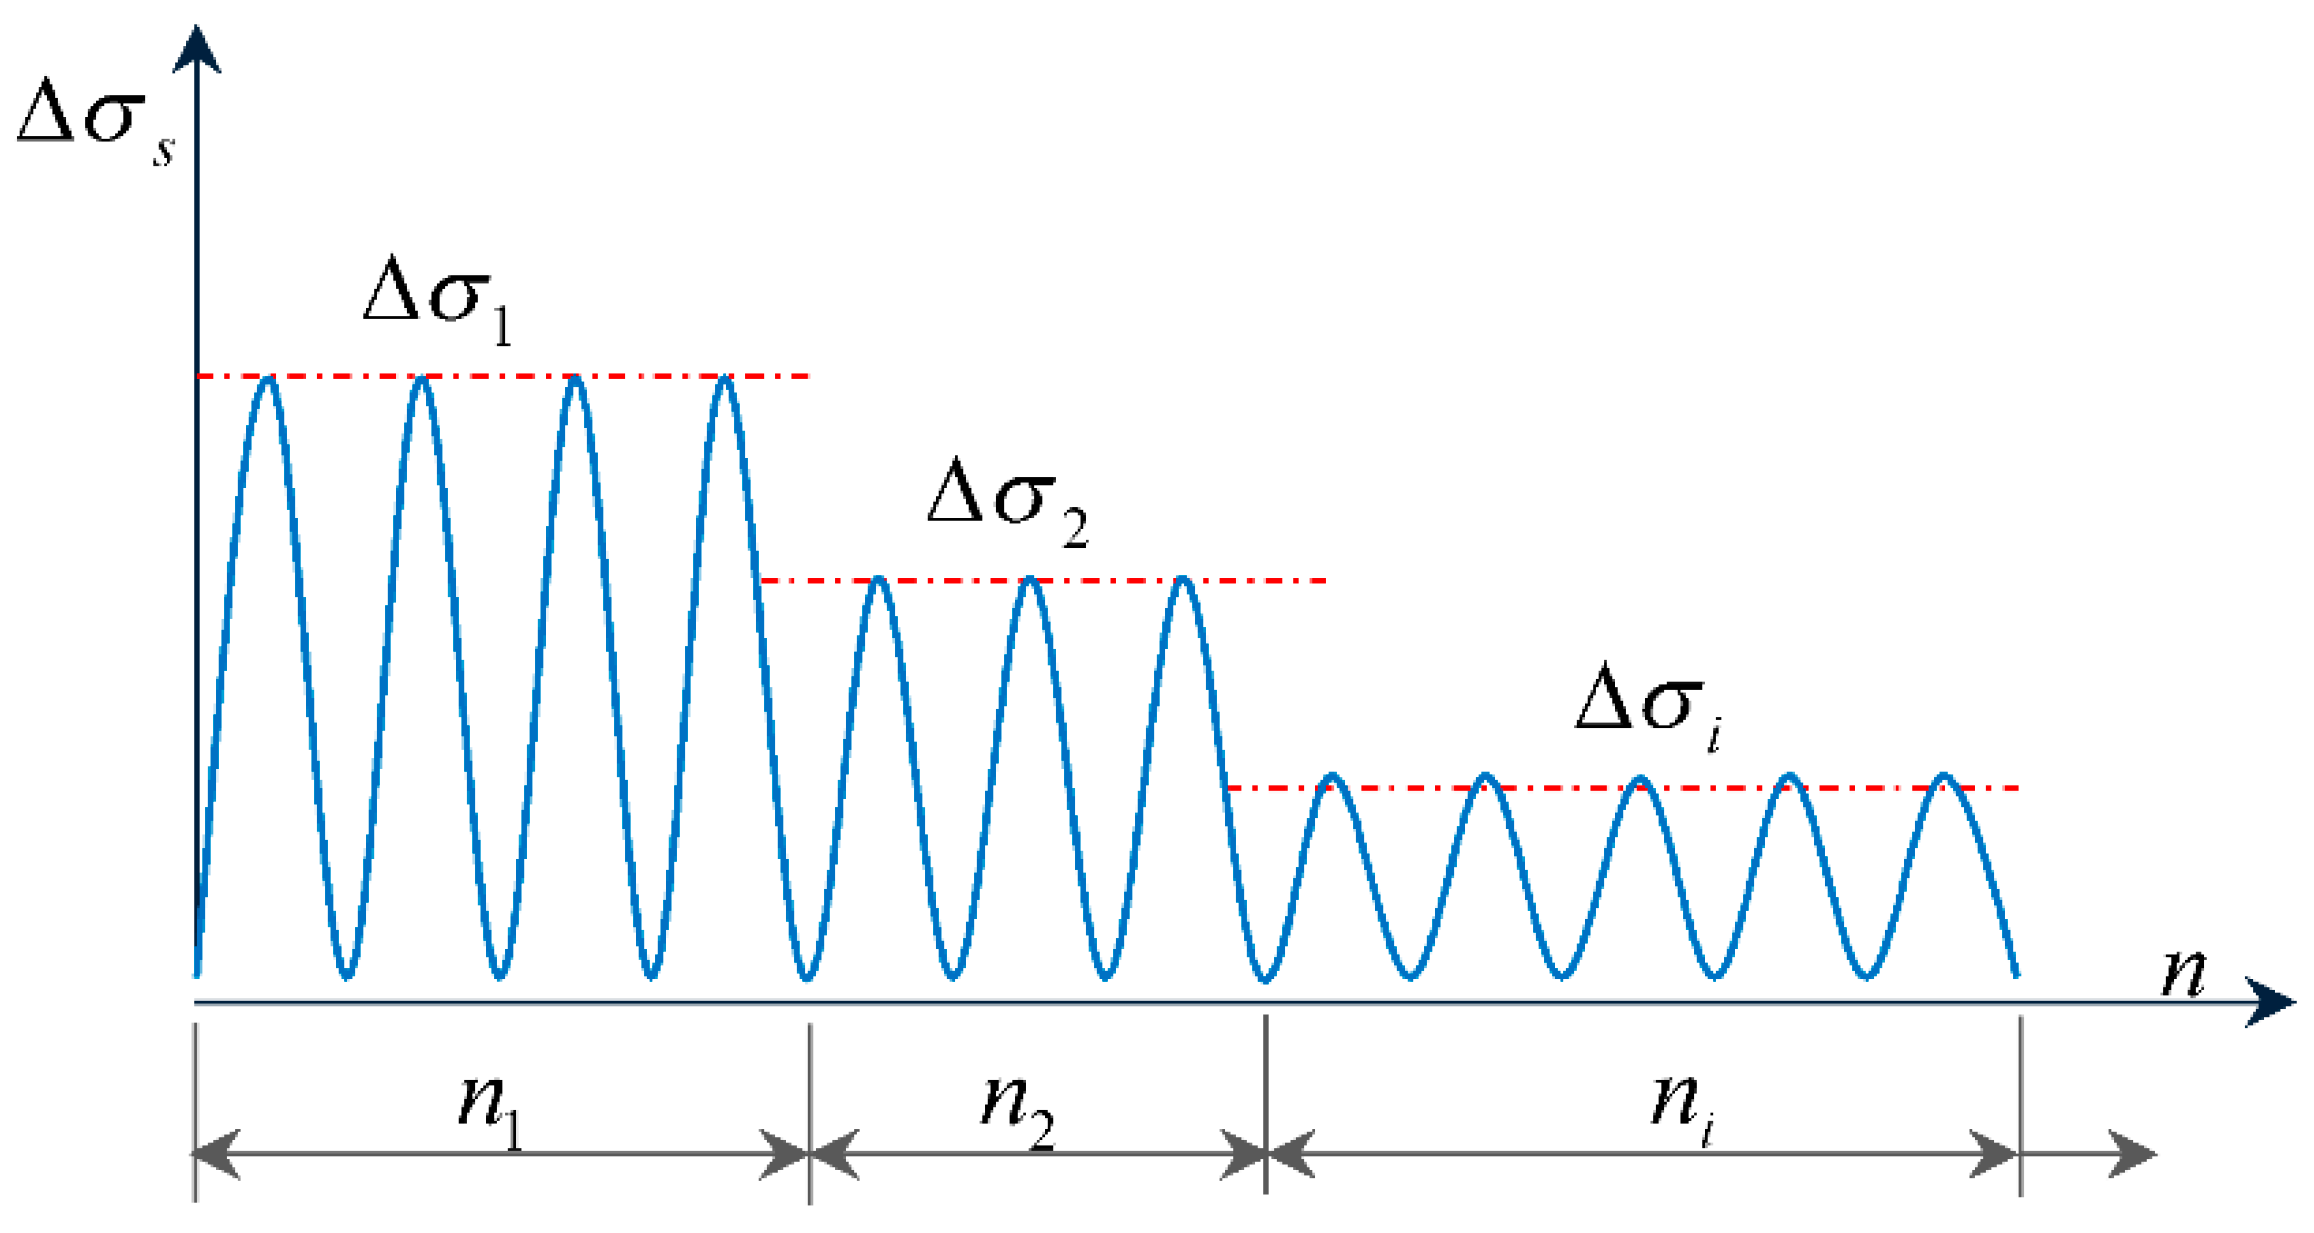
Based on the reference of similar tests in China and abroad, the load mode without intermittent sine wave was decided to be used for loading, as shown in Figure 3, with the loading frequency set as 10 Hz.
For steel bridge deck asphalt pavement structure, its equivalent stress can be calculated by both nominal stress and pavement layer stress [34,35]. The form of asphalt pavement is a typical structure of steel bridge deck asphalt pavement. In this paper, the medium effect force was calculated and analyzed according to the nominal stress. On the basis of the linear and nonlinear cumulative damage theory, the design was conducted according to the loading sequence from high to low and from low to high. The fatigue strength value under the specified number of cycles was first calculated according to the steps of fatigue life design. According to the CN-JT; 43. JTG E20-2011 standard [33], the structure is highway class I, with the reference design life of and the confidence of 97.5%. The fatigue strength can be calculated by the following formula [31]:
where
and
are the stress at the bottom edge of the upper beam section under repeated initial action of cyclic load and repeated action C times. The calculation of parameter
value is independent of the
loading sequence, which
can be obtained directly from the calculation of relevant parameters, . We can solve for .
5.1. Design Scheme 1
The linear cumulative damage theory with the sequence of first a high load first and then a low load can be calculated according to Equation (9), while the nonlinear cumulative damage theory can be calculated according to Equations (15) and (17). For three and four loads with different load spectra, the relevant calculated data are shown in Table 2 and Table 3. The damage values given in tables are the cumulative damage values corresponding to all applied loads after the action of each corresponding load.
5.2. Design Scheme 2
The high-and-then-low load after the first sequence adopts the same analysis theory, and the formulas used for the calculation results are not identical; relevant data can be seen in Table 4 and Table 5.
According to the calculated data in the above tables,
- (1)
- When using the Miner model to design, the stress ratio is greater than 0.9, and the design results of fatigue life are independent of the loading sequence, which is consistent with Miner’s theory.
- (2)
- When using the M–H model to design, the design results of fatigue life are closely related to loading sequence, and the more the load levels are, the more obvious the influence. For the third-level load, when the loading sequence is from high to low, the stress ratio is 1.2863, which is higher than the design for the linear Miner model. However, when the loading sequence changed from low to high, the stress ratio is 0.8467, which is lower than the design results of the linear Miner model. For the fourth-level load, the change of stress ratio is more obvious when the loading sequence changes. When the loading sequence is from high to low, the stress ratio is 1.3271, which is higher than the design for the linear Miner model. However, when the loading sequence changes from low to high, the stress ratio is 0.7616, which is lower than the design results of the linear Miner model.
- (3)
- When using the modified M–H model to design, the design results of fatigue life are closely related to the loading sequence. The more the load levels are, the more obvious the influence on the stress ratio. According to the results, the modified model can avoid the insufficient accuracy of prediction caused by simply considering the loading sequence effects to a certain extent, which is a modification of its analysis results to ensure the effectiveness of analysis and design.
- (4)
- According to different design theories, the results of design parameters for the stress ratio are obviously different, which can be chosen according to different working conditions and its design theory to design. For the multistage load actions, the design model based on the M–H model can take the loading sequence effects into account well, while the modified M–H model can consider loading sequence effects and load interactions at the same time, giving more reliable analysis results.
6. Conclusions
- (1)
- Based on the Manson–Halford model and the nonlinear damage accumulation theory, a new fatigue design model of steel bridge deck asphalt pavement structure under multistage load was established, which could effectively carry out structural fatigue design with certain accuracy.
- (2)
- The more the load levels are, the more obvious effects on the stress ratio. The fatigue design of the model can well consider multistage loading sequence effects and load interactions. To a certain extent, to avoid only considering the loading sequence effects due to the resulting insufficient accuracy of reason analysis, more reliable analysis results are given to ensure the effectiveness of fatigue analysis and design of asphalt pavement structure.
- (3)
- The parameters involved in the established fatigue design model can be realized according to the calculation and analysis of multilevel load stress levels so as to avoid the influence of artificially introduced parameters, and relatively few parameters can be directly applied to the practical problems of steel bridge deck pavement engineering.
Author Contributions
Conceptualization, X.X.; methodology, C.Z.; software, Y.L.; investigation, D.C.; visualization, W.S.; supervision, W.H. All authors have read and agreed to the published version of the manuscript.
Funding
This research was funded by the National Natural Science Foundation of China, No. 2016YFB0303100, Postgraduate Research and Practice Innovation Project in Jiangsu Province, No. KYCX20_2831, Natural Science Foundation of Nantong, No. JC2019065, MS22020026, and XG202009-1.
Institutional Review Board Statement
Not applicable.
Informed Consent Statement
Not applicable.
Data Availability Statement
Not applicable.
Conflicts of Interest
The authors declare no conflict of interest.
References
- Huang, W. Integrated Design Procedure for Epoxy Asphalt Concrete–Based Wearing Surface on Long-Span Orthotropic Steel Deck Bridges. J. Mater. Civ. Eng. 2015, 28, 04015189. [Google Scholar] [CrossRef]
- Chavel, B. Steel Bridge Design Handbook: Bridge Deck Design; Rep. No. FHWA-IF-12-052; Federal Highway Administration: Washington, DC, USA, 2012; Volume 17. [Google Scholar]
- Wolchuk, R. Orthotrope Fahrbahnplatte—Entwicklungen und Möglichkeiten für die Zukunft. Stahlbau 2007, 76, 478–494. [Google Scholar] [CrossRef]
- Xu, X.; Yang, X.; Huang, W.; Xiang, H.; Yang, W. New damage evolution law for steel–asphalt concrete composite pavement considering wheel load and temperature variation. Materials 2019, 12, 3723. [Google Scholar] [CrossRef] [PubMed] [Green Version]
- Yin, C.; Zhang, H.; Pan, Y. Cracking mechanism and repair techniques of epoxy asphalt on steel bridge deck surfacing. Transp. Res. Rec. 2016, 2550, 123–130. [Google Scholar] [CrossRef]
- Losa, M.; Di Natale, A. Evaluation of representative loading frequency for linear elastic analysis of asphalt surfacing. Transp. Res. Rec. 2012, 2305, 150–161. [Google Scholar] [CrossRef]
- Liu, H.L.; Yang, D.X. IGS-SIMP Method Based Stress-constrained Topology Optimization of Continuous Structrues. Chin. J. Comput. Mech. 2018, 35, 144–151. [Google Scholar]
- Kim, T.W.; Baek, J.; Lee, H.J.; Lee, S.Y. Effect of surfacing design parameters on the behavior of orthotropic steel bridge deck surfacings under traffic loading. Int. J. Surf. Eng. 2014, 15, 471–482. [Google Scholar]
- Zhang, L.; Wang, W.; Lu, Q.; Chen, X. An innovative approach to determine deck surfacing modulus and interfacial slip stiffness based on a composite beam model. Constr. Build. Mater. 2013, 40, 411–418. [Google Scholar] [CrossRef]
- Bocci, E.; Graziani, A.; Canestrari, F. Mechanical 3D characterization of epoxy asphalt concrete for surfacing layers of orthotropic steel decks. Constr. Build. Mater. 2015, 79, 145–152. [Google Scholar] [CrossRef]
- Kainuma, S.; Jeong, Y.S.; Ahn, J.-H.; Yamagami, T.; Tsukamoto, S. Behavior and stress of orthotropic deck with bulb rib by surface corrosion. J. Constr. Steel Res. 2015, 113, 135–145. [Google Scholar] [CrossRef]
- Hornyak, N.; Crovetti, J.A. Analysis of load pulse durations for Marquette interchange instrumentation project. Transp. Res. Rec. 2009, 2094, 53–61. [Google Scholar] [CrossRef]
- Kozy, B.M.; Connor, R.J.; Paterson, D.; Mertz, D.R. Proposed revisions to AASHTO-LRFD bridge design specifications for orthotropic steel deck bridges. J. Bridge Eng. 2010, 16, 759–767. [Google Scholar] [CrossRef]
- Medani, T.O.; Liu, X.; Huurman, M.; Scarpas, A.; Molenaar, A.A.A. Characterisation of surfacing materials for orthotropic steel deck bridges. Part 1: Experimental work. Int. J. Surf. Eng. 2010, 11, 237–253. [Google Scholar] [CrossRef]
- de Freitas, S.T.; Kolstein, H.; Bijlaard, F. Fatigue assessment of full-scale retrofitted orthotropic bridge decks. J. Bridge Eng. 2017, 22, 04017092. [Google Scholar] [CrossRef] [Green Version]
- Campbell, F.C. Fatigue and Fracture: Understanding the Basics; ASM International: Materials Park, OH, USA, 2012. [Google Scholar]
- Liu, W.; Xu, S.; Li, Q. Experimental study on fracture performance of ultra-high toughness cementitious composites with J-integral. Eng. Fract. Mech. 2012, 96, 656–666. [Google Scholar] [CrossRef]
- Saboo, N.; Kumar, P. Optimum blending requirements for EVA modified binder. Int. J. Surf. Res. Technol. 2015, 8, 172–178. [Google Scholar] [CrossRef]
- Bayat, A.; Knight, M. Field evaluation and analysis of flexible surfacing structural responses under dynamic loads. Road Mater. Surf. Des. 2012, 13, 26–37. [Google Scholar]
- Delgadillo, R.; Bahia, H.U.; Lakes, R. A nonlinear constitutive relationship for asphalt binders. Mater. Struct. 2012, 45, 457–473. [Google Scholar] [CrossRef]
- Zhou, X.; Zhao, G.; Tighe, S.; Chen, M.; Wu, S.; Adhikari, S.; Gao, Y. Quantitative comparison of surface and interface adhesive properties of fine aggregate asphalt mixtures composed of basalt, steel slag, and andesite. Constr. Build. Mater. 2020, 246, 118507. [Google Scholar] [CrossRef]
- Ameri, M.; Nowbakht, S.; Molayem, M.; Mirabimoghaddam, M.H. A study on fatigue modeling of hot mix asphalt mixtures based on the viscoelastic continuum damage properties of asphalt binder. Constr. Build. Mater. 2016, 106, 243–252. [Google Scholar] [CrossRef]
- Golos, K.; Ellyin, F. A total strain energy density theory for cumulative fatigue damage. J. Press. Vessel Technol. 1988, 110, 36–41. [Google Scholar] [CrossRef]
- Manson, S.; Halford, G. Practical implementation of the double linear damage rule and damage curve approach for treating cumulative fatigue damage. Int. J. Fatigue 1981, 17, 169–192. [Google Scholar]
- Marco, S.; Starkey, W. A concept of fatigue damage. Trans. ASME 1954, 76, 627–632. [Google Scholar]
- Alencar, G.; de Jesus, A.M.P.; Alencar, G.; de Jesus, A.M.P.; Calçada, R.A.B.; da Silva, J.G.S. Fatigue life evaluation of a composite steel-concrete roadway bridge through the hot-spot stress method considering progressive surfacing deterioration. Eng. Struct. 2018, 166, 46–61. [Google Scholar] [CrossRef]
- Pokorski, P.; Radziszewski, P.; Sarnowski, M. Fatigue life of asphalt surfacings on bridge decks. Procedia Eng. 2016, 153, 556–562. [Google Scholar] [CrossRef] [Green Version]
- Ren, S.; Liu, X.; Zhang, Y.; Lin, P.; Apostolidis, P.; Erkens, S.; Li, M.; Xu, J. Multi-scale characterization of lignin modified bitumen using experimental and molecular dynamics simulation methods. Mater. Struct. 2021, 287, 123058. [Google Scholar]
- Cho, J.G.; Koo, J.S.; Jung, H.S. A Lightweight Design Approach for an EMU Carbody Using a Material Selection Method and Size Optimization. J. Mech. Sci. Technol. 2016, 30, 673–681. [Google Scholar] [CrossRef]
- Talatahari, S. Optimum Design of Skeletal Structures Using Ant Lion Optimizer. Int. J. Optim. Civ. Eng. 2016, 6, 13–25. [Google Scholar]
- Xu, X.; Yang, X.; Yang, W.; Guo, X.; Xiang, H. New damage evolution law for modeling fatigue life of asphalt concrete surfacing of long-span steel bridge. Constr. Build. Mater. 2020, 259, 119795. [Google Scholar] [CrossRef]
- China Communications Press. Specifications for Design of Highway Asphalt Surfacing, CN-JT; JTG D50-2017; China Communications Press: Beijing, China, 2017. [Google Scholar]
- China Communications Press. Standard Test Material of Bitumen and Bituminous Mixtures for Highway Engineering, CN-JT; JTG E20-2011; China Communications Press: Beijing, China, 2011. [Google Scholar]
- Yan, C.L.; Hao, Y.X.; Liu, K. Fatigue Life Prediction of Materials Based on BP Neural Networks Optimized by Genetic Algorithm. J. Jilin Univ. 2014, 44, 1710–1715. [Google Scholar]
- Cheng, H.; Liu, L.; Sun, L. Field measurements of dynamic strain responses of asphalt surfacing on steel deck bridge. China Civ. Eng. J. 2019, 52, 100–108. [Google Scholar]
Figure 1.
Cumulative damage under multi-stage loading.
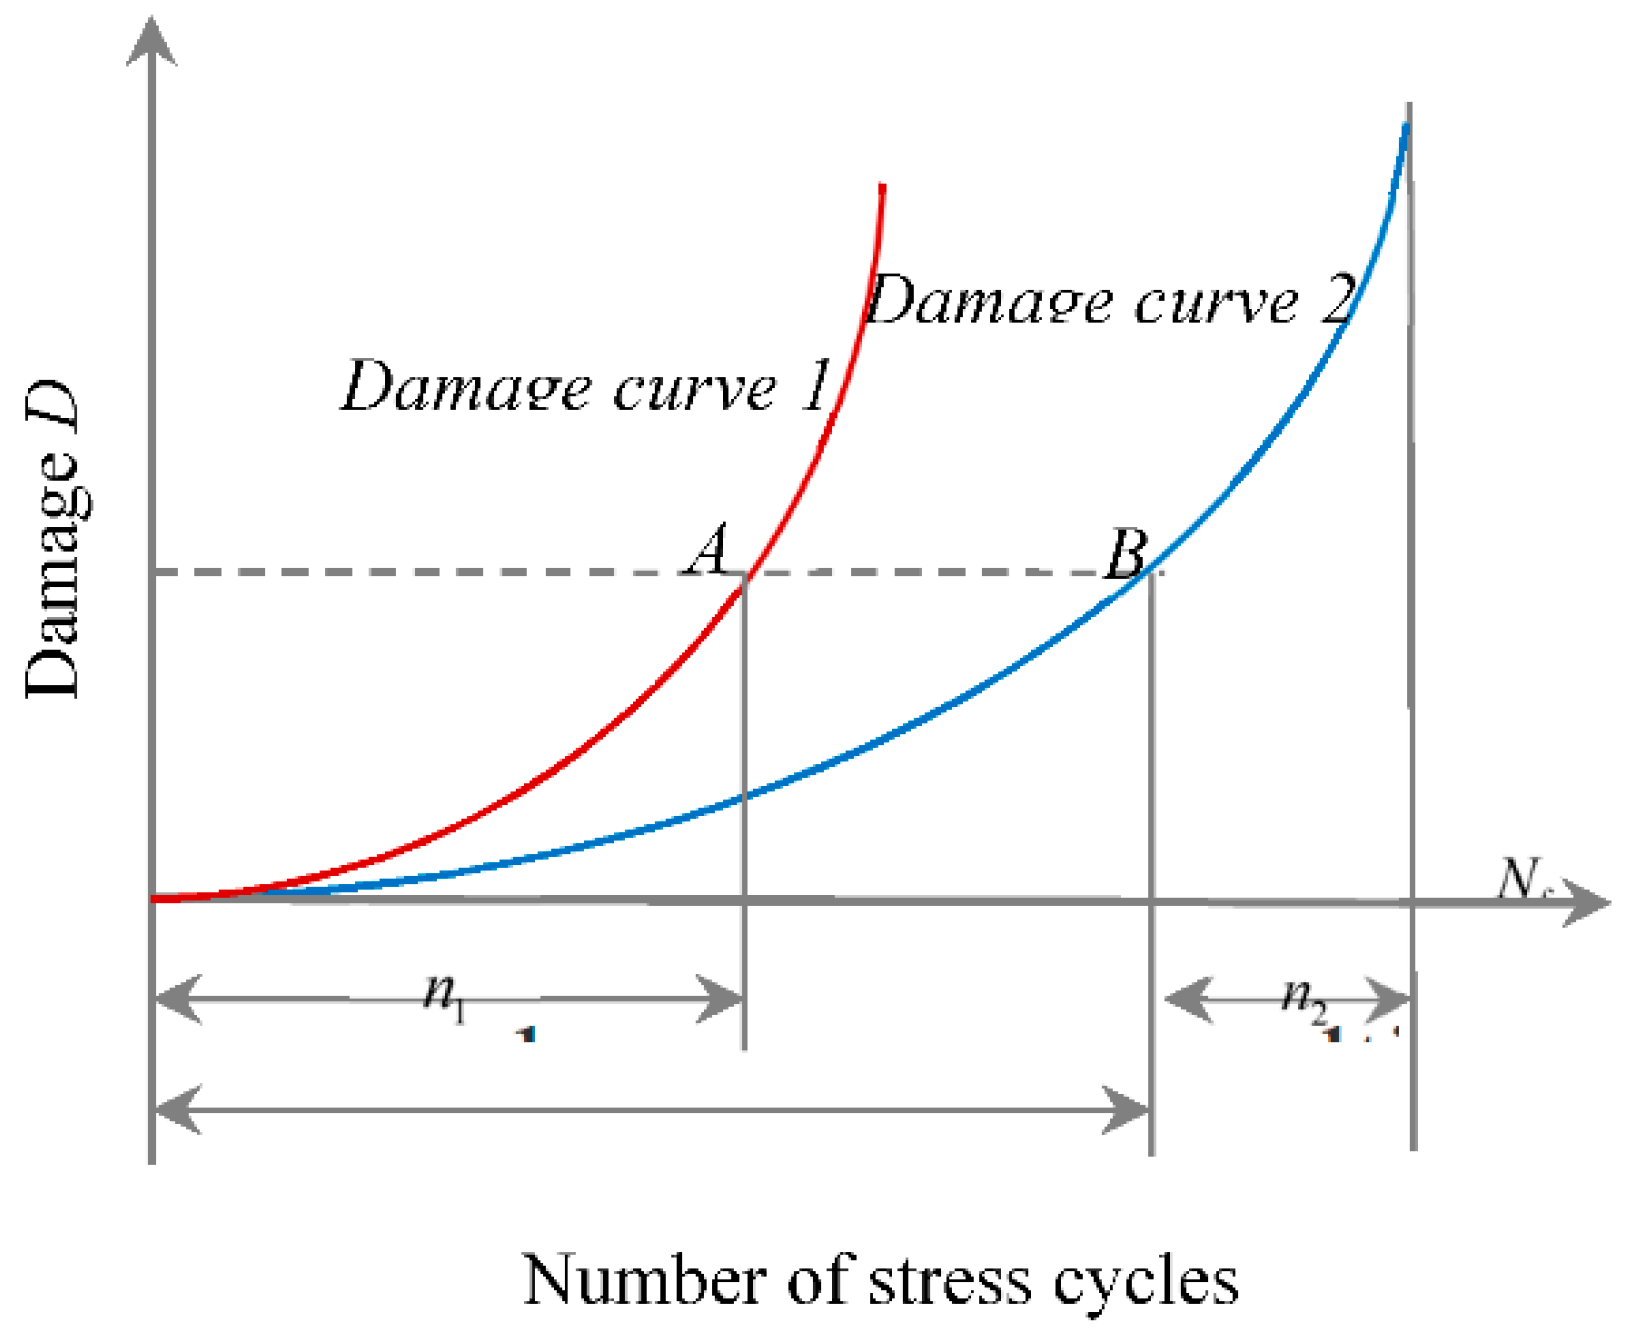
Figure 2.
Schematic illustration of fatigue test for steel deck–asphalt pavement beam.
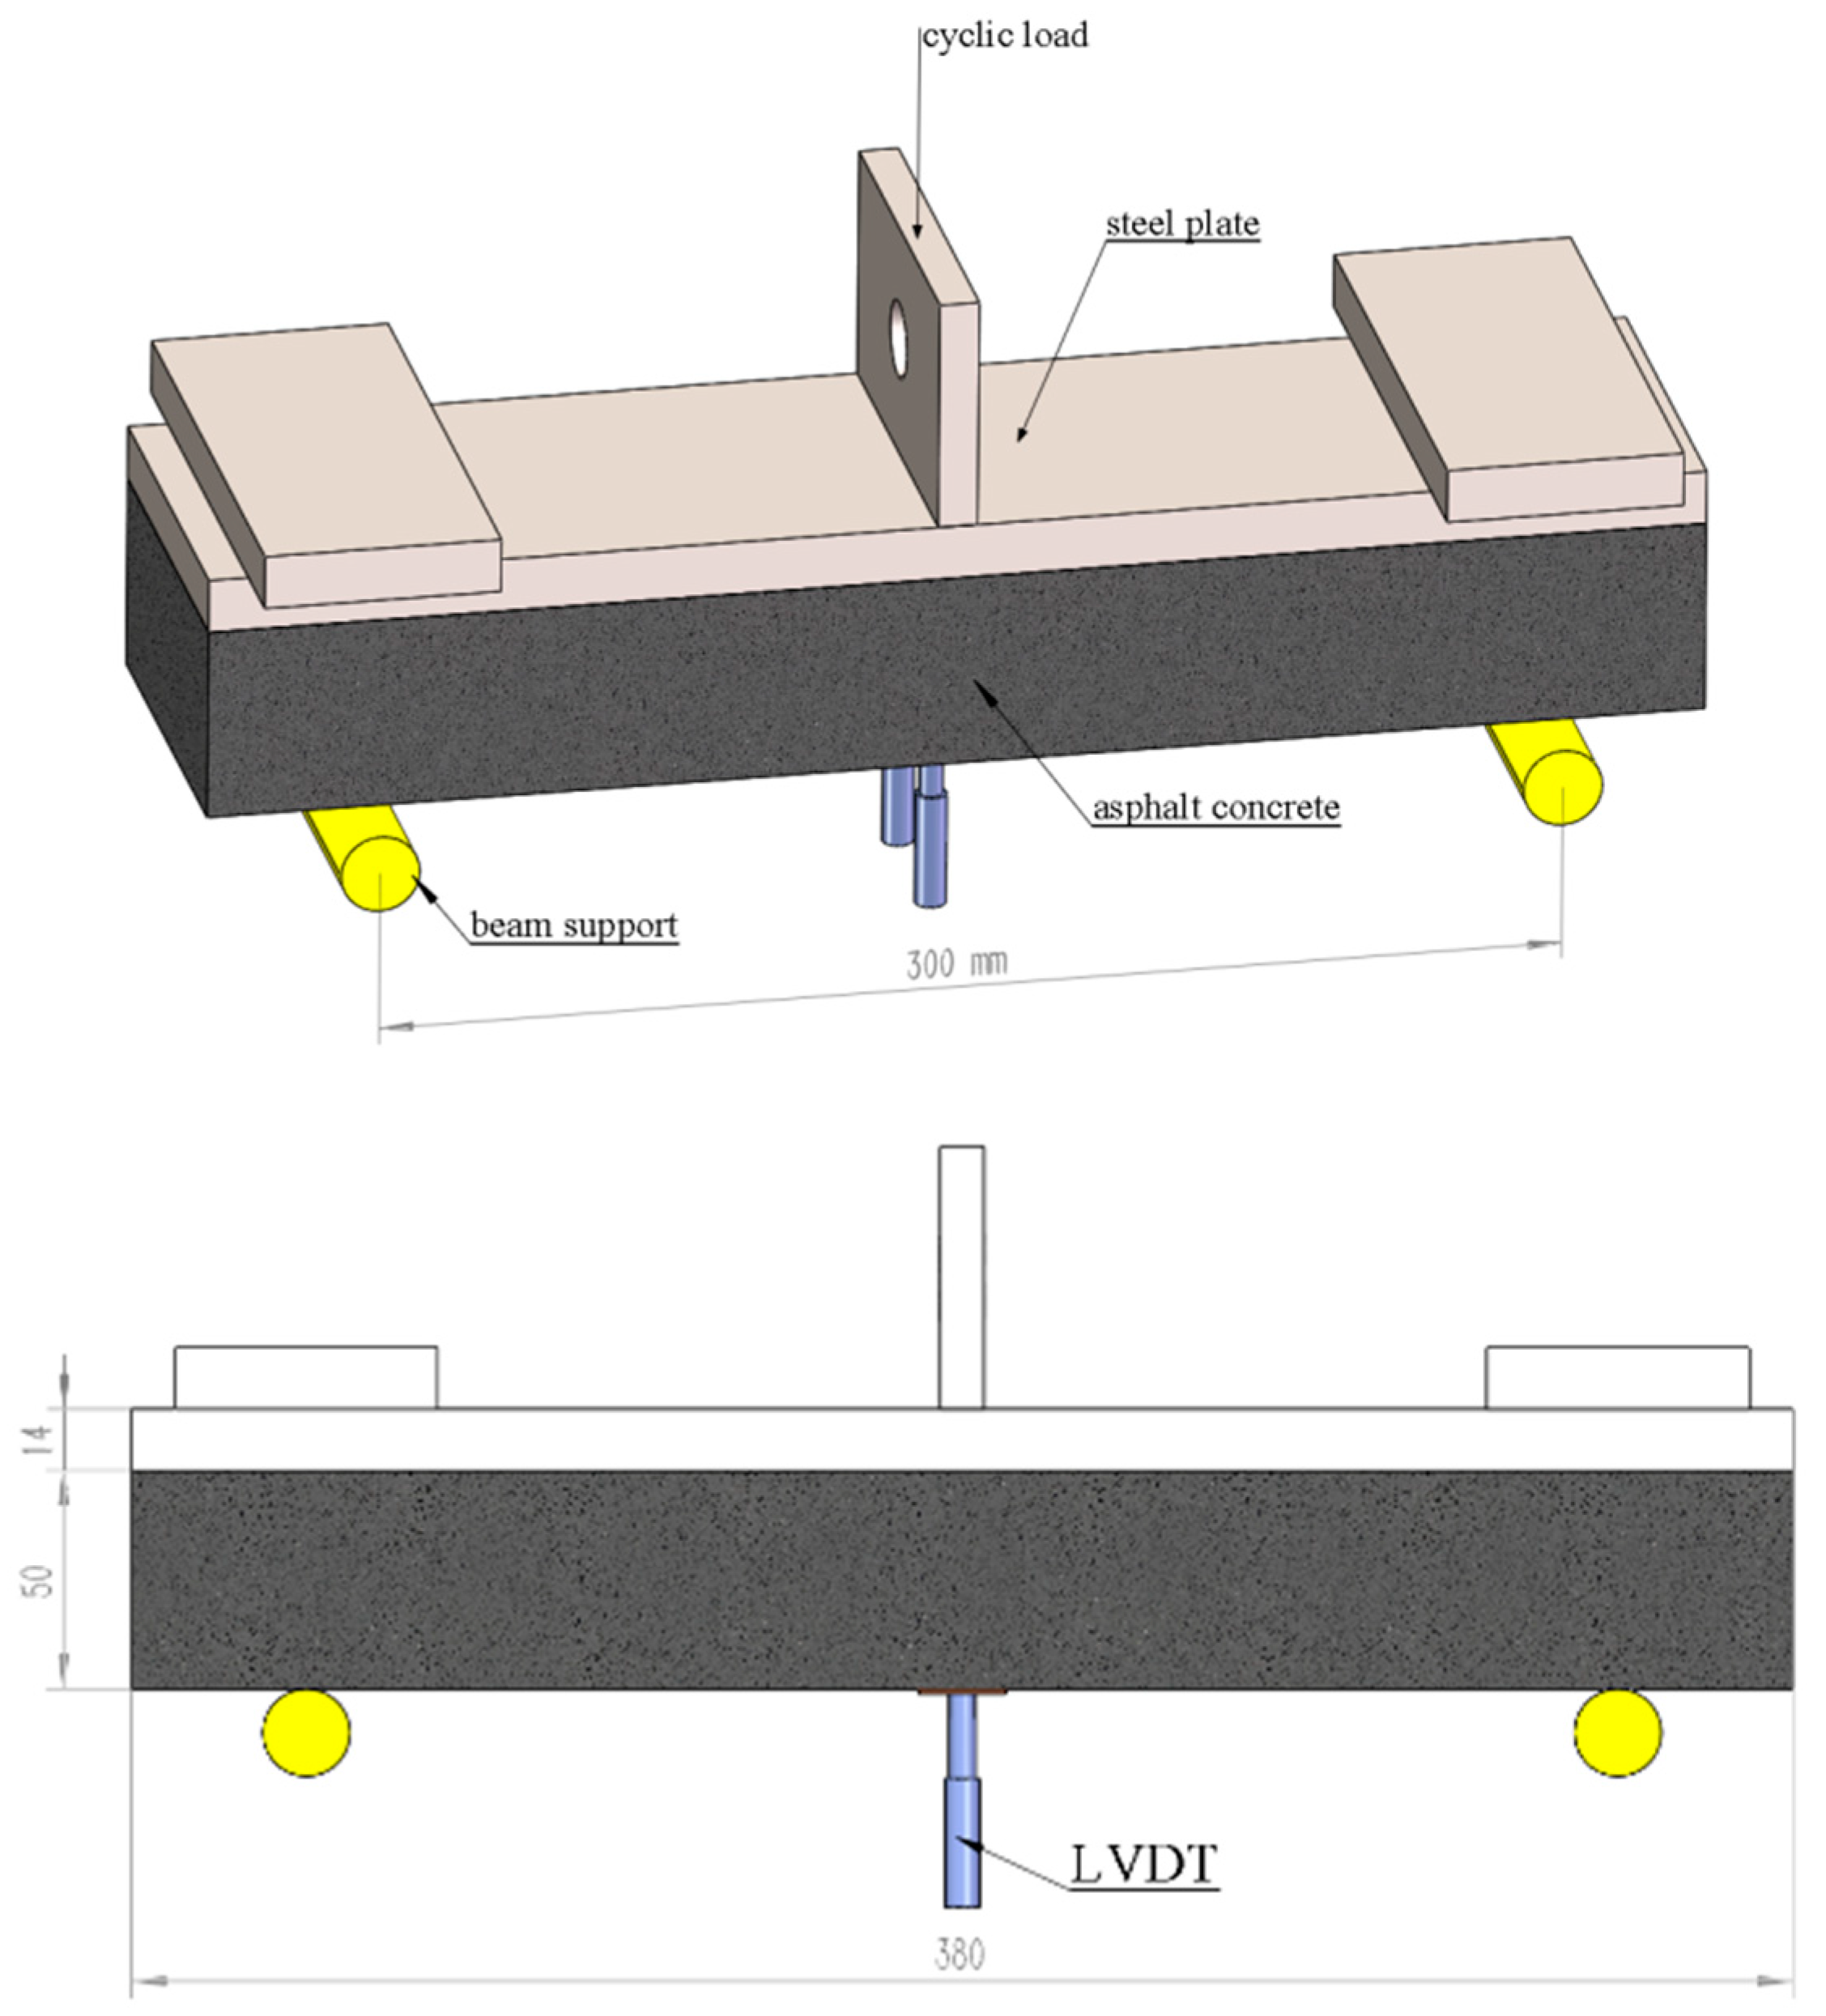

Figure 3.
Examples of load spectrum under bending amplitude variation.

Table 1.
Load spectrum of steel bridge deck asphalt pavement structure.
| Three Levels | Four Levels | ||||
|---|---|---|---|---|---|
| 1 | 0.85 | 0.3 | 0.85 | 0.2 | 1.0 |
| 2 | 0.70 | 0.3 | 0.70 | 0.2 | |
| 3 | 0.55 | 0.4 | 0.65 | 0.2 | |
| 4 | - | - | 0.55 | 0.4 | |
Table 2.
Three-level loads are designed in the high-and-then-low loading sequence.
| 1 | 0.85 | 0.3 | 0.51429 | 0.2267 | 0.0812 | 0.0804 | ||
| 2 | 0.70 | 0.3 | 0.65687 | 0.3886 | 0.1698 | 0.1521 | ||
| 3 | 0.55 | 0.4 | 3.27326 | 0.4512 | 0.3967 | 0.3484 | ||
| Total | - | 1.0 | - | 0.4512 | 0.3967 | 0.3484 | ||
| Miner model | ||||||||
| M–H model | ||||||||
| Modified M–H model | ||||||||
Note:
represents the damage accumulation calculated by
the
Miner model;
represents the damage accumulation calculated by
the
M–H model; represents the damage accumulation value calculated by the modified M–H model, similar to other tables.
Table 3.
Four-level loads designed in the high-and-then-low loading sequence.
| 1 | 0.85 | 0.2 | 0.51429 | 0.15472 | 0.05423 | 0.05017 | ||
| 2 | 0.70 | 0.2 | 0.65687 | 0.12801 | 0.12136 | 0.11845 | ||
| 3 | 0.65 | 0.2 | 1.74563 | 0.30117 | 0.19652 | 0.17143 | ||
| 4 | 0.55 | 0.4 | 3.27326 | 0.36542 | 0.30147 | 0.26406 | ||
| Total | - | 1.0 | - | 0.36542 | 0.30147 | 0.26406 | ||
| Miner model | ||||||||
| M–H model | ||||||||
| Modified M–H model | ||||||||
Table 4.
Three-level loads designed in the low-and-then-high loading sequence.
| 1 | 0.55 | 0.4 | 3.27326 | 0.0612 | 0.0219 | 0.0212 | ||
| 2 | 0.70 | 0.3 | 0.65687 | 0.1986 | 0.0594 | 0.0637 | ||
| 3 | 0.85 | 0.3 | 0.51429 | 0.4512 | 0.1236 | 0.1214 | ||
| Total | - | 1.0 | - | 0.4512 | 0.1236 | 0.1214 | ||
| Miner model | ||||||||
| M–H model | ||||||||
| Modified M–H model | ||||||||
Table 5.
Four-level loads designed in the low-and-then-high loading sequence.
| 1 | 0.55 | 0.4 | 3.27326 | 0.05643 | 0.01947 | 0.01979 | ||
| 2 | 0.65 | 0.2 | 1.74563 | 0.10747 | 0.02541 | 0.02753 | ||
| 3 | 0.70 | 0.2 | 0.65687 | 0.20198 | 0.04409 | 0.04715 | ||
| 4 | 0.85 | 0.2 | 0.51429 | 0.36542 | 0.07803 | 0.08091 | ||
| Total | - | 1.0 | - | 0.36542 | 0.07803 | 0.08091 | ||
| Miner model | ||||||||
| M–H model | ||||||||
| Modified M–H model | ||||||||
Publisher’s Note: MDPI stays neutral with regard to jurisdictional claims in published maps and institutional affiliations. |
© 2021 by the authors. Licensee MDPI, Basel, Switzerland. This article is an open access article distributed under the terms and conditions of the Creative Commons Attribution (CC BY) license (https://creativecommons.org/licenses/by/4.0/).
Share and Cite
MDPI and ACS Style
Xu, X.; Li, Y.; Huang, W.; Chen, D.; Zhang, C.; Shi, W. Fatigue Design of Steel Bridge Deck Asphalt Pavement Based on Nonlinear Damage Accumulation Theory. Appl. Sci. 2021, 11, 5668. https://doi.org/10.3390/app11125668
AMA Style
Xu X, Li Y, Huang W, Chen D, Zhang C, Shi W. Fatigue Design of Steel Bridge Deck Asphalt Pavement Based on Nonlinear Damage Accumulation Theory. Applied Sciences. 2021; 11(12):5668. https://doi.org/10.3390/app11125668
Chicago/Turabian StyleXu, Xunqian, Yu Li, Wei Huang, Dakai Chen, Chen Zhang, and Wenkang Shi. 2021. "Fatigue Design of Steel Bridge Deck Asphalt Pavement Based on Nonlinear Damage Accumulation Theory" Applied Sciences 11, no. 12: 5668. https://doi.org/10.3390/app11125668
Note that from the first issue of 2016, this journal uses article numbers instead of page numbers. See further details here.