
Fourier Singular Values-Based False Data Injection Attack Detection in AC Smart-Grids
by
 , , , and
Moslem Dehghani
1 ,
,
Taher Niknam
1,*,
Mohammad Ghiasi
1 ,
,
Pierluigi Siano
2,3,*,
Hassan Haes Alhelou
4,5,* and
and
Amer Al-Hinai
5,6,*
1
Department of Electrical and Electronics Engineering, Shiraz University of Technology, Shiraz 7155713876, Iran
2
Department of Management and Innovation Systems, University of Salerno, 84084 Salerno, Italy
3
Department of Electrical and Electronic Engineering Science, University of Johannesburg, Johannesburg 2028, South Africa
4
School of Electrical and Electronic Engineering, University College Dublin, 4 Dublin, Ireland
5
Department of Electrical and Computer Engineering, Sultan Qaboos University, Al Khoudh 123, Oman
6
Sustainable Energy Research Center, Sultan Qaboos University, Al Khoudh 123, Oman
*
Authors to whom correspondence should be addressed.
Appl. Sci. 2021, 11(12), 5706; https://doi.org/10.3390/app11125706
Submission received: 5 April 2021
/
Revised: 16 June 2021
/
Accepted: 16 June 2021
/
Published: 20 June 2021
(This article belongs to the Special Issue Smart Energy Systems and Technologies)
Abstract
:Cyber-physical threats as false data injection attacks (FDIAs) in islanded smart microgrids (ISMGs) are typical accretion attacks, which need urgent consideration. In this regard, this paper proposes a novel cyber-attack detection model to detect FDIAs based on singular value decomposition (SVD) and fast Fourier transform (FFT). Since new research are mostly focusing on FDIAs detection in DC systems, paying attention to AC systems attack detection is also necessary; hence, AC state estimation (SE) have been used in SI analysis and in considering renewable energy sources effect. Whenever malicious data are added into the system state vectors, vectors’ temporal and spatial datum relations might drift from usual operating conditions. In this approach, switching surface based on sliding mode controllers is dialyzed to regulate detailed FFT’s coefficients to calculate singular values. Indexes are determined according to the composition of FFT and SVD in voltage/current switching surface to distinguish the potential cyber-attack. This protection layout is presented for cyber-attack detection and is studied in various types of FDIA forms like amplitude and vector derivation of signals, which exchanged between agents such as smart sensor, control units, smart loads, etc. The prominent advantage of the proposed detection layout is to reduce the time (less than 10 milliseconds from the attack outset) in several kinds of case studies. The proposed method can detect more than 96% accuracy from 2967 sample tests. The performances of the method are carried out on AC-ISMG in MATLAB/Simulink environment.
1. Introduction
1.1. Background
Nowadays, with the increasing growth and compilation of using information and communication technologies (ICTs), many parts of electrical power grids (EPGs) are gently becoming smart and in this regard, concepts of Smart-grids (SGs) and islanded smart microgrids (ISMGs) have emerged [1]. Nevertheless, using smart power systems including state estimation (SE), has a majority of challenges in cyber or physical layers such as cyber-attack and malicious data injection because of dependency on information and telecommunication technologies. One prominent concern can be cyber or physical attacks in these systems [2,3].
Attackers in electrical power networks are able to alter variables by attack to metering devices or by compromising communication infrastructures [4]. Therefore, compromised system states might disrupt electrical power network performance, resulting in physical or economic damages on the energy system. Good examples here are References [5,6], where comprehensive studies are based on an influx of these kinds of cyber-attacks. False Data Injection (FDI) threat can be mentioned as a prominent challenge on the system state estimation among common cyber-physical attacks in EPGs [7,8].
The use of FFT in detecting cyber-attacks that have the ability to extract high-level features has made this approach a powerful method against new attacks or small mutations. Additionally, a combination of machine-learning-based techniques and FFT can lead to better performance of cyber-attack detection. Recently published papers [9,10,11] dealt with the issue of signal injection attack and FFT.
Jamming in False Data Injection Attack (FDIA) is different from other physical or cyber-attacks. Successful FDIAs are able to revolve the conventional residuary-based spoiled, invalid, incorrect and bad data detection scheme [12]. Without a progressive diagnostic scheme, FDIA is able to be secretly started several times and a dramatic threat to the network is rendered. Many studies have been assigned to investigate possible approaches of constructing FDIA in SGs. Many of the existing researches on constructing FDIA are focusing on cyber or physical attacks in EPGs via DC state estimation with several cases owing to usual system systematic models [7]. For example, a universal known scenario attack is that when the other party gains access to the part of electrical infrastructure information, then the attacker is able to change a group of measured values [8,13]. In such techniques, FDIA should be able to bypass or change conventional detection approaches successfully, and false information injects and throws in the sensors or devices of the subsystem.
Nowadays, attack state estimation of FDI with the aim of evaluating AC has been gradually taken into consideration, and to construct such attacks, analytical and technical studies have been conducted. In References [14,15], in order to execute FDI attack in AC power system state estimation with some or entire system information, viable techniques have been presented. Generally, both AC and DC state estimations can be under FDI attacks. Potential FDI attack detection techniques have been explored in prior studies over vulnerable points of EPGs system [16,17]. Besides, negative effects and possible defense strategies have also been examined [14,15,18]. Additionally, many commentators are of the view that basically two categories according to AC or DC models have been considered and studied separately [19]. Several methods have been employed to detect FDIA in DC power systems, including statistical techniques [20], sparse optimization [21], state forecasting methods [22], network theory approaches [23], and also schemes based on machine learning [24,25]. All of them displayed acceptable detection efficiency and incorrect signal rates versus FDIA in DC model.
Electrical grid systems are nonlinear and their dynamics are complicated, so only few studied have been worked on FDIA in AC Smart-grids. In order to distinguish a set of sensors at attack risk which are adequate to make an unpredictable attack; in this regards, in the paper [26], a FDIA in AC power system is investigated according to linearization around the aim state, assuming which state estimation is taken via a particular method, that can operate very accurately.
Dual physical-attacks and cyber-attacks on electrical networks are presented and analyzed in Reference [27], and also this method is expanded to a simple scheme of AC load flow in Reference [28]; besides, cyber-physical-attacks on electrical grid system has been used based on the FDIA mechanism in paper [29]. In addition, to guard against invalid, false, spoiled or bad data and adversarial injections, a robust SE on AC system has been studied [30]; (for more information and a review on this topic, interested readers can refer to Reference [21]); nevertheless, there is no guarantee of detecting stealthy injections in the system. As can be seen from the analyzed results in Section 4, even if robust SE techniques are recruited, cyber-attacks (based on FDI occurred in AC systems) cannot be detected by Bad Data Detector (BDD).
A robust cubature Kalman filter (RCKF) is considered to retrieve the dynamic state estimation (DSE) of generator agents which have been attacked by malicious data [31], where primary, two various kinds of cyber-attacks containing denial of service attacks (DSA) and FDIA are analyzed and also introduced into the generator’s DSE by a technique of combining the attack vectors through the obtained data, and secondly, the CKF and RCKF methods are adopted to the DSE with the aim of obtaining cyber-attacks with different complicated levels; eventually, the efficiency of the mentioned technique are compared and analyzed.
In addition, the other FDI attack detection method for AC-SE is illustrated in [32]. In the abovementioned way, when the state vectors are manipulated by malicious data, their spatial and temporal datum correlations may deviate from those in the same operating conditions. This mentioned procedure could take these inconsistencies through evaluating temporal sequential forecasted system states via using wavelet transform (WT) as inputs of deep neural network (DNN). In addition, several published papers are considered in Table 1.
The sustainable development concept is one the principle objectives that countries strictly follow to achieve better performance of life [37]. The sustainability of cyber security in power systems is a significant concern today. The paper evaluated the FDI attack impact of a smart island and considered FDIA concepts for the sustainability of the smart island. Data were collected from an AC-MG with three renewable resources. The results of the FDI attack displayed that various malicious activities strongly impact the ISMG: in descending order of absolute terms, attack on data exchanges influence smart sensors, controller units, and smart loads are identified as the most influencing. Other activities, containing changing the loads below 10% showed overall lower impacts but it causes power losses and increasing cost. The wide environmental influence has been related with most of the power generation activities and affirms the required to produce the initial power production as cleaner, less energy-intensive and more resource-effective. Affordable incremental novelties that can transform the procedure business have been conducted in the context of primary power generation, which mainly has been assumed depending on green energy resources. The investigations of the FDIA detection procedure toward raised sustainability of power systems contains strategic and important subjects [38].
1.2. Motivation and Main Contributions of the Paper
In this paper, FDI attack in an AC-ISMG and a new detection layout based on singular values of fast Fourier transform (FFT) coefficients are introduced. This detection plan is merged benefits, and also applications of FFT and singular value decomposition (SVD). The proposed method is presented to draw out the system state traits in a period of time in this study. Signals of Voltage and current are measured at the point wherein the relay is located. In another phase, the switching surface (error waveforms on the basis of main signal) is computed according to sliding mode controller, and then investigated by Fourier transform, and the detailed coefficients are retrieved. In this paper, the SVD technique is recruited to calculate the singular values of the coefficient’s matrix that is applied to detect cyber-attack.
1.3. Paper Structure
The rest of the study is formed as follows: In part 2, the concepts of ISMG and FDIA are introduced briefly. Part 3 explains the suggested FDIA detection scheme and Fourier singular values (FSVs), with detailed statements on the implementation and architecture topics. Section 4 illustrates the cyber-physical model and the results on the tested ISMG with several case studies. Finally, the main conclusion of this research will be presented in Section 5.
2. Islanded Smart Microgrid and False Data Injection Attack
2.1. Islanded Smart Microgrid (ISMG)
There are a lot of places and islands which could not connect to the EPGs because of long distance, security, climate, etc., but there is a lot of equipment and people in these places because of work, recreation, etc. These places have their own control and security on the systems, and must guarantee the protection, security, welfare, entertainment, etc., of the people who are in there. Therefore, the concept of ISMG is raised. The ISMG has emerged with the appearance of Internet of Things (IoT) and Information and Communication Technology (ICT) in the islands to optimize the performance of urban services and develop the standards of living and improve the quality of life for many citizens.
Interaction between local communities and urban infrastructure is currently possible through ISMG technology. Additionally, municipal assets are now managed more efficiently, and public data is collected and used, which will solve various urban issues such as traffic and energy problems, and can create new value to monitor and control various events occurred in islands. Creation services in ISMG have different models in a variety of areas including energy, education, medicine, environment, traffic and safety, and roughly 70% of the currently offered services are focused on three subjects: energy, safety and traffic. It can be difficult to know which routes are being revealed on an ISMG because technologies and data are interconnected like a spider, and the appearance of the city varies depending on what technologies have been used. Besides, a threatening virus attack might be dangerous enough to paralyze urban practices. Thus, this study suggests ways according to SVD and FFT to detect attacks in the EPG of an ISMG.
2.2. False Data Injection
The SE is destroyed because of an injection of false or bad data into a physical SG model. It can be assumed that the physical model of the SG with the N bus can be seen in the following AC power model [39] which is given in the Equation (1):
where defines a state vector with n-dimensional { for n-th state variables, and y gives a state vector y with m-dimensional for m-th measurements ({), such as the injected power (active or reactive) to every bus, and each transmission line, and defines an m-dimensional error vector. The define vector of error gives a Gaussian noise with covariance and average value of zero. In this way, Equation (2) provides a formula for a power model:
where in the Equation (2), J gives an inalterable Jacobi matrix of g(x) which is defined as:
Behind applying FDIA, the measurement of y is:
where in the Equation (4), defines the vector of attack. The module of BDD tests difference between real value of y and the estimated value . If the difference is higher than the threshold value ε, we will have:
that, in this case, the false data is detected.
2.3. Islanded Smart Microgrid and FDI
Recently, cyber-physical systems or CPSs are added and mixed to many sending and receiving networks for monitoring and realizing the behaviors as well as controlling the physical parts [40]. One of the emerging examples of this system is the expansion of the ISMGs. ISMGs are relatively a new kind of power distributed systems which used traditional EPGs and also, ICT infrastructure connected to smart measurements and it may use a variety of specialized devices such as laptops, cell phones, etc., on islands in the oceans.
A number of ISMG’s ingredients permit data systems to analyze forecasting for balancing power generation with power consumption into the system. For instance, online pricing can give valuable insights to energy providers and consumers for managing and controlling demands and power resources.
Thus, a distributed energy system that manages the processes of production, consumption, transmission and distribution of energy, can make their performance more dynamic and efficient [41]. Nevertheless, the diversity, heterogeneity, and complexity of the control and use of ISMGs pose significant challenges and categories in guaranteeing the whole system’s entirety [42]. That is because in ISMGs, network state conclusion and decision making have to be implemented on local smart measurements and devices instead of truly-protected control centers. Therefore, unlike traditional EPGs where most attacks and disruptions diverge at physical accessibility to significant facilities [43], the omnipresence of ISMG’s components makes most of the anomalies through cyber infrastructure.
One example of the malware attacks found on ISMGs is FDI which is able to be used to change the amount of demanding energy and actual generated energy. Therefore, energy and load sharing might be improperly done, leading to additional costs or higher devastating risks. Trusting these systems and gaining security is vital because, in addition to cyber security, national security is also at stake. Nonetheless, new reactions versus FDIA have focused rather on common electricity network states [42], where FDIAs occur on physical measurement devices instead of on smart equipment [43].
Regardless of cyber-attacks and ISMG infrastructure distribution design, such methods might not provide complete protection, which can quickly determine for any local or global smart metering device to decide according to system data and status. To answer this challenge, in this paper, a method is proposed to detect FDIAs that is able to be set up and implemented on any smart parts.
3. FDIA Detection
In this section of the paper, the FDIA detection scheme using advances in FFT and SVD are presented. We first illustrate the structure and datum of the suggested technique. Then, the full implementation of the technique is presented with brief presentations to the methods employed. Eventually, the threshold of detection of the suggested technique is discussed.
3.1. Fourier Singular Values
3.1.1. Theory of FFT
Fourier transform is a way to convert signal amplitude that is signal detail based on spectrum or frequency domain. The periodic signal is able to analyze based on Fourier series, whereas the aperiodic signal is converted according to Fourier transform [44].
The FFT presents an efficient approach to convert information from the domain of time to the domain of frequency. Generally, the required data to transform includes N uniformly spaced spots , where (n is an integer value), and where j has a range from zero to .
The discrete Fourier transform can be expressed in several ways. FFT is a fast and efficient calculation approach, using a computer to calculate the Fourier discrete conversion. Based on the FFT definition, the sequence of finite length is able to transform into a frequency domain. At time of applying computer spectrum assessment, it is frequently necessary to discrete the signal processing, in the discretization process, the spectral leakage is caused by the processing of the signal with finite length, time domain and also frequency domain. All cycle sampling procedures must be performed to avoid leakage, integer sampling, or power for 2; therefore, this paper chooses the eight-cycle signal spectrum analysis length.
According to the References [45,46], the common form of this approach is given as follows:
where in the Equation (6), and gives the time domain data, defines their frequency domain representation. The FFT conversion process scheme, or other comparable approaches, makes FFT extensively applicatory because the number of calculations is reduced from to n log(n), which greatly reduces the time of computation.
Frequency data is usually shown from one of these two types: a power spectrum or an amplitude range of spectrum. The amplitude spectrum defines usually as Equation (7):
While the power spectrum is usually stated using Equation (8):
where k = 0, 1, …, N/2.
3.1.2. SVD Theory
To begin with, a vibration signal as a set of one dimensional data is considered as h(n), where n = 1, 2,…, M. Here, M gives the length of h(n). Based on the viewpoint of phase space reconstruction, the track matrix of h(n) which is noticed as Hankel matrix, is defined as Equation (9) [47]:
where, R represents the number of rows, and H defines a m×n real matrix by rank of r and the SVD will be an approach to break down the matrix as three different matrices as follows; herein, SVD of H is formulated in Equation (10) [48].
Here, and represent orthogonal matrices with m and n order, and gives the function of conjugate transpose. The null matrix is presented by , also, S defines a diagonal matrix with order of r which is given in Equation (11):
Here, indicates the non-zero singular values of H. With eliminating the zero singular value from Equation (9), it can be expressed that the simplified shape of the SVD of H is given in Equation (13):
with .
In Equation (13), and indicate the column vectors of and . Therefore, the singular value ingredients will be taken from .
3.2. Proposed Detection Mechanism
Firstly, the FFT approach reorders the input components into bit reversed sequence; after that, it makes the output transform with time decomposition. Accordingly, the main concept will be to separate the transform with length to 2 different transforms with length with applying an inherence. The FFT is broadly used for analyzing signals. Fourier assessments separate frequency details from the spectrum and make it better and easier for analyzing. In this regard, the SVD is used to obtain singular values of the components to compare with the threshold to detect the cyber-attack.
The value of threshold is obtained based on the experience and investigation of different cases and FDIAs on the system, as well as considering the system without attack. In this study, 1573 times, the data of systems such as voltage and current data which have been measured by sensors and exchanged data between units have been manipulated to simulate the behavior of the system after FDIAs, and also, 1394 samples in different status such as different loads, different amount of production of each units without attack were examined and tested, and then the FSVs of signals have been calculated and saved; after that, the FSVs of signals have been considered in normal and under attack conditions, to check the amount of variation of FSVs. The FSVs’ values for normal conditions are between [0, 10] and when the data has been manipulated, the FSVs are changed and raised to more than 10, so if the threshold selected is more than 10, the method is able to detect the FDIAs. In this study, the threshold value for detecting FDIAs was obtained based on 2967 samples of normal and attack conditions, the threshold has been selected as 40 (more than 10 to detect FDIAs) to prevent false detection when a small noise happens to the system, and if the threshold is selected as more than 40, the small attacks cannot be detected (means that the amount of manipulating data is less than 10% amount of signal). Hence, the threshold has been selected as 40 in this study. In addition, the threshold can be set below 40 to detect small FDI attacks (between 10 to 40) but the lower the threshold value, the false detection rate has been increased and noises or small changes in signals can detect as FDI attacks. If the threshold has been selected big (more than 40), attacks in small ranges cannot be detected.
In our proposed method, the input of FSVs comprise of 200 samples. FSV is highly sensitive for changing in the signal magnitude. In case of any cyber-attack, FSV can detect this attack. The algorithm for computing and combining the FSV scheme is shown in Figure 1. Basic data, which is mentioned in Figure 1, means the reference data for voltage, frequency and the estimated data for currents and loads. Based on the proposed method, which is illustrated in Figure 1, the current and voltage signals are gained and then are compared with the basic signals to compute the difference between retrieved signals and basic signals. In addition to compute the fast Fourier transform of the difference to obtain coefficient’s matrix, this paper uses SVD method to obtain singular value of the coefficient’s matrix, and finally, the obtained singular value is compared with threshold to detect the FDI attacks. If the obtained singular values of the signal (FSVs) are more than threshold, the attack is occurred; in contrast, if the FSVs are lower than threshold, the system is in normal condition.
4. Case Studies
4.1. Cyber-Physical Model
As can be seen from Figure 2, an Islanded Micro-grid (IMG) consists of m-th DG units that have been linked in parallel style. In this IMG, some agents are in the mode of controlling voltage and frequency, and consequently, they are in duty of fixing the ISMG voltage. Other DG units are in the state of sharing the loads between units and current control mode [49]. The power circuit of a typical single-phase inverter is illustrated in Figure 3 which connected to the ISMG. The output LC filter is recruited to lessen the output voltage signal’s harmonics which are produced via the Pulse Width Modulation (PWM) that is used for inverter switching. The state equations of the assumed inverter displayed in Figure 3 are presented in Equations (14) and (15), respectively:
Here, defines the inverter’s output voltage, and u expresses the controller’s input signal. By combining Equations (14) and (15), we have Equation (16):
Here, the inductive current () and the capacitor voltage () have been chosen as the state variables. , and represent the DC link voltage, the output currents of capacitor and filter, respectively.
Based on the sliding mode control method, the FDI attack detection’s indexes in voltage/current parameters are defined as follows:
where (voltage’s switching surface) is the voltage index to detect FDIA that is used as an input of FFT; defines a positive value, is the ISMG voltage, and is the base voltage of ISMG which owns a firm frequency and amplitude.
where (current’s switching surface) is the current index to detect FDIA that is used as an input of Fourier transform; is the ISMG current, which is produced by distributed generation units, and is the base current of ISMG loads that is measurable.
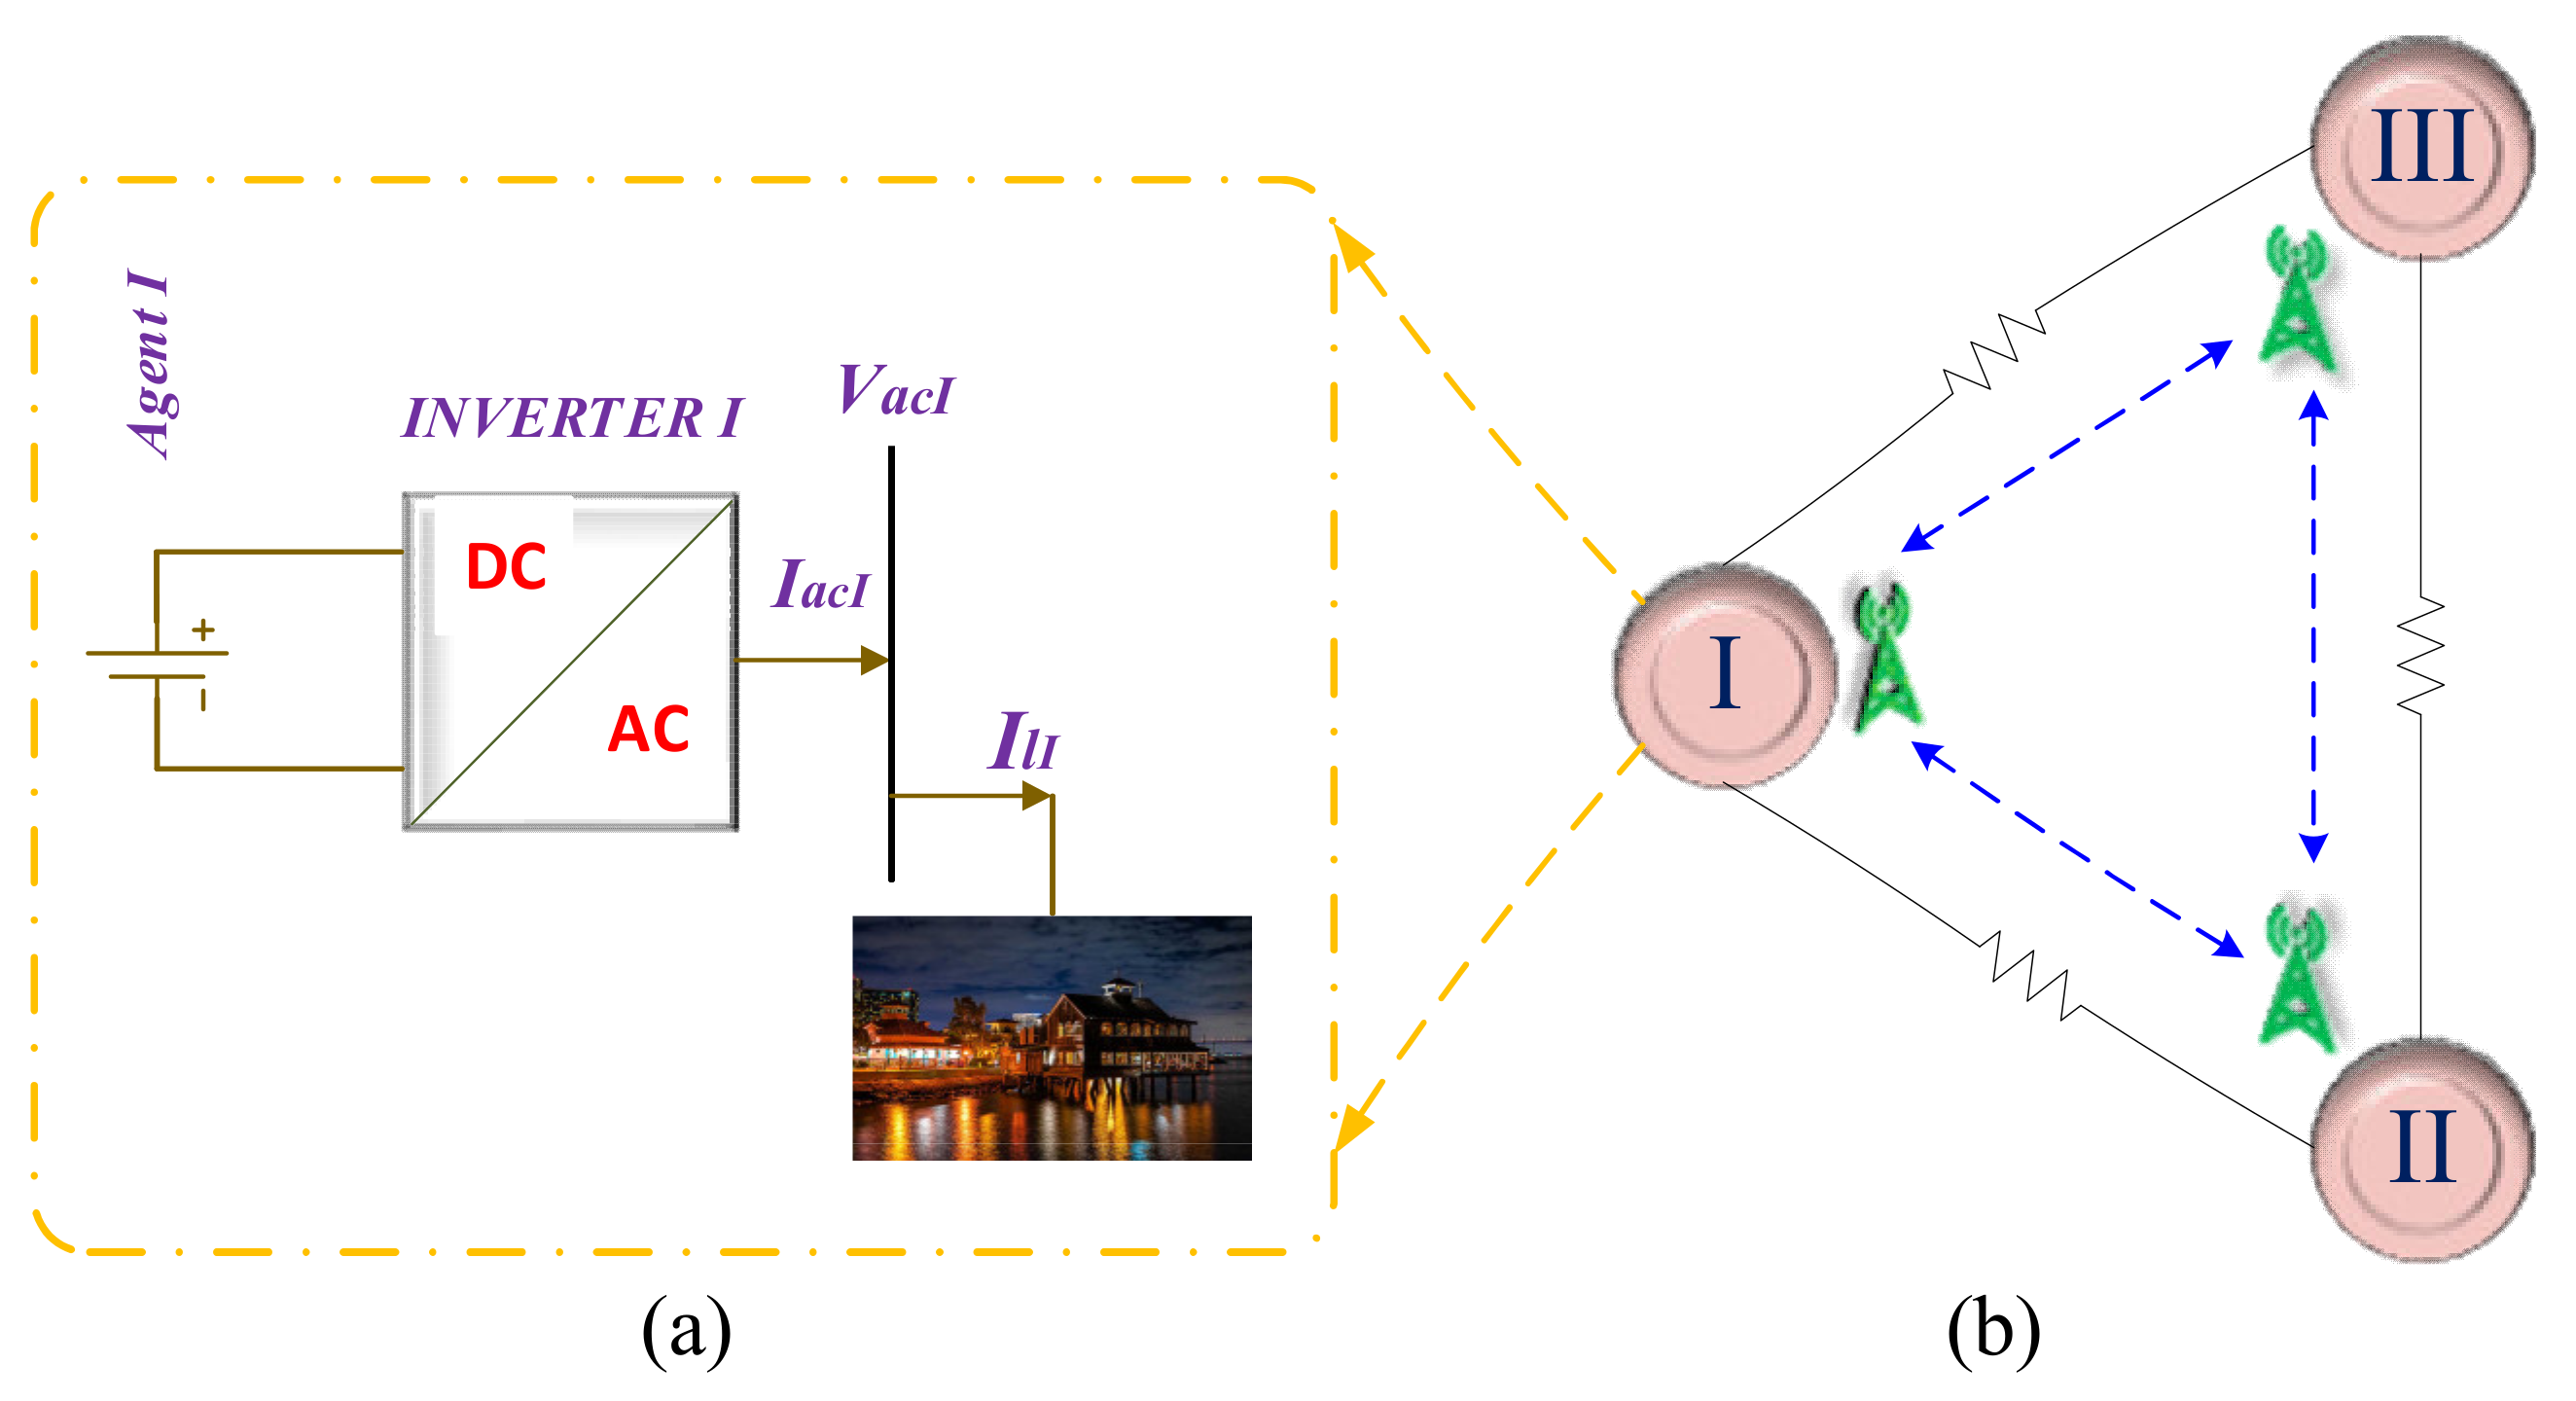
As can be seen, the independent AC-ISMG suggested in this study is depicted in Figure 2. DC resources linked by DC/AC converters are inter-connected through lines, consequently forming the ISMG physical layer. Any DC/AC converter acts according to the reference values to maintain the output voltage. An undirected cyber figure of the communication network is illustrated in this study that transmits/receives data through other units where located in their neighborhood. Further, the output converter of each agent is connected to loads and other units.
Each source is considered as a different agent; the communication figure is displayed as a digraph through links/edges through a vicinity matrix , which suggests the communication weights that are given in Equation (19):
represents an edge that is connected to 2 different nodes together, and are defined as the local and neighboring nodes, respectively. It is necessary to mention that the communication weights show only the data interchange among two corresponding nodes. From a mathematical viewpoint, this can be specified by a matrix with input information .
As a result, if both of the matrices are in accordance together, the Laplacian matrix L will be equivalent, which is and the ingredients can be presented as follows:
where represents the node’s degree and .
Remark 1.
Each agent is attained consensus applyingto a well-spanned matrixso that, thatanddefine a firm and a positive amount, respectively. M represents the agents’ system number.
4.2. Simulation Results of Assumed Case Studies
The proposed attack detection approach is examined on a cyber-physical AC-ISMG that can be seen in Figure 4b by .
ISMG, including three units of similar capacities that are connected together through resistive lines is shown in Figure 4a. It has to be mentioned that each unit comprises of a battery coupled via DC/AC converters, respectively.
To examine the efficiency of the suggested attack detection approach for an AC-ISMG, various FDIAs has been investigated (such as attacks in different smart meters, which commonly have not been discovered by the distributed monitors), and also communication links are used to identify the affected node so that security measures can be taken. So, the main objective of this study is to detect FDI attacks considering the system configuration and controller design. It should be mentioned that any events in the explained case studies is segregated via a specific time interval to make an obvious realization. The information of the local controllers, sensors, communication links and central control agents could be accessed by the attacker in the FDIAs; therefore, for simulating the FDIAs, it can be considered that the information is able to be manipulated by the attackers. Thus, when the attack has occurred, the attackers manipulate the information with the aim of showing the results of attacks. Table 2 illustrates details of the system [49].
Case study I: Instability stems from manipulating the voltage reference signal’s amplitude
In this case, the efficiency of the FSVs in FDIA detection is considered by manipulating the voltage reference signal’s amplitude to simulate the FDIA.
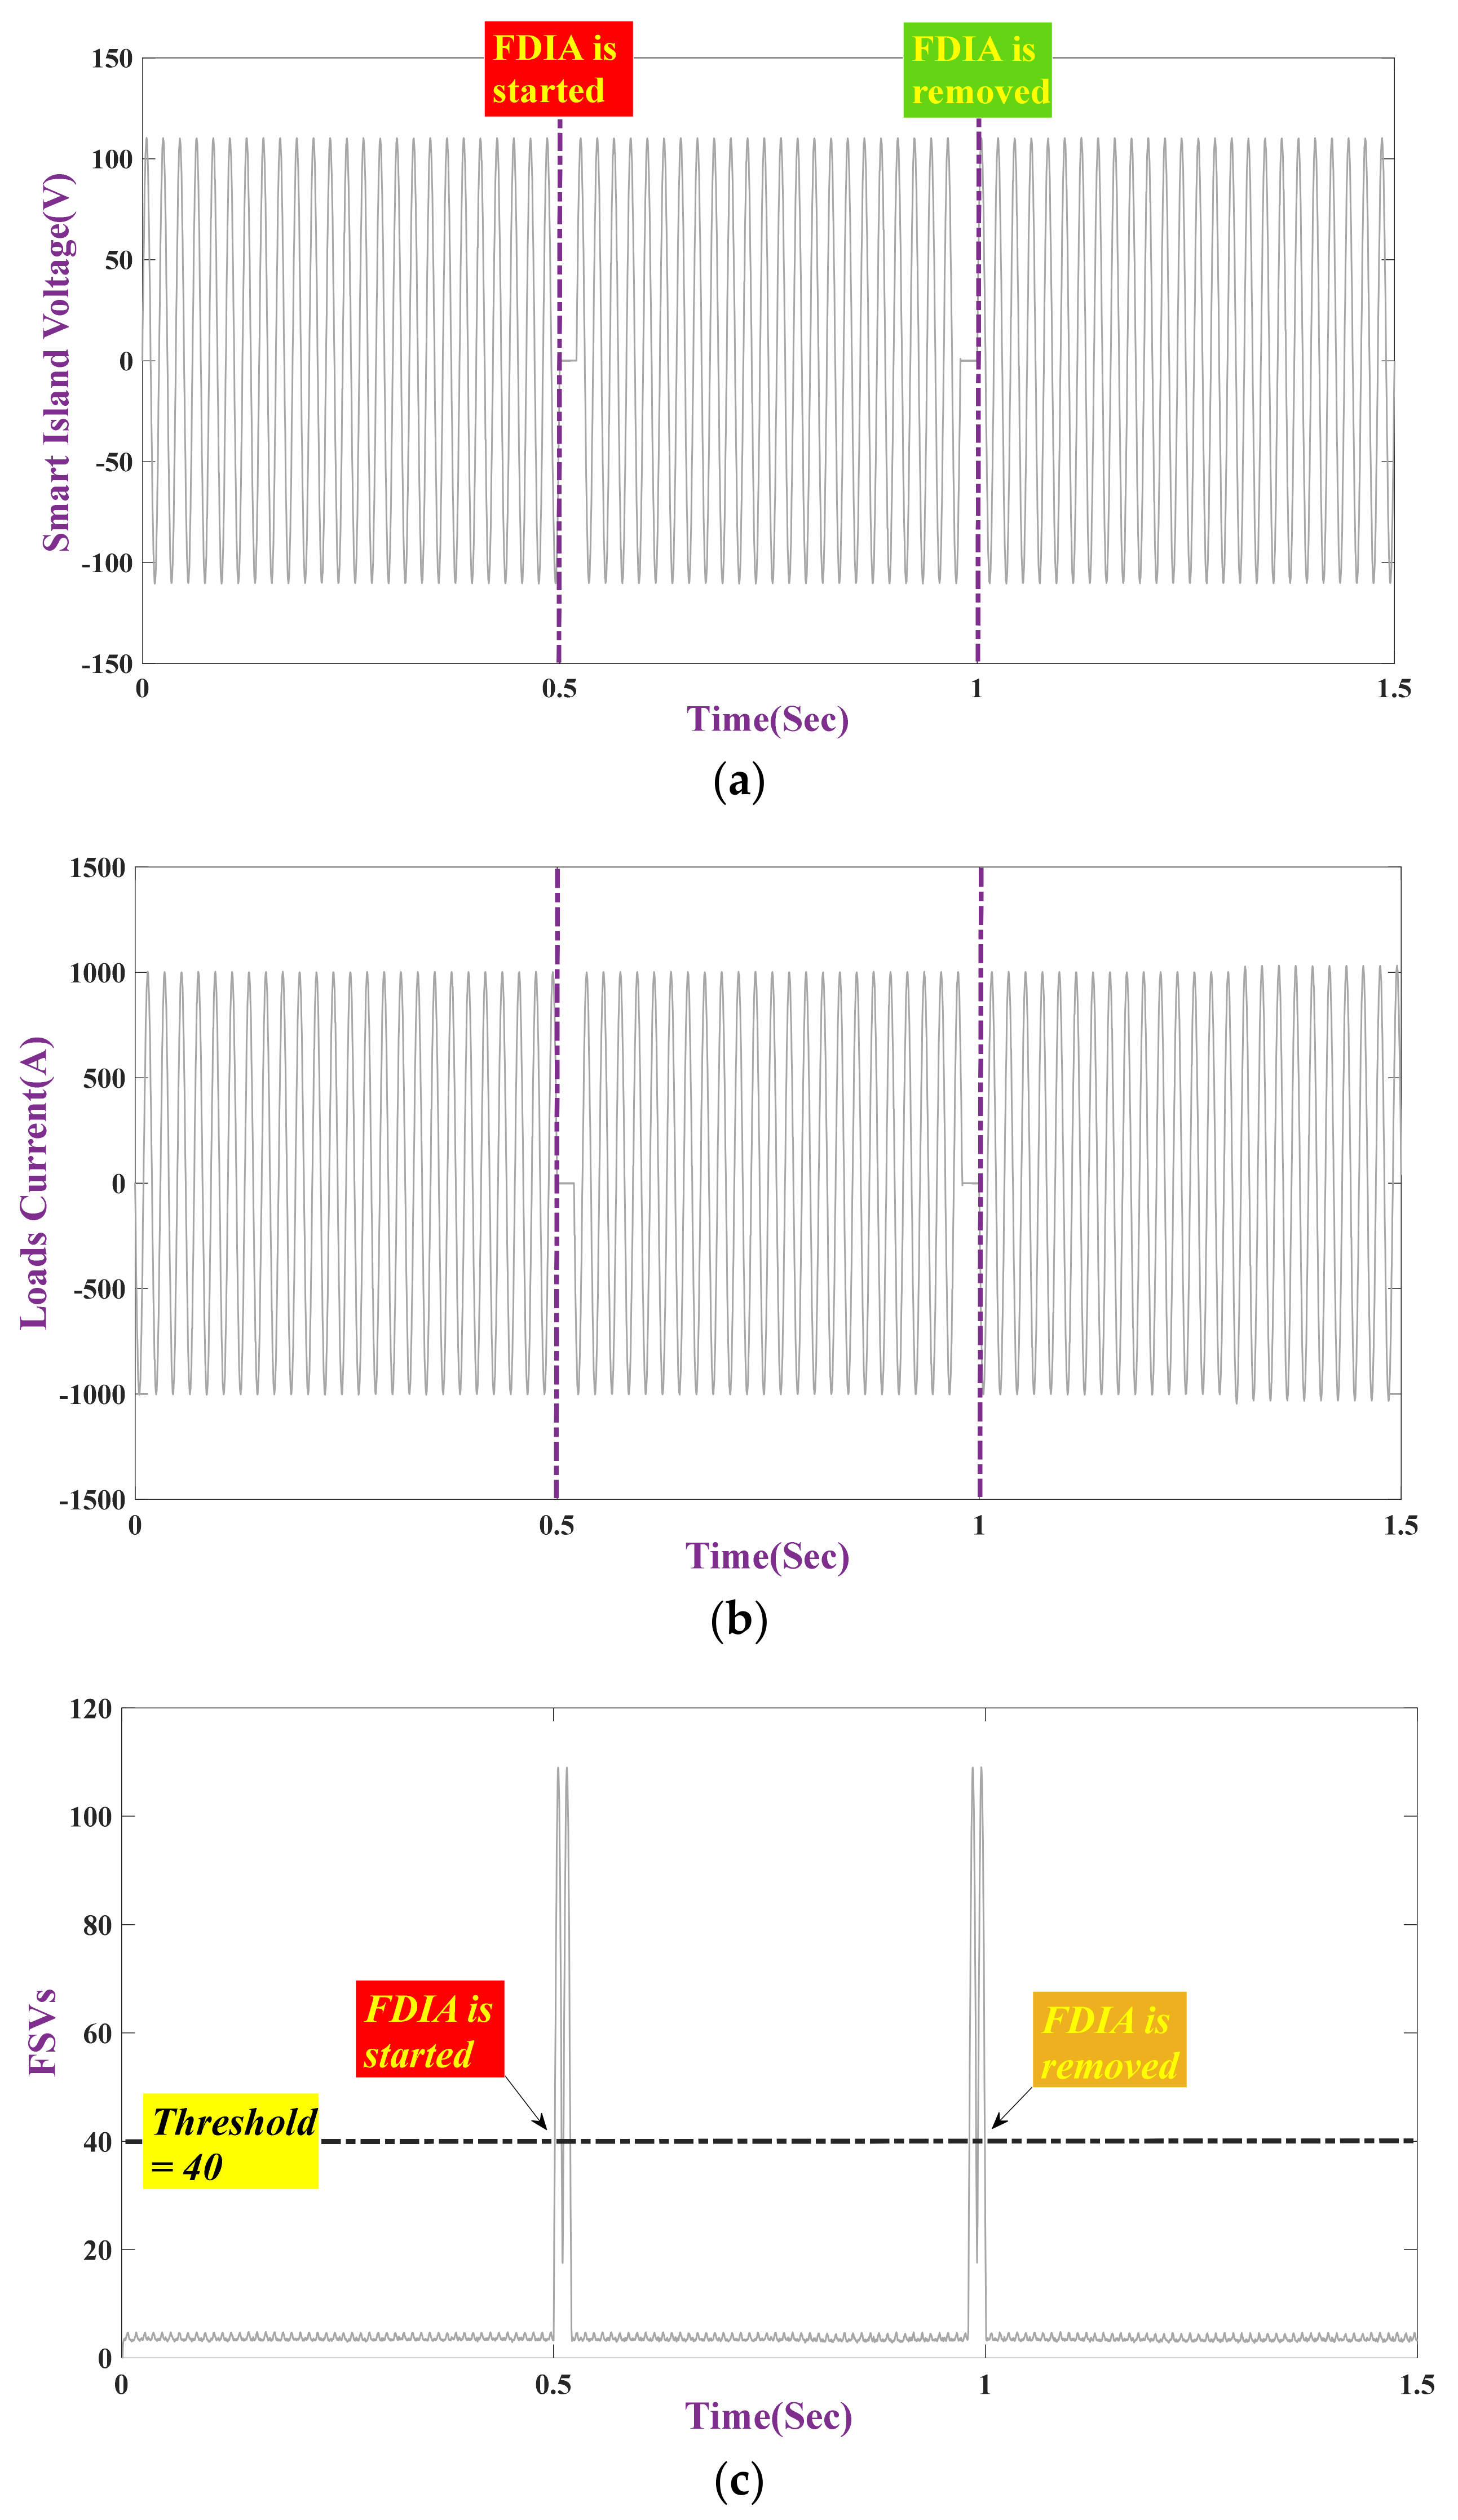
At t = 0.5 s, FDIA began and at t = 1 s, FDIA omitted. To simulate the cyber-attack, in this section, 10% of amplitude of voltage is decreased in reference signal in the controller by the cyber-attack. The simulation results are defined in Figure 5.
In this section, Figure 5a displays the ISMG output voltage. Loads current is explained in Figure 5b. Figure 5c illustrates FSVs of signal in the proposed expression and via choosing a threshold as 40, it is able to observe that the declared mechanism is able to successfully identify the attack. Response time of the expressed scheme at the time of FDI attack is exposed in Figure 5d. As it is obvious, the speed of the proposed scheme is allowable and can detect the attack less than 10 ms from the time which the FDIA has occurred.
Case study II: Instability stems from manipulating the voltage reference signal’s frequency
In this case, the efficiency of the FSVs in FDIA detection is considered by injecting an attack via manipulating the voltage reference signal’s frequency to simulate the FDIA.
At t = 0.5 s, FDI attack began and at t = 1 s, FDI attack is eliminated. To simulate the cyber-attack, the frequency of signal altered from to in reference signal in the controller by the cyber-attack. The simulation results are explicated in Figure 6. In this section, Figure 6a displays the ISMG output voltage. Loads current is shown in Figure 6b. Figure 6c depicts FSVs of signal in the proposed state and via choosing a threshold as 40, it is able to be observed that the declared mechanism is able to successfully identify the attack. Response time of the expressed scheme at the time of FDI attack is exposed in Figure 6d. As shown, the speed of the presented scheme is allowable and can detect the attack less than 10 ms from the time which the FDIA has occurred.
Case study III: Instability stems from manipulating the voltage reference signal according to shift in the signal
In this case, the efficiency of the FSVs in FDIA detection is considered by manipulating the voltage reference signal according to shift the signal to simulate the FDIA.
At t = 0.5 s, FDIA began and at t = 1 s, FDIA eliminated. To simulate the attack, the ISMG output voltage is shifted in the reference signal in the controller by the cyber-attack. The simulation outcomes of the mentioned case are explicated in Figure 7. In this case, Figure 7a displays the output voltage of the ISMG. Loads current is exposed in Figure 7b. Figure 7c shows FSVs of signal in the mentioned mood and via choosing a threshold as 40, it is able to observe that the declared mechanism is able to successfully identify the attack. Response time of the expressed scheme at the time of FDI attack is shown in Figure 7d. As shown, the speed of the proposed scheme is allowable and can detect the attack less than 10 ms from the time which the FDIA has occurred.
Case study IV: Instability stems from manipulating the voltage reference signal through plus noise to the main signal
In this case, the efficiency of the FSVs in FDIA detection is considered by manipulating the voltage reference signal through plus noise to the main signal to simulate the FDIA.
At t = 0.5 s, FDI attack began and at t = 1 s, FDI attack eliminated. To simulate the FDIA, a white noise combined to the ISMG output voltage in the control unit by the cyber-attack. The simulation outcomes of the mentioned case are indicated in Figure 8.
Figure 8a displays the ISMG output voltage. Loads current is exposed in Figure 8b. Additionally, Figure 8c shows FSVs of signal in the proposed case and via choosing a threshold as 40, it is able to observe that the declared mechanism is able to successfully identify the cyber-attack. Response time of the expressed scheme at the time of FDI attack is depicted in Figure 8d. As shown, the speed of the proposed scheme is allowable and can detect the attack less than 10 ms from the time which the FDIA has occurred.
Case study V: Instability stems from manipulating the voltage sensor
In this case, the efficiency of the FSVs in the FDI attack detection is considered by injecting an attack on the measured voltage via smart metering.
At t = 0.5 s, FDI attack began and at t = 1 s, FDI attack eliminated. To simulate the cyber-attack, the measured voltage of the ISMG, which is measured by sensor, changed in sensor by the cyber-attack, and the amount of voltage is shown less/more of the real value. The simulation outcomes of the mentioned state are explicated in Figure 9.
In this section, Figure 9a displays the output voltage of the ISMG. Loads current is depicted in Figure 9b. Figure 9c shows FSVs of signal in the proposed expression and via choosing a threshold as 40, it is able to observe that the declared mechanism can successfully identify the cyber-attack. Response time of the expressed scheme at the time of FDI attack is depicted in Figure 9d. As shown, the speed of the proposed scheme is allowable and can detect the attack less than 10 ms from the time which the FDIA has occurred.
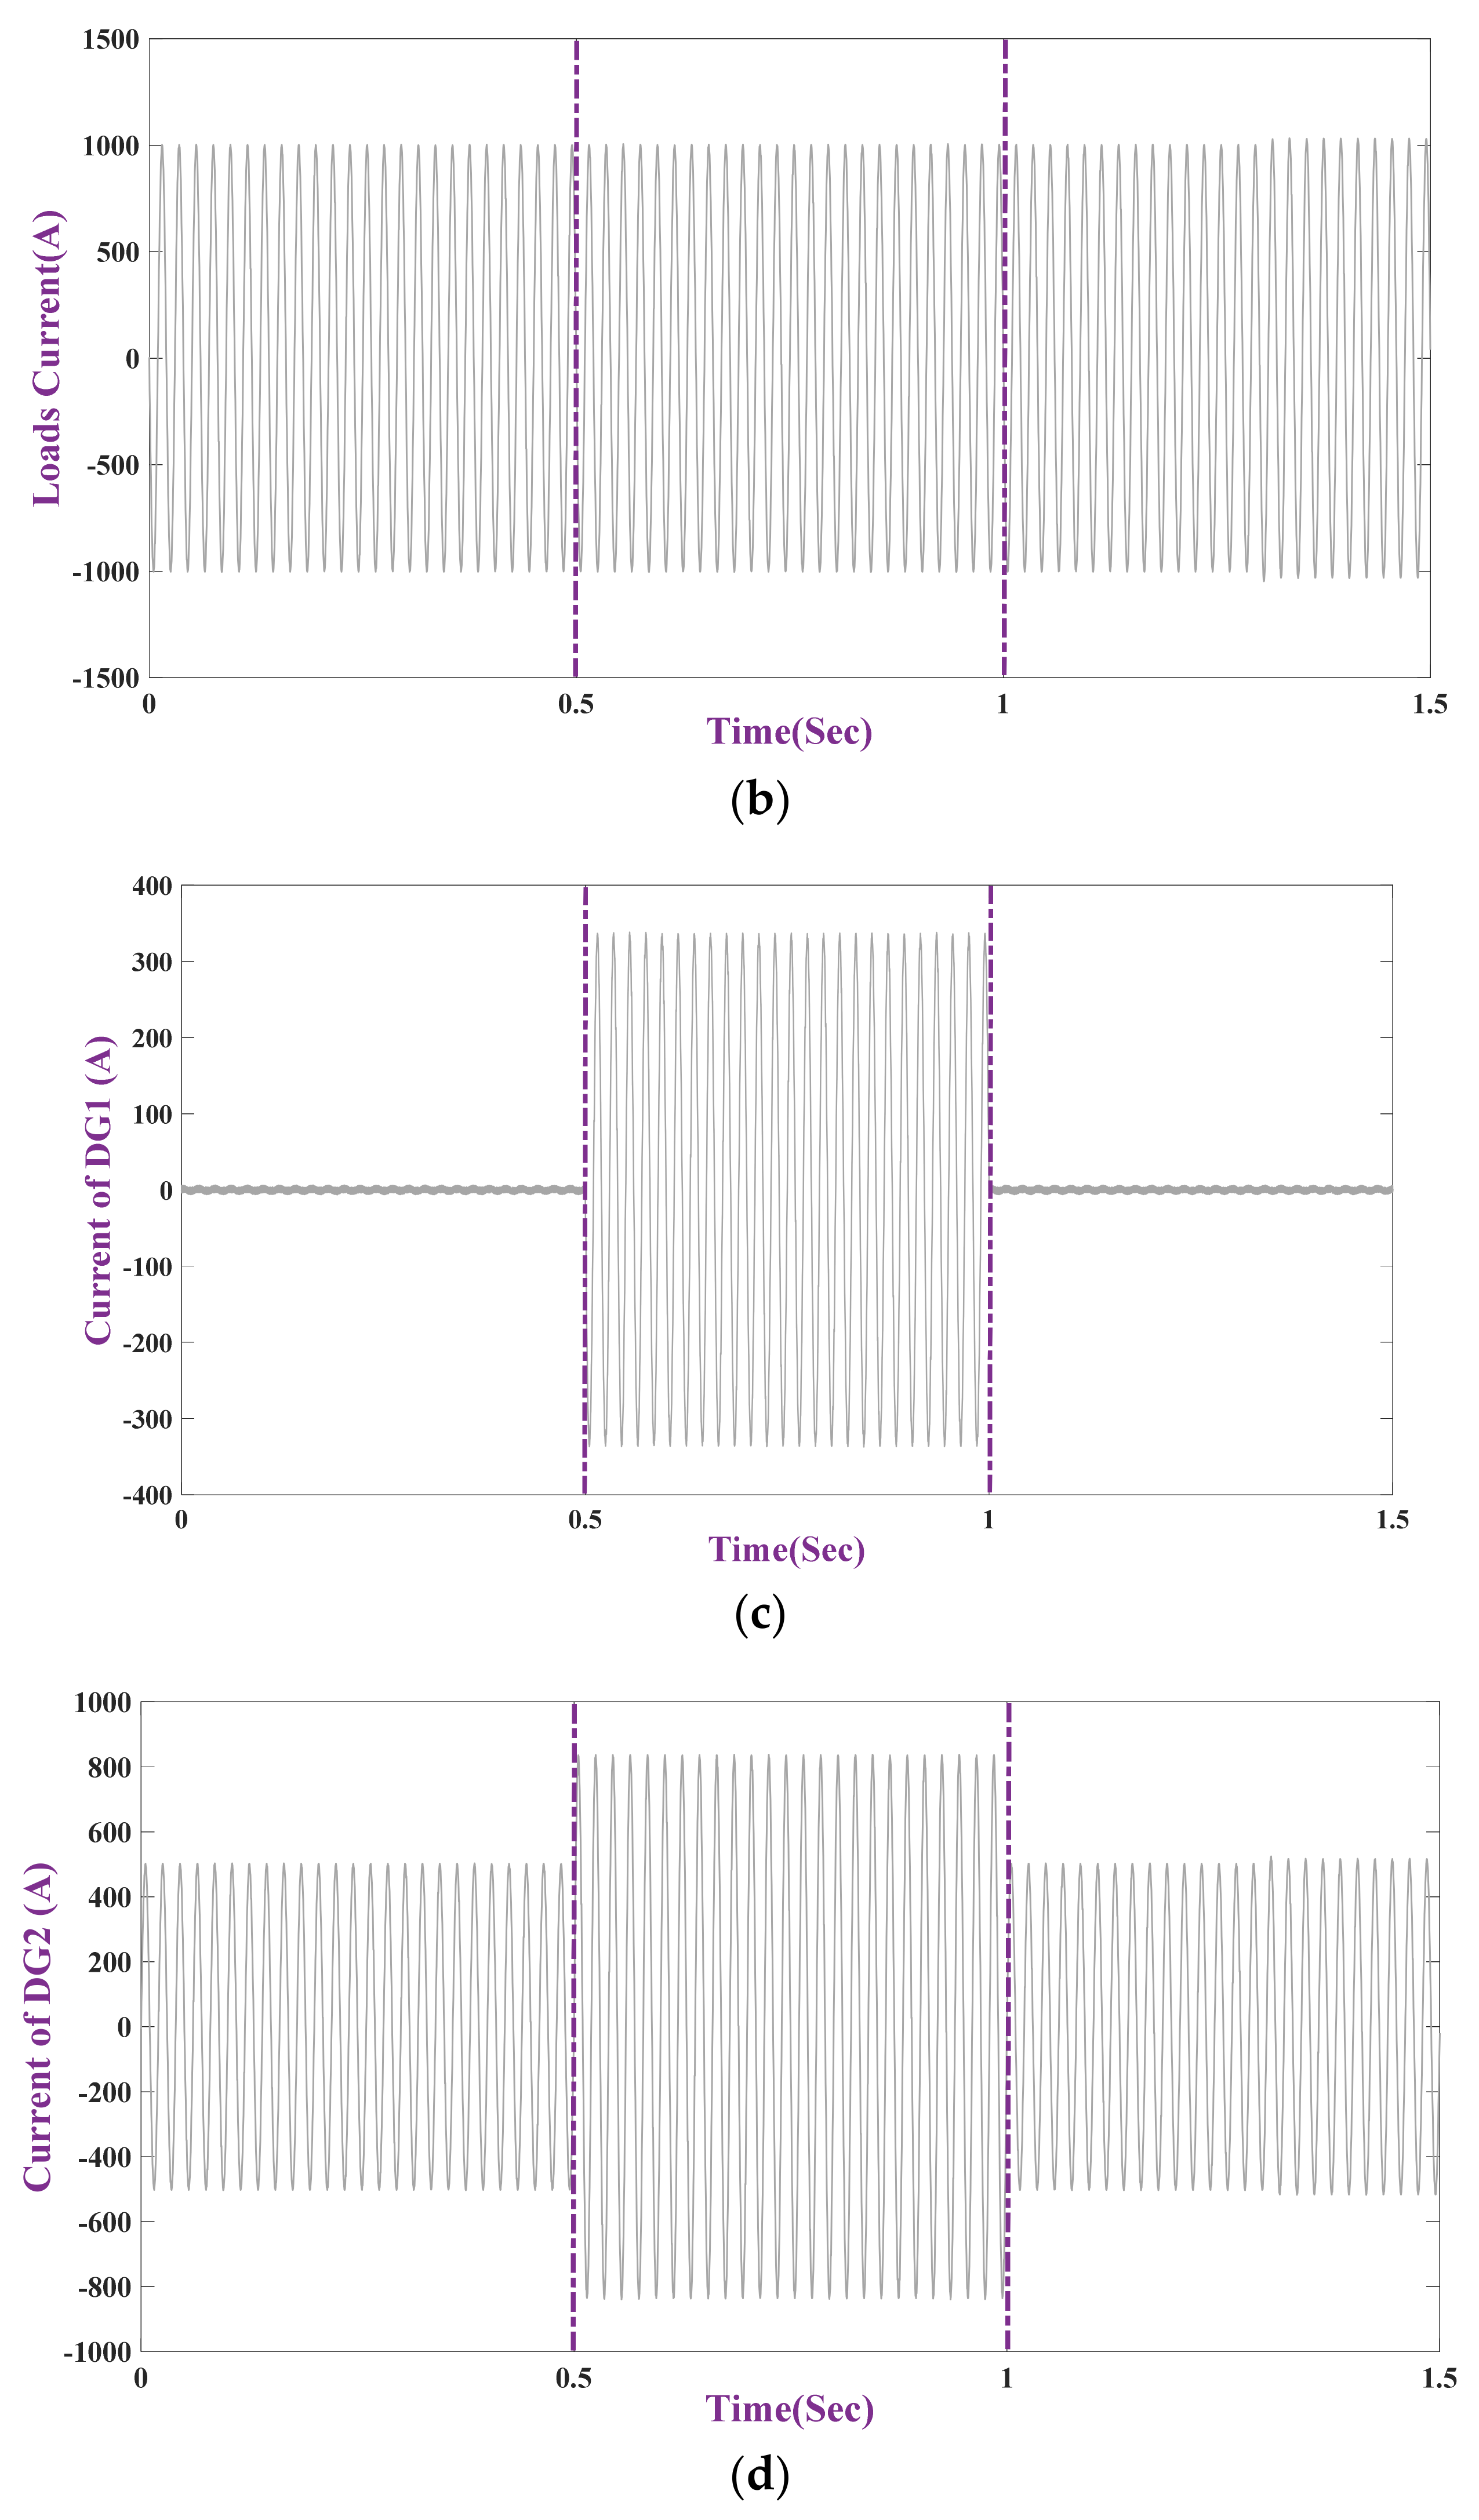
Case study VI: Instability stems from manipulating the load’s current reference waveform (manipulating shared current between unit II and III)
In this case, the efficiency of the FSVs in FDIA detection is considered by manipulating the load’s current reference signal to simulate the FDIA (manipulating shared current between unit II and III).
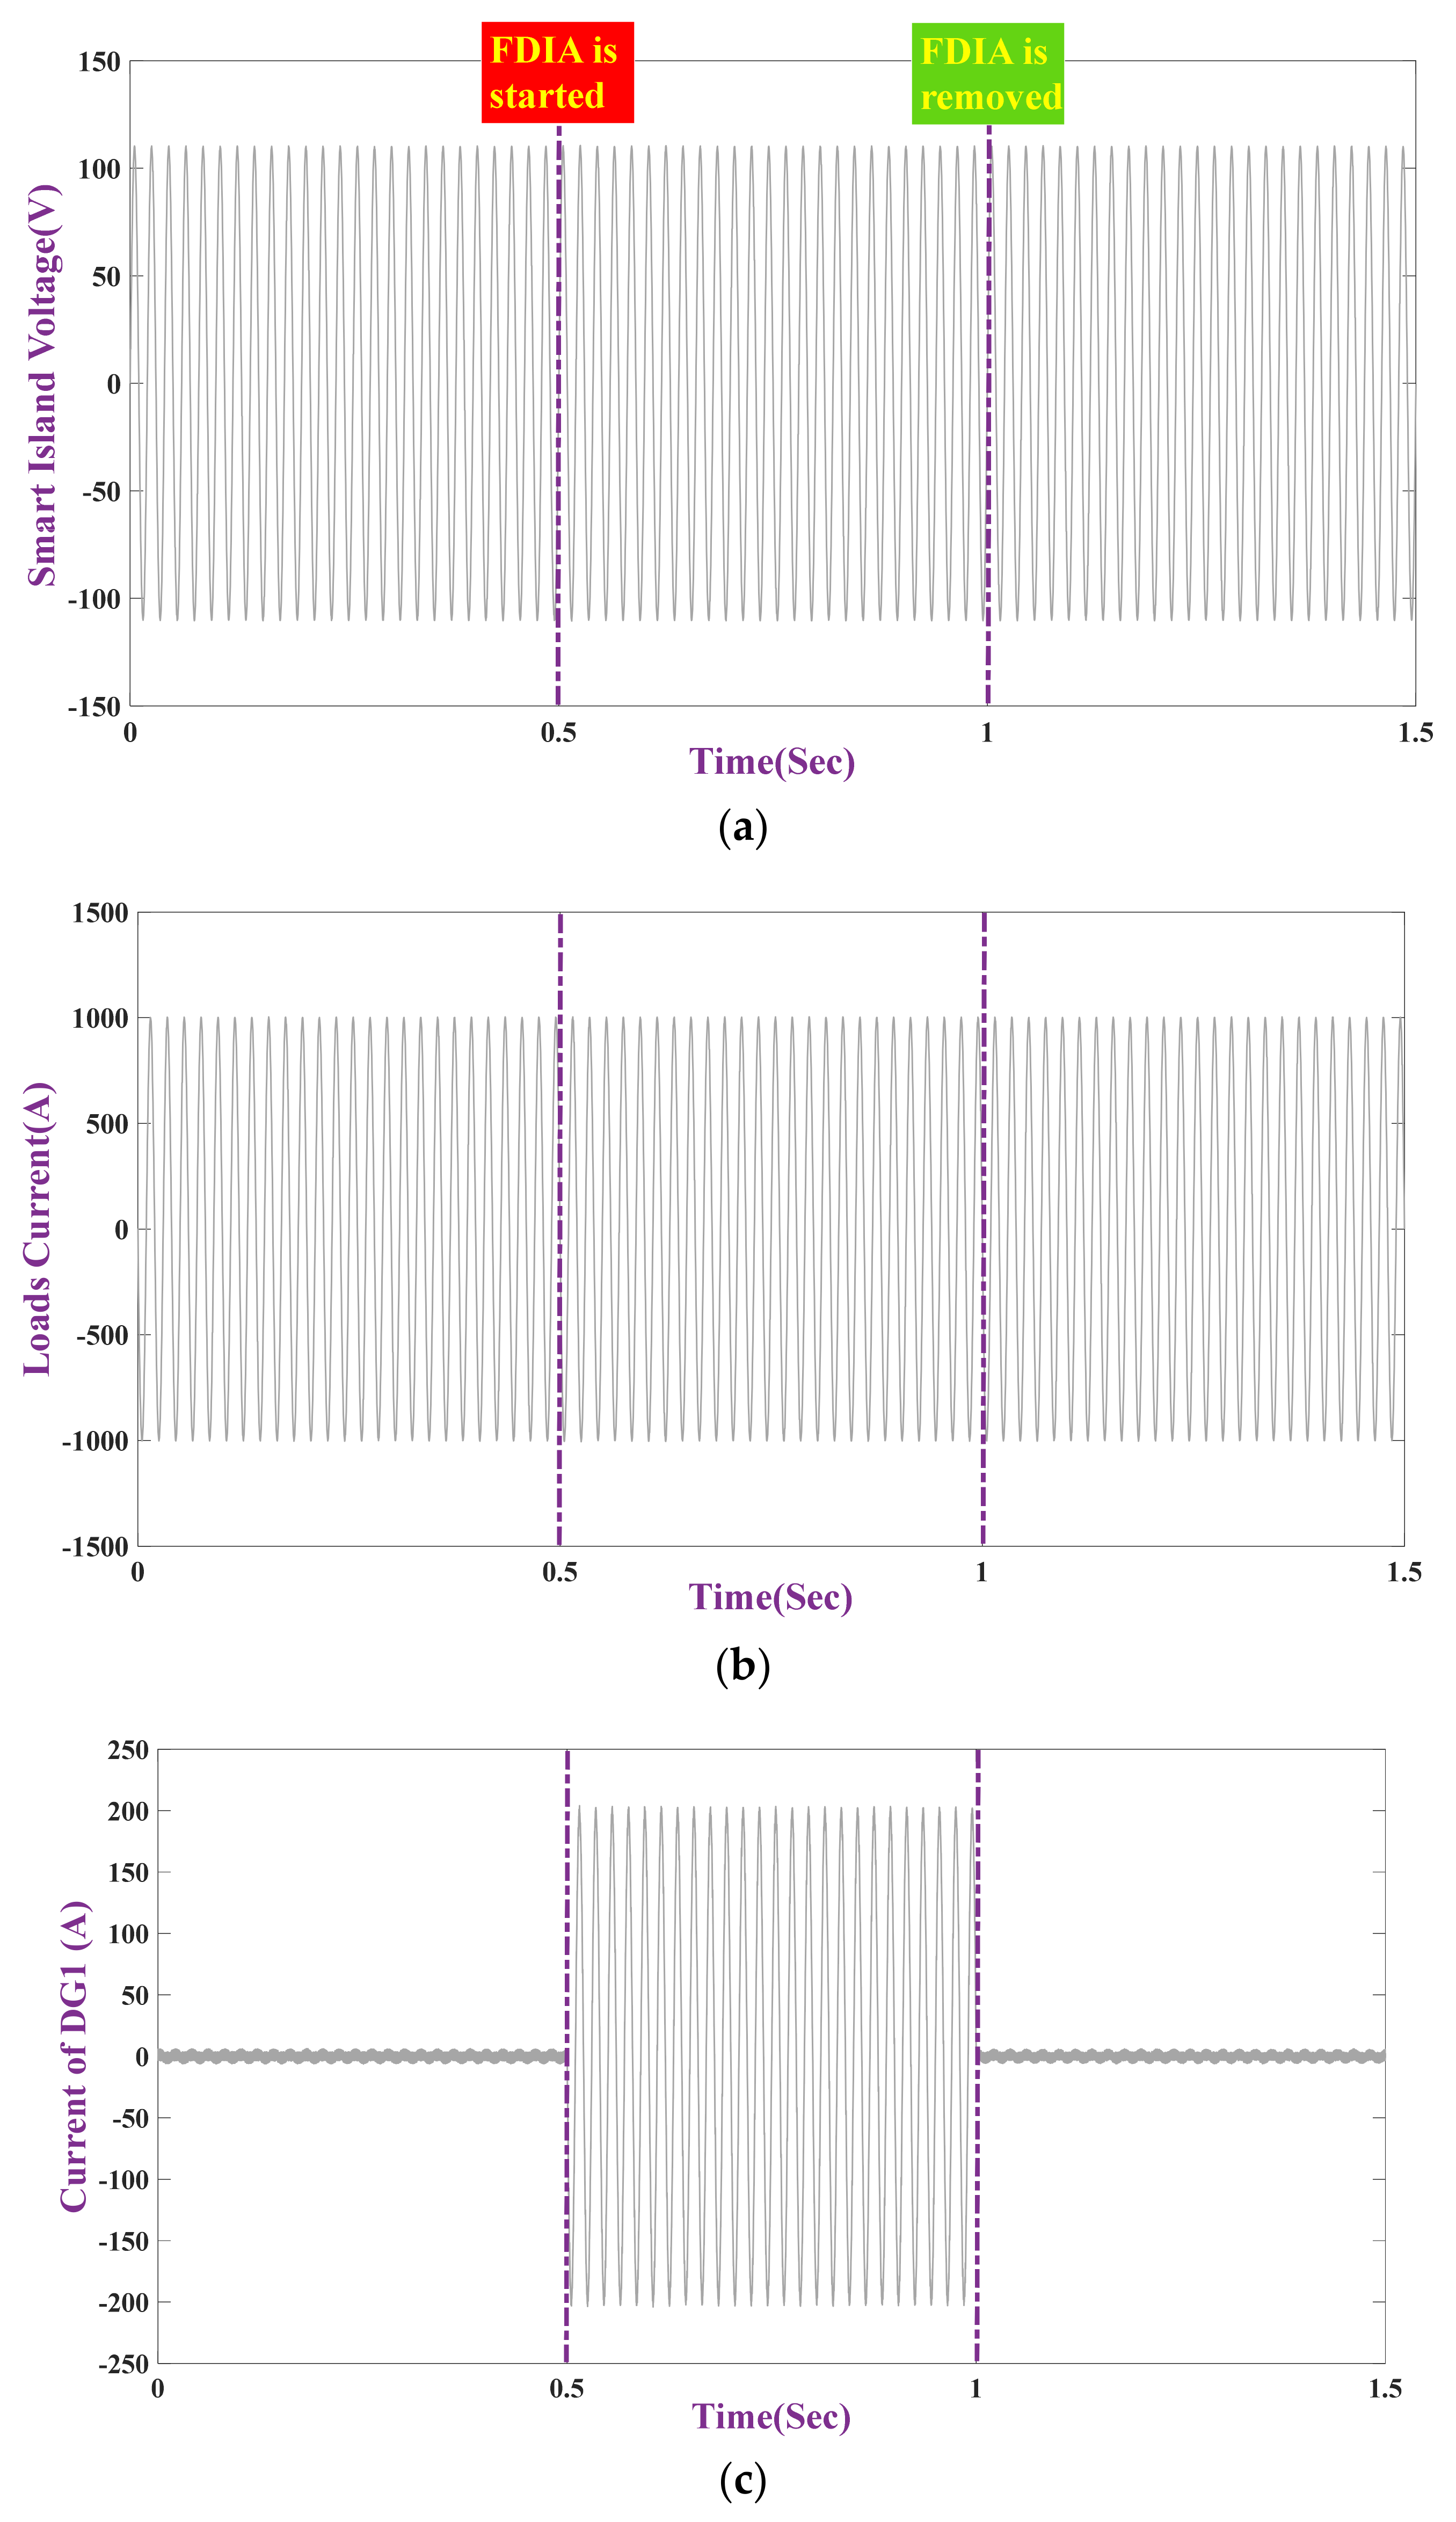
At t = 0.5 s, FDI attack began and at t = 1 s, FDI attack eliminated. To simulate the attack, 20% of amplitude of current is increased in reference signal in the controller by the cyber-attack. The simulation results are demonstrated in Figure 10.
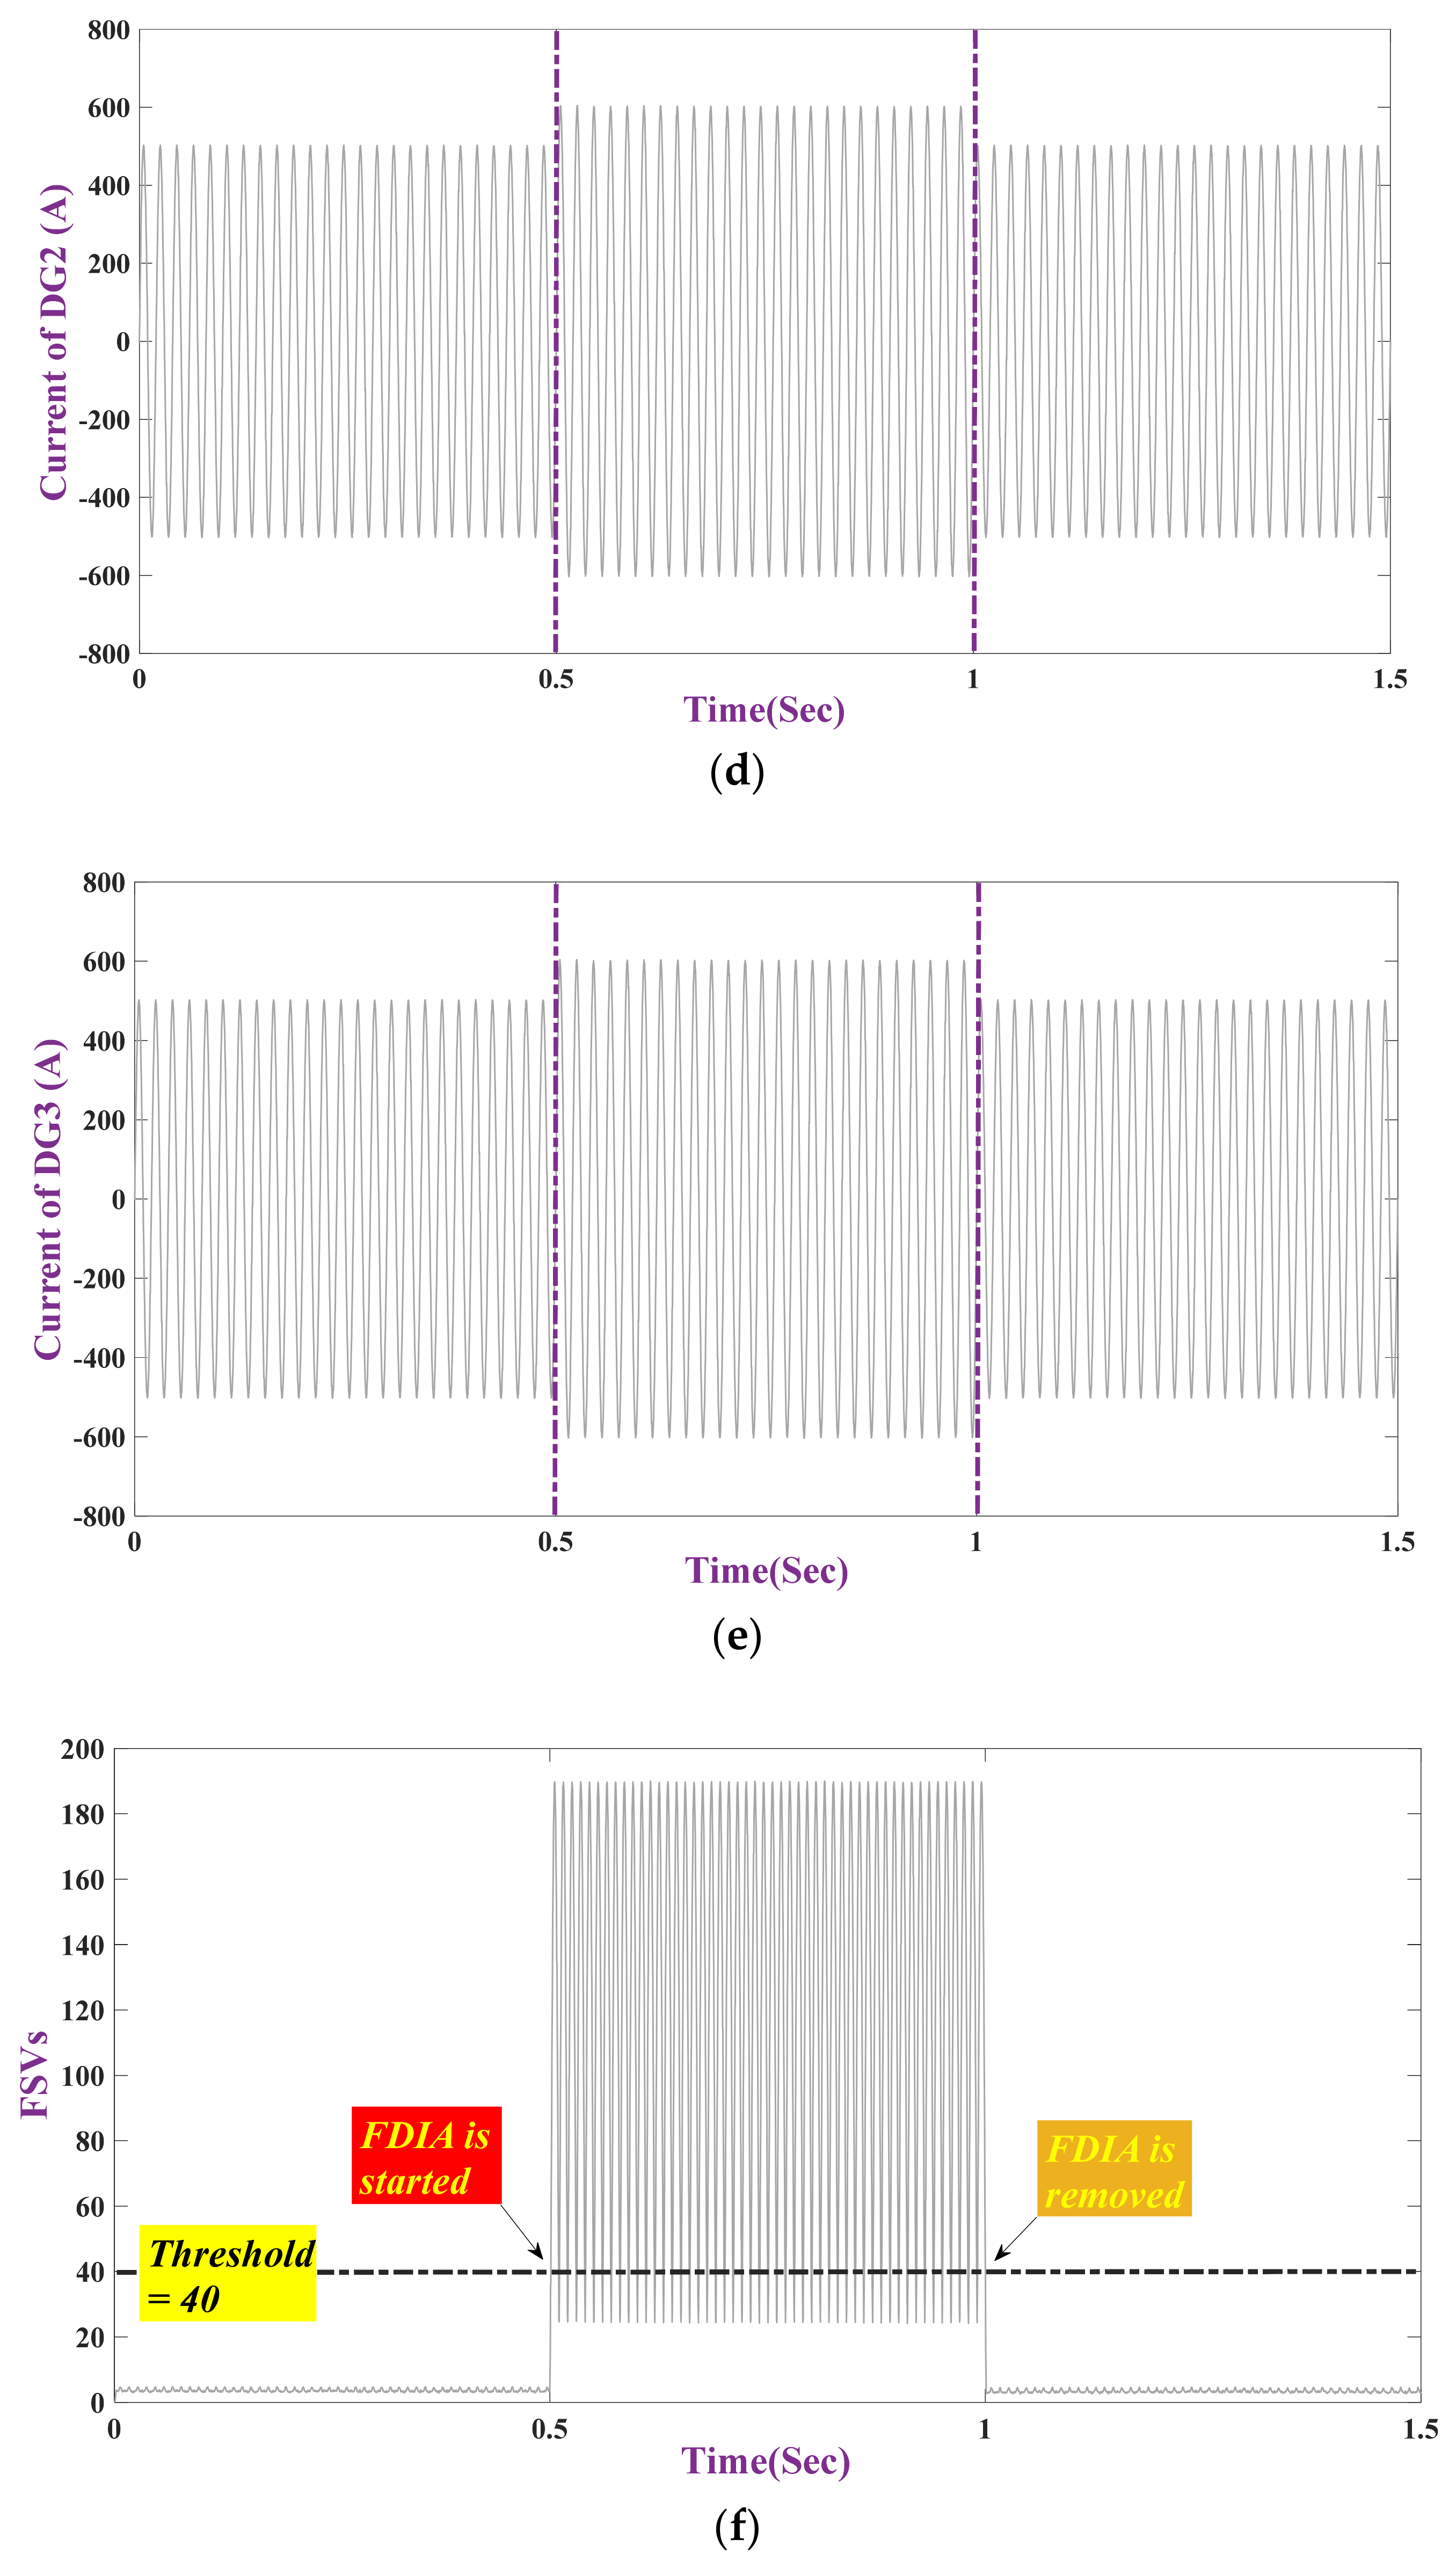
In this case, Figure 10a displays the output voltage of the ISMG. Loads current is explicated in Figure 10b. Figure 10c–e display the , and current, respectively; it has been shown that the generation current of any unit increased during the attack but the load is constant.
Figure 10f illustrates FSVs of signal in the proposed expression and by choosing a threshold as 40, it is able to observe that the declared mechanism is able to successfully identify the attack. Response time of the expressed scheme at the time of FDI attack is depicted in Figure 10g. As shown, the speed of the proposed scheme is allowable and can detect the attack less than 10 ms from the time which the FDIA has occurred.
Case study VII: Instability stems from manipulating current signal that is measured by smart sensor
Manipulating shared current between unit II and III. In this case, the efficiency of the FSVs in FDIA detection is considered via injecting malicious data on current waveform that is measured by smart sensor (manipulating shared current between agent II and III). At t = 0.5 s, FDI attack began and at t = 1 s, FDI attack eliminated. To simulate the attack, the measured current of the ISMG, which is measured by sensor, changed in sensor by the cyber-attack, and amount of current is shown less/more of the real value. The simulation results are represented in Figure 11. In this case, Figure 11a displays the ISMG output voltage. Loads current is exposed in Figure 11b. Figure 11c–e display the , and current, respectively; it can be seen that the generation current of increased during the attack but the load is firm and produced current against the attacked current to omit more current that generated via . Figure 11f shows FSVs of waveform in the proposed expression and via choosing a threshold as 40, it is able to observe that the declared mechanism is able to successfully detect the attack. Response time of the expressed scheme at the time of FDI attack is represented in Figure 11g. As shown, the speed of the presented scheme is allowable and can detect the attack less than 10 ms from the time which the FDIA has occurred.
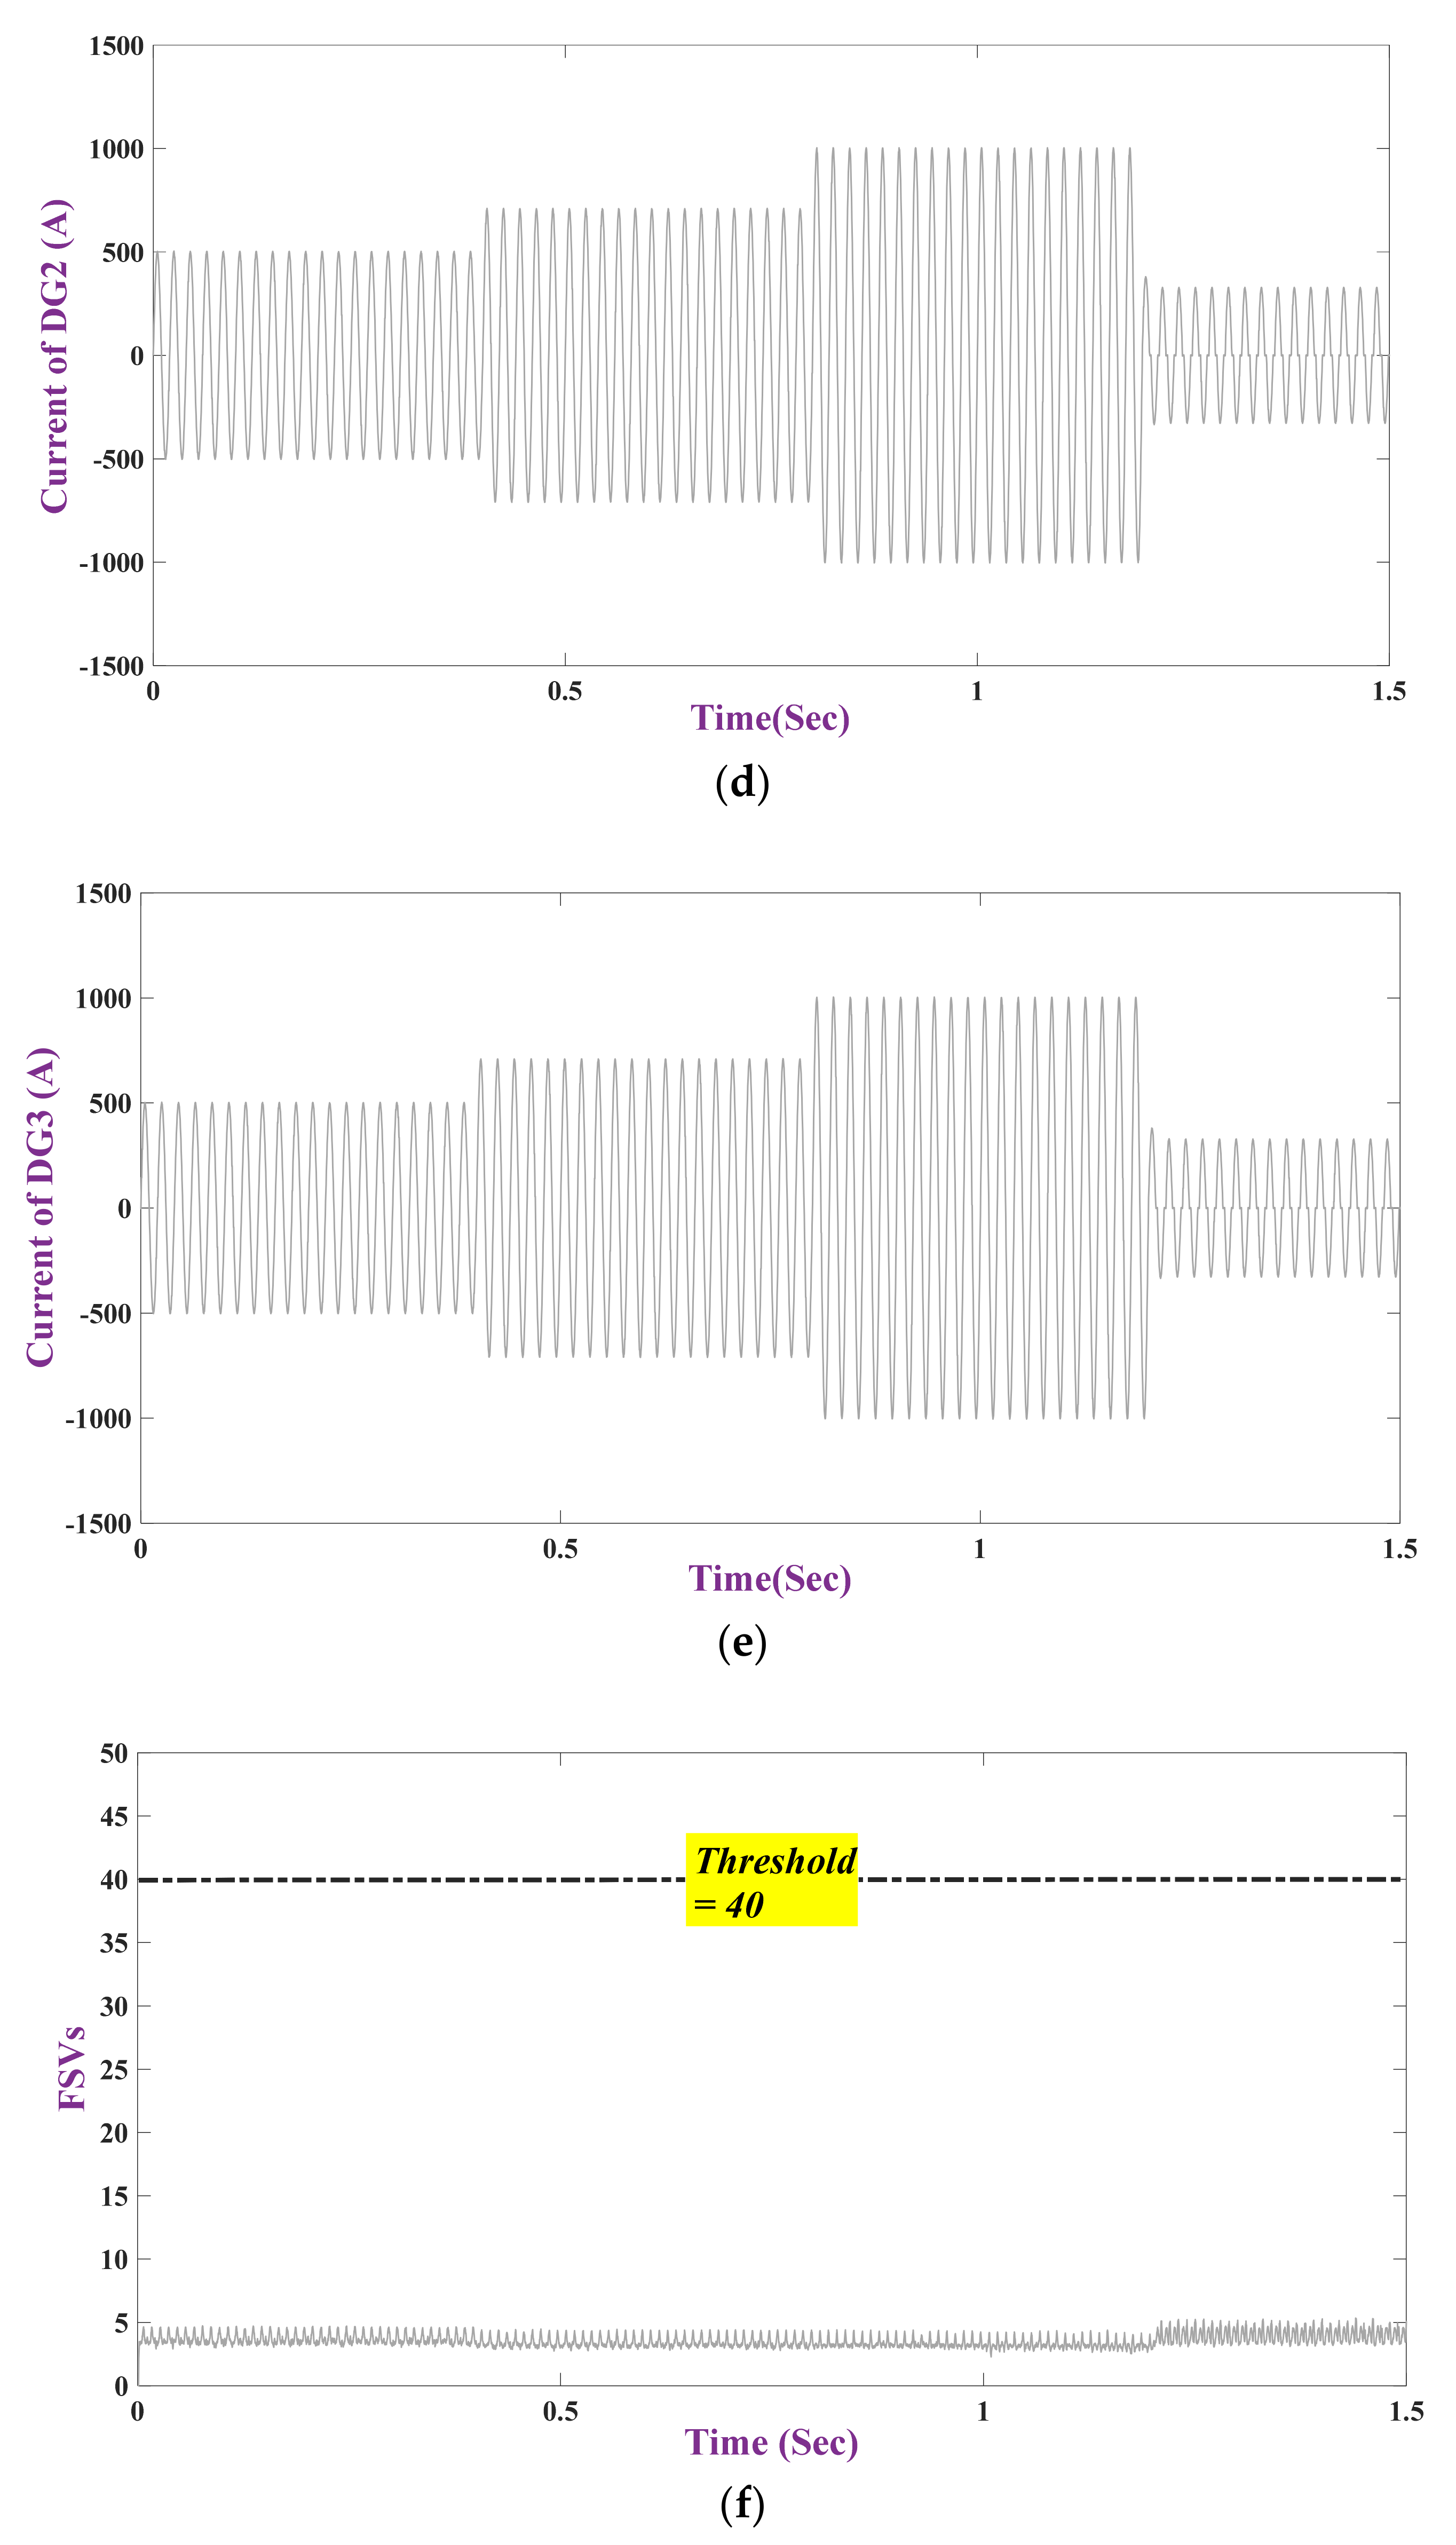
Case study VIII: Load changing
In this case, the efficiency of the FSVs in FDIA detection is evaluated under several load scenarios such as linear/nonlinear loads.
As exposed in Figure 12b, at t = 0.4 s, a resistance load is coupled to the system, and at t = 0.8 s, an inductive load connects, and at s, a nonlinear load is coupled, and the other loads are disconnected. Figure 12a shows the output voltage of the ISMG. Figure 12c–e are depicted as the , and current, respectively. Figure 12f depicted the FSVs of signal in the proposed expression. By choosing a threshold as 40 for cyber-attack diagnosing, it can be seen that the presented scheme is capable to successfully notice FDIA from loads changing.
As shown in Figure 5c to Figure 9c, and from Figure 10f to Figure 12f, via choosing a threshold as 40, the suggested scheme can distinguish the false data injection attack. It is illustrated that the FSVs technique is able to identify FDI attack in several scenarios and distinguish the load changing from cyber-attack.
5. Discussion
To evaluate the performance and efficiency of an expressed mechanism, a confusion matrix has been utilized that has expressed the four feasible results; in which, the genuine datum point tags rendered via a proficient have been compared to the relating datum point outcomes obtained via an exhibited classification mechanism. In this regard, the four feasible results consist of: false alarm rate (AR), correct reject (CR), hit rate (HR), and miss rate (MR). The confusion matrix has been expressed in Table 3 to make a better perception of four mentioned criteria. The declared anomaly detection mechanism is able to engender each of the four mentioned determinations in Table 3 as false negative (FN), false positive (FP), true negative (TN), and true positive (TP). These determinations have been made according to the expressed anomaly detection design repercussion and the genuine system datum.
Multiple instance tests are utilized to consider the validity of expressed FSVs method in FDI attack detection. The FDIA pattern has been applied to consider the proficiency of the declared detection model and the assessment results are illustrated in Table 4 and Table 5. Table 4 gives the expressed detection pattern with the number of testing data for compromised and common data as 1573 and 1394, respectively. As shown in Table 4, 56 tests of 1573 of compromised tests, and 29 tests of 1394 of common tests have not been detected correctly; 1517 tests of 1573 of compromised tests and 1365 tests of 1394 of common tests have been identified correctly. As a result, the detection precision of compromised and common tests are 96.44% and 97.93%, respectively. Table 5 shows the confusion matrix of the expressed detection pattern and comparison with other methods. Furthermore, the Hit Rate of True Positive and Correct Rejection Rate of True Negative of the suggested detection method are 96.44% and 97.93%, respectively. Additionally, False Alarm Rate of False Positive and Miss Rate of False Negative of the suggested detection method are 2.07% and 3.56%. Overall, it could be noticed from Table 4 and Table 5 that the expressed method can identify the FDIAs with detection exactitude above 96% which illustrated the proficiency and performance of the expressed detection model to identify the FDIAs.
To show the performance of the suggested method-based FSVs, a comparison has been considered with other methods as DNN with WT [32], Hilbert–Huang Transform (HHT) and Shallow Model [6] in Table 5. As can be seen, the detection accuracy of suggested methods (FSVs), DNN with WT, HHT and Shallow Model are 96.44%, 95.42%, 93.17% and 89.47%, respectively. It is shown that the detection method based on FSVs has a better performance to detect FDIAs.
The average detection time of suggested methods (FSVs), DNN with WT and HHT are , and , respectively. The DNN training time of DNN with WT method [32] is . As shown in Table 5, DNN with WT has a less average detection time in comparison of FSVs and HHT but FSVs and HHT methods do not have the training time and, therefore, make them faster than DNN with WT method; average detection time of FSVs is less than HHT . Hence, the suggested method-based FSVs has a better performance in comparison of DNN with WT, HHT and Shallow model methods.
6. Conclusions
In this study, a novel FDIA detection scheme for AC in ISMG is suggested. While lots of work toward attacks and detections has been studied and investigated in DC model, rare research has concentrated on the AC peer, where numerous are accepted by ISMG. Current FDIA scheme focuses on FSVs technique. The FSVs method is combined FFT and SVD to elicit an auto feature to describe cyber-attack detection. Results defined FSVs as sensitive to abrupt variations in signals and able to detect FDIA in several conditions. It is proven that the suggested protection layout is a valid and rapid way in FDIA detection under various case studies. The FSVs can detect FDIA in voltage and current, accurately. The proposed scheme is able to distinguish FDIAs from common system operating status variations. To discern the efficiency of proposed FDIA detection scheme, a dynasty of universal simulations on 3-bus ISMG is accomplished. The suggested detector is able to obtain a great attack detection performance. Further, this detection mechanism outperforms the present FDIA detection methods with remarkable precise developments. It has been demonstrated that the offered protection technique is a reputable and quick style in FDI detection under different kinds of operating situations of ISMG. Hence, this study proposed an extremely precise and rapid detection pattern to secure the ISMGs in the face of FDIAs with detection precision above 96%. An extensive and general set of simulations have been executed on an AC-ISMG to appraise the proficiency and performance of the expressed FDI attack detection pattern under several kinds of attack precision.
Assessing the performance of the proposed cyber-attack detection method on a real-time “hardware experiment” is able to be an interesting topic for future works. Additionally, the proposed method can perform on DC–MG and HVDC system as a hot topic. In addition, other cyber-attack methods such as data integrity attack, man in the middle attack, Distributed Denial-of-Service attack, etc., and also other detection methods such as adaptive tuning threshold and deep learning with other signal processing methods can consider and investigate as new subjects.
Author Contributions
Conceptualization, Data curation, Formal analysis, Software, Investigation, Resources and Writing—original draft, M.D. and M.G.; Project administration, Supervision, T.N.; Validation, T.N., P.S., H.H.A., and A.A.-H.; Writing—review and editing; Visualization, Methodology and Funding acquisition, P.S., H.H.A., and A.A.-H. All authors contributed equally to this paper. This research paper is contributed by the authors mentioned above. All authors have read and agreed to the published version of the manuscript.
Funding
The work of Hassan Haes Alhelou and Amer Al-Hinai were supported by His Majesty’s (HM) Fund and Sultan Qaboos University (SQU) under grant number SR/ENG/ECED/17/1.
Institutional Review Board Statement
Not applicable.
Informed Consent Statement
Not applicable.
Data Availability Statement
Data is contained within the article.
Conflicts of Interest
The authors declare no conflict of interest.
References
- Ghiasi, M.; Niknam, T.; Dehghani, M.; Siano, P.; Alhelou, H.H.; Al-Hinai, A. Optimal multi-operation energy management in smart microgrids in the presence of ress based on multi-objective improved de algorithm: Cost-emission based optimization. Appl. Sci. 2021, 11, 3661. [Google Scholar] [CrossRef]
- Yan, Y.; Qian, Y.; Sharif, H.; Tipper, D. A survey on smart grid communication infrastructures: Motivations, requirements and challenges. IEEE Commun. Surv. Tutor. 2013, 15, 5–20. [Google Scholar] [CrossRef] [Green Version]
- Ghiasi, M.; Dehghani, M.; Niknam, T.; Baghaee, H.R.; Padmanaban, S.; Gharehpetian, G.B.; Aliev, H. Resiliency/cost-based optimal design of distribution network to maintain power system stability against physical attacks: A practical study case. IEEE Access 2021, 9, 43862–43875. [Google Scholar] [CrossRef]
- Ten, C.-W.; Manimaran, G.; Liu, C.-C. Cybersecurity for critical infrastructures: Attack and defense modeling. IEEE Trans. Syst. Man Cybern. Part A Syst. Hum. 2010, 40, 853–865. [Google Scholar] [CrossRef]
- Wang, Q.; Tai, W.; Tang, Y.; Ni, M. Review of the false data injection attack against the cyber-physical power system. IET Cyber-Phys. Syst. Theory Appl. 2019, 4, 101–107. [Google Scholar] [CrossRef]
- Dehghani, M.; Ghiasi, M.; Niknam, T.; Kavousi-Fard, A.; Padmanaban, S. False data injection attack detection based on Hilbert-Huang Transform in AC Smart Islands. IEEE Access 2020, 8, 179002–179017. [Google Scholar] [CrossRef]
- Liang, G.; Zhao, J.H.; Luo, F.; Weller, S.R.; Dong, Z.Y. A review of false data injection attacks against modern power Systems. IEEE Trans. Smart Grid 2017, 8, 1630–1638. [Google Scholar] [CrossRef]
- Liang, J.; Sankar, L.; Kosut, O. Vulnerability analysis and consequences of false data injection attack on power system state estimation. IEEE Trans. Power Syst. 2016, 31, 3864–3872. [Google Scholar] [CrossRef] [Green Version]
- Chang, Q.; Ma, X.; Chen, M.; Gao, X.; Dehghani, M. A deep learning based secured energy management framework within a smart island. Sustain. Cities Soc. 2021, 70, 102938. [Google Scholar] [CrossRef]
- Liu, S.; You, S.; Yin, H.; Lin, Z.; Liu, Y.; Yao, W.; Sundaresh, L. Model-free data authentication for cyber security in power systems. IEEE Trans. Smart Grid 2020, 11, 4565–4568. [Google Scholar] [CrossRef]
- Giechaskiel, I.; Rasmussen, K. Taxonomy and challenges of out-of-band signal injection attacks and defenses. IEEE Commun. Surv. Tutor. 2020, 22, 645–670. [Google Scholar] [CrossRef] [Green Version]
- Deng, R.; Xiao, G.; Lu, R. Defending against false data injection attacks on power system state estimation. IEEE Trans. Ind. Inform. 2017, 13, 198–207. [Google Scholar] [CrossRef]
- Yu, Z.-H.; Chin, W.-L. Blind false data injection attack using PCA approximation method in smart grid. IEEE Trans. Smart Grid 2015, 6, 1219–1226. [Google Scholar] [CrossRef]
- Zhu, H.; Giannakis, G.B. Robust power system state estimation for the nonlinear AC flow model. In Proceedings of the 2012 North American Power Symposium (NAPS), Champaign, IL, USA, 9–11 September 2012; pp. 1–6. [Google Scholar]
- Liang, J.; Kosut, O.; Sankar, L. Cyber attacks on AC state estimation: Unobservability and physical consequences. In Proceedings of the 2014 IEEE PES General Meeting|Conference & Exposition, Washington, DC, USA, 27–31 July 2014; pp. 1–5. [Google Scholar]
- Dehghani, M.; Ghiasi, M.; Niknam, T.; Kavousi-Fard, A.; Shasadeghi, M.; Ghadimi, N.; Taghizadeh-Hesary, F. Blockchain-based securing of data exchange in a power transmission system considering congestion management and social welfare. Sustainability 2021, 13, 90. [Google Scholar] [CrossRef]
- Ghiasi, M.; Dehghani, M.; Niknam, T.; Kavousi-Fard, A.; Siano, P.; Alhelou, H.H. Cyber-attack detection and cyber-security enhancement in smart dc-microgrid based on blockchain technology and hilbert huang transform. IEEE Access 2021, 9, 29429–29440. [Google Scholar] [CrossRef]
- Sandberg, H.; Teixeira, A.; Johansson, K.H. On security indices for state estimators in power networks. In Proceedings of the 13th International Conference on Hybrid Systems: Computation and Control (HSCC)., Stockholm, Sweden, 12–16 April 2010. [Google Scholar]
- Wang, J.; Hui, L.C.; Yiu, S.; Wang, E.K.; Fang, J. A survey on cyber attacks against nonlinear state estimation in power systems of ubiquitous cities. Pervasive Mob. Comput. 2017, 39, 52–64. [Google Scholar] [CrossRef]
- Foroutan, S.A.; Salmasi, F.R. Detection of false data injection attacks against state estimation in smart grids based on a mixture Gaussian distribution learning method. IET Cyber-Phys. Syst. Theory Appl. 2017, 2, 161–171. [Google Scholar] [CrossRef]
- Liu, L.; Esmalifalak, M.; Ding, Q.; Emesih, V.A.; Han, Z. Detecting false data injection attacks on power grid by sparse optimization. IEEE Trans. Smart Grid 2014, 5, 612–621. [Google Scholar] [CrossRef]
- Xu, R.; Wang, R.; Guan, Z.; Wu, L.; Wu, J.; Du, X. Achieving efficient detection against false data injection attacks in smart grid. IEEE Access 2017, 5, 13787–13798. [Google Scholar] [CrossRef]
- Guan, Y.; Ge, X. Distributed attack detection and secure estimation of networked cyber-physical systems against false data injection attacks and jamming attacks. IEEE Trans. Signal Inf. Process. Over Netw. 2018, 4, 48–59. [Google Scholar] [CrossRef] [Green Version]
- Esmalifalak, M.; Liu, L.; Nguyen, N.; Zheng, R.; Han, Z. Detecting stealthy false data injection using machine learning in smart grid. IEEE Syst. J. 2017, 11, 1644–1652. [Google Scholar] [CrossRef]
- Ozay, M.; Esnaola, I.; Vural, F.T.Y.; Kulkarni, S.R.; Poor, H.V. Machine Learning Methods for Attack Detection in the Smart Grid. IEEE Trans. Neural Netw. Learn. Syst. 2016, 27, 1773–1786. [Google Scholar] [CrossRef] [Green Version]
- Rahman, M.A.; Mohsenian-Rad, H. False data injection attacks against nonlinear state estimation in smart power grids. In Proceedings of the 2013 IEEE Power & Energy Society General Meeting, Vancouver, BC, Canada, 21–25 July 2013. [Google Scholar]
- Soltan, S.; Yannakakis, M.; Zussman, G. Power grid state estimation following a joint cyber and physical attack. IEEE Trans. Control Netw. Syst. 2018, 5, 499–512. [Google Scholar] [CrossRef]
- Soltan, S.; Zussman, G. EXPOSE the line failures following a cyber-physical attack on the power grid. IEEE Trans. Control Netw. Syst. 2018, 6, 451–461. [Google Scholar] [CrossRef] [Green Version]
- Soltan, S.; Yannakakis, M.; Zussman, G. REACT to cyber attacks on power grids. IEEE Trans. Netw. Sci. Eng. 2019, 6, 459–473. [Google Scholar] [CrossRef] [Green Version]
- Mili, L.; Cheniae, M.; Rousseeuw, P. Robust state estimation of electric power systems. IEEE Trans. Circuits Syst. I Regul. Pap. 1994, 41, 349–358. [Google Scholar] [CrossRef]
- Li, Y.; Li, Z.; Chen, L. Dynamic state estimation of generators under cyber attacks. IEEE Access 2019, 7, 125253–125267. [Google Scholar] [CrossRef]
- Yu, J.J.Q.; Hou, Y.; Li, V.O.K. Online false data injection attack detection with wavelet transform and deep neural networks. IEEE Trans. Ind. Inform. 2018, 14, 3271–3280. [Google Scholar] [CrossRef]
- Manandhar, K.; Cao, X.; Hu, F.; Liu, Y. Detection of faults and attacks including false data injection attack in smart grid using kalman filter. IEEE Trans. Control Netw. Syst. 2014, 1, 370–379. [Google Scholar] [CrossRef]
- Sahoo, S.; Mishra, S.; Peng, J.C.-H.; Dragicevic, T. A stealth cyber-attack detection strategy for DC Microgrids. IEEE Trans. Power Electron. 2019, 34, 8162–8174. [Google Scholar] [CrossRef] [Green Version]
- Chaojun, G.; Jirutitijaroen, P.; Motani, M. Detecting false data injection attacks in AC state estimation. IEEE Trans. Smart Grid 2015, 6, 2476–2483. [Google Scholar] [CrossRef]
- Sahoo, S.; Peng, J.C.-H.; Devakumar, A.; Mishra, S.; Dragicevic, T. On detection of false data in cooperative dc microgrids—A discordant element approach. IEEE Trans. Ind. Electron. 2020, 67, 6562–6571. [Google Scholar] [CrossRef]
- Awan, U. Steering for sustainable development goals: A typology of sustainable innovation. In Industry, Innovation and Infrastructure; Filho, W.L., Azul, A.M., Brandli, L., Salvia, A.L., Wall, T., Eds.; Springer International Publishing: Cham, Switzerland, 2020; pp. 1–12. [Google Scholar]
- Medici, M.; Canavari, M.; Toselli, M. Interpreting Environmental Impacts Resulting from Fruit Cultivation in a Business Innovation Perspective. Sustainability 2020, 12, 9793. [Google Scholar] [CrossRef]
- Ashok, A.; Hahn, A.; Govindarasu, M. Cyber-physical security of Wide-Area Monitoring, Protection and Control in a smart grid environment. J. Adv. Res. 2014, 5, 481–489. [Google Scholar] [CrossRef] [Green Version]
- Lee, E.A. Cyber-physical systems-are computing foundations adequate. In Position Paper for NSF Workshop on Cyber-Physical Systems: Research Motivation, Techniques and Roadmap; Citeseer: Princeton, NJ, USA, 2006. [Google Scholar]
- Duan, P.; Soleimani, H.; Ghazanfari, A.; Dehghani, M. Distributed energy management in smart grids based on cloud-fog layer architecture considering PHEVs. IEEE Trans. Ind. Appl. 2020. [Google Scholar] [CrossRef]
- Mo, Y.; Kim, T.H.-J.; Brancik, K.; Dickinson, D.; Lee, H.; Perrig, A.; Sinopoli, B. Cyber–Physical Security of a Smart Grid Infrastructure. Proc. IEEE 2012, 100, 195–209. [Google Scholar]
- Chandola, V.; Banerjee, A.; Kumar, V. Anomaly detection: A survey. ACM Comput. Surv. 2009, 41, 1–58. [Google Scholar] [CrossRef]
- Kitti, A.; Monthon, L.; Somchat, J. An artificial neural networks application for harmonics measurement in power systems. J. KMUTNB 2008, 18, 2–3. [Google Scholar]
- Donnelly, D. The fast fourier and Hilbert-Huang Transforms: A comparison. Int. J. Comput. Commun. Control. 2006, 1, 45–52. [Google Scholar] [CrossRef] [Green Version]
- Zhan, J.; Zhou, Y. Research on fault detection method for AC servo system using FFT algorithm. In Proceedings of the 2017 International Conference on Advanced Mechatronic Systems (ICAMechS), Xiamen, China, 6–9 December 2017; pp. 303–308. [Google Scholar]
- Zhao, X.; Ye, B. Selection of effective singular values using difference spectrum and its application to fault diagnosis of headstock. Mech. Syst. Signal Process. 2011, 25, 1617–1631. [Google Scholar] [CrossRef]
- Jiang, H.; Chen, J.; Dong, G.; Liu, T.; Chen, G. Study on Hankel matrix-based SVD and its application in rolling element bearing fault diagnosis. Mech. Syst. Signal Process. 2015, 52–53, 338–359. [Google Scholar] [CrossRef]
- Gao, J.; Sun, Z.; Li, D.; Zhou, W.; Chen, C. A novel robust adaptive control of parallel energy resources in smart island. Int. J. Electr. Power Energy Syst. 2021, 128, 106703. [Google Scholar] [CrossRef]
Figure 1.
Proposed FDIA detection scheme.

Figure 2.
Typical CPS sample of AC-ISMG.

Figure 3.
Typical layout of a single-phase distributed generation unit in front of a cyber-attack.

Figure 4.
Studied system: (a) Unit sample; (b) Cyber-physical AC-ISMG with 3 units.

Figure 5.
Instability stems from manipulating the voltage reference signal’s amplitude to simulate the FDIA: (a) ISMG’s voltage; (b) Loads current; (c) FSVs of signals; (d) Time response of FSVs scheme (FDIA is initiated at t = 0.5 s and is omitted at t = 1 s).
Figure 5.
Instability stems from manipulating the voltage reference signal’s amplitude to simulate the FDIA: (a) ISMG’s voltage; (b) Loads current; (c) FSVs of signals; (d) Time response of FSVs scheme (FDIA is initiated at t = 0.5 s and is omitted at t = 1 s).


Figure 6.
Instability stems from getting started on the attack via manipulating the voltage reference waveform’s frequency: (a) ISMG’s voltage; (b) Loads current; (c) FSVs of signals; (d) Time response of FSV’s scheme (FDIA is initiated at t = 0.5 s and is omitted at t = 1 s).
Figure 6.
Instability stems from getting started on the attack via manipulating the voltage reference waveform’s frequency: (a) ISMG’s voltage; (b) Loads current; (c) FSVs of signals; (d) Time response of FSV’s scheme (FDIA is initiated at t = 0.5 s and is omitted at t = 1 s).


Figure 7.
Instability stems from manipulating the voltage reference signal according to shift the signal: (a) ISMG’s voltage; (b) Loads current; (c) FSVs of signals; (d) Time response of FSV’s scheme (FDIA is initiated at t = 0.5 s and is omitted at t = 1 s).
Figure 7.
Instability stems from manipulating the voltage reference signal according to shift the signal: (a) ISMG’s voltage; (b) Loads current; (c) FSVs of signals; (d) Time response of FSV’s scheme (FDIA is initiated at t = 0.5 s and is omitted at t = 1 s).


Figure 8.
Instability stems from manipulating the voltage reference signal through plus noise to the main signal: (a) ISMG’s voltage; (b) Loads current; (c) FSVs of signals; (d) Time response of FSV’s scheme (FDIA is initiated at t = 0.5 s and is omitted at t = 1 s).
Figure 8.
Instability stems from manipulating the voltage reference signal through plus noise to the main signal: (a) ISMG’s voltage; (b) Loads current; (c) FSVs of signals; (d) Time response of FSV’s scheme (FDIA is initiated at t = 0.5 s and is omitted at t = 1 s).


Figure 9.
Instability stems from manipulating a voltage signal that is measured by smart sensor (ISMG’s voltage increased): (a) ISMG’s voltage; (b) Loads current; (c) FSVs of signals; (d) Time response of FSV’s scheme (FDIA is initiated at t = 0.5 s and is omitted at t = 1 s).
Figure 9.
Instability stems from manipulating a voltage signal that is measured by smart sensor (ISMG’s voltage increased): (a) ISMG’s voltage; (b) Loads current; (c) FSVs of signals; (d) Time response of FSV’s scheme (FDIA is initiated at t = 0.5 s and is omitted at t = 1 s).


Figure 10.
Instability stems from manipulating the load’s current reference waveform: Manipulating shared current between agent II and III: (a) ISMG’s voltage; (b) Loads current; (c) Current waveform of ; (d) Current waveform of ; (e) Current waveform of ; (f) FSVs of signals; (g) Time response of FSV’s scheme (FDIA is initiated at t = 0.5 s and is omitted at t = 1 s).


Figure 11.
Instability stems from manipulating on current sensor: Manipulating shared current between agent II and III: (a) ISMG’s voltage; (b) Loads current; (c) Current waveform of ; (d) Current waveform of ; (e) Current waveform of ; (f) FSVs of signals; (g) Time response of FSV’s scheme (FDIA is initiated at t = 0.5 s and is omitted at t = 1 s).


Figure 12.
Load changing: (a) ISMG’s voltage; (b) Load’s waveform current; (c) Current waveform of ; (d) Current waveform of ; (e) Current waveform of ; (f) FSVs of signals.
Figure 12.
Load changing: (a) ISMG’s voltage; (b) Load’s waveform current; (c) Current waveform of ; (d) Current waveform of ; (e) Current waveform of ; (f) FSVs of signals.


Table 1.
Published literature of FDI attack detection in smart electrical systems.
| Reference | Methodology | Detection Procedure | Advantages of Our Suggested Method |
|---|---|---|---|
| [25] | Deep learning | Using DL methods to distinguish the features of behavior of FDI attack via the historical measurement data and utilizing the obtained features for detecting the FDI attack | Utilizing FFT and SVD to obtain properties to compute FSVs |
| [22] | Chi-square detector and cosine similarity matching are used | The outcomes described that the detection method on the basis of Chi-square is not able to diagnose the tested FDIAs | This study is able to detect several FDIAs in ISMG |
| [33] | Kalman filter | Utilizing the mathematical technique in smart grids for detecting the FDI attacks | This paper does not depend on the mathematical model of the system |
| [34] | Cooperative vulnerability factor | Investigating attacks on voltage measurements | Current and voltage measurements have been considered in this work |
| [35] | Kullback–Leibler | Able to detect various attacks; it faces difficulty to detect FDI attacks on certain state variables | Proposed paper does not depend on the state variable to detect FDI attacks and is on the basis of signals properties |
| [36] | A Discordant Element Approach | Investigating attacks on current measurements | Current and voltage measurements have been considered in this work |
Table 2.
DG units’ details.
| Symbol | Quantity | Amount |
|---|---|---|
| DC link input | ||
| The frequency of the voltage | ||
| Inductive filter | ||
| Capacitor filter | ||
| Switching frequency |
Table 3.
Confusion matrix of the expressed detection pattern.
| Label | Genuine Value | ||
|---|---|---|---|
| Detection Pattern Response | Positives | Negatives | |
| Positives | Hit Rate TP | False Alarm Rate FP | |
| Negatives | Miss Rate FN | Correct Rejection Rate TN | |
Table 4.
Expressed detection pattern.
| Label | Number of Testing Data | Known to Be Compromised | Known to Be Common | Detection Precision (%) |
|---|---|---|---|---|
| Compromised | 1573 | 1517 | 56 | 96.44 |
| Common | 1394 | 29 | 1365 | 97.93 |
Table 5.
Confusion matrix results and comparisons.
| Technique | Genuine Value | |||
|---|---|---|---|---|
| Positives (%) | Negatives (%) | |||
| Detection Pattern Response | FSVs | Positives | 96.44 | 2.07 |
| Negatives | 3.56 | 97.93 | ||
| DNN with WT [32] | Positives | 96.38 | 4.58 | |
| Negatives | 3.62 | 95.42 | ||
| HHT [6] | Positives | 93.17 | 5.38 | |
| Negatives | 6.83 | 94.62 | ||
| Shallow Model [6] | Positives | 89.47 | 9.93 | |
| Negatives | 10.53 | 90.07 | ||
| Technique | Average Detection Time | DNN Training Time | ||
| Response Time | FSVs | 10 ms | - | |
| DNN with WT [32] | 3.51 ms | 2713.2 s | ||
| HHT [6] | 50 ms | - | ||
Publisher’s Note: MDPI stays neutral with regard to jurisdictional claims in published maps and institutional affiliations. |
© 2021 by the authors. Licensee MDPI, Basel, Switzerland. This article is an open access article distributed under the terms and conditions of the Creative Commons Attribution (CC BY) license (https://creativecommons.org/licenses/by/4.0/).
Share and Cite
MDPI and ACS Style
Dehghani, M.; Niknam, T.; Ghiasi, M.; Siano, P.; Haes Alhelou, H.; Al-Hinai, A. Fourier Singular Values-Based False Data Injection Attack Detection in AC Smart-Grids. Appl. Sci. 2021, 11, 5706. https://doi.org/10.3390/app11125706
AMA Style
Dehghani M, Niknam T, Ghiasi M, Siano P, Haes Alhelou H, Al-Hinai A. Fourier Singular Values-Based False Data Injection Attack Detection in AC Smart-Grids. Applied Sciences. 2021; 11(12):5706. https://doi.org/10.3390/app11125706
Chicago/Turabian StyleDehghani, Moslem, Taher Niknam, Mohammad Ghiasi, Pierluigi Siano, Hassan Haes Alhelou, and Amer Al-Hinai. 2021. "Fourier Singular Values-Based False Data Injection Attack Detection in AC Smart-Grids" Applied Sciences 11, no. 12: 5706. https://doi.org/10.3390/app11125706
Note that from the first issue of 2016, this journal uses article numbers instead of page numbers. See further details here.