
Stability Analysis of Soil Flow Protector and Design Method for Estimating Optimal Length


1
Seismic Simulation Test Center, Pusan National University, Busan 46241, Korea
2
Department of Development Project Office, Busan Metropolitan Corporation, Busan 47281, Korea
3
Construction Safety Empirical Work Center, Busan Metropolitan City, Busan 46257, Korea
*
Author to whom correspondence should be addressed.
Appl. Sci. 2021, 11(16), 7314; https://doi.org/10.3390/app11167314
Submission received: 17 June 2021
/
Revised: 4 August 2021
/
Accepted: 8 August 2021
/
Published: 9 August 2021
(This article belongs to the Special Issue Advances in Geotechnologies in Infrastructure Engineering)
Abstract
:Underground cavities can develop below structures, leading to ground settlement and hindering the development of urban infrastructure. Soil flow protectors (SFPs) have been developed to prevent and alleviate problems due to the formation of such cavities. In this study, we performed scaled model experiments to develop a design method for an SFP with an adequate safety factor under different installation lengths of its upper and lower parts in sandy ground. The installation of the SFP reduced the average surface settlement ratio to the range of 0.44–0.72, thus demonstrating its effectiveness in reducing ground settlement. In addition, we proposed a relational equation for determining the optimal length ratio of the SFP and the settlement ratio. An analysis of the influencing factors showed that the lower part of the SFP influenced the settlement reduction, whereas the upper part influenced the stability of the SFP depending on the ground settlement ratio. Finally, we have proposed an optimal length equation for the SFP and presented a flowchart for the design method. The results of this study can serve as a design basis for the efficient construction of infrastructure.
1. Introduction
Structures such as abutments and box culverts, which serve as connections between roads and bridges or between two roads, are typically supported by pile foundations on rigid ground. Although they generally experience limited amounts of ground settlement, cavities are created due to water movement and internal soil erosion, and also cause by consolidation, drying shrinkage, and poor compaction as time passes (Figure 1a). In addition, the inflow of groundwater and soil from the surrounding ground at the point where the cavities occur can cause rapid settlement.
Hearn [1] reported that ground erosion due to water penetration underneath a structure can be attributed to cavity formation. White et al. [2] confirmed that cavities can develop below a structure due to the lack of compaction and settlement of the backfill. Briaud et al. [3] noted that surcharges on compressive ground can cause cavities to develop. Moreover, the occurrence of differential settlement (Figure 1b) in the soil causes faults relative to the surrounding ground; this displaces the underground water and soil, thus developing a cavity, which causes rapid ground settlement or ground failure [4,5,6]. The stress relaxation area of the surrounding ground expands continuously, inducing faster settlement [7]. However, it is difficult to provide a clear solution to these problems because the ground conditions, cavity shape, and ground abnormalities have a complex correlation [8].
The most frequently used measure to address these problems is the overlay method. However, in reinforced ground, the continuously overlaid pavement load causes the continuous settlement of the adjoining ground and reduces the usability of public roads owing to ongoing construction, which incurs additional economic and social costs. Therefore, there is no clear solution to the problems caused by ground settlement. In addition, the currently used measures are highly inefficient in terms of economic feasibility, constructability, and usability. Therefore, it is necessary to explore construction methods that can prevent ground settlement due to cavity development below structures.
Based on this necessity, engineers have developed a soil flow protector (SFP) that can be easily installed beside a structure to reduce or prevent the various problems due to the development of cavities underneath structures supported by pile foundations. By installing the SFP beside the structure, as shown in Figure 2a, soil inflow is blocked from the adjacent ground into the cavity, thus ensuring stability. When ground settlement occurs, the SFP moves downward to the same extent. Even after the cavity develops, the soil in the adjacent ground continues to block the soil inflow into the cavity, which prevents the sudden settlement of the adjacent ground [9]. In other words, preventing the rapid settlement of the ground improves the stability of the structure, thus aiding sustainable urban development.
According to Suchowerska et al. [8], studies on cavity and surface settlement adopt the following techniques: empirical data utilization, calculations through analytical methods, and simulation techniques using numerical models. Among these, the empirical methods include field tests for full-size models and scaled models. In the former case, it is advantageous to predict future settlement through physical behavior; however, experimenting under different conditions is difficult because of time and cost constraints. In contrast, the latter case avoids these constraints, and it allows the analysis of settlement mechanisms under different conditions. Therefore, it is extremely important to analyze the influence of SFP installation on the trends and behavior of a ground settlement under various conditions through scaled model experiments.
Prior to performing the experimental investigation, we performed a literature review to analyze and verify the results of existing scaled model experiments, verified the reliability of the study results, and performed additional research to complement existing results.
Yoo et al. [9] experimented by classifying the material stiffness of SFPs in terms of their flexibility and rigidity in sandy soil. They divided the SFPs into upper and lower sections based on the lower edge of the box structure and varied the installation length from 0 to 300 mm. The installation of the SFP reduced settlement, particularly for rigid SFP materials. Settlement also decreased with the increase in the installation length of the SFP, and the ratio of the settlement gradually decreased over a certain installation length. In summary, they proposed the optimum length ratios of 1.38 and 0.73 for flexible and rigid SFPs, respectively. Here, the length ratio is the length of the SFP divided by the height of the box structure.
In previous studies, experiments were conducted by increasing the upper and lower installation lengths of the SFP at the same ratio, and the optimum length ratio between the overall length of the SFP and the height of the box structure was proposed for calculating the optimal length. However, the settlement of the ground and the change trend in the upper and lower section lengths of the SFP should also be considered. Moreover, in applying the results of a prior scaled model experiment in a field test, the SFP length was determined without considering the ground settlement and the earth pressure. Therefore, the overall length of the installed SFPs was too short. Subsequently, the lengths of the upper and lower SFPs were set differently, considering the stability of the earth pressure, and the results differed from those under the installation conditions reported in the previous study. To consider the effects of SFPs with different lengths and ground conditions, additional field tests should be executed. However, field tests are expensive and time-consuming.
Therefore, in this study, we conducted a scaled model experiment to analyze the ground surface settlement reduction effect and suggest an optimal installation length based on the influencing factors with the SFP installed. We achieved this by analyzing the effects of changes in the installation lengths of the upper and lower sections of the SFP in sandy soil, as well as the interactions between the SFP and the ground. Furthermore, we varied the installation lengths of the upper and lower sections of the SFP to determine the relationship between the settlement volume based on changes in the installation length of the SFP, and we confirmed the behavior of the SFP and the adjoining ground through visual analyses. Finally, we determined the optimal installation length, while considering economic feasibility and stability by aggregating the results of existing research and those of the scaled model experiments performed in this study.
2. Scaled Model Experiment
2.1. Test Programs
Yoo et al. [9] conducted three additional experiments under non-reinforced conditions because they obtained different results for the common settlement behavior due to the inflow of ground soil adjacent to the box structure into the cavity. To evaluate the settlement behavior of the SFP for different upper and lower installation lengths, they fixed the lower lengths of the SFP at 100 and 150 mm, and increased the upper length from 50 to 200 mm in increments of 50 mm. In this manner, they conducted a scaled model experiment involving seven cases. Table 1 lists the experimental conditions.
2.2. Experimental Setup
2.2.1. Similitude Law
It is necessary to consider the similitude ratio when fabricating an experimental model. The analogy law represents the relationship between an actual prototype and a scaled model. This law is based on dimensional analysis, which is a mathematical technique for inferring the theoretical relationship between variables to explain physical phenomena. Model-based experiments that do not consider the similitude ratio yield incorrect predictions of quantitative behaviors. Therefore, before conducting a model experiment, it is necessary to define a prototype that can meet the research objectives and to identify and apply a similitude ratio that conforms with the behavior of the prototype. These are performed to review the model behavior [10].
To solve the aforenoted problems, many researchers have proposed various methods for model ground construction and verification. Kagawa [11] studied the similitude laws of ground structures subjected to dynamic loads that use force ratios. Kokusho and Iwatate [12] studied the similitude laws of the nonlinear dynamic responses of soils using Buckingham’s π theorem. Iai [13] proposed the overall analogy of a saturated soil–fluid–structure system based on the geometrical similitude ratio (λ) and the similitude ratio with respect to the density (λρ) and strain (λε). Iai and Sugano [14] classified the similitude law introduced by Iai [13] into three types, using the concepts of cyclic mobility and strain softening. They also conducted a 1-G shaking table model reduction experiment on a quay wall structure by applying the similitude law.
In this study, we used the similitude law and dimensional analysis suggested by Iai [13] (Table 2) and applied a similitude ratio (λ) of 18. We applied this similitude ratio of 18 to consider the size of the field and scaled model tests. For the tests presented in this paper, we used type 3 similitude because it is a strain-softening type with constant deformation even after the vibration stops, and a size–strain relationship cannot be introduced owing to the large deformation. We applied the value calculated using the relational expression of each parameter to the scaled model experiment using the applied similitude ratio.
2.2.2. Plane Strain Soil Tank
The box structure applied in this study was a continuous structure connected to the road. We conducted the experiments using a plane strain soil tank (PSST), as shown in Figure 3, to apply the plane strain conditions. We simplified the behavior in two dimensions [15,16] to compare and analyze the results. The interior of the PSST had a length of 1700 mm, a height of 760 mm, and a width of 410 mm. We prepared a 30-mm-thick wall made of modeling clay with transparent acrylic and suppressed the deformation using steel reinforcements. Furthermore, we installed a vibration motor at the bottom of the PSST and a spring to easily transmit the generated vibration. The vibration load was applied to simulate the ground settlement behavior. This differs from actual ground settlement conditions; however, the purpose of this study was to analyze the effect of ground settlement reduction with an SFP installation and to calculate the optimum length in the event of a ground settlement. Therefore, we forcibly generated a ground settlement by applying a vibration load for 1440 s.
2.2.3. Experimental Model
The actual box structure is generally supported on solid ground using a pile foundation. However, in this study, we fixed it to the upper frame of the model earth to ensure that the weight of the box structure did not cause settlement. The box structure model was 408 mm wide, 350 mm long, and 340 mm high; it was prepared using 20-mm-thick acrylic, as shown in Figure 4a. The height of the ground adjacent to the actual box structure was 250 mm from the bottom of the box structure. In addition, in the SFP model, a rectangular acrylic plate with a thickness of 10 mm was used to resist the earth pressure due to the settlement, as shown in Figure 4b. We varied the height of the SFP from 150 to 350 mm in increments of 50 mm depending on the experimental conditions; a width of 408 mm, i.e., with a clearance of 1 mm, was set on both sides to avoid friction between the SFP and the PSST wall.
2.2.4. Ground Material
The ground material was prepared with Jumunjin standard sand from the Jumunjin area, which is commonly used for research in Korea [17,18,19]; Table 3 presents its physical characteristics. This sandy soil maintains a constant density, rendering it suitable for creating a ground for experiments. This is because the density varies with the drop height (Figure 5a), whereas the mechanical properties vary with the density (Figure 5b,c). Therefore, in this study, we used the air pluviation method [20,21,22,23] to ensure a constant ground density. The key factors affecting the relative density of the air-pluviated sand include the particle drop height [24] and the rate of deposition [25]. The drop height of the sand was 0.1 m, its average dry density was 1.487 g/cm3, and the relative density was 44.5%.
2.3. Experimental Method
The model test procedures consisted of five steps: ground composition, small-scale box structure and SFP installation, vibration generation, image acquisition, and settlement measurement.
First, to create a loose sandy ground with a constant density, we dropped the sand from a drop height of 0.1 m. We installed the SFP model in advance while considering the horizontal position of the box structure, and applied grease between the wall surfaces of the PSST and the SFP models. As the SFP model (408 mm) was narrower than the PSST model (410 mm), the applied grease prevented the sand from the constructed ground from flowing toward the SFP model.
Second, we conducted the experiment by applying air pluviation to the lower level where the SFP model was installed. Thereafter, we dropped sand onto the bottom level where the box structure was installed to ensure that no differences occurred in the earth pressure between the front and back surfaces of the SFP model. To prevent penetration and minimize the friction of the sand, we applied grease to the contact surface between the box structure and the SFP model when installing the box structure.
Third, to analyze the effect of the SFP settlement reduction, we forcibly generated the settlement of the soil in the PSST using a vibration motor installed under the PSST. The settlement was the highest after a vibration time of 1440 s.
Fourth, for the visual analysis, we monitored the variations in the ground behavior and the SFP model from the front of the PSST.
Fifth, after applying the vibration for 1440 s, we measured the settlement at each point from 0.1 B to 3.0 B on the model structure based on the width of the box structure (B = 350 mm). The settlement was measured at the front, middle, and rear of the wall surface of the PSST and the obtained values from the three locations were averaged. Figure 6 presents the installed ground, box structure, and SFP model. We applied the experimental conditions of the structure and ground at half sections to evaluate the settlement behavior up to a certain distance from the box structure during the scaled model experiment. This allowed the observation of the settlement reduction due to wall friction on the left side of the PSST; however, settlement reduction only appeared on a small section along the wall, which had little effect on the overall settlement beneath the box structure. In addition, the rightmost end of the model soil was located at a distance of more than three times the width of the box structure B, which helped to minimize the impact on the settlement behavior due to the wall friction.
Finally, the experimental results were summarized in terms of the ratio between the distance from the end of the box structure and the width of the box structure. We compared the results and analyzed them based on the surface settlement at the corresponding point when the SFP was not installed.
3. Results and Analysis
3.1. Settlement
The largest settlement occurred in areas adjacent to the structure, similar to the results reported by Yoo et al. [9]. However, the various ground settlements studied by Briaud et al. [3] and White et al. [2] were mostly due to surcharge or the weight of the ground. In this study, the forced settlement was due to the vibration loads, yielding a different result in each experiment. Therefore, we averaged the test results when the SFPs were not installed to ensure the reliability of the research outcome.
Table 4 summarizes the average settlement ratios with and without the SFP. With the SFP, the surface settlement ratio ranged from 0.44 to 0.72, indicating a reduction in the surface settlement. In the absence of the SFP, the soil flowed beneath the box structure, as shown in Figure 7. This resulted in a more rapid settlement of the adjoining ground of the box structure. In comparison, in the presence of the SFP (Figure 7), the inflow of the soil into the cavity beneath the box structure was blocked, which reduced the surface settlement.
The average settlement ratios for the lower SFP lengths of 50, 100, and 150 mm were 0.71, 0.47, and 0.44, respectively; the settlement decreased with an increase in the lower length. However, the results obtained with an increase in the upper length were as follows. (1) The settlement reduction was minor in comparison to that due to the increase in the lower length (Figure 8 and Table 4). (2) The settlement tended to increase across the test cases, as depicted in Figure 9. Based on this result, the surface settlement was predominantly affected by the changes in the lower length of the SFP. (3) There was a proportional relationship, in which greater settlement corresponded to greater dry density. This shows that settlement farther away from the box structure correlates to greater dry soil density after the test.
3.2. Optimal Length Ratio
The optimal length ratio (OLR) is the installation length of the SFP divided by the height (h) of the box structure; this is used in practical field applications. It is difficult to apply the results of scaled model experiments to a full-size structure. Therefore, it is advantageous to apply the OLR while considering the height of the structure.
To calculate the OLR of the SFP, previously reported results and those from the scaled model experiments conducted in this study can be depicted as a graph of the relationship between the surface settlement ratio and the ratio of the lower length of the SFP to the box structure height, as shown in Figure 10. The relationship is represented by Equation (1), where α = 1.394 and β = 0.297. The results show that the surface settlement decreases with the increase in the length, and the trend gradually converges above a certain length. The optimum surface settlement ratio and the ratio of the lower length of the SFP to the height of the box structure (h = 250 mm) are 0.34 and 0.45, respectively.
3.3. Stability
Practically applying the SFP requires the establishment of relevant standards and design methods. To apply a relevant design method, the stability of the SFP should be reviewed. For this purpose, we examined the behavior of the SFP and the deformation in the ground for stability against the soil pressure using visual analyses. As shown in Figure 11a, the settlement increases with the distance from the box structure and proceeds in the downward direction of the structure. As shown in Figure 11b, movements of the upper part of the SFP wall in the opposite direction to the structure and of the lower part in the direction of the structure have occurred.
The upper and lower parts of the SFP can be classified based on the lower edge of the structure; the surrounding ground and the structure were considered to be the front and rear sides, respectively. During the initial stage, the earth pressure acting on the SFP penetrated the ground and generated an active earth pressure at the front of the SFP and a passive earth pressure at the rear; the state of the static earth pressure resulted in a settlement. However, the direction of the ground’s behavior at the front surface of the SFP was not clearly shown in this study. If the ground movement and the movement of the upper part of the SFP occur in opposite directions, a passive earth pressure is generated, and no earth pressure acts on the SFP wall in the same direction. Yoo et al. [26] performed an inverse analysis based on the numerical analyses of the results of inclinometer tests (Figure 12a) performed during field experiments. As shown in Figure 12b, the upper part of the SFP moves toward the outside of the structure. Therefore, it was confirmed that the displacement occurred in the lower front part of the structure; thus, the earth pressure occurred at the upper front of the SFP at rest, whereas the active and passive earth pressures occurred at the lower front and the rear side, respectively.
Based on the results obtained by Yoo et al. [26], we considered the earth pressure acting on the upper part of the SFP conservatively to be zero during the safety assessment of the structure. Figure 13 presents a schematic for analyzing the stability of the SFP against the soil pressure. The safety factor (Fs) was calculated by considering the active earth pressure on the lower front surface of the SFP, the passive earth pressure on the rear surface, and the ground load on the upper front surface of the SFP. A standard safety factor of 1.2 was used for the retaining wall. The temporary earth retaining wall design standard gives a standard safety factor of 1.2 [27]. As a result, the safety factor was 1.690 when the optimum length ratio was 0.34 and the surface settlement ratio was 0.45; even with a settlement of 82.3 mm, the safety factor was 1.2 or higher. However, the surface settlement ratio did not increase significantly with an increase in the lower length of the SFP.
3.4. Design Method
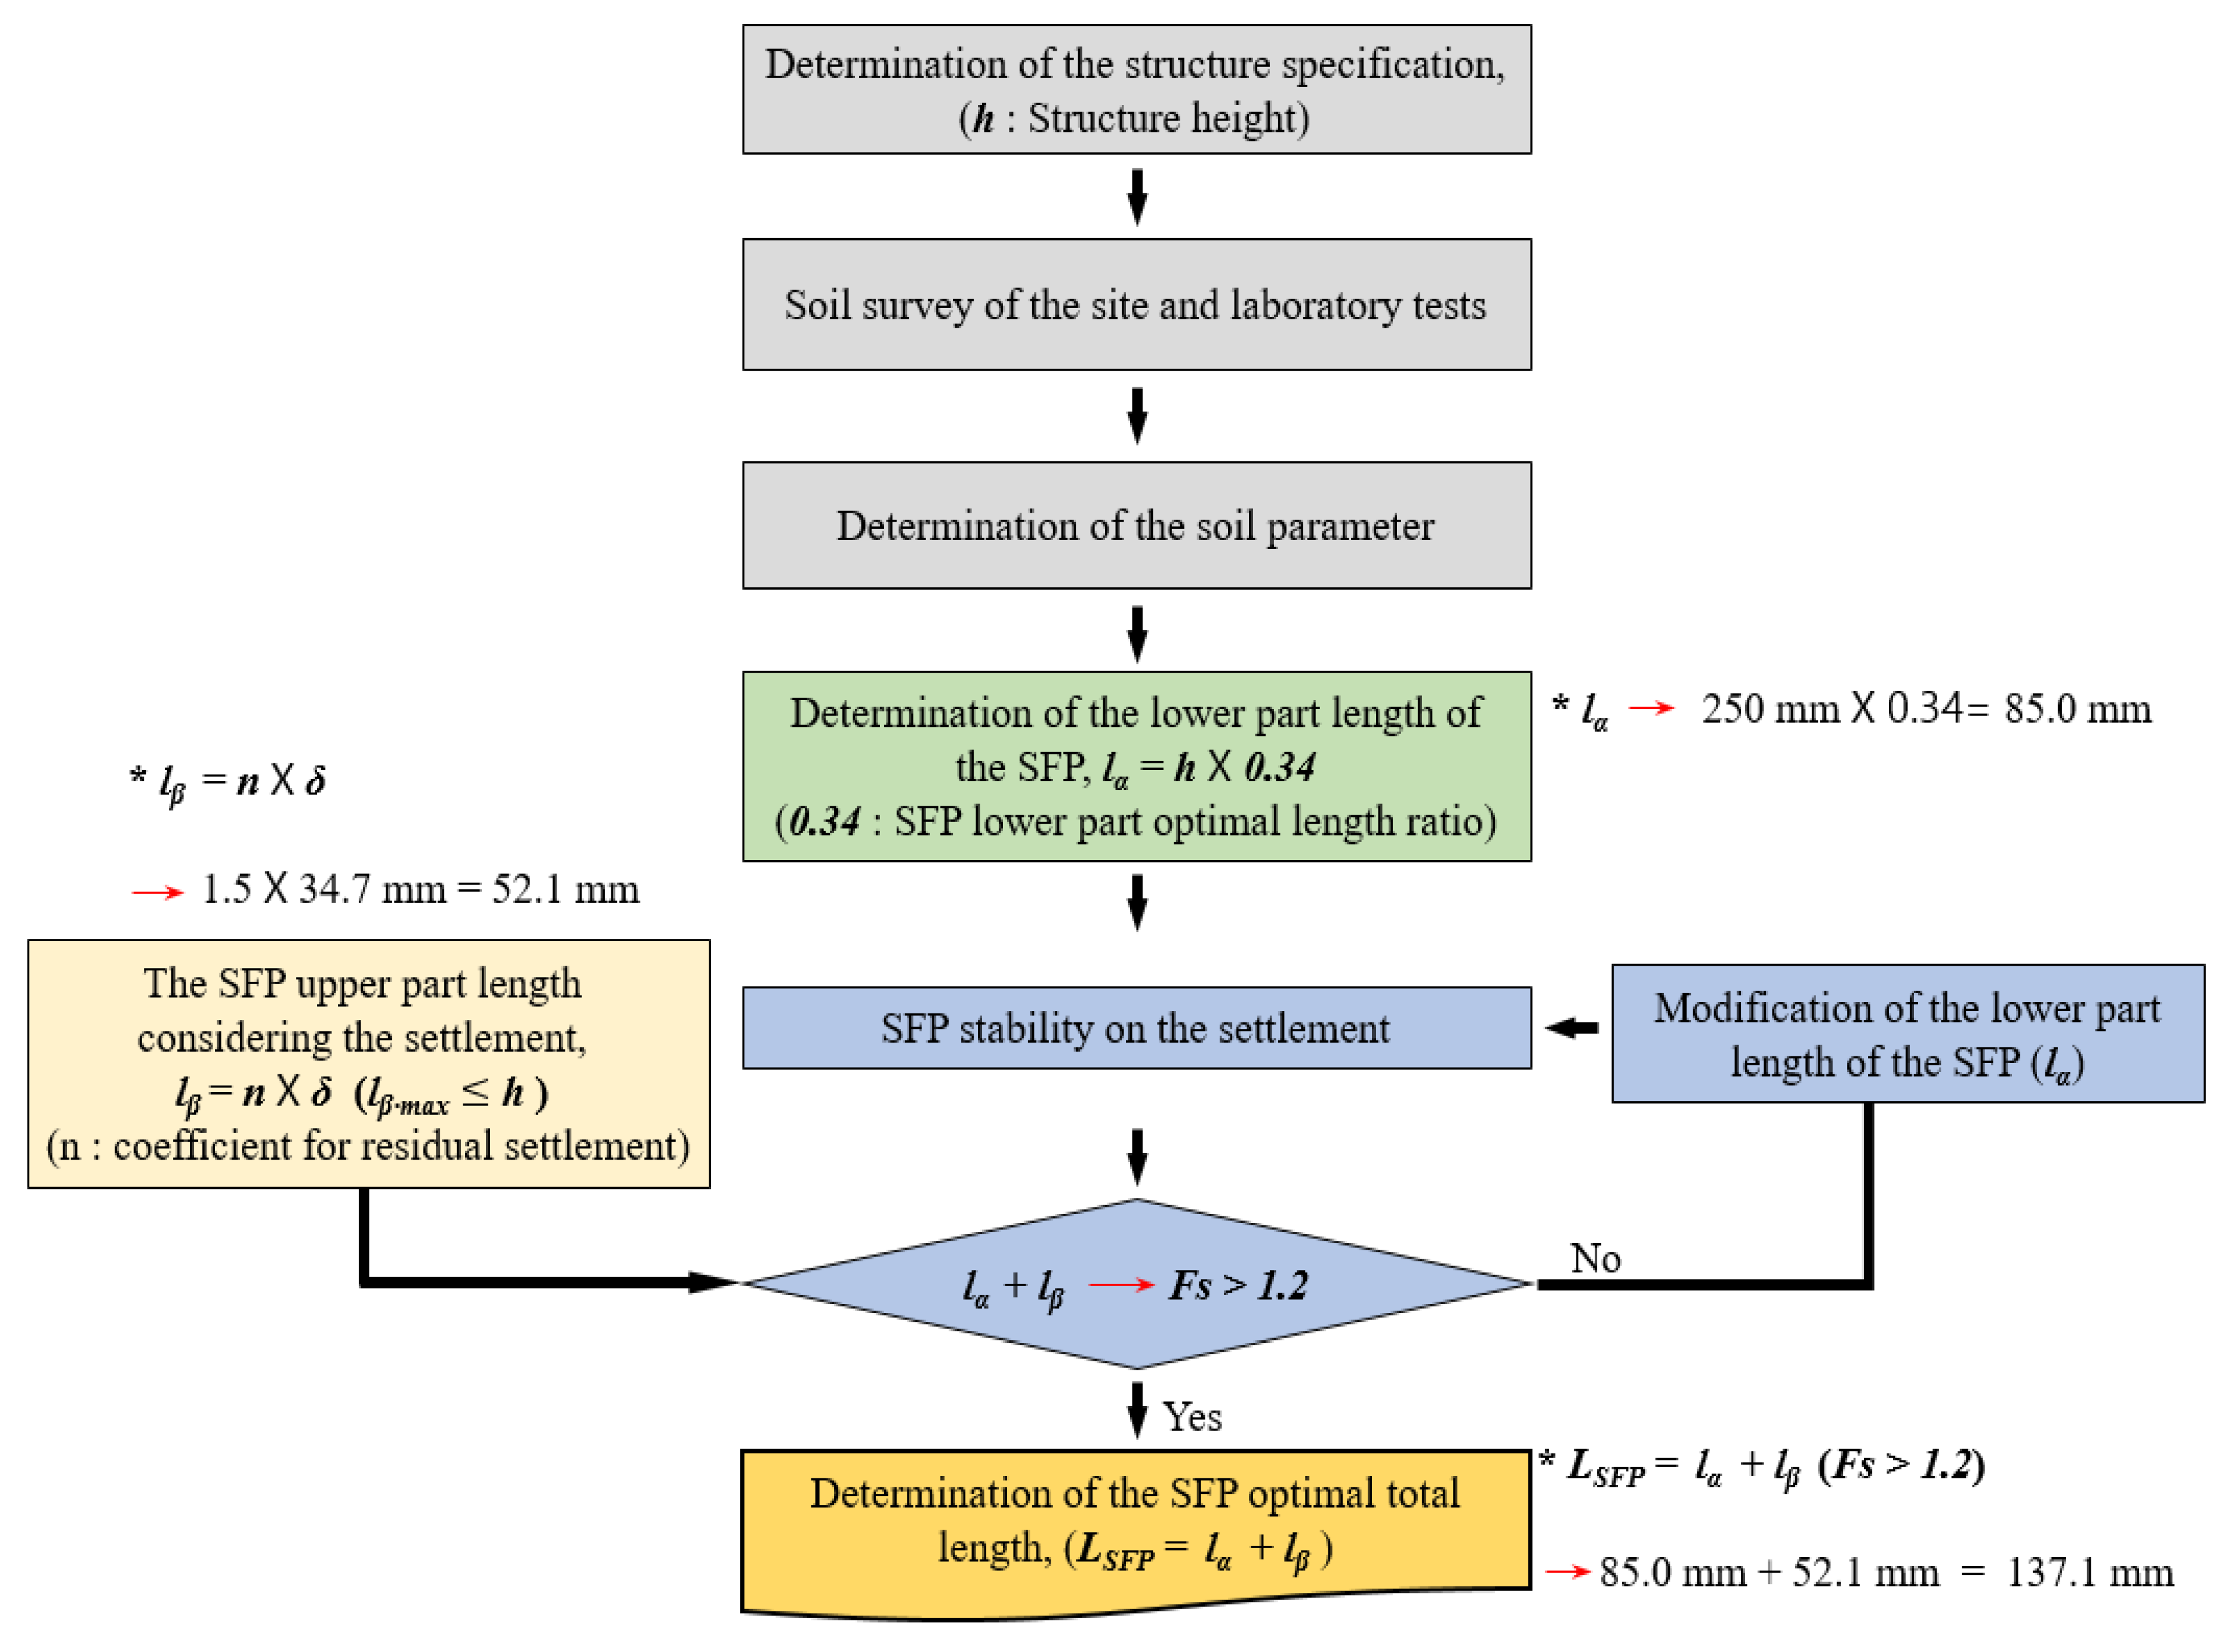
Prior to developing the design method, we comprehensively analyzed the research results. The lower length of the SFP is a ground settlement reduction factor, and the upper length influences the SFP stability in terms of the ground settlement. Therefore, Equation (2) can be used to calculate the optimal length (LSFP), while considering the function and role of the SFP that satisfies the safety factor (Fs) of 1.2 for the stability and has a significant settlement reduction effect. Here, lα is the lower length of the SFP and is a factor influencing the settlement reduction effect; and lβ is the upper length of the SFP and is obtained by applying a margin coefficient n for the predicted settlement (n·δ). The value of the margin coefficient is used in the safety review, considering the ground conditions and the residual settlement; this value may be applied at the discretion of the technician. The maximum value of the upper length (lβ) does not exceed the height (h) of the box structure.
We found the sum of the 85.0 mm lower length (lα) (OLR of 0.34 and a surface settlement ratio of 0.45) and 52.1 mm upper length (lβ) with a margin factor of 1.5 to be 137.1 mm, using this equation. The method for calculating the total length of the SFP is depicted via a flowchart in Figure 14.
4. Conclusions
In this study, we performed a scaled model experiment to propose a design method for the optimal installation length of an SFP and conducted stability analyses based on the influencing factors. We achieved this by analyzing the changes in the installation lengths of the upper and lower sections of the SFP in sandy soil, as well as the behavior of the SFP and the adjoining ground. The results were as follows.
- We summarized the surface settlement due to the development of a cavity below the box structure as the average settlement ratio when the SFP is installed. We compared the situations with and without SFP installation, and found that the installation of the SFP could effectively reduce the surface settlement ratio in the range of 0.44–0.72. A visual analysis of the structure without the SFP showed that the soil flowed into the cavity, which caused a rapid settlement of the adjoining ground of the box structure. In comparison, by installing the SFP, the surface settlement was reduced because the inflow of soil into the cavity underneath the box structure could be blocked.
- The settlement decreased with an increase in the lower length of the SFP, and the trend gradually converged above a certain length. The optimum length ratio of the SFP was 0.34, and the surface settlement ratio was 0.45.
- The overall average settlement ratios were 0.71, 0.47, and 0.44, corresponding to SFP lower lengths of 50, 100, and 150 mm, respectively; the settlement decreased with an increase in the lower length. However, the effect of the settlement reduction due to the increase in the upper length was minimal when compared with that due to an increase in the lower length. Thus, we confirmed that surface settlement was dominantly affected by the change in the SFP lower length.
- We calculated the safety factor (Fs) by considering the active earth pressure at the lower front surface of the SFP, the passive earth pressure on the rear surface, and the earth pressure generated at the upper front surface of the SFP, which we considered to be zero. When the optimum length ratio was 0.34 and the ground settlement ratio was 0.45, the safety factor was 1.69; even after ground settlement of 82.3 mm, the SFP remained stable with a safety factor of 1.2 or higher.
- Our comprehensive analysis of the results showed that the lower length of the SFP is the key factor causing the reduction in the surface settlement, whereas the upper length influences the SFP stability with regard to the ground settlement. Based on these results, we proposed an equation for calculating an efficient and economical optimal length (LSFP), while considering the function and role of each SFP. This calculated length has a significant settlement reduction effect, and it satisfies the safety factor (Fs) of 1.2. Based on this design method, we found the sum of the 85.0 mm lower length (lα) (OLR of 0.34 and a ground settlement ratio of 0.45) and the 52.1 mm upper length (lβ), while using a margin factor of 1.5, to be 137.1 mm.
- In this study, we proved the settlement reduction effect of the SFP based on the test results; we calculated the OLR and proposed a design method. Apart from the settlement analyses, further studies are required to establish a more reasonable and comprehensive design method; these studies must focus on a variety of conditions, such as the earth pressure and underground conditions, which are used to identify different properties, such as the soil viscosity, for various construction site applications. We expect the findings of this study to be beneficial for urban construction. The proposed methodology can be applied to analyze the settlement under various SFP lengths and to determine the optimal length to ensure the robustness and safety of structures. However, the scaled model experiment performed during this study only analyzed the results obtained via settlements arising from vibrations in loose sandy soil. Therefore, further studies will be required on the effects of ground surface settlement reduction using SFP installations under conditions where actual ground surface settlement occurs, such as settlement due to the consolidation of clayey ground or settlement due to overburdening.
Author Contributions
Conceptualization and methodology, J.Y.; investigation and analysis, S.S. and J.Y.; writing—original draft preparation, S.S., M.C., and J.Y.; writing—review and editing, S.S., M.C., and J.Y. All authors have read and agreed to the published version of the manuscript.
Funding
This research was supported by the Basic Science Research Program of the National Research Foundation of Korea (NRF), which was funded by the Ministry of Education (NRF-2018R1D1A1B07048553 and NRF-2019R1I1A1A01060584).
Conflicts of Interest
The authors declare no conflict of interest.
References
- Hearn, G. Synthesis on Faulted Pavements at Bridge Abutments; Report No. CDOT-DTD-97-11; Colorado Department of Transportation: Denver, CO, USA, 1997. [Google Scholar]
- White, D.J.; Mekkawy, M.M.; Sritharan, S.; Suleiman, M.T. “Underlying” causes for settlement of bridge approach pavement systems. J. Perform. Constr. Fac. 2007, 21, 273–282. [Google Scholar] [CrossRef]
- Briaud, J.; James, R.W.; Hoffman, S.B. Settlement of Bridge Approaches (The Bump at the End of the Bridge). In NCHRP Synthesis of Highway Practice 234; Transportation Research Board; National Academy Press: Washington, DC, USA, 1997. [Google Scholar]
- Sato, M.; Kuwano, R. Effects of buried structures on the formation of underground cavity. In Proceedings of the 18th International Conference on Soil Mechanics and Geotechnical Engineering, Paris, France, 2–6 September 2013; pp. 1769–1772. [Google Scholar]
- Schaefer, V.R.; Koch, J.C. Void Development under Bridge Approaches; Final Report; The National Academies of Sciences, Engineering, and Medicine: Washington, DC, USA, 1992. [Google Scholar]
- Wahls, H.E. Design and Construction of Bridge Approaches; Transportation Research Board; National Research Council: Washington, DC, USA, 1990; Volume 159. [Google Scholar]
- Choi, B.-H.; Lee, K.; Lee, J.; Kim, D. Restoration efficiency analysis of expansive material implemented trenchless underground cavity restoration method varying number and location of bore holes. J. Korean Geosynth. Soc. 2019, 18, 25–37. [Google Scholar] [CrossRef]
- Suchowerska, A.M.; Merifield, R.S.; Carter, J.P.; Clausen, J. Prediction of underground cavity roof collapse using the Hoek–Brown failure criterion. Comput. Geotech. 2012, 44, 93–103. [Google Scholar] [CrossRef]
- Yoo, J.-W.; Seo, M.-S.; Son, S.-W.; Im, J.-C. An experimental study on the estimation of optimum length of soil flow protector with wall stiffness. J. Korean Soc. Civ. Eng. 2019, 39, 789–799. [Google Scholar] [CrossRef]
- Son, S.W. Evaluation of Seismic Performance of Geotechnical Seismic Foundation Isolation System. Ph.D. Thesis, Pusan National University, Busan, Korea, 2018. [Google Scholar]
- Kagawa, T. On the similitude in model vibration tests of earth-structures. Proc. Jpn. Soc. Civ. Eng. 1978, 1978, 69–77. [Google Scholar] [CrossRef]
- Kokusho, T.; Iwatate, T. Scaled model tests and numerical analysis on nonlinear dynamic response of soft grounds. Proc. Jpn. Soc. Civ. Eng. 1979, 1979, 57–67. [Google Scholar] [CrossRef] [Green Version]
- Iai, S. Similitude for shaking table tests on soil-structure-fluid model in 1G gravitational field. Soils Found. 1989, 29, 105–118. [Google Scholar] [CrossRef] [Green Version]
- Iai, S.; Sugano, T. Soil-structure interaction studies through shaking table tests. In Proceedings of the 2nd International Conference on Earthquake Geotechnical Engineering, Lisbon, Portugal, 21–25 June 1999. [Google Scholar]
- Choi, C.Y.; Kim, H.K.; Park, J.H. Comparison of performance with backfill inclination slope and shape in railway abutment and transitional zone using centrifuge model tester. J. Korean Geosynth. Soc. 2018, 17, 85–93. [Google Scholar]
- Tatsuoka, F.; Tateyama, M.; Koseki, J.; Yonezawa, T. Geosynthetic-reinforced soil structures for railways in Japan. Transp. Infrastruct. Geotechnol. 2014, 1, 3–53. [Google Scholar] [CrossRef] [Green Version]
- Kim, Y.-S.; Ko, H.-W.; Kim, J.-H.; Lee, J.-G. Dynamic deformation characteristics of Joomunjin standard sand using cyclic triaxial test. J. Korean Geotech. Soc. 2012, 28, 53–64. [Google Scholar] [CrossRef]
- Song, Y.-S. Estimation on unsaturated hydraulic conductivity function of Jumoonjin sand for various relative densities. J. Korean Soc. Civ. Eng. 2013, 33, 2369–2379. [Google Scholar] [CrossRef] [Green Version]
- Suh, H.; Yun, T.; Kim, K. Prediction of soil-water characteristic curve and relative permeability of Jumunjin sand using pore network model. J. Korean Geotech. Soc. 2016, 32, 55–62. [Google Scholar] [CrossRef]
- Bautista, F.E.; Park, L.K.; Im, J.C.; Lee, Y.N. Variation of earth pressure acting on cut-and-cover tunnel lining with settlement of backfill. J. Korean Geotech. Soc. 2006, 22, 27–40. [Google Scholar]
- Kim, C.; Kwon, J.; Im, J.C.; Hwang, S. A method for analyzing the self-supported earth-retaining structure using stabilizing piles. Mar. Georesour. Geotec. 2012, 30, 313–332. [Google Scholar] [CrossRef]
- Ko, H.S.; Im, J.C.; Park, L.K.; Oh, M.L. Model tests on the behaviour of sandy ground during tunneling. J. Korean Soc. Civ. Eng. 1996, 1996, 371–374. [Google Scholar]
- Son, J.H.; Im, J.C.; Park, L.K.; Lee, T.H. A study on the group effect of micropiles installed beneath shallow foundations. J. Korean Soc. Civ. Eng. 2003, 2003, 3354–3357. [Google Scholar]
- Vaid, Y.P.; Negussey, D. Preparation of reconstituted sand specimens. ASTM Int. 1988, 977, 405–417. [Google Scholar] [CrossRef]
- Miura, S.; Toki, S. A sample preparation method and its effect on static and cyclic deformation-strength properties of sand. Soils Found. 1982, 22, 61–77. [Google Scholar] [CrossRef] [Green Version]
- Yoo, J.; Son, S.; Kim, S. Development and performance analysis of soil flow protector to reduce soft soil settlement caused by cavity formation. Sustainability 2020, 12, 3641. [Google Scholar] [CrossRef]
- Ministry of Land, Infrastructure and Transport. Temporary Earth Retaining Wall Design Standard (KDS 21 30 00:2020). 2020. Available online: https://www.kcsc.re.kr/Search/List (accessed on 9 August 2021). (In Korean).
Figure 1.
Example of a problem due to the difference in the settlement between a structure supported by a soil foundation and the lateral ground [9]: (a) cavity development; (b) failure of the approach slab pavement.
Figure 1.
Example of a problem due to the difference in the settlement between a structure supported by a soil foundation and the lateral ground [9]: (a) cavity development; (b) failure of the approach slab pavement.
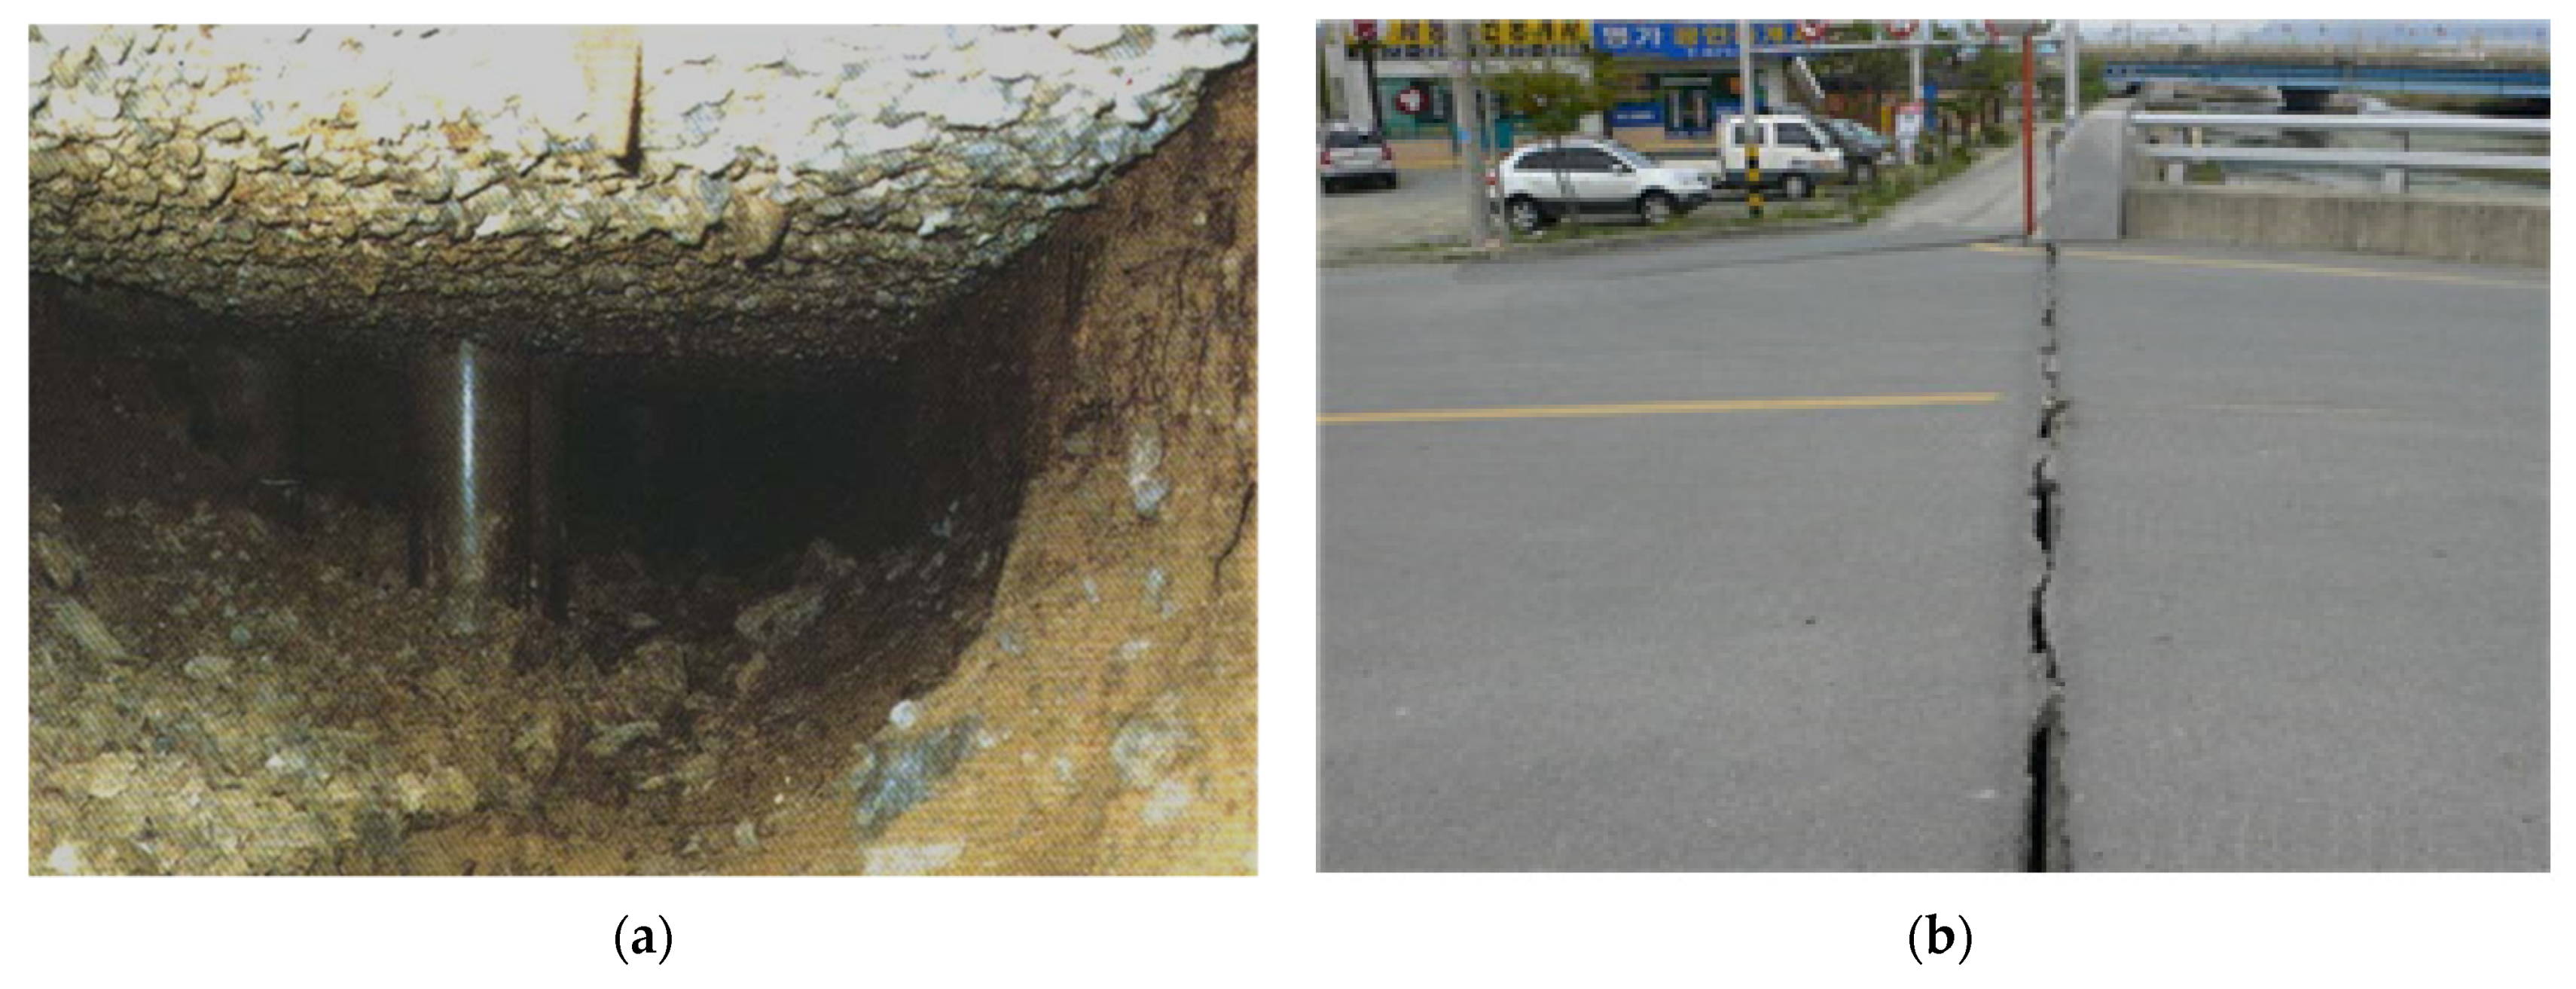
Figure 2.
Principle of a soil flow protector (SFP) used to solve problems related to cavity development [9]: (a) with SFP; (b) without SFP.
Figure 2.
Principle of a soil flow protector (SFP) used to solve problems related to cavity development [9]: (a) with SFP; (b) without SFP.
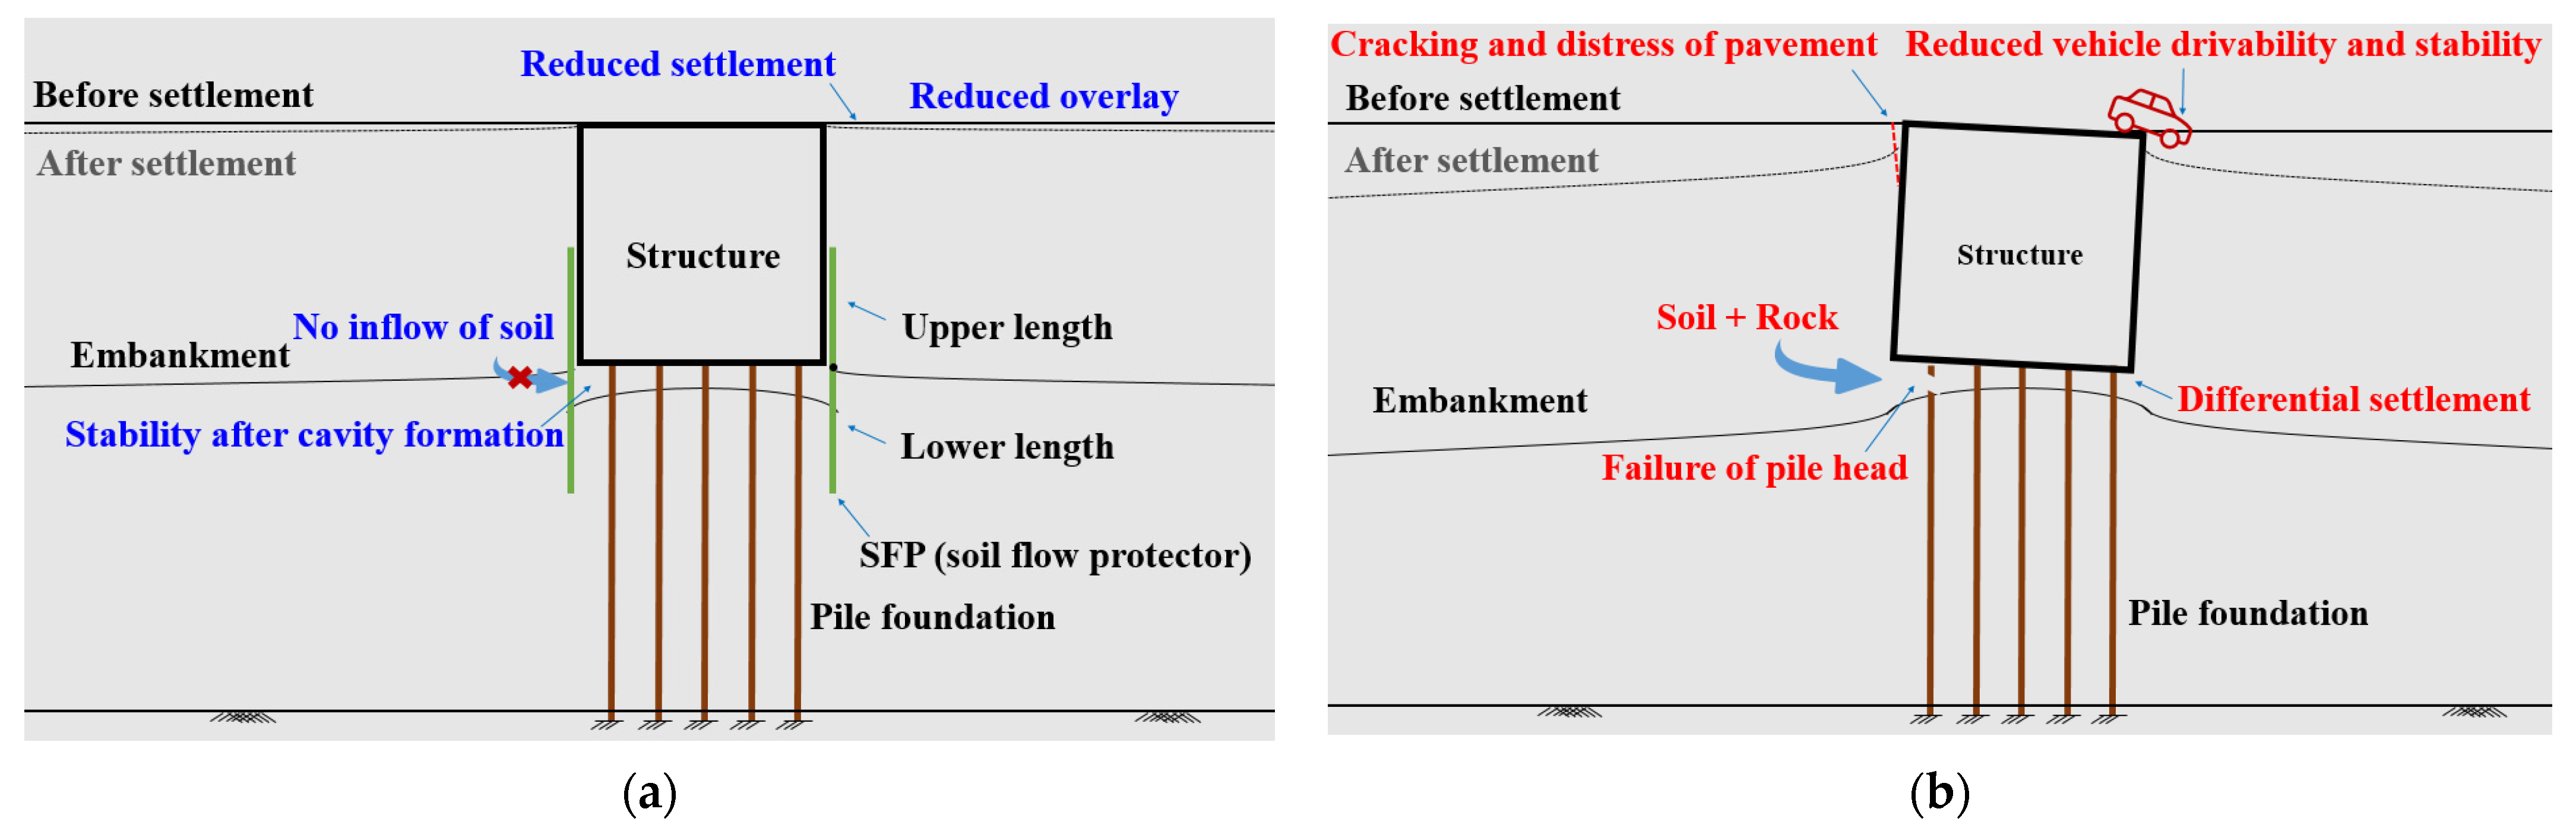
Figure 3.
Plain strain soil tank (PSST): side view and front view.
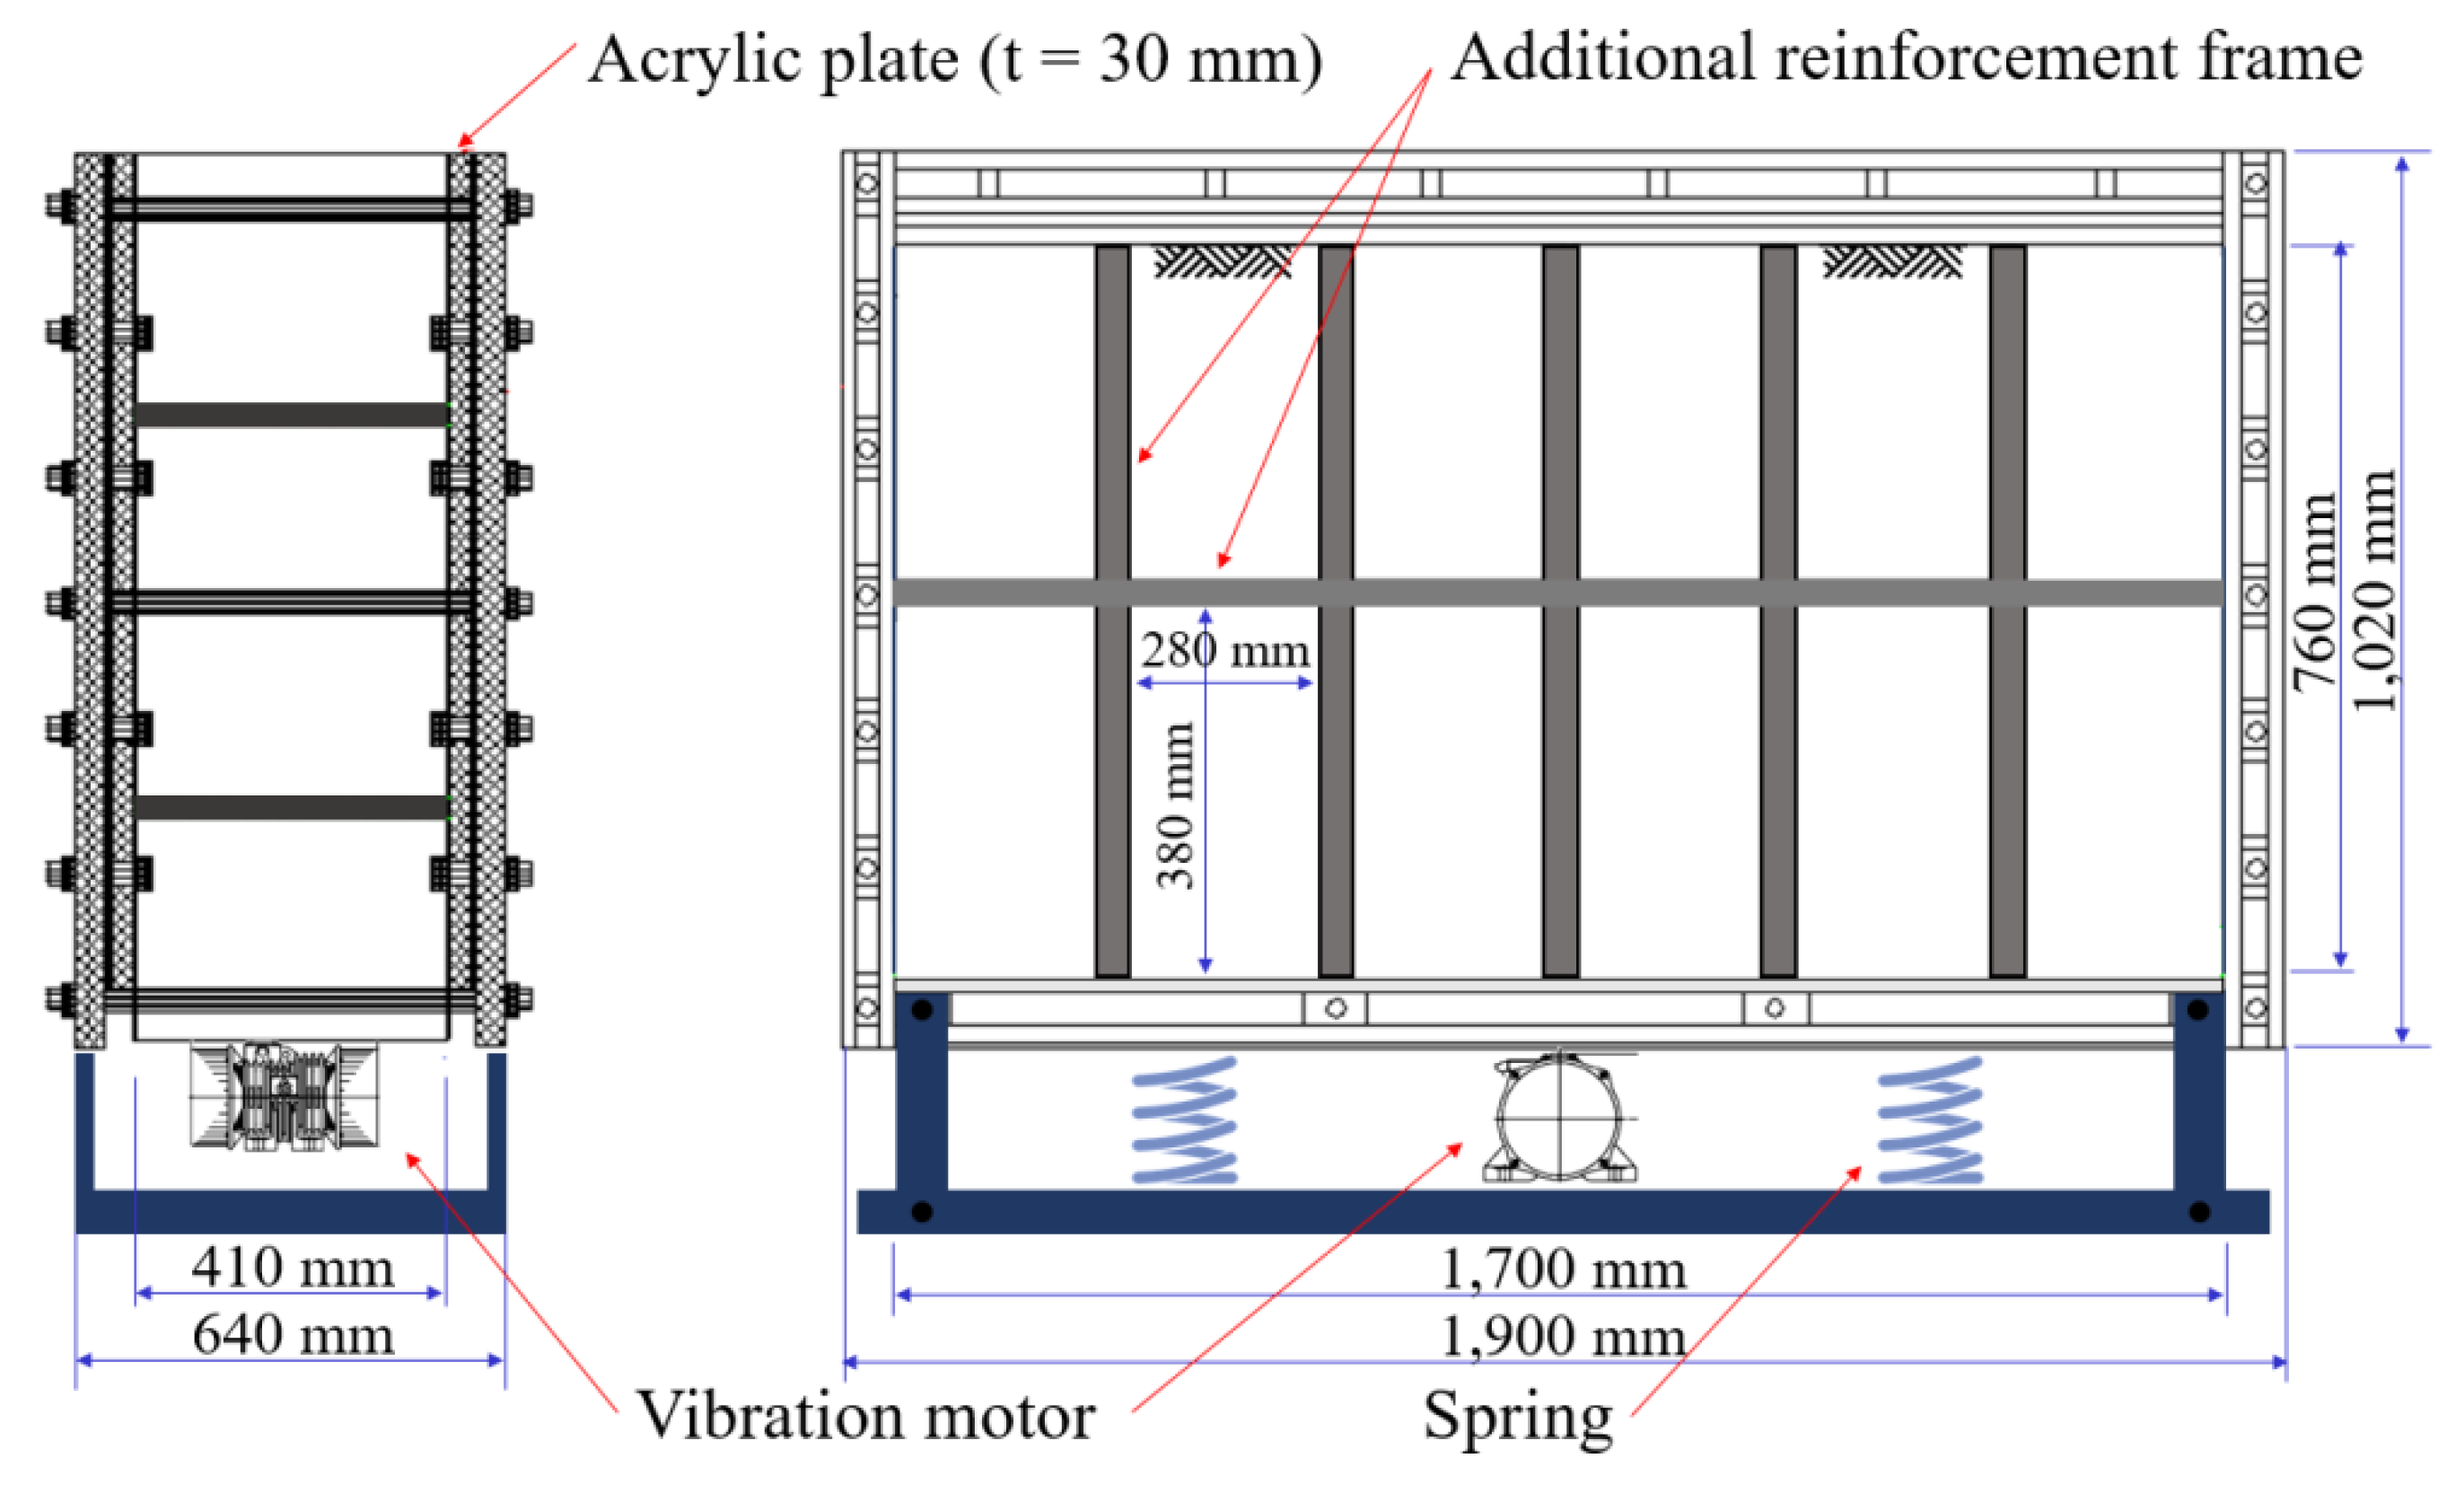
Figure 4.
Scaled test model: (a) box structure; (b) SFP (stiff material).
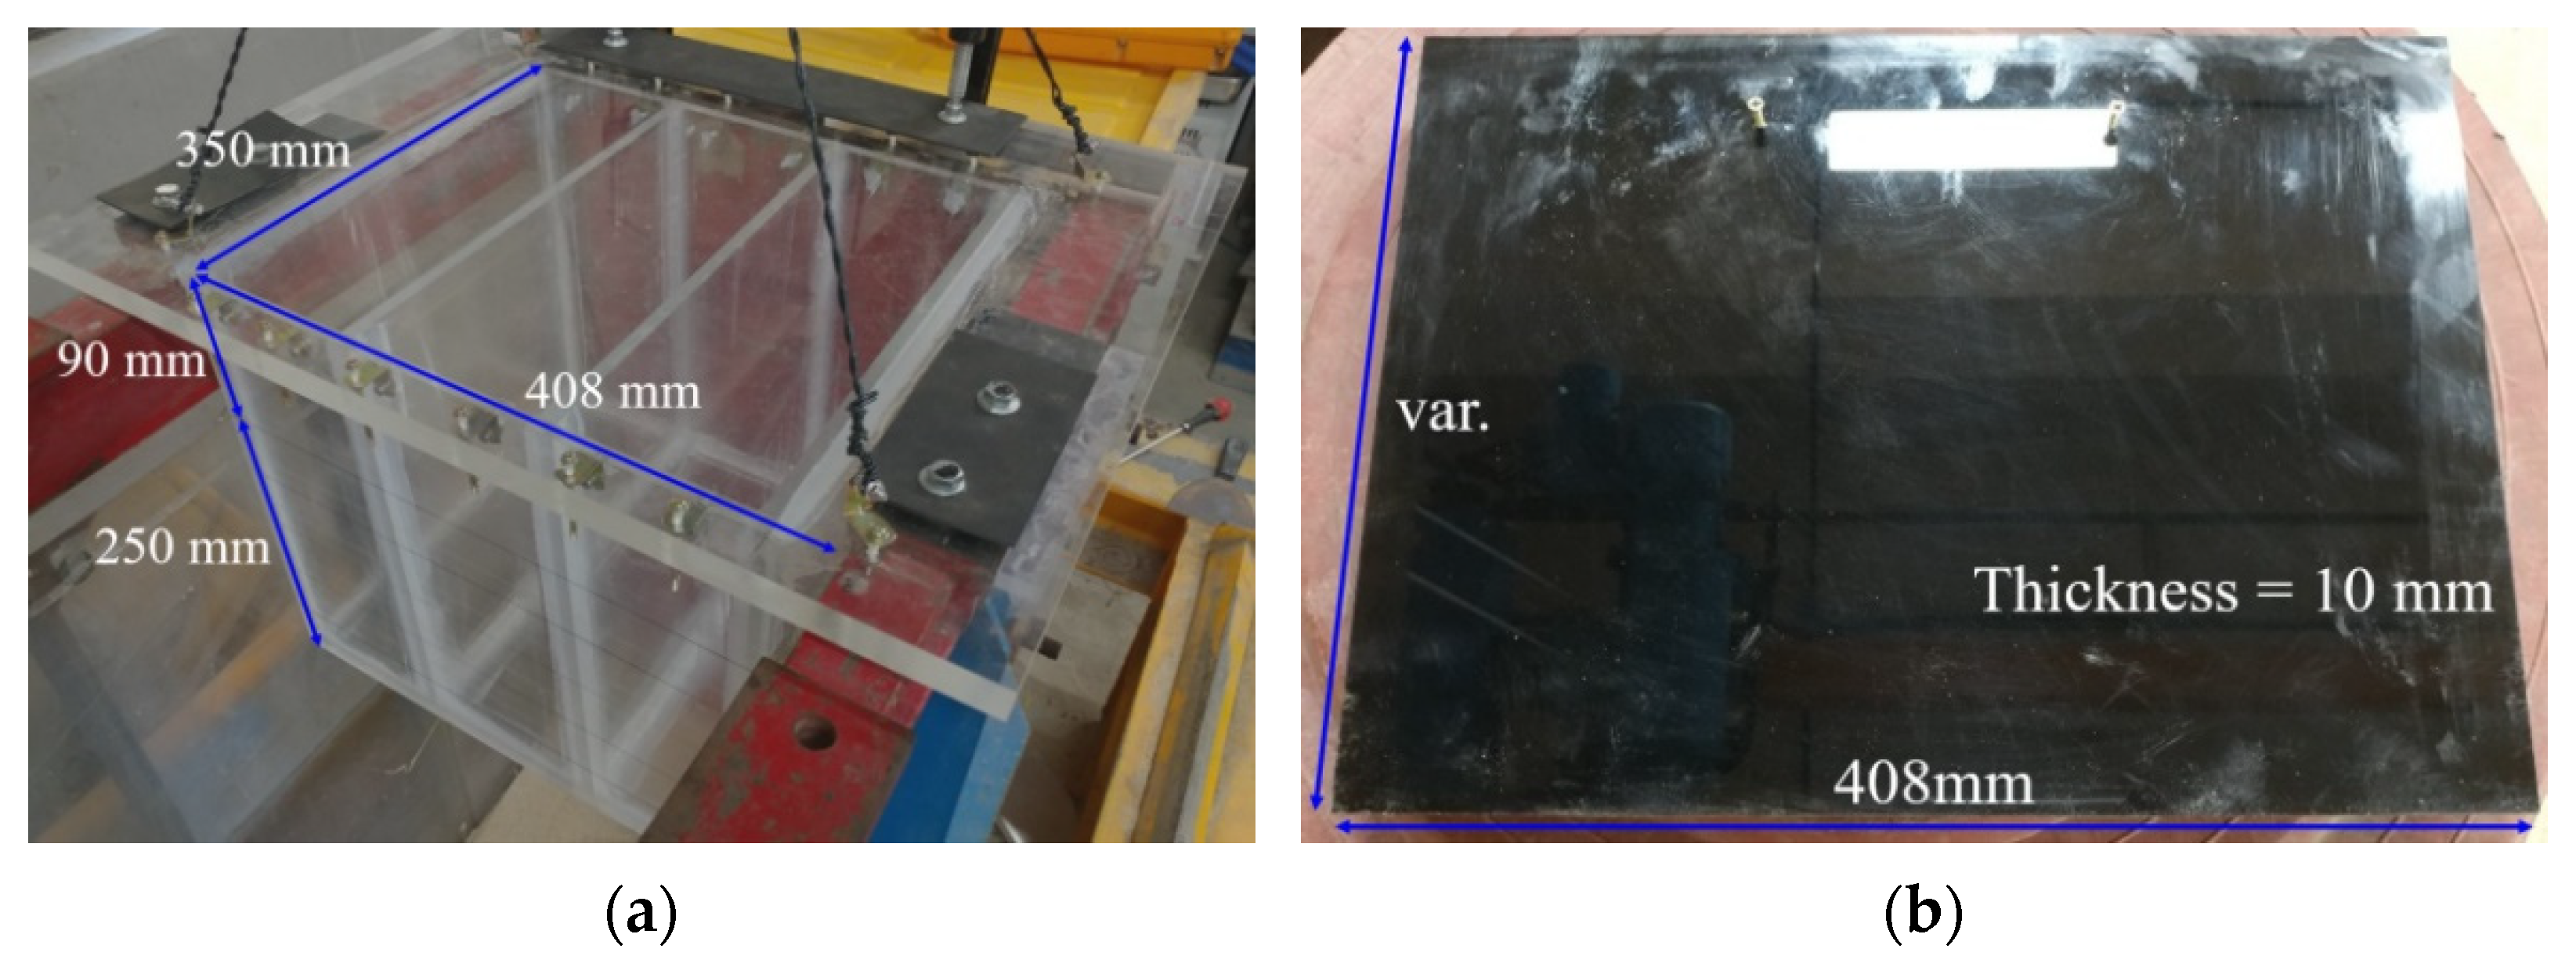
Figure 5.
Mechanical properties of the Jumunjin standard sand: (a) dry density of the Jumunjin standard sand, relative to the drop height; (b) internal friction angle, relative to the dry density; and (c) relative density, relative to the dry density.
Figure 5.
Mechanical properties of the Jumunjin standard sand: (a) dry density of the Jumunjin standard sand, relative to the drop height; (b) internal friction angle, relative to the dry density; and (c) relative density, relative to the dry density.

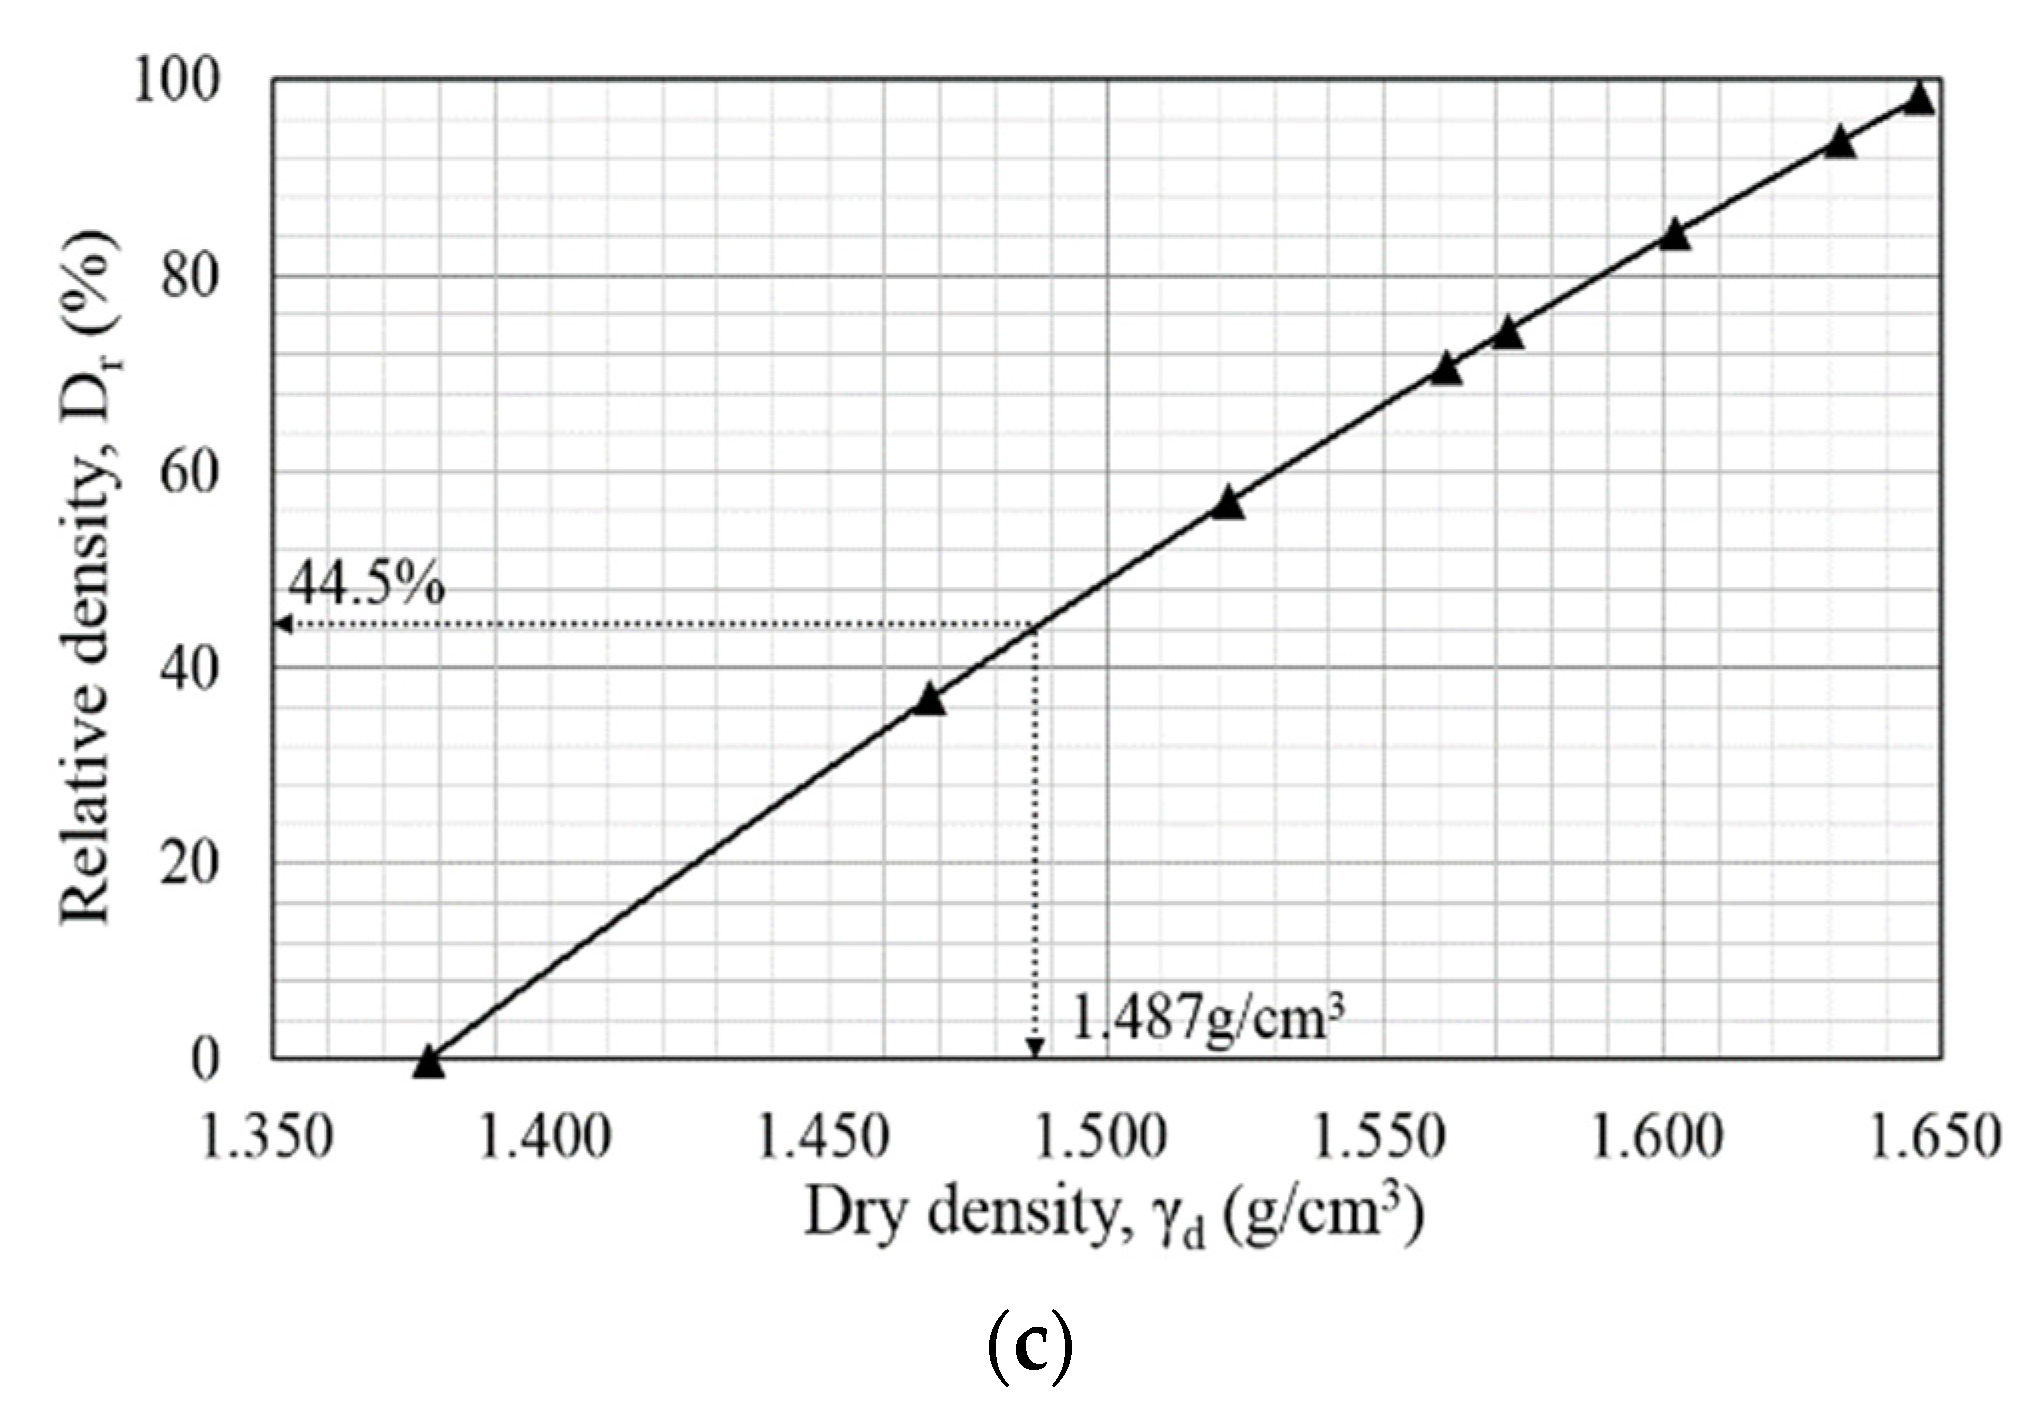
Figure 6.
Test setup: (a) front view of the box structure and SFP; (b) settlement measurement points.
Figure 6.
Test setup: (a) front view of the box structure and SFP; (b) settlement measurement points.

Figure 7.
Soil inflow behavior: without SFP; with SFP.

Figure 8.
Test results.

Figure 9.
SFP settlement trend across the test cases.
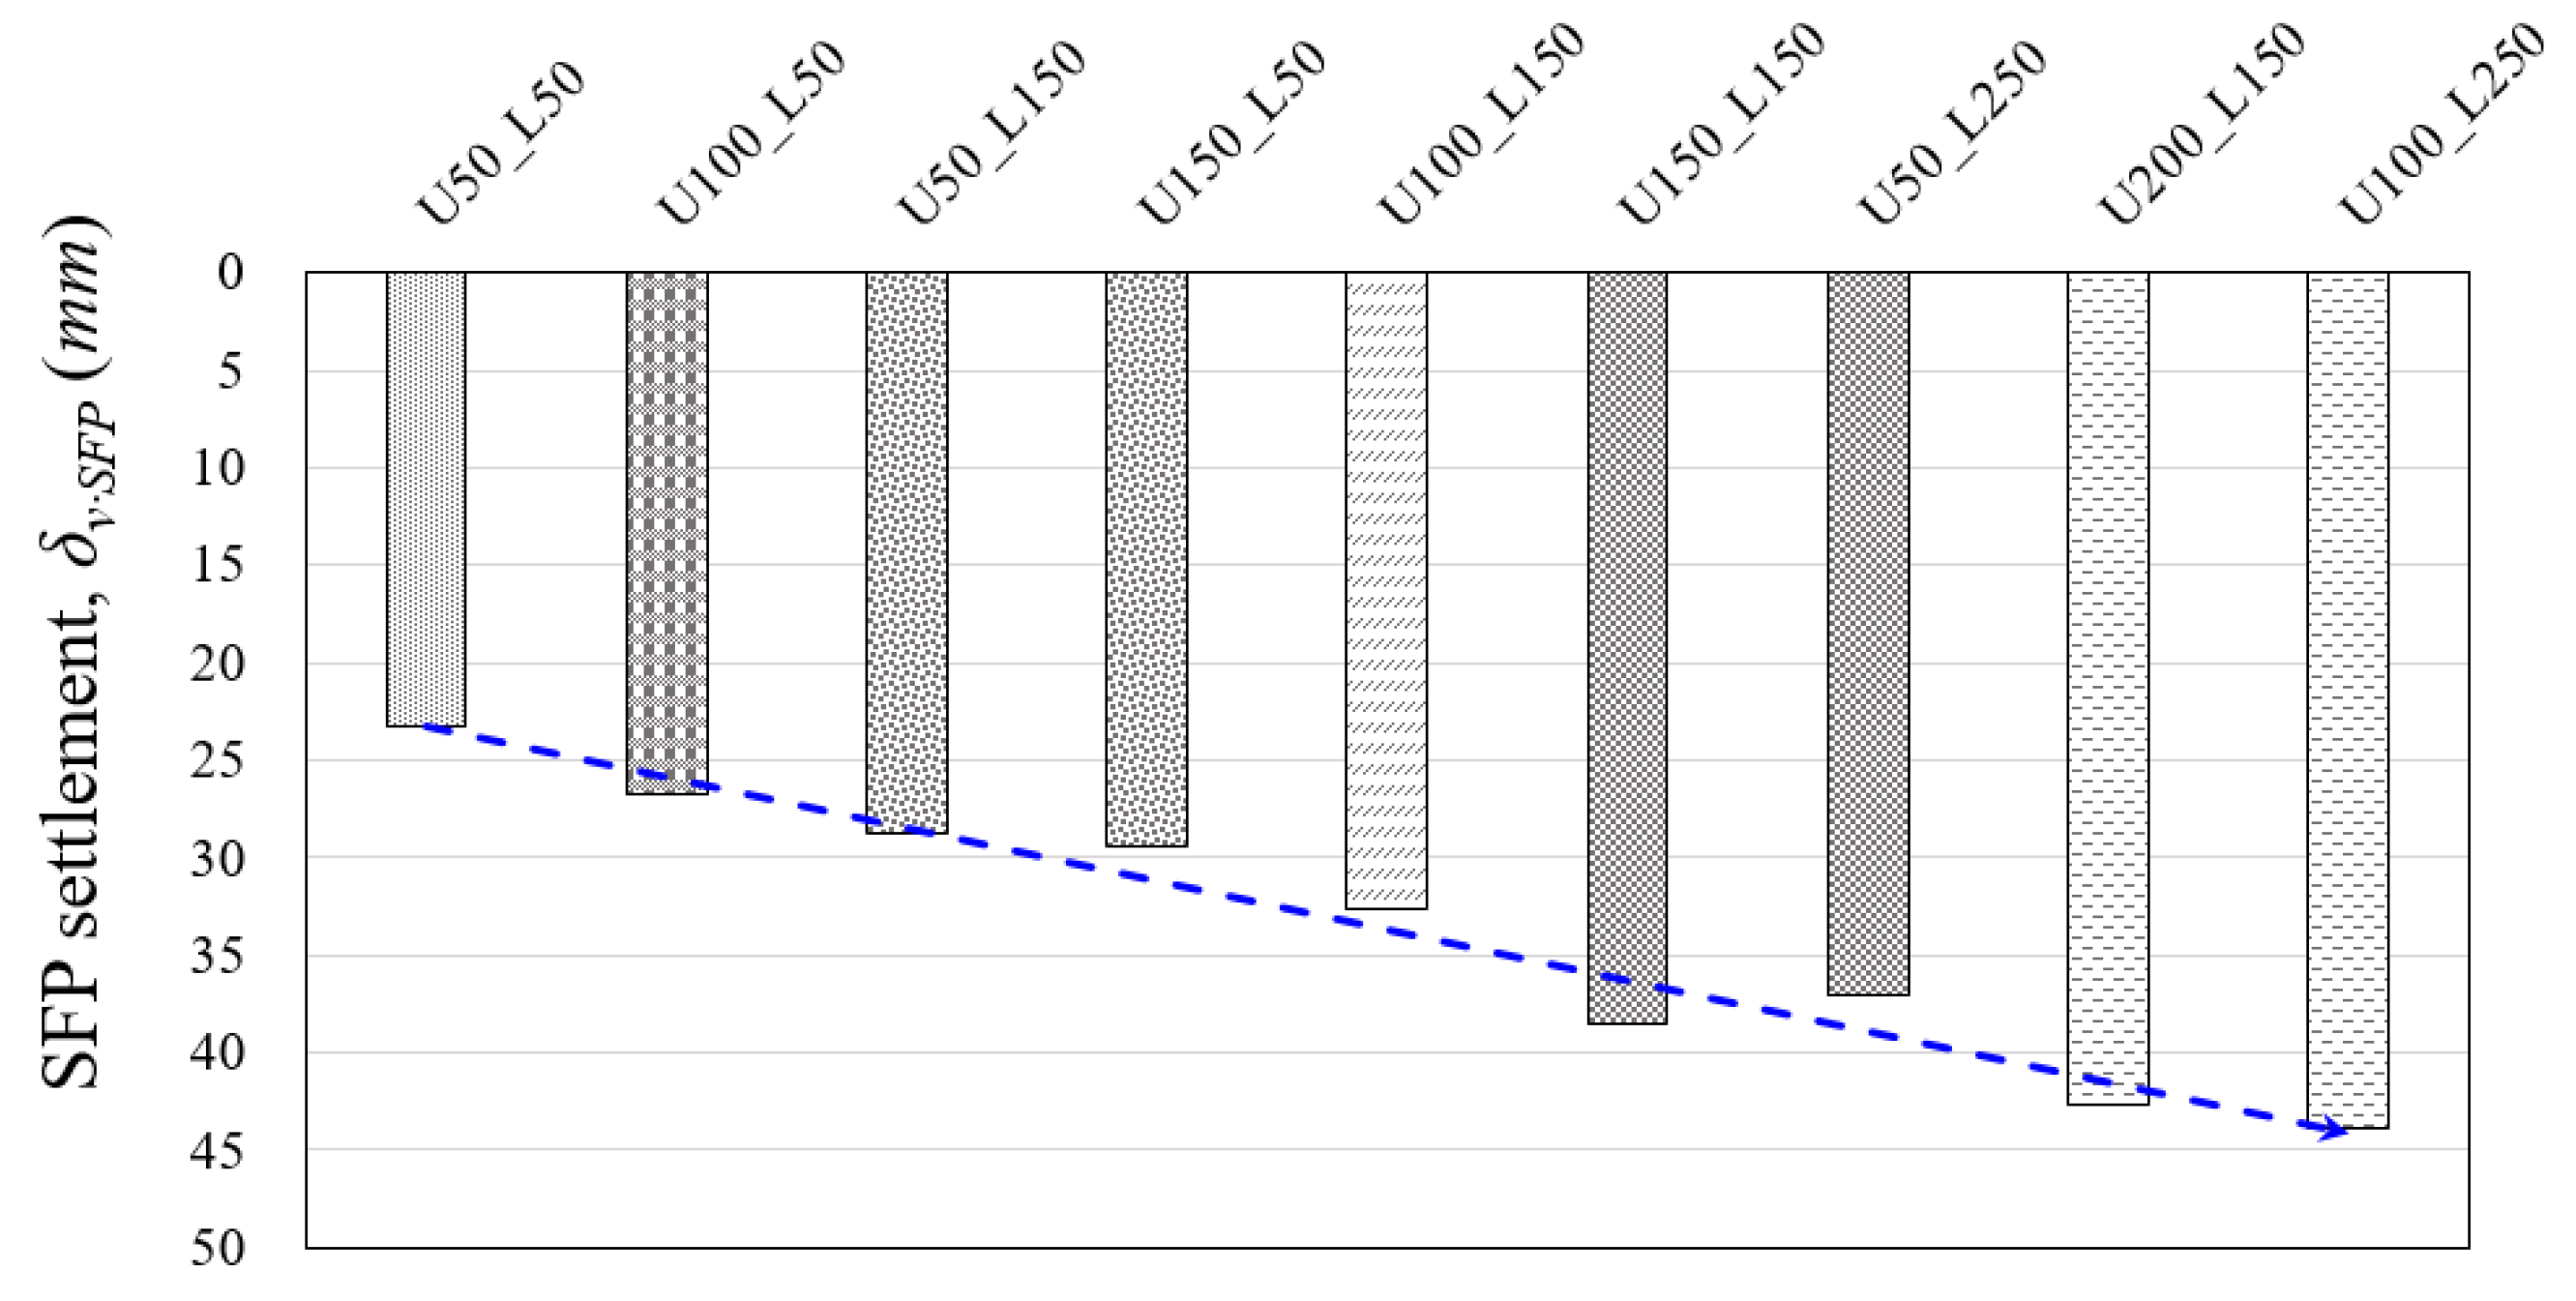
Figure 10.
Relationship between the settlement ratio and the ratio of the lower length of the SFP to the box structure height.
Figure 10.
Relationship between the settlement ratio and the ratio of the lower length of the SFP to the box structure height.
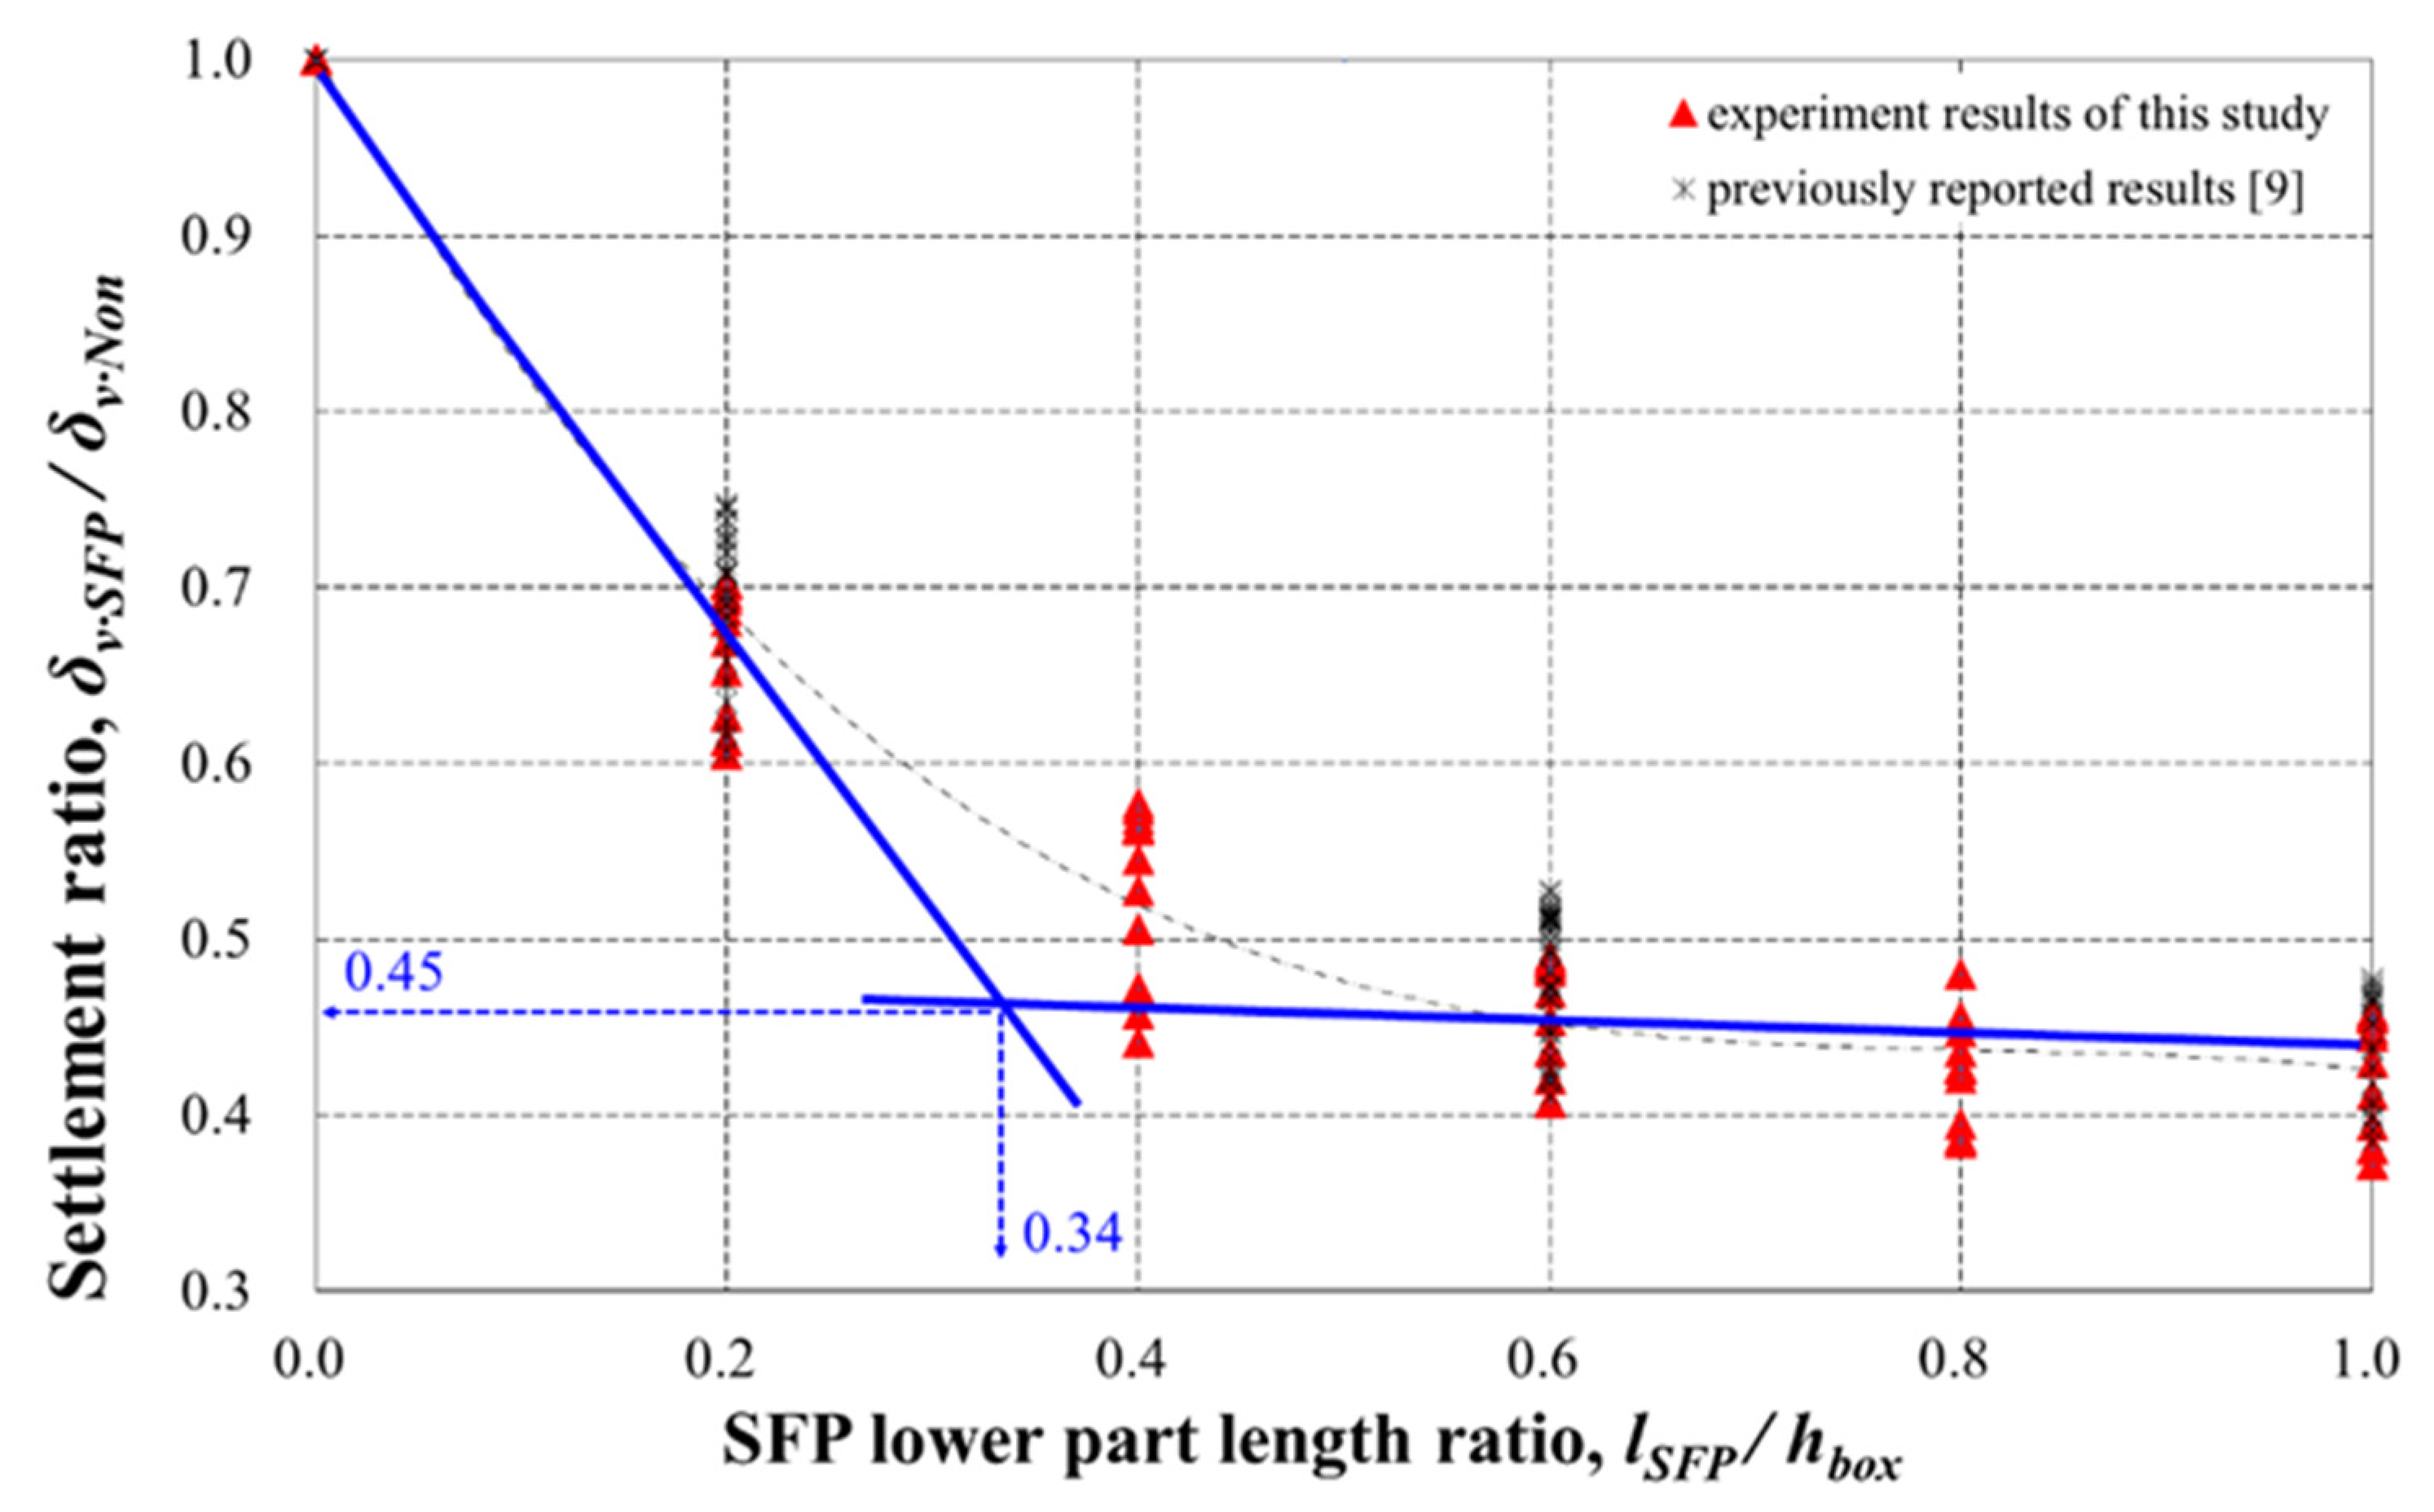
Figure 11.
Visual analysis: (a) ground behavior; (b) SFP movement.
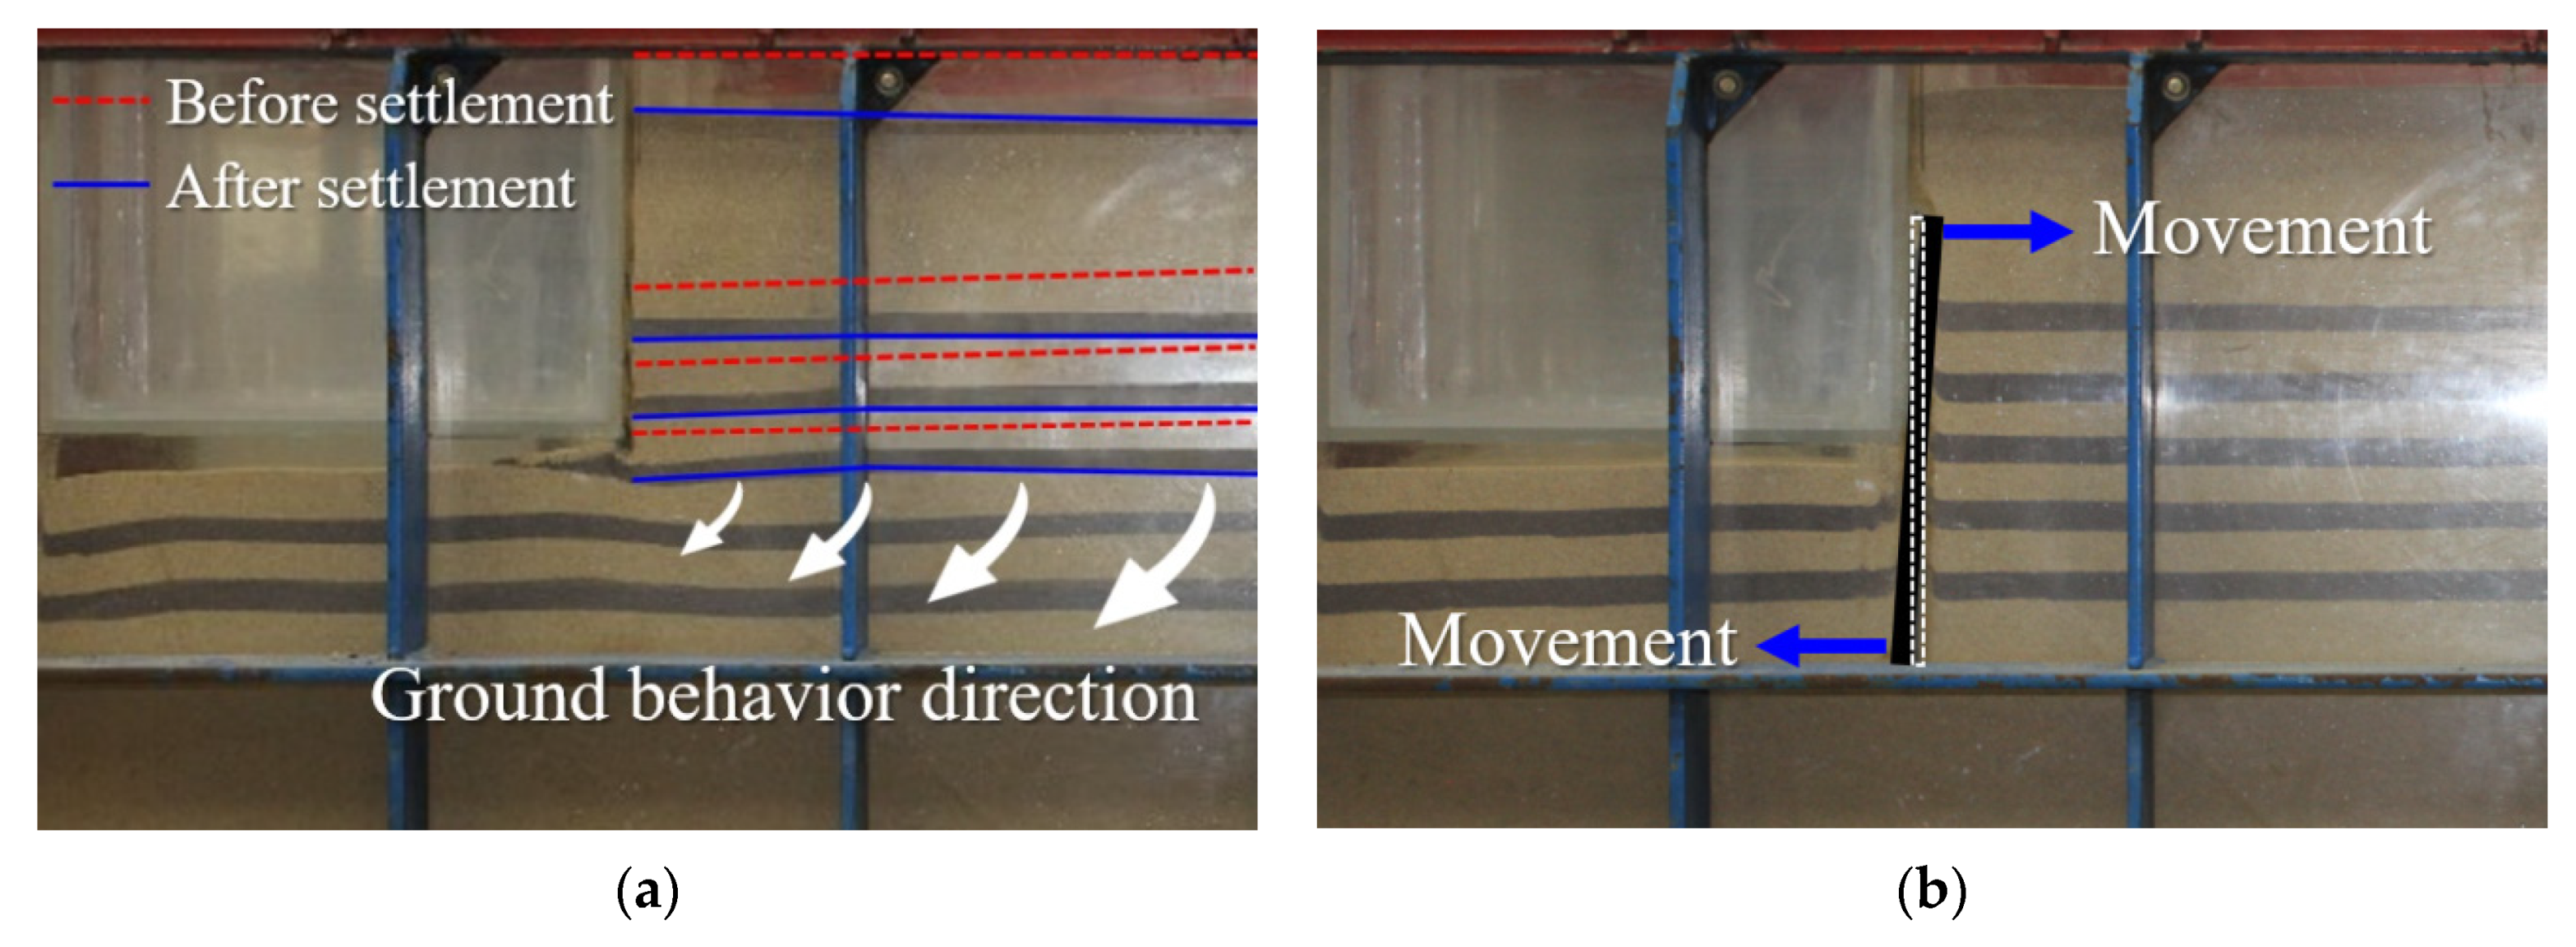
Figure 12.
Displacement behavior of the ground: (a) inclinometer results; (b) finite element method results [26].
Figure 12.
Displacement behavior of the ground: (a) inclinometer results; (b) finite element method results [26].
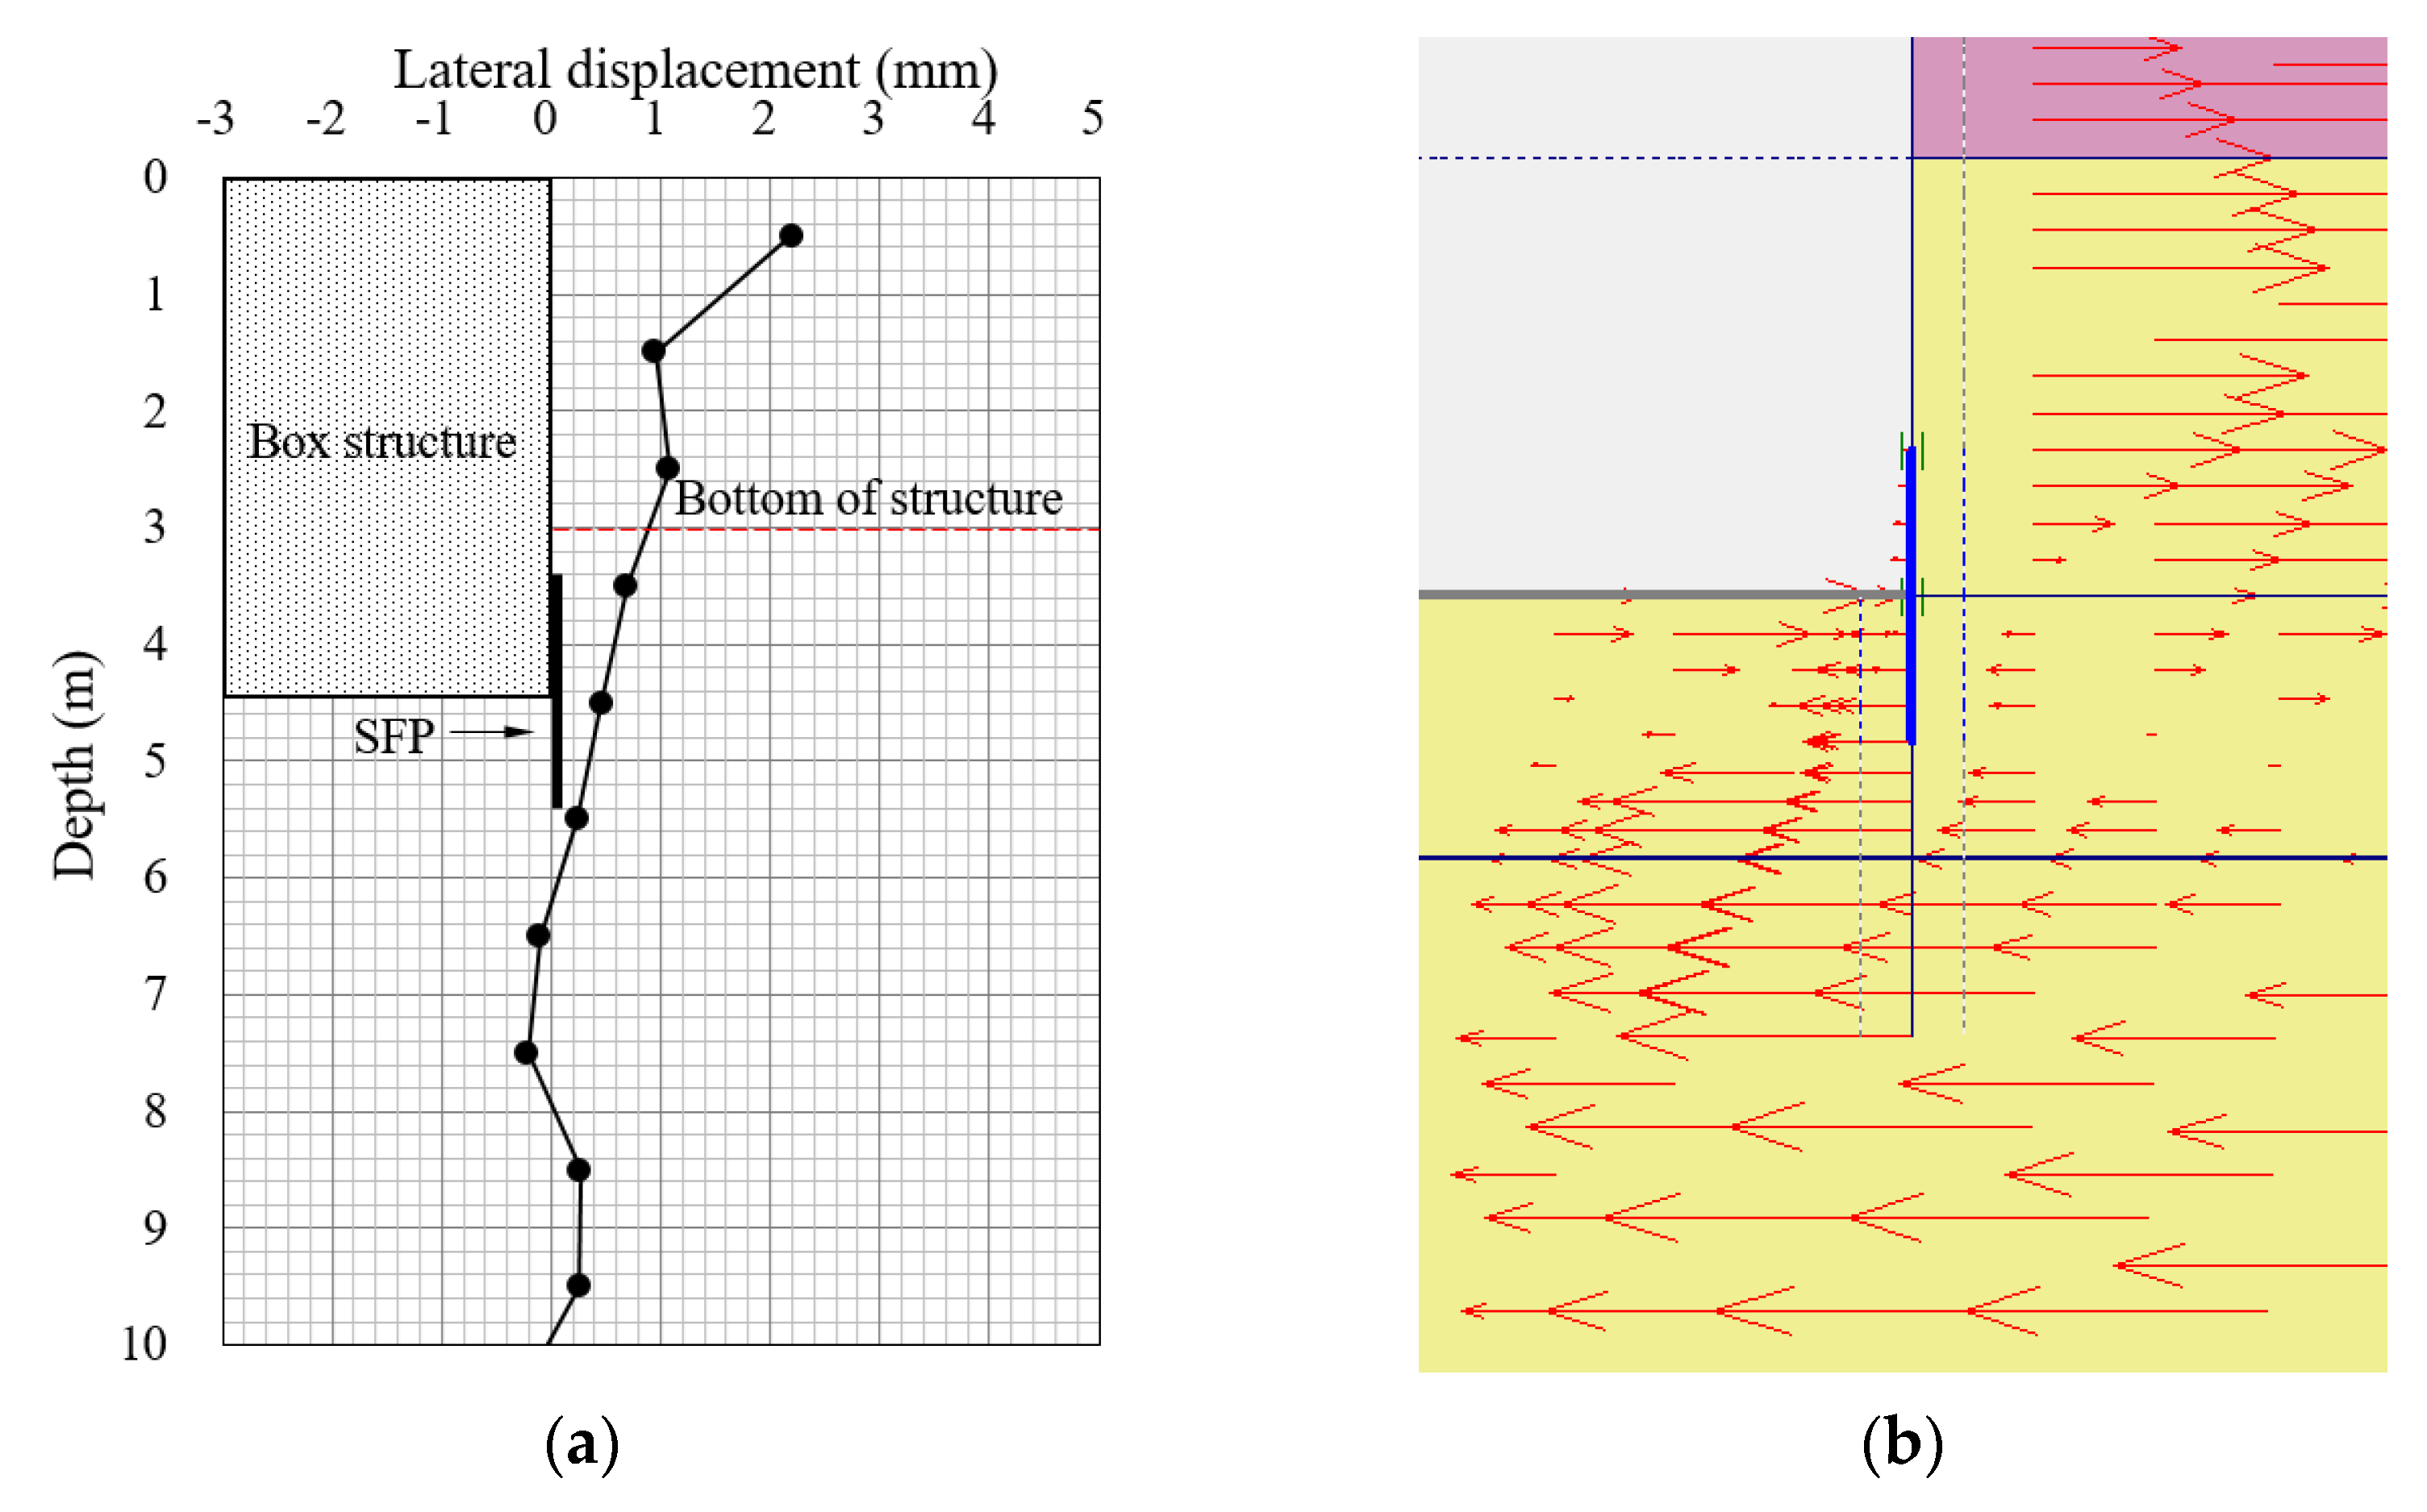
Figure 13.
Types of earth pressure acting on the SFP. Pp: passive pressure; Pa: active pressure [26].
Figure 13.
Types of earth pressure acting on the SFP. Pp: passive pressure; Pa: active pressure [26].
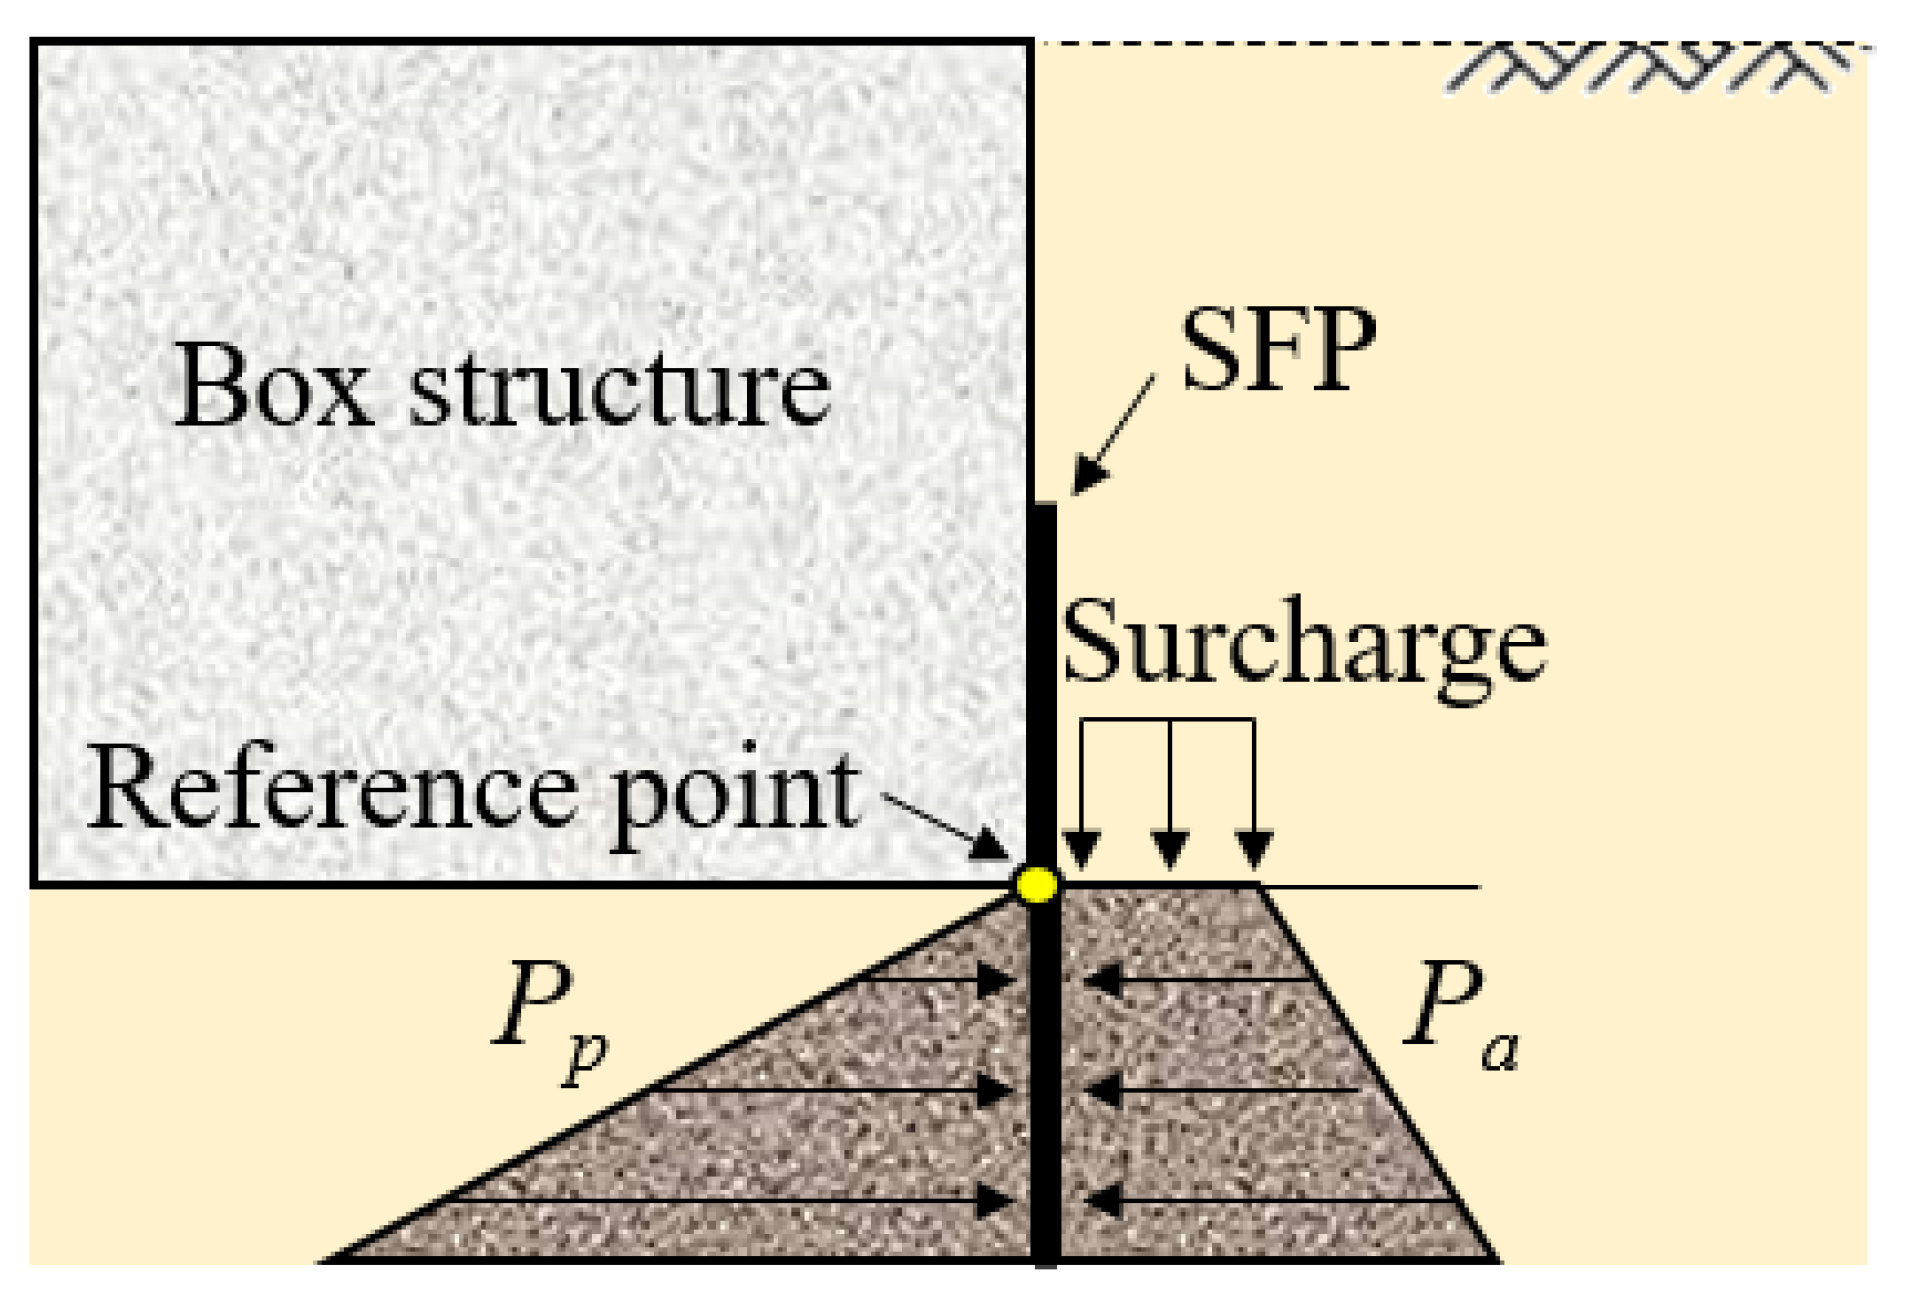
Figure 14.
Flowchart for the SFP optimal length estimation and stability analysis.

Table 1.
Test cases.
| Case | Length of Upper Part of SFP (mm) | Length of Lower Part of SFP (mm) | Total Length of SFP (mm) |
|---|---|---|---|
| Non_SFP | - | - | - |
| U50_L50 | 50 | 50 | 100 |
| U100_L50 | 100 | 50 | 150 |
| U150_L50 | 150 | 50 | 200 |
| U50_L150 | 50 | 150 | 200 |
| U100_L150 | 100 | 150 | 250 |
| U150_L150 | 150 | 150 | 300 |
| U200_L150 | 200 | 150 | 350 |
| U50_L250 | 50 | 250 | 300 |
| U100_L250 | 100 | 250 | 350 |
Notes: Non: non-reinforcement; U: length of the upper part of the SFP with reference to the edge of the box structure; L: length of the lower part of the SFP with reference to the edge of the box structure; the numbers 50, 100, 150, 200, and 250 indicate the lengths of the upper and lower parts of the SFP.
Table 2.
Similitude law adopted in the model-based test [13].
Table 2.
Similitude law adopted in the model-based test [13].
| Contents | Iai’s Similitude Ratio Type 3 |
|---|---|
| Length | λ |
| Time | λ 0.5 |
| Acceleration | 1 |
| Displacement | λ |
| Stress | λ |
| Strain | 1 |
| Stiffness | λ |
Table 3.
Physical characteristics of the Jumunjin standard sand.
| Specific gravity, Gs | 2.650 |
| Water content, w (%) | 0.90 |
| Average particle size, D50 (mm) | 0.580 |
| Effective particle size, D10 (mm) | 0.448 |
| Uniformity coefficient, Cu | 1.370 |
| Coefficient of the curvature, Cg | 0.960 |
Table 4.
Average settlement ratios for the various test conditions.
| Case | Minimum Settlement (mm) | Average Settlement (mm) | Maximum Settlement (mm) | Standard Deviation | Average Settlement Ratio | |
|---|---|---|---|---|---|---|
| Non_SFP | 63.3 | 77.1 | 89.9 | 6.81 | Non_SFP/Non_SFP | 1.00 |
| U50_L50 | 46.1 | 55.6 | 65.6 | 6.47 | U50_L50/Non_SFP | 0.72 |
| U100_L50 | 42.2 | 54.2 | 63.7 | 7.42 | U100_L50/Non_SFP | 0.70 |
| U150_L50 | 42.6 | 53.4 | 64.2 | 7.35 | U150_L50/Non_SFP | 0.69 |
| U50_L150 | 29.6 | 36.7 | 43.8 | 4.80 | U50_L150/Non_SFP | 0.48 |
| U100_L150 | 27.9 | 36.8 | 43.7 | 5.59 | U100_L150/Non_SFP | 0.48 |
| U150_L150 | 27.2 | 35.7 | 43.9 | 5.76 | U150_L150/Non_SFP | 0.46 |
| U200_L150 | 27.8 | 36.2 | 43.7 | 5.46 | U200_L150/Non_SFP | 0.47 |
| U50_L250 | 26.6 | 33.7 | 41.2 | 4.97 | U50_L250/Non_SFP | 0.44 |
| U100_L250 | 26.3 | 33.9 | 39.8 | 4.95 | U100_L250/Non_SFP | 0.44 |
Notes: Non: non-reinforcement; U: length of the upper part of the SFP with reference to the edge of the box structure; L: length of the lower part of the SFP with reference to the edge of the box structure; the numbers 50, 100, 150, 200, and 250 indicate the lengths of the upper and lower parts of the SFP.
Publisher’s Note: MDPI stays neutral with regard to jurisdictional claims in published maps and institutional affiliations. |
© 2021 by the authors. Licensee MDPI, Basel, Switzerland. This article is an open access article distributed under the terms and conditions of the Creative Commons Attribution (CC BY) license (https://creativecommons.org/licenses/by/4.0/).
Share and Cite
MDPI and ACS Style
Son, S.; Choi, M.; Yoo, J. Stability Analysis of Soil Flow Protector and Design Method for Estimating Optimal Length. Appl. Sci. 2021, 11, 7314. https://doi.org/10.3390/app11167314
AMA Style
Son S, Choi M, Yoo J. Stability Analysis of Soil Flow Protector and Design Method for Estimating Optimal Length. Applied Sciences. 2021; 11(16):7314. https://doi.org/10.3390/app11167314
Chicago/Turabian StyleSon, Suwon, Moonbong Choi, and Jaewon Yoo. 2021. "Stability Analysis of Soil Flow Protector and Design Method for Estimating Optimal Length" Applied Sciences 11, no. 16: 7314. https://doi.org/10.3390/app11167314
Note that from the first issue of 2016, this journal uses article numbers instead of page numbers. See further details here.