
A Hazard Analysis Approach for the SOTIF in Intelligent Railway Driving Assistance Systems Using STPA and Complex Network


1
State Key Laboratory of Rail Traffic Control and Safety, Beijing Jiaotong University, Beijing 100044, China
2
National Research Center of Railway Safety Assessment, Beijing Jiaotong University, Beijing 100044, China
*
Author to whom correspondence should be addressed.
Appl. Sci. 2021, 11(16), 7714; https://doi.org/10.3390/app11167714
Submission received: 31 July 2021
/
Revised: 18 August 2021
/
Accepted: 20 August 2021
/
Published: 22 August 2021
(This article belongs to the Section Applied Industrial Technologies)
Abstract
:Featured Application
This novel approach combines the advantages of both STPA and the complex network. It is useful for the identification and evaluation of hazardous factors regarding the safety of the intended functionality (SOTIF). This approach can be applied to driving assistance systems with complex sensors and AI algorithms, one of which is the Intelligent Railway Driving Assistance System.
Abstract
The Intelligent Railway Driving Assistance System (IRDAS) is a novel kind of onboard system that relies on its own situational awareness function to ensure the safety and efficiency of train driving. In such systems, the use of situational awareness brings about a new fault-free safety problem, i.e., the safety of the intended functionality (SOTIF). It is essential to analyze the SOTIF-related hazardous factors for ensuring a safe train operation. In this paper, a hazard analysis approach is proposed to capture and evaluate SOTIF-related hazardous factors of IRDAS. This approach consists of an extended STPA-based hazardous factor identification part and a complex network-based hazardous factor evaluation part. In the first part, an extended control structure of STPA is designed for the modeling of the situational awareness process, followed by a new classification of SOTIF-related causal scenarios to assist the identification of causal scenarios. In the second part, a modeling method for heterogeneous complex networks and some customized topological indexes are proposed to evaluate the hazardous factors identified in the STPA causal analysis. The outcomes of the approach can help develop targeted hazard control strategies. The proposed approach has been applied to a new IRDAS operating in Tsuen Wan Line of Hong Kong MTR. The result shows that the approach is effective for the analysis of hazardous factors and is helpful for the formulation of hazard control strategies.
1. Introduction
The efficient and safe operation of railway systems now relies on automated train control (ATC) systems based on the cooperation of onboard and ground-based signaling equipment. When ATC fails, the driver can only drive at an extremely limited speed, which brings about enormous disruption in the operation of the railway network. In recent years, the Intelligent Railway Driving Assistance System (IRDAS), achieved by sensors such as cameras, RADARs and LiDARs, and AI algorithms, is being developed and installed on trains to make the train environment situationally aware by itself [1,2,3]. The driver can be allowed to operate the train at a much higher speed with the assistance of IRDAS. At the same time, this also causes a potential safety problem where the driver may not be able to stop the train in time if the system does not behave as intended, which could be fatal. Therefore, it is necessary to ensure the safety of the IRDAS.
For a traditional electrical/electronic (E/E) system such as ATC, the safety is of the field of functional safety, in which the safety problem is mainly due to random hardware failures and systematic failures [4]. Now, for IRDASs, the control and acting are based on the perception of objects, infrastructures, and other critical information. The systematic use of situational awareness achieved by complex sensors and processing algorithms brings up a new safety problem, i.e., the safety of the intended functionality (SOTIF) [5]. Unlike the traditional functional safety that focuses on failures, the SOTIF is caused by two categories of hazardous factors, which are functional insufficiencies and reasonably foreseeable misuses. For the IRDAS, the SOTIF provides a complement of safety issues of environmental hazardous factors which are not considered in functional safety [6]. As a vital part of ensuring the safety of the IRDAS, it is essential to analyze the SOTIF of the IRDAS. Therefore, a practical hazard analysis method for the SOTIF of the IRDAS is needed.
Approaches such as fault tree analysis (FTA) [7], failure mode and effect analysis (FMEA) [8], event tree analysis (ETA) [9], and hazard and operability analysis (HAZOP) [10] are widely used in the hazard analysis of railway E/E systems [11]. The works in [12,13] apply FTA to the hazard analyses of the railway moving authority plus system and the railway turnout system. The works in [14,15] use FMEA to identify the potential safety problems in the structure and function of automatic train protection systems. In [16,17], HAZOP is used to support the hazard identification and analysis of railway signaling systems.
However, these approaches are based on event chains, in which the events are usually component faults, functional failures, and functional deviations [18]. For the IRDAS, the SOTIF problems arise from the performance limitations during complex interactions with the operational environment [19], i.e., the SOTIF issues are related to interactions. It is difficult for the above approaches to deal with such interaction-related issues. Other than the traditional approaches, there are systematic models and methods that are able to interpret the safety impacts of interactions in systems, such as the Functional Resonance Accident Model (FRAM) [20,21,22] and System Theoretic Process Analysis (STPA) [23,24,25]. In the systematic approaches, safety is considered an emergent problem and should be analyzed among the complex interactions within the social–technical systems. This kind of approach is suitable for SOTIF issues. For example, STPA has been applied to the SOTIF of road vehicles. The work in [26] develops a process that captures key steps from PAS 21448 [5] with STPA and analyzes lane centering and lane changing for a generic level 3 highway chauffeur system. The authors in [27] use the STPA method with agile systems engineering pipeline. Hazardous scenarios are identified before system testing to improve SOTIF in autonomous vehicles. Therefore, STPA can be utilized to analyze the SOTIF issues of IRDAS. Nevertheless, as a domain-independent approach, STPA focuses on the general procedures and hazardous factors. For adapting the features of the SOTIF, i.e., the hazardous factors related to functional insufficiencies and reasonably foreseeable misuses, STPA still need to be further customized. Besides, for practical hazard control, it is necessary to be aware of the importance degree of the hazardous factors [23]. Based on different values of importance degree, targeted hazard control strategies can be formed. For example, safety measures should be taken in the design phase for the vital hazardous factors, while other, less important, hazardous factors can be controlled by safety barriers or contingency plans in the system operation phase. For the STPA analysis of the SOTIF of the IRDAS, the factors derived from it should be ranked by the importance degree. As STPA alone cannot provide a factor evaluation [28], an extra importance degree evaluation method should be adopted for this part of the analysis.
For the evaluation of hazardous factors, the complex network theory is a powerful tool that reveals the topological characteristic of complex systems and complex relationships [29,30]. In the complex network analysis, the nodes represent hazardous factors of the systems, and the edges describe the interactions between nodes. By the use of some topological indexes, such as node degree and shortest path length [31], the hazardous factors can be evaluated. The complex network has been widely applied to the evaluation of railway hazardous factors. For example, the works in [32,33] construct directed networks to evaluate the causes of Metro accidents. For the mainline railway, directed complex networks are used in [34,35,36] to reveal the critical safety factors and event chains, and undirected complex networks are built in [37,38] to find the main contributing factors of various types of safety occurrences.
It should be noticed that most of the railway safety analyzing networks above are homogeneous networks or heterogeneous networks consisting of two types of nodes, i.e., the nodes of such networks are of one or two types. Moreover, the topological evaluating indexes are derived from the corresponding structures of networks. However, the STPA analysis of the SOTIF of the IRDAS will obtain two types of hazardous factors, including unsafe control actions and their causal scenarios. Together with hazards, the network built upon the result of the analysis will be a heterogeneous network that contains three different types of nodes. To analyze the characteristics of this kind of network, the topological indexes designed for the existing networks cannot meet the need and should be further improved.
In this context, this paper aims to purpose a hazard analysis approach for the SOTIF of the IRDAS using STPA and the complex network. Firstly, the STPA method is customized to cope with the safety problems that emerge due to the performance limitation of intelligent environment situation awareness in the IRDAS. In this part, the feedback part of the control structure in STPA is extended for better modeling the complex sensors and AI algorithms, and a new classification of causal scenarios is proposed to identify the SOTIF-related causal scenarios. Then, a modeling method for the heterogeneous complex network consisting of three types of nodes and some corresponding topological indexes are proposed to evaluate the importance degree of the hazardous factors identified in the STPA causal analysis. By applying the proposed hazard analysis approach to a real IRDAS, the usefulness of this approach is validated.
2. Methodology
The framework of the approach proposed in this paper is shown in Figure 1.
- Step 1 is to describe the system and the operational environment. The system description includes the description of the system functions and the system structure. The operational environment description provides the infrastructures and objects that the system should recognize, as well as the environmental and operational factors that may influence the recognition. This step provides the knowledge of the interactions inside and outside the control system for the analysis in the next step.
- Step 2 is the identification of SOTIF-related hazardous factors with extended STPA. Firstly, the hazards of this system are determined. Then, a control structure with the feedback part extended for intelligent environmental situation awareness is built. After that, the unsafe control actions (UCAs) are identified. In the last part of the extended STPA, a causal analysis is carried out on the UCAs with SOTIF-related scenario classification.
- Step 3 is the evaluation of the hazardous factors including hazards, UCAs, and causal scenarios. A complex network is constructed for the hazardous factors and quantitative analysis is carried out with some customized topological indexes.
The main contributions of this paper are the extended control structure, the SOTIF-related scenario classification used in Step 2, and the hazardous factors network modeling and quantitative topological evaluating indexes used in Step 3. The details of these are shown as follows.
2.1. Identification of SOTIF-Related Hazardous Factors with the Extended STPA
The research of the SOTIF usually uses unintended behaviors of the intended function and reasonably foreseeable misuse as the direct causes of the hazard [5,26,27]. The unintended behaviors are caused by scenarios containing triggering events. The triggering events happen when the performance limitation affects the proper situational awareness. The research above is based on the assistant driving of road vehicles, in which the E/E system directly controls the train, and the driver plays the role of a backup. For the SOTIF of the IRDAS, since it is the human but not E/E system that controls the train, the hazard is directly caused by unintended human behaviors. Then, the unintended human behavior is caused by unintended behaviors of the IRDAS or reasonably foreseeable misuses, which is similar to the past research.
STPA is a well-recommended method for SOTIF-related hazard analysis, and some works provide examples. ISO 21448 [5] provides an example that uses STPA in the hazard analysis of the reasonably foreseeable misuse. In the analysis of NHTSA [26], STPA is used in the analysis of both performance limitations and misuses. Their research shows that UCA is similar to unintended behavior, and causal scenario is similar to trigger event. The works above illustrate that STPA can suit the causational idea of the SOTIF. However, the way they identify causal scenarios about performance limitations is through the exhaustion of bidirectional comparison of component performance limitations and environmental elements. This process is not based on the complex interaction of their control structure. As a result, they only analyze the situation awareness components, including sensors and algorithms, in an isolated way, and neglect the integrated system. SPTA uses the control structure to model and analyze the complex interactions and provides systematic causal scenarios. Thus, the way to construct the control structure and the way to deduct causal scenarios for the SOTIF need further customization.
2.1.1. Model the Control Structure with the Extended Feedback Module
To build a control structure for STPA analysis, it is necessary to recognize the role of the different parts in the assistant railway driving. The control structure of STPA consists of four basic elements, including sensor, controller, actuator, and controlled process [23]. The controller contains the process model and control algorithm. For the driving process with the IRDAS, the traction and brake system should be the actuator of the train operation process, which is not different from the analysis in the functional safety domain. When the train is operating in IRDAS mode, the driver should be aware of the operation process, and controls the traction and brake forces. This places the driver in the role of controller. At the speed under the IRDAS driving mode, the driver is visually incapable of obtaining all the time-efficient information that is critical to operational safety. The IRDAS provides infrastructure and object information and provides driving suggestions, reminders, and warnings to the driver, while it does not provide a direct control order. This makes the IRDAS an intelligent feedback process in this research. It can be seen that the feedback process becomes too complex to depict with a simple sensor. It is necessary to further design a framework for depicting the complex feedback process that is implemented by the IRDAS.
Endsley proposes the three-level model, which is now a dominant situational awareness model in the human factor domain [39]. In this model, level one is the perception of the elements in the environment, level 2 is the comprehension of the elements and their meanings, and level 3 is the projection of future status. The work in [40] provides four basic elements for robotics and autonomous systems, including sensing, understanding, deciding, and acting (SUDA). Our paper proposes to build the STPA feedback structure with the four elements of sensing, understanding, deciding, and acting, and the three-level model is used to describing the understanding process. The proposed framework for building a SOTIF-related control structure for the IRDAS is shown in Figure 2. In the control structure, the feedback part of the IRDAS describes the interaction of the sensing, understanding, deciding, and acting. The three situational awareness levels provide a guide to describe and analyze how the understanding works. The deciding element evaluates matters including uncertainty, safety, etc., and then makes decisions of what information should be noticed by the driver. The information flows from sensing to deciding, and reversely, deciding and understanding can also provide information to sensing. The downward arrows in the feedback part of the control structure represent the settings and dynamic adjustments, to obtain better environmental information. In addition, the driver obtains information directly from the controlled process and operational environment. Although not sufficient to operate the train at that speed, this information could support the driver in correctly using the IRDAS.
2.1.2. Identification of Causal Scenarios by SOTIF-Related Classification
This analysis aims to find the SOTIF-related causal scenarios from the performance limitation of situational awareness and the related reasonably foreseeable human misuse.
In the control structure, the performance limitation of situational awareness should be analyzed in the feedback part, and the reasonably foreseeable human misuse should be analyzed around the driver. However, the existing STPA is a domain-independent method that does not provide a targeted classification of SOTIF-related causal scenarios for the IRDAS. Therefore, based on the structural characteristics of IRDAS, the classification of the SOTIF-related causal scenarios regarding the process model and the feedback is proposed, which is shown in three phases, as follows.
Phase 1 is to identify the set of situational information that, if incomplete, incorrect, or uncertain, can lead to the UCAs. In this phase, the mental model of the driver and the IRDAS decision-making part that uses situational information are examined. For drivers and the IRDAS, the critical situational information includes, for example,
- Environmental information:
- -
- Operational area.
- -
- Track and other infrastructures.
- -
- Trains and other objects on the track.
- -
- The situation of the controlled train (obtained by the perception of the environment).
- -
- Weather and emergency.
- A priori knowledge (e.g., the operational design domain (ODD)).
- The operational mode of the IRDAS.
Phase 2 is to analyze the understanding part of the IRDAS and the driver in order to identify the potential reasons for the improper information in phase 1. This phase includes causes of:
- Matches of the structure and a priori knowledge of environmental model with the real operational environment, to find the
- -
- Incompleteness.
- -
- Incorrectness.
- -
- Uncertainty.
- The uncertainty of learning algorithms [41] in different operational environments, including:
- -
- Aleatoric uncertainties.
- -
- Epistemic uncertainties.
- Improper information input. For the understanding of IRDAS, the information comes from sensors and for drivers, the information comes from IRDAS.
- For drivers, the improper use or setting on IRDAS.
Phase 3 is to identify the potential performance limitation of the sensing part, including,
- The performance parameter of sensors compared with particular operational environments.
- The deficient setting and algorithm of sensors compared with particular operational environments.
- The improper feedback or guidance from understanding or deciding parts in some particular operational environment.
- For drivers, the improper use or setting of the IRDAS.
It should be noticed that the causal scenarios consist of many interrelated causal factors. For the purpose of practical hazard control, the causal factors, instead of causal scenarios, are used for the evaluation in the following content.
2.2. Evaluation of Hazardous Factors with Complex Network
2.2.1. Construction of Causation Network
To evaluate the hazardous factors identified by STPA, a network of hazardous factors and their causal relationships must be constructed first. In such a network, the hazardous factors, including both unsafe control actions and their causal factors, are abstracted as nodes. The cause–effect links between hazardous factors are represented by directed edges connecting the nodes. Besides, hazards and their corresponding causal links with unsafe control actions are also represented by nodes and edges. The above network is known as the hazardous factor network (HFN). Its definition is shown, as follows.
Definition 1.
The HFN is a quadruple <VCS, VUC, VH, R>, where
- VCF represents the set of causal factor nodes, i.e., the causal factors leading to unsafe control actions. The number of the causal factor nodes is denoted as NCF.
- VUC represents the set of unsafe control action nodes, i.e., the unsafe control actions resulting in hazards. The number of nodes in VUC is denoted as NUC.
- VH refers to the set of hazard nodes, the number of which is denoted as NH.
- R= {(VCF, VUC), (VUC, VH)} is the set of cause–effect relationships between nodes, and exists in the form of directed edges. In R, (VCF, VUC) refers to the cause–effect links between causal factor nodes and unsafe control action nodes. Similarly, (VUC, VH) refers to the cause–effect links between unsafe control action nodes and hazard nodes.
By Definition 1, the HFN can be constructed through the adjacency matrix defined in Equation (1).
where both i and j represent the nodes in {VCF, VUC, VH}, and (i, j) represents the relationships between the two nodes. If there is a cause–effect link between i and j, the entry of adjacency matrix is equal to 1, i.e., there is a directed edge connecting the nodes i and j. It is worth noting that the entry AMij with the value of 1 means the HFN is a kind of unweighted network. This is because the hazardous factors and their cause–effect links are identified by the qualitative STPA, i.e., it is difficult to capture the quantification of the strength of the cause–effect relationship by STPA. In fact, the quantified values of cause–effect relationships change with different system implementation and complex operational environments. It is difficult to obtain the quantified cause–effect strength. Without loss of generality, the cause–effect relationships are represented by unweighted edges in this paper.
To facilitate the subsequent evaluation, two kinds of structural matrixes are introduced based on the definition of the adjacency matrix. One is the shortest path matrix, which reflects the features of causal distances among hazardous factors and is defined by Equation (2).
where both i and j represent the nodes in {VCF, VUC, VH}, P = {Pk | k = 1, 2,…, n}, Pk is a causal path from the node i to the node j, and m and n are the nodes on the path Pk. If there are causal paths between i and j, the value of the entry SPMij is the minimum of the path lengths from i to j. This matrix can be calculated by Sommer’s algorithm [42]. Another matrix is the reachability matrix, which depicts the indirect causal relationships between hazardous factors and can be calculated by Equation (3).
where both i and j represent nodes in the HFN. Using Equation (3), this matrix can be obtained by the values of the shortest path matrix.
2.2.2. Evaluation Based on Topological Indexes
The HFN depicts the topological structure of hazardous factors from the perspective of causal relationships. It provides a model foundation for evaluation. By the use of topological indexes, the evaluation of hazardous factors can be performed based on the HFN. Nevertheless, the existing indexes [32,33,35], such as degree, clustering coefficient, and betweenness, are designed for homogeneous networks or heterogeneous networks consisting of two types of nodes. The HFN proposed in this paper is a kind of heterogeneous network including three types of nodes, i.e., causal factor nodes, unsafe control action nodes, and hazard nodes. To evaluate the hazardous factors by a topological analysis, some topological indexes should be customized in accordance with the structural features of the HFN.
A topological index known as causal connection density of the HFN is proposed to measure the overall connection feature of the network, as shown in Equation (4). It reflects the causal connection degree of the hazardous factors in the HFN. This index is calculated by the ratio of the number of actual edges to the number of possible edges, where the product of NCF and NUC is the maximum possible number of cause–effect edges between causal factors and unsafe control actions, the product of NUC and NH is the maximum possible number of cause–effect edges between unsafe control actions and hazards, and half of the product of NCF and NCF is the maximum possible number of cause–effect edges among causal factors.
To evaluate the overall causal path density of the HFN, the index of path density is proposed and calculated by Equation (5). As shown by Equation (5), the product of NCF and NH is the maximum possible number of causal paths between causal factors and hazards. The path density denotes the scale of actual causal paths from causal factors to hazards. In other words, the higher the value of this index, the higher the number of causal paths, and hence the more likely the hazards are to be caused.
As mentioned, the hazardous factor nodes in the HFN include causal factor nodes and unsafe control action nodes. These hazardous factor nodes and their causal relationships constitute hazard causal paths. To further explore the degree of causal correlation between nodes, two indexes of causal correlation are designed. One is the index of active correlation in Equation (6). It measures the degree of causal correlation between a hazardous factor node i and the hazardous factor nodes caused by node i. As shown by Equation (6), the causal correlation is inversely proportional to the shortest path lengths, i.e., the longer the path, the weaker the causal correlation. Similarly, another index, known as passive correlation, is designed in Equation (7). It denotes the degree of causal correlation between a hazardous factor node i and the causal factors nodes that can cause node i.
If a hazardous factor node appears on several different hazard causal paths, it is a key node for blocking these causal paths. It is significant to identify this kind of node for hazard control. In view of this, an index derived from the traditional betweenness index is proposed in accordance with the structural features of the HFN, and is shown in Equation (8). The index reveals the degree of intermediary for a hazardous factor in hazard causal paths, i.e., the number of paths through a causal factor node or an unsafe control action node. The higher the value of the index of a hazardous factor node is, the higher the degree of intermediary for it is. Besides, to explore the overall intermediary situation of all hazardous factors, the cumulative distribution of betweenness can be calculated by Equation (9). In Equation (9), N(Bi) refers to the number of nodes with the betweenness value of Bi. The distribution function reflects the proportion of the hazardous factor nodes with the betweenness value of not less than a.
For the purpose of forming targeted control measures, two indexes of edge evaluation are proposed. The first one is the incoming edge importance index defined in Equation (10). It measures the relative importance degrees of incoming edges of a causal factor node. As shown by Equation (10), for a causal factor node j and one of its incoming edges Eij, the relative importance degree of Eij depends on the feature of node i, i.e., the number of edges (excepting Eij) of node i. Similarly, another index for evaluating relative importance degrees of outgoing edges is shown in Equation (11). For a causal factor node i and one of its outgoing edge Eij, the relative importance degree of Eij depends on the feature of node j. By the two indexes, the relative importance degrees of edges of a causal factor node can be identified for hazard control. That is, the higher the value of the index of an edge is, the more the invested resources for controlling the edge should be.
3. Case Study
3.1. The TIDS
The Train Intelligent Detection System (TIDS) [43] is a new IRDAS, and has been placed into operation in the Tsuen Wan Line of the Hong Kong MTR. The TIDS is equipped with cameras, LiDARs, and a millimeter-wave RADAR to obtain real-time data from the operational environment. The environmental data is processed by the AI algorithm and the precise electronic map. In the processing, the data from cameras is used to recognize objects, and the data fusion of cameras and LiDARs is used to measure the distance of the objects. The millimeter-wave RADAR is used to measure the speed of the train. The combination of speed and sign recognition supports localization. Based on that, the TIDS can adjust the real-time speed limit to the situation of the railway line for the driver and provide an alarm when there is an obstacle or a human ahead, as is shown in Figure 3.
The onboard ATC failure is a typical kind of signaling failure in Metro operation. If the onboard ATC fails, there is no automated protection except for some signal lights that protect stations and switches. The drivers can only drive on sight, and most of the time, the drivers do not know the distance of the trains, signal lights, or other infrastructures in front of them. Since the braking distance of a train is very long for a driver’s sight, the driver is only permitted to drive at a very low speed. The situation of onboard ATC failure is a typical operational scenario where the TIDS can provide assistance to drivers and promote the driving speed. Thus, this operational scenario is chosen to be analyzed in the case study of this paper.
In this operational scenario, based on the location and electronic map, the TIDS can possess the information of the infrastructure (e.g., switch, station), including the corresponding signal light in front of the train. The type and distance of the infrastructure ahead are then shown to the driver with a real-time calculated speed limit. The driver is also reminded in advance to watch the signal light. When there is a train, a human, or an obstacle ahead, the TIDS will recognize the type and provide the type, distance, and corresponding speed limit to the driver. If something urgent happens, for example, the driver ignores the speed limit, or the intrusion of an obstacle requires the speed limit to be lower than the current speed, the TIDS will provide an alarm.
The TIDS needs to obtain information directly from the operational environment to provide assistance for operation. To carry out hazard analysis of the system–environment interaction, it is necessary to identify the environmental variables in advance, including the variables that the TIDS needs to detect and those that may affect the performance of the detection. The identified environmental variables are shown in Table 1.
3.2. Identification of SOTIF-Related Causes
In the STPA approach, the system-level hazards are identified from accidents. The accidents of this system are the same as the accidents of common train operations. The accidents identified are shown as follows.
- A1. A train collides with an obstacle.
- A2. A train collides with a human.
- A3. A train rear-end collides with another train.
- A4. A train collides with a train on the sideline.
- A5. Train derailment.
- A6. An unnecessary emergency brake causes passenger injury.
Then, the hazards and corresponding safety constraints of the system are identified from the accidents and listed as follows.
- H1. The system cannot protect the safe speed/distance restriction of the train. (A1–A5).
- SC1. The system must give the brake order before the train breaks the speed/distance restriction.
- H2. The system cannot prevent the train from exceeding the speed limit of the section. (A1–A5).
- SC2. The system should keep the speed of the train under the limit of the current section and the section being entered.
- H3. The system provides an emergency brake in a nonurgent situation (A6).
- SC3. The system should only provide an emergency brake when the situation is urgent.
Based on the framework proposed in Section 2.1.2, the control structure of the human–machine driving system is built, as is shown in Figure 4. In the perception part of the IRDAS, the image recognition and data fusion of image and point cloud provide the type and distance information of infrastructures and objects. The detected sign information is then used with the speed from RADAR and electronic map to achieve localization. The information above is used in situational comprehension, and a situational model is built. Based on the comprehension of the situation, some projections about the situation are made. The driver can obtain the rough obstacles, localization, and speed information by watching. More precise and time-efficient information can be obtained from the interface of the TIDS, including the panel and the voice prompt. The driver can decide to use or power off the TIDS by judging if the current situation is within the operational design domain. For example, if the visibility is too poor due to heavy fog, the driver should stop trusting the TIDS, because the TIDS is not designed to work in this extreme weather.
As shown in the control structure, the driver, as the controller in this system, has two types of control actions, which are traction/brake of the train and use/not use of the TIDS. The unsafe control actions (UCAs) related to the controller are identified by the four UCA types of STPA and the actual operational scenarios in Section 3.1, and are listed in Table 2. Since the unsafe controls are regarding the improper situation awareness and do not have a duration problem in our study, the UCAs are derived from the first three UCA types, i.e., “not providing causes hazard”, “providing causes hazard”, and “too early, too late, out of order”.
According to the proposed SOTIF-related classification in Section 2.1.2, the SOTIF-related causal scenarios and causal factors of these UCAs are identified by analyzing the interactions in the control structure. As a result, 154 SOTIF-related causal factors are found in this analysis. Due to limited space, one typical unsafe control action and part of its causal factors are shown as an example in the following.
UCA2: The driver does not provide a brake before the train breaks the speed/distance restriction regarding the front train.
- ●
- CF105. The TIDS does not timely detect the front train.
- CF18. The object is in the position that sensors of the TIDS cannot detect.
- ▪
- CF19. The vision of the cameras is blocked due to the geographic characteristics of the section.
- -
- CF20. The train is running on a curve.
- -
- CF21. The train is running on a slope.
- ▪
- CF22. The inherent blind zone of the cameras.
- CF23. The quality of the image from cameras is too poor for perception.
- ▪
- CF8. The driver excessively trusts the TIDS in terrible operational environments.
- ▪
- CF24. The cameras are affected by the atmospheric visibility.
- -
- CF25. Terrible weather affects the visibility.
- -
- CF8. The driver excessively trusts the TIDS in a terrible operational environment.
- -
- CF4. Terrible weather such as rain, snow, sand, or fog.
- ▪
- CF26. The working condition of the train affects the quality of the image from cameras.
- -
- CF27. Vibration.
- -
- CF28. Degradation of mechanical components of cameras and bad maintenance.
- -
- CF29. Water film or sand cover the lens.
- -
- CF4. Terrible weather such as rain, snow, sand, or fog.
- ▪
- CF30. Cameras are affected by the illumination condition.
- -
- CF31. The illumination is too strong or too weak.
- -
- CF32. The light of an opposite train.
- -
- CF33. The illumination changes when entering or leaving a tunnel.
- -
- CF34. The different illumination during a day.
- -
- CF35. The different illumination in different seasons.
- -
- CF36. Cameras are exposed directly to an external artificial light.
- CF106. Some characteristics of the object train make the train not obvious in the image.
- ▪
- CF107 The lights on the front train are off.
- ▪
- CF108. The coating of the train is not distinct from the background color.
- ▪
- CF109. The lights on the front train are off.
- ▪
- CF110. Rain, snow, or sand covers the surface of the train.
- -
- CF4. Terrible weather such as rain, snow, sand or fog.
- CF43. The speed of the image recognition is not enough.
- ▪
- CF44. The algorithm is inefficient.
- ▪
- CF45. The software aging during long time operation.
- ▪
- CF44. The image recognition efficiency is low in some operational scenarios.
- ▪
- CF47. The lack of computing power in hardware.
- CF111. The image recognition algorithm based on machine learning has some flaws recognizing the front train.
- ▪
- CF49. The situation in the operation is too far from that of the training data.
- ▪
- CF50. The quality of the image is different from that of the training data.
- ▪
- CF112. The appearance of the train is different from that of the training data.
- CF55. Image recognition finds the object, but LiDAR does not.
- CF61. The machine vision does not know the decline of its detection range.
- CF113. The standard recognition range is too short for driving assistance.
- CF114. Wrong perception of the position of the object train about whether it is in front or on the sideline.
3.3. Evaluation of SOTIF-Related Causes
Based on the method proposed in Section 2.2.1, the hazardous factors network (HFN) of the hazardous factors is identified in the above STPA analysis. There are 165 nodes, including 3 hazard nodes, 8 UCA nodes, and 154 causal factor nodes, as well as 302 directed edges in this HFN. The HFN is shown in Figure 5.
With the adjacency matrix and the reachability matrix, the two overall indexes are calculated. By Equation (5), the path density is evaluated as 0.6732. By Equation (4), the causal connection density is evaluated to be 0.0232. It shows that the value of its path density is much higher than that of the causal connection density. This indicates that the HFN has complex causal paths among the different types of hazardous factors.
By Equation (6) and Equation (7), the active correlations and passive correlations of hazardous factors are evaluated, as is shown in Figure 6. Some causal factors at the left side of the dotted line in the figure have large passive correlation values and small active correlation values, for example, “the working condition of the train affects the quality of the image from cameras” (CF26), “water film or sand covers the lens” (CF29), and “some characteristics of the object make it hard for perception” (CF51). This means that these causal factors are the terminal type of hazardous factors in their hazard causal relations. These terminal hazardous factors can be easily caused by their direct or indirect causes in short paths but have relatively long paths to cause some other hazardous factors. Thus, preventing this kind of hazardous factor from being caused is an efficient way to control the safety impact of these factors. On the contrary, some causal factors located at the right side of the dotted line have high active correlation and low passive correlation, for example, “the driver exceeds the speed/distance restriction of the front red signal light” (CF102), “the TIDS does not find the front train in time” (CF105), and “the TIDS recognizes other things as an obstacle” (CF118). The indexes mean that these factors are the initial type of hazardous factors in their causal relations. This type of hazardous factor can easily cause other hazardous factors directly or indirectly, so it is better to take measures to prevent them from causing other factors to eliminate their safety impact on the system. The UCAs are at the left side of the dotted line. The UCAs cannot directly cause other hazardous factors but can directly cause hazards in a particular context and worst-case environment. Hazard control actions on UCAs are necessary, but not so efficient due to their low passive correlation values. There are also some middle factors that have similar active and passive correlations, for example, “the distance measurement of the TIDS to objects is incorrect” (CF63) and “the TIDS does not calibrate its location by the environment” (CF77). These factors should be treated by the combination of preventing them from being caused and from causing others. The evaluation of active correlation and passive correlation helps distinguish the type of different hazardous factors in the hazard causation paths. Based on this, targeted actions can be applied to these hazardous factors for more practical and efficient hazard control.
As the terminal hazardous factors need to be prevented from being caused, incoming importance should be given to them. Similarly, outgoing importance should be given to initial hazardous factors since they need to be preventing from causing others. By Equation (10) and Equation (11), the corresponding kind of importance indexes are then evaluated for edges of hazardous factors. Due to limited space, edges of some typical hazardous factors are ranked and shown in Table 3. The hazardous factors in the table are “the driver does not provide brake before the train exceeds the speed limit of current section” (UCA4), “the driver uses the TIDS out of the designed zone” (UCA6), “the TIDS does not recognize the localization sign” (CF75), and “improper operating procedure where the driver does not operate the on/off of the TIDS when entering or leaving its designed area” (CF142). The two UCAs are of terminal type, while CF75 and CF142 are, respectively, of middle type and initial type. Their edges are ranked by their incoming or outgoing importance, where those of higher importance provide more impacts on the safety of the system. This means that more resources should be given to control the edges with high importance value.
The betweenness of the UCAs and causal factors are evaluated by Equation (9), as is shown in Figure 7. The UCAs have large betweenness values, which means UCAs play a more important role as the intermediary in the hazard causation paths. Since UCA4 to UCA7 can lead to two different hazards, the betweenness of them is higher than other UCAs. Some causal factors also have large betweenness values. CF73 and CF76 are regarding the inaccurate, wrong, or lack of localization of the TIDS. CF77 and CF75 are regarding the lack of calibration of localization, and one of its causes is that the TIDS does not recognize the localization sign. This illustrates that localization is the most critical function of the TIDS for the safety of the operation. As are shown at the right side of the figure, “the localization problem causes the TIDS to not remind the driver when entering/leaving designed area” (F139), “improper operating procedure where the driver does not operate the on/off of the TIDS when entering or leaving its designed area” (F142), and “the driver is not aware of the on/off status of the TIDS” (F145) are also of high betweenness. These causal factors are important in the causation paths of the reasonably foreseeable misuses of the driver. By the evaluation of betweenness, important intermediate hazardous factors are found. Based on these factors, the causation paths can be efficiently blocked in the hazard control process.
4. Discussion
The cumulative distribution of betweenness values is calculated by Equation (9) and is shown in Figure 8. It can be seen from the figure that the P(a) of the hazardous factors obeys the power-law distribution P(a) ~0.4534x−0.268 (R² = 0.9049). This indicates that a few hazardous factors have high betweenness values, while most hazardous factors have low betweenness values. For example, in Figure 7, the 11 hazardous factors with top betweenness values hold 6.8 percent of the number of hazardous factors, while they take up to 45 percent of the sum of the overall betweenness value. If these hazardous factors are controlled, a large proportion of causal paths leading to hazards will be blocked. Thus, more resources should be allocated to the control of these 11 hazardous factors for eliminating or mitigating hazards. The control of the 11 hazardous factors can be implemented in two steps. The first step is to identify whether the hazardous factors are terminal, middle, or initial type. Based on the type, it can be determined whether the control of a factor should focus on preventing it from being caused or from causing others. Then, in the second step, control measures can be formulated for the corresponding incoming or outgoing edges. Furthermore, the effort or resources for control measures should be invested by the ranking result of edges.
The top 11 high-betweenness hazardous factors can be mainly divided into three kinds, i.e., UCAs, localization-related factors, and misuse-related factors. Due to the limited space, four representative hazardous factors (UCA4, UCA6, CF75, and CF142) of the three kinds are discussed to demonstrate how to develop targeted control strategies.
- It can be seen from Figure 6 that UCA4 (the driver does not provide brake actions before the train exceeds the speed limit of the current section) is a terminal hazardous factor. This means that more resources should be allocated to its incoming edges to preventing it from happening. The importance ranking of its incoming edges in Table 3 shows that ECF76-UCA4 is the most important incoming edge of UCA4, followed by ECF73-UCA4, ECF91-UCA4, ECF95-UCA4, ECF128-UCA4, ECF130-UCA4, ECF134-UCA4, and ECF135-UCA4. Measures can be taken on these edges to control the hazard. For ECF76-UCA4, measures, for example, “lower the speed limit when the TIDS loses localization” can be taken. ECF73-UCA4 can be treated by “provide an alarm when the localization of the TIDS is inaccurate”. For ECF91-UCA4, “the driver–machine interface should be designed to highlight this emergent information” can be taken. ECF95-UCA4 could be dealt with by “the TIDS should give a reminder to the driver when the terrible environmental situation may affect the brake performance”. ECF128-UCA4 can be treated by “the TIDS should provide a reminder of the current speed limit and its variation”. For ECF130-UCA4, ”the speed control of the driver should adjust to the operational environment” could be taken. The control of ECF134-UCA4 can be “new speed limit information should be updated to the TIDS in time”. ECF135-UCA4 could be treated by “electronic map in the TIDS should be updated once any infrastructure in it is changed”. The priority of these measures should follow the importance ranking of the corresponding edges.
- UCA6 (the driver uses the TIDS out of its designed zone) is also a terminal hazardous factor, as can be seen from Figure 6. This indicates that more resources should be put into incoming edges to prevent it from happening. The ranking of the incoming edges can be found in Table 3, which is ECF139-UCA6, ECF142-UCA6, ECF143-UCA6, ECF138-UCA6, ECF140-UCA6, and ECF141-UCA6. For ECF139-UCA6, measures, for example, “the TIDS should provide sufficient reminder to ensure the driver has noticed that the TIDS cannot be used in the current zone” can be taken. ECF142-UCA6 can be treated by “a normalized operation procedure regarding the TIDS should be developed”. ECF143-UCA6 can be controlled by “the driver should have the access to shut off the TIDS in some specific circumstances”. ECF138-UCA6 can be treated by “the TIDS should provide enough reminder when it is not in the designed zone”. The control of ECF140-UCA6 can be “signs should be placed alongside the track to remind the driver whether the section is suitable for the TIDS”. “The driver should be trained to know how to distinguish the TIDS designed zone by all kinds of information” can be taken for ECF141-UCA6. The ranking of the priority of these measures is the same as the importance ranking of the corresponding edges.
- Figure 6 shows that CF75 (the TIDS does not recognize the localization sign) is a middle hazardous factor. This means resources should be allocated to both preventing it from happening and preventing it from causing others. Thus, both incoming and outgoing edges should be of concern. Table 3 shows that the ranking of incoming edges is ECF23-CF75, ECF55-CF75, ECF37-CF75, ECF61-CF75, ECF43-CF75, ECF48-CF75, ECF18-CF75, and ECF62-CF75. For ECF23-CF75, measures can be taken, for example, “improve the image quality in different situations and make localization signs easy to be recognized from low-quality image”. ECF55-CF75 can be treated by “the TIDS should reduce the recommended speed when the results from image recognition and LiDAR conflict”. Measures such as “localization signs should be easy to be detected by the TIDS in different kinds of environment” can be taken for ECF37-CF75. The control of ECF43-CF75 could be “the computing performance of the TIDS should catch up with the operating speed of the train”. For ECF48-CF75, “the appearance of localization signs should be designed to be easy for the algorithm to recognize” could be taken. “Localization signs should be placed in a way that suits the vision of the TIDS cameras” can be taken for ECF18-CF75. ECF61-CF75 can be treated by “the TIDS should provide proper recommended speed to ensure the localization signs are detected in a terrible environment”. For ECF62-CF75, “localization signs should be placed within proper distance to the train’s route” can be taken. More resources should be allocated to the measures that correspond to high-importance edges. Meanwhile, the ranking of outgoing edges of CF75 is ECF75-CF76, ECF75-CF73, and ECF75-CF77. For ECF75-CF76, measures such as “the TIDS should reduce the speed limit and regain localization by detecting the next sign” can be taken. “The TIDS should evaluate the accuracy and correctness of its localization when a localization sign is not detected” can be adopted for ECF75-CF73. The control of ECF75-CF77 can be “additional localization signs should be placed in the areas with relatively high frequency where the TIDS misses localization signs”. Similarly, the measures for high-importance edges should receive more attention and resources.
- As shown in Figure 6, CF142 (the improper operating procedure where the driver does not operate the on/off the TIDS when entering or leaving its designed area) is an initial hazardous factor. This means more resources should be allocated to the outgoing edges of this factor. As can be seen in Table 3, ECF142-UCA6 is the more important one, followed by ECF142-CF145. The control of ECF142-UCA6 can be “a normalized operation procedure regarding the TIDS should be developed”. ECF142-CF145 can be treated by “proper procedure of the driver should be developed to monitor the working status of the TIDS”. Since ECF142-UCA6 is the more important one of the two edges, more resources should be allocated to its corresponding measures.
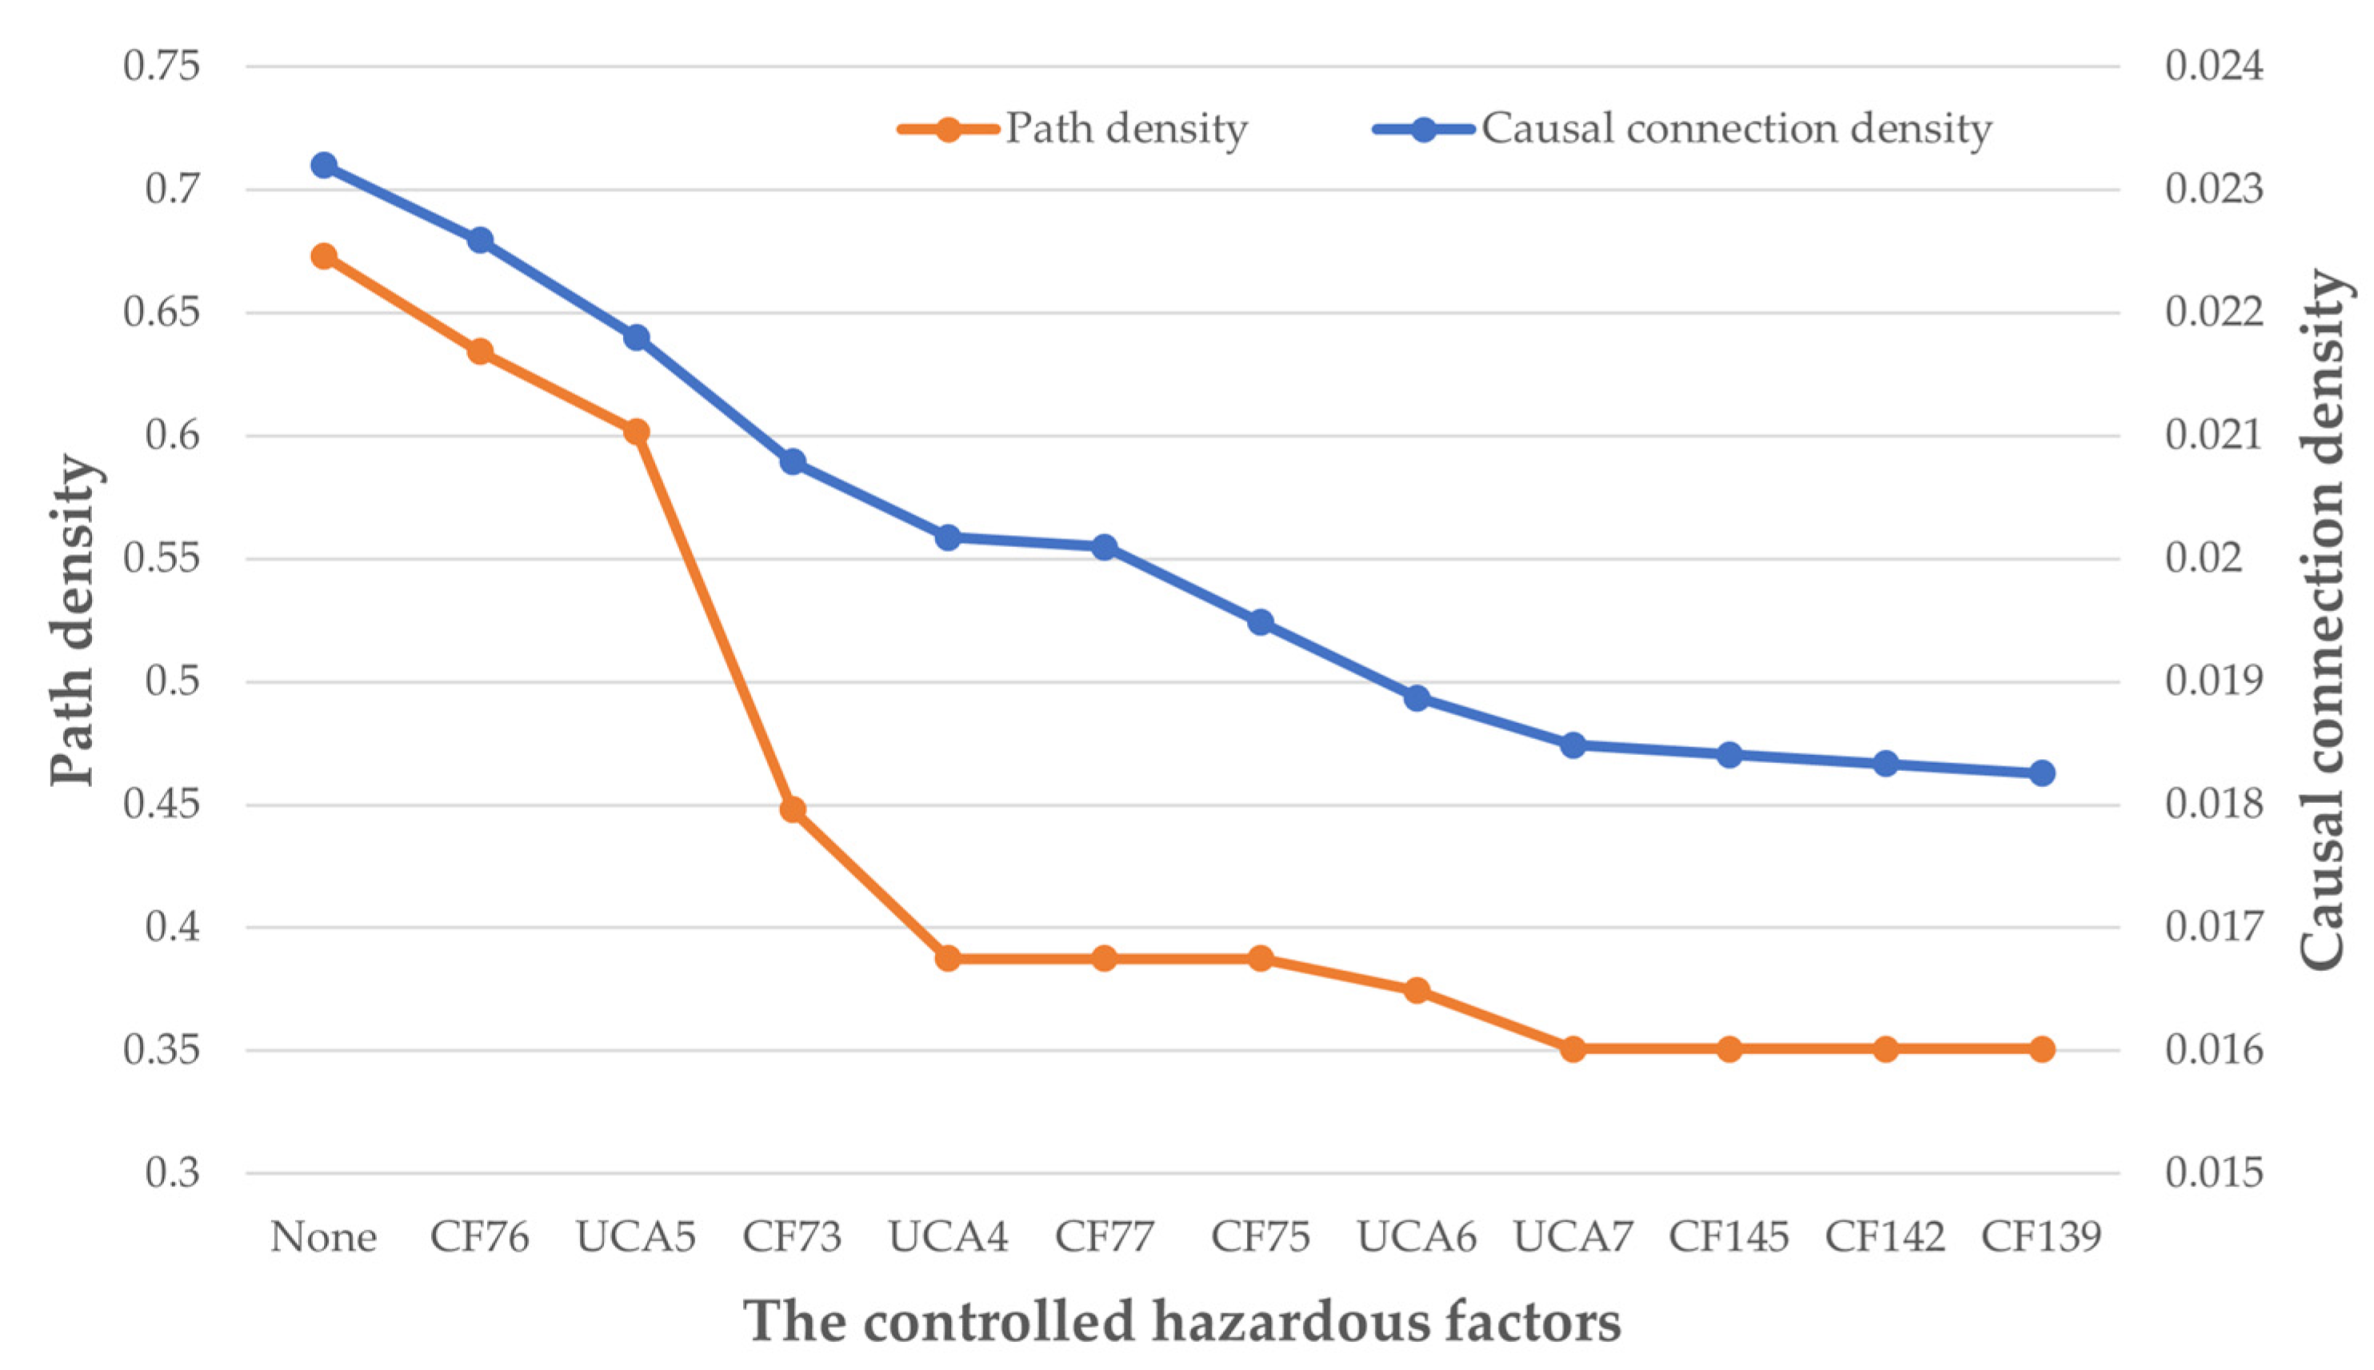
The discussion above demonstrates how to develop control strategies for high-betweenness hazardous factors. In the same way as these four discussed hazardous factors, control strategies of the other seven high-betweenness hazardous factors can be developed. By controlling these 11 hazardous factors, the hazards of the TIDS system can be mitigated or controlled. To validate the effectiveness of the hazard mitigation or control, we isolate these 11 high-betweenness hazardous factors in the HFN, i.e., delete the incoming and outgoing edges of these hazardous factors. The isolation of these hazardous factors in the HFN represents these factors are controlled. As a result, Figure 9 shows how the overall performance of the HFN changes when the 11 hazardous factors are controlled in the sequence of their betweenness values. It can be seen from Figure 9 that the causal connection density drops by 21 percent, and the path density reduces by 48 percent after the 11 hazardous factors are controlled. The result shows that the control of only 6.8 percent of all hazardous factors changes the overall causal path density of the HFN by 48 percent. This is consistent with the feature of power-law distribution revealed in Figure 8, i.e., a large proportion of causal paths can be blocked by the control of a few hazardous factors.
5. Conclusions and Future Work
In this paper, we propose a hazard analysis approach for the SOTIF in the IRDAS. This involves the extended STPA method for identifying SOTIF-related hazardous factors, as well as a complex network-based approach for the quantitative evaluation of the identified hazardous factors. The extension of the feedback part in the STPA control structure is helpful for the deeper understanding of the situational awareness process of the IRDAS. Based on that, the hazardous factor classification is beneficial for safety practitioners to identify more comprehensive hazardous factors specified in the SOTIF domain. The hazardous factors network and the customized topological indexes explore the complexity of the identified hazardous factors. This can help find the key factors and make targeted hazard control strategies. The usefulness of the proposed approach is validated on the TIDS. A total of 162 SOTIF-related hazardous factors of three hazards are identified, among which the hazardous factors that play the most important roles in the hazard causation paths are found. Based on that, some practical hazard control strategies are designed and validated for enhancing the safety of the TIDS. The proposed approach has the potentiality to be used in the hazard analysis and the hazard control strategy formulation of the railway autonomous operation systems.
The extension of STPA in this approach emphasizes the feedback part of the system to analyze the problems of the improper system behavior and the reasonably foreseeable driver misuse. In future work, we plan to study the cognitive process of the driver in complex driving processes, to find a way to form a more systematic mental model of the driver. This could provide more insights into the analysis of driver misuses. In addition, after a long period of operation, if sufficient operational data can be collected, the statistical quantitative strengths of cause–effect relationships in the HFN can be calculated. Then, the HFN can be changed into a weighted network, within which more targeted hazard control strategies can be developed.
Author Contributions
Conceptualization, S.Z., J.L. and T.T.; methodology, S.Z. and J.L.; writing—original draft preparation, S.Z.; writing—review and editing, S.Z., J.L., and T.T.; supervision, T.T. All authors have read and agreed to the published version of the manuscript.
Funding
This work is co-supported by the Fundamental Research Funds for the Central Universities (No. 2021QY007), and the National Natural Science Foundations of China (No. 61803019, No. 61803020).
Institutional Review Board Statement
Not applicable.
Informed Consent Statement
Not applicable.
Conflicts of Interest
The authors declare no conflict of interest.
References
- Yang, Z.; Cheung, V.; Gao, C.; Zhang, Q. Train Intelligent Detection System Based on Convolutional Neural Network. In Proceedings of the International Conference on Applied Human Factors and Ergonomics, Washington, DC, USA, 24–28 June 2019. [Google Scholar] [CrossRef]
- Toprak, T.; Selver, M.A.; Belenlğoglu, B.; Dogan, S.; Aydin, B. Camera based pedestrian detection for railway driver support systems. In Proceedings of the 26th Signal Processing and Communications Applications Conference (SIU), Izmir, Turkey, 2–5 May 2018. [Google Scholar] [CrossRef]
- Ye, T.; Wang, B.C.; Song, P.; Li, J. Automatic Railway Traffic Object Detection System Using Feature Fusion Refine Neural Network under Shunting Mode. Sensors 2018, 18, 1916. [Google Scholar] [CrossRef] [PubMed] [Green Version]
- CENELEC. EN 50129:2018—Railway Applications—Communication, Signalling and Processing Systems—Safety Related Electronic Systems for Signalling; International Organization for Standardization: Brussels, Belgium, 2018. [Google Scholar]
- ISO. PD ISO/PAS 21448:2019 Road Vehicles—Safety of the Intended Functionality; European Committee for Electrotechnical Standardization: Geneva, Switzerland, 2019. [Google Scholar]
- Zhang, X.Y.; Shao, W.B.; Zhou, M.; Tan, Q.F.; Li, J. A scene comprehensive safety evaluation method based on binocular camera. Robot. Auton. Syst. 2020, 128, 103503. [Google Scholar] [CrossRef]
- Lee, W.S.; Grosh, D.L.; Tillman, F.A.; Lie, C.H. Fault Tree Analysis, Methods, and Applications—A Review. IEEE Trans. Reliab. 1985, 34, 194–203. [Google Scholar] [CrossRef]
- Cichocki, T.; Górski, J. Failure mode and effect analysis for safety-critical systems with software components. In Proceedings of the International Conference on Computer Safety, Reliability, and Security, Rotterdam, The Netherlands, 24–27 October 2000. [Google Scholar] [CrossRef]
- Ericson, C.A. Hazard Analysis Techniques for System Safety; John Wiley & Sons: Hoboken, NJ, USA, 2015. [Google Scholar] [CrossRef]
- Redmill, F.; Chudleigh, M.F.; Catmur, J.R. Principles underlying a guideline for applying HAZOP to programmable electronic systems. Reliab. Eng. Syst. Saf. 1997, 55, 283–293. [Google Scholar] [CrossRef]
- Li, M.; Yan, F.; Niu, R.; Xiang, N. Identification of causal scenarios and application of leading indicators in the interconnection mode of urban rail transit based on STPA. J. Rail Transp. Plan. Manag. 2021, 17, 100238. [Google Scholar] [CrossRef]
- Song, H.F.; Schnieder, E. Evaluating Fault Tree by means of Colored Petri nets to analyze the railway system dependability. Saf. Sci. 2018, 110, 313–323. [Google Scholar] [CrossRef]
- Dindar, S.; Kaewunruen, S.; An, M.; Gigante-Barrera, Á. Derailment-based fault tree analysis on risk management of railway turnout systems. In Proceedings of the IOP Conference Series: Materials Science and Engineering, Prague, Czech Republic, 12–16 June 2017. [Google Scholar] [CrossRef]
- Tao, Q.; Nai, W.; Gao, H.; Tu, J. Risk assessment method of radio block center in fuzzy uncertain environment. In Proceedings of the International Conference on Web Information Systems and Mining, Chengdu, China, 26–28 October 2012. [Google Scholar] [CrossRef]
- Issad, M.; Kloul, L.; Rauzy, A. A scenario-based FMEA method and its evaluation in a railway context. In Proceedings of the 2017 Annual Reliability and Maintainability Symposium (RAMS), Orlando, FL, USA, 23–26 January 2017. [Google Scholar] [CrossRef]
- Hwang, J.-G.; Jo, H.-J.; Kim, D.-H. Hazard analysis of train control system using HAZOP-KR methods. In Proceedings of the 2010 International Conference on Electrical Machines and Systems, Incheon, Korea, 10–13 October 2010. [Google Scholar]
- Skogvang, Ø.; Opsahl, R.K.; Solibakke, S.; Karpati, P.; Hauge, A.A.; Sivertsen, T.; Gran, B.A.; Lundteigen, M.A. Evaluating approaches for hazard identification for the inclusion in a safety assessment framework for efficient transport. In Proceedings of the Safety and Reliability–Safe Societies in a Changing World, Proceedings of ESREL 2018, Trondheim, Norway, 17–21 June 2018. [Google Scholar] [CrossRef]
- Leveson, N.G. Safeware: System Safety and Computers; Addison-Wesley: Boston, MA, USA, 1995. [Google Scholar] [CrossRef]
- Monkhouse, H.E.; Habli, I.; McDermid, J. An enhanced vehicle control model for assessing highly automated driving safety. Reliab. Eng. Syst. Saf. 2020, 202, 107061. [Google Scholar] [CrossRef]
- Hollnagel, E. FRAM, the Functional Resonance Analysis Method: Modelling Complex Socio-Technical Systems; Ashgate Publishing, Ltd.: Farnham, UK, 2012. [Google Scholar] [CrossRef]
- Tian, W.L.; Caponecchia, C. Using the Functional Resonance Analysis Method (FRAM) in Aviation Safety: A Systematic Review. J. Adv. Transp. 2020, 2020, 14. [Google Scholar] [CrossRef]
- Salehi, V.; Veitch, B.; Smith, D. Modeling complex socio-technical systems using the FRAM: A literature review. Hum. Factors Ergonom. Manuf. Serv. Ind. 2020, 31, 118–142. [Google Scholar] [CrossRef]
- Leveson, N.G. Engineering a Safer World: Systems Thinking Applied to Safety; The MIT Press: Cambridge, MA, USA, 2016. [Google Scholar] [CrossRef]
- Dghaym, D.; Hoang, T.S.; Turnock, S.R.; Butler, M.; Downes, J.; Pritchard, B. An STPA-based formal composition framework for trustworthy autonomous maritime systems. Saf. Sci. 2021, 136, 11. [Google Scholar] [CrossRef]
- Chen, J.; Wang, S.; Zhou, T.; Xiong, L.; Xing, X. Study on Safety Analysis Method for Take-over System. In Proceedings of the 2020 IEEE Intelligent Vehicles Symposium, Las Vegas, NV, USA, 19 October–13 November 2020. [Google Scholar] [CrossRef]
- Becker, C.; Brewer, J.C.; Yount, L. Safety of the Intended Functionality of Lane-Centering and Lane-Changing Maneuvers of a Generic Level 3 Highway Chauffeur System; National Highway Traffic Safety Administration, Electronic System Safety Research Division: Washington, DC, USA, 2020. [Google Scholar]
- Post, K.; Davey, C.K. Integrating SOTIF and Agile Systems Engineering; SAE International: Warrendale, PA, USA, 2019; ISSN 0148-7191. [Google Scholar]
- Jianbo, H.; Lei, Z.; Shukui, X. Safety analysis of wheel brake system based on STAMP/STPA and Monte Carlo simulation. J. Syst. Eng. Electron. 2018, 29, 1327–1339. [Google Scholar] [CrossRef] [Green Version]
- Liu, J.T.; Li, K.P.; Zheng, W.; Zhu, J.B. An importance order analysis method for causes of railway signaling system hazards based on complex networks. Proc. Inst. Mech. Eng. Part O J. Risk Reliab. 2019, 233, 567–579. [Google Scholar] [CrossRef]
- Guo, S.Y.; Zhou, X.Y.; Tang, B.; Gong, P.S. Exploring the behavioral risk chains of accidents using complex network theory in the construction industry. Physical A 2020, 560, 125012. [Google Scholar] [CrossRef]
- Latora, V.; Nicosia, V.; Russo, G. Complex Networks: Principles, Methods and Applications; Cambridge University Press: Cambridge, UK, 2017. [Google Scholar] [CrossRef]
- Zhou, Z.P.; Irizarry, J.; Li, Q.M. Using network theory to explore the complexity of subway construction accident network (SCAN) for promoting safety management. Saf. Sci. 2014, 64, 127–136. [Google Scholar] [CrossRef]
- Li, Q.M.; Song, L.L.; List, G.F.; Deng, Y.L.; Zhou, Z.P.; Liu, P. A new approach to understand metro operation safety by exploring metro operation hazard network (MOHN). Saf. Sci. 2017, 93, 50–61. [Google Scholar] [CrossRef]
- Zhou, J.; Xu, W.X.; Guo, X.; Ding, J. A method for modeling and analysis of directed weighted accident causation network (DWACN). Physical A 2015, 437, 263–277. [Google Scholar] [CrossRef]
- Lam, C.Y.; Tai, K. Network topological approach to modeling accident causations and characteristics: Analysis of railway incidents in Japan. Reliab. Eng. Syst. Saf. 2020, 193, 106626. [Google Scholar] [CrossRef]
- Liu, J.T.; Schmid, F.; Li, K.P.; Zheng, W. A knowledge graph-based approach for exploring railway operational accidents. Reliab. Eng. Syst. Saf. 2021, 207, 107352. [Google Scholar] [CrossRef]
- Klockner, K.; Toft, Y. Accident modelling of railway safety occurrences: The Safety and Failure Event Network (SAFE-Net) Method. Procedia Manuf. 2015, 3, 1734–1741. [Google Scholar] [CrossRef] [Green Version]
- Li, K.P.; Wang, S.S. A network accident causation model for monitoring railway safety. Saf. Sci. 2018, 109, 398–402. [Google Scholar] [CrossRef]
- Stanton, N.A.; Salmon, P.M.; Walker, G.H.; Baber, C.; Jenkins, D.P. Human Factors Methods: A Practical Guide for Engineering and Design; CRC Press: Boca Raton, FL, USA, 2017. [Google Scholar] [CrossRef]
- Implementation of a RAS to Provide the Required Behaviour. Available online: https://www.york.ac.uk/assuring-autonomy/body-of-knowledge/implementation/ (accessed on 30 July 2021).
- Abdar, M.; Pourpanah, F.; Hussain, S.; Rezazadegan, D.; Liu, L.; Ghavamzadeh, M.; Fieguth, P.; Cao, X.; Khosravi, A.; Acharya, U.R. A review of uncertainty quantification in deep learning: Techniques, applications and challenges. Inf. Fusion 2021, 76, 243–297. [Google Scholar] [CrossRef]
- Sommer, C. Shortest-Path Queries in Static Networks. Acm. Comput. Surv. 2014, 46, 1–31. [Google Scholar] [CrossRef]
- Wang, Z.; Yang, Z.; Tang, S.; Cheung, V.; Zhang, Q. Application of Train Intelligent Detection System in Large-Volume Operated Lines. In Resilience and Sustainable Transportation Systems; American Society of Civil Engineers: Reston, VA, USA, 2020; pp. 377–384. [Google Scholar] [CrossRef]
Figure 1.
The framework of the approach proposed in this paper.
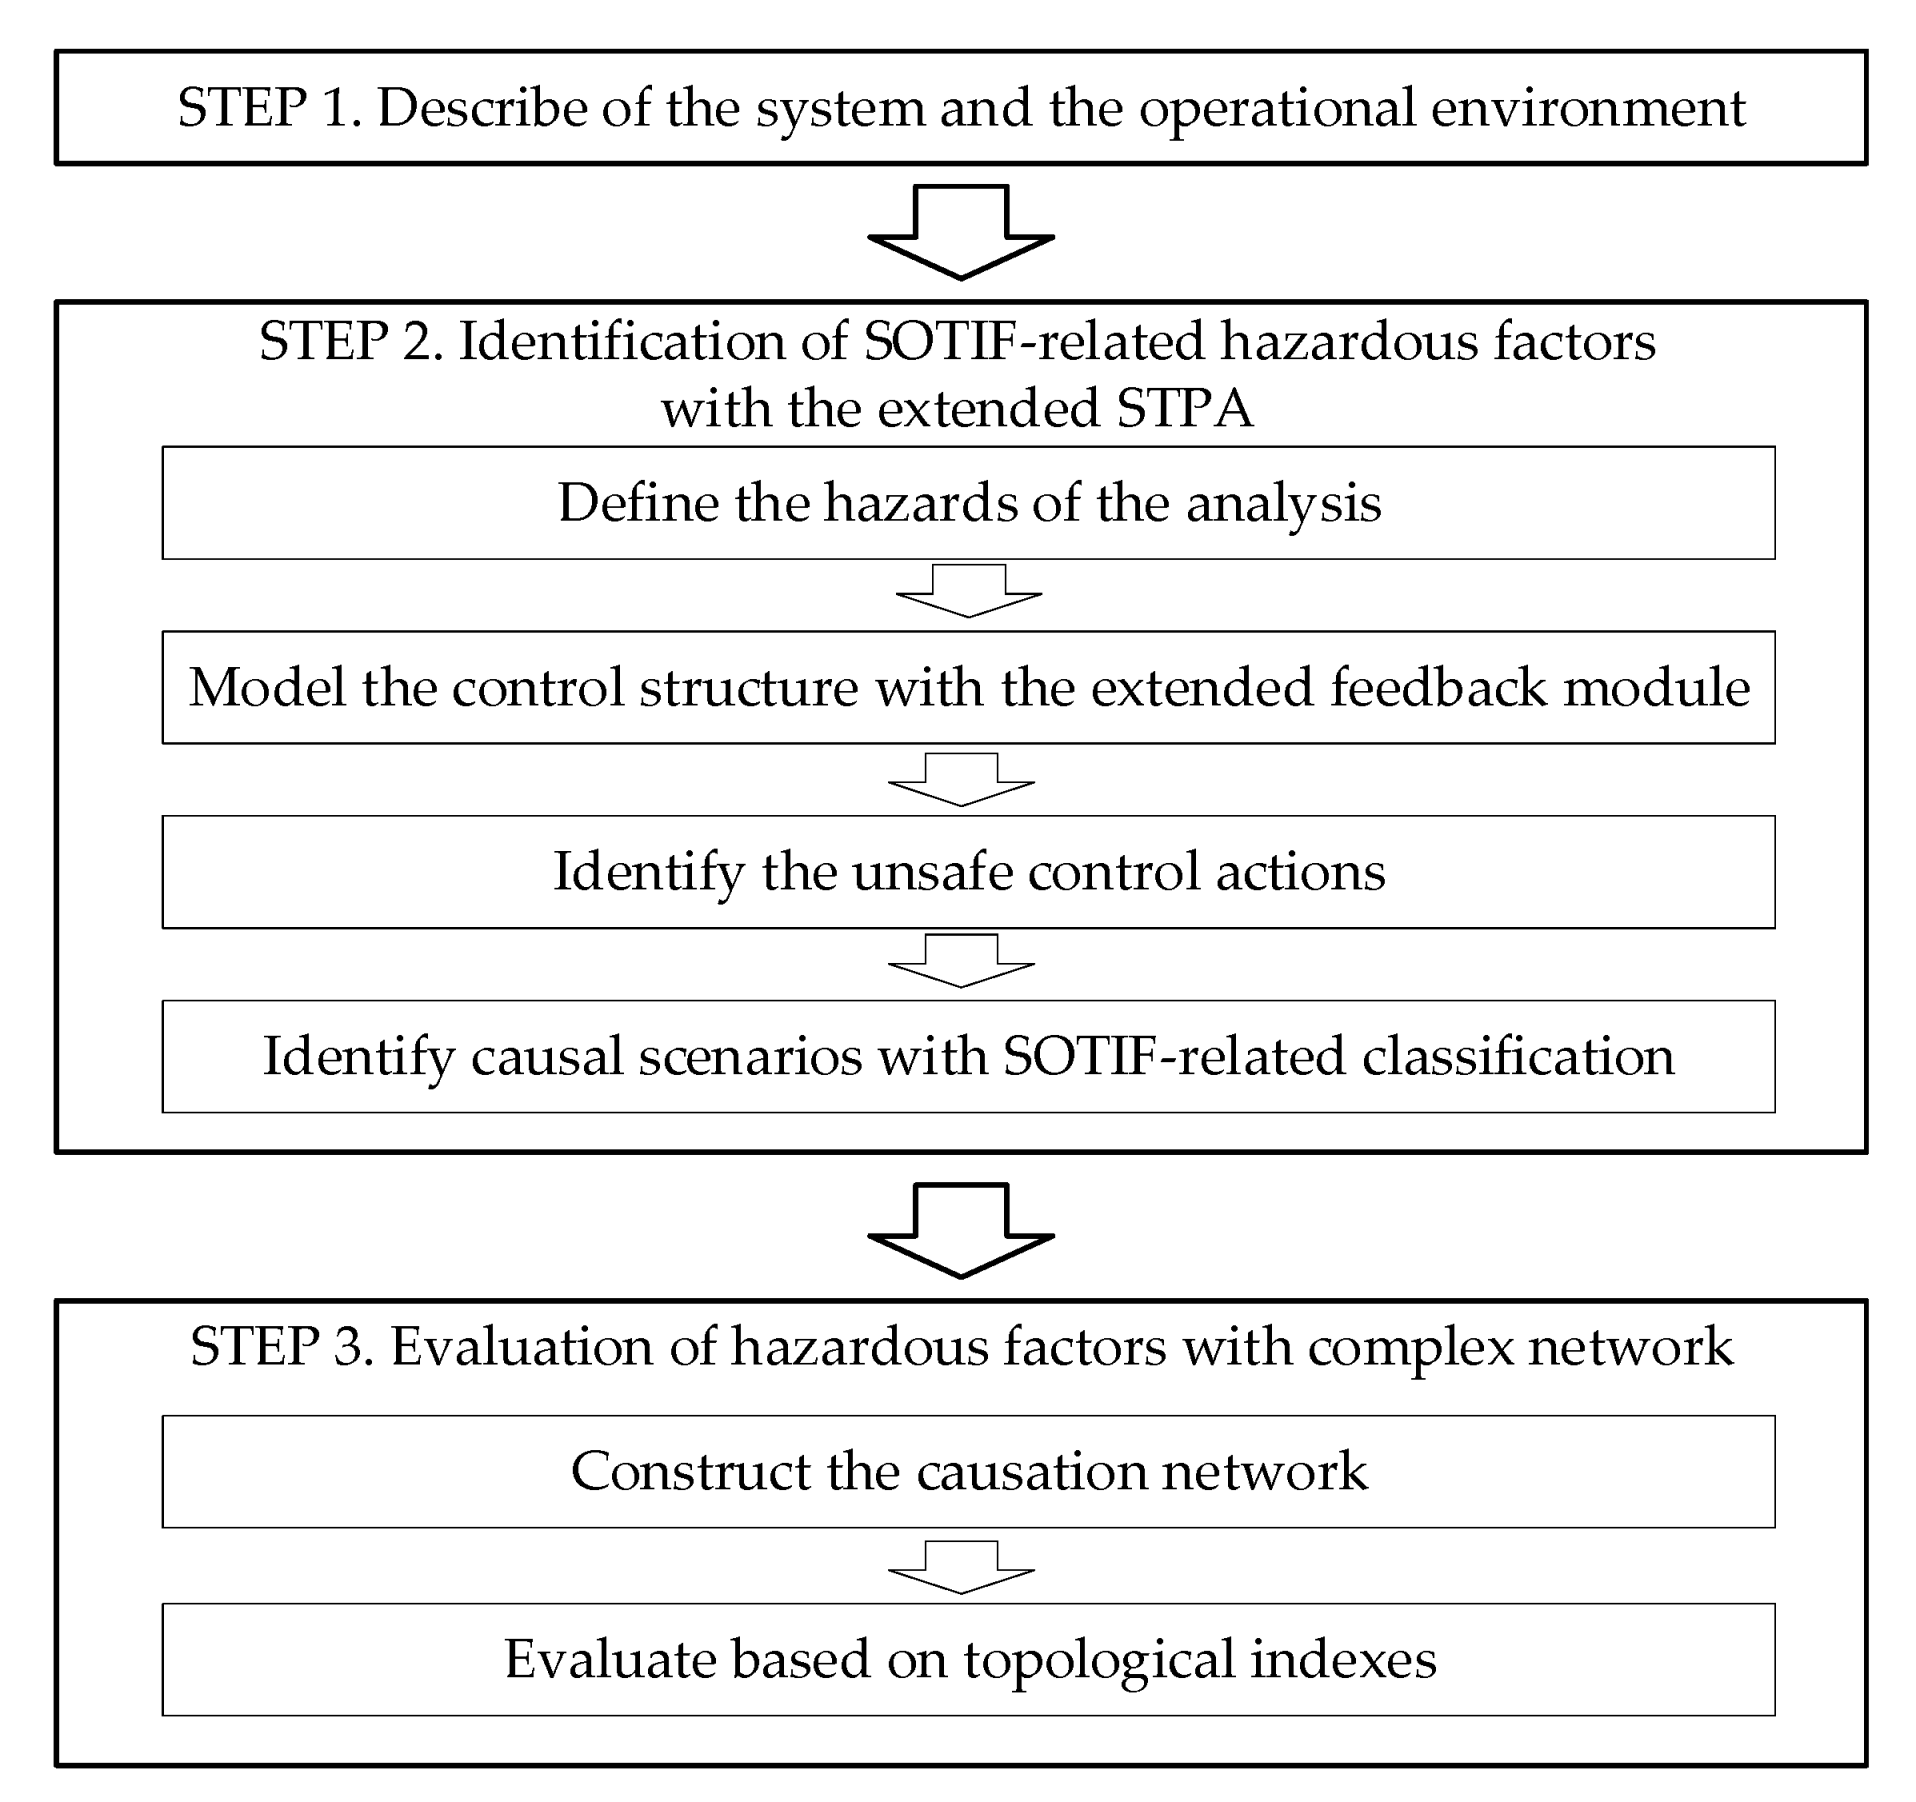
Figure 2.
The customized control structure for the SOTIF of the IRDAS.
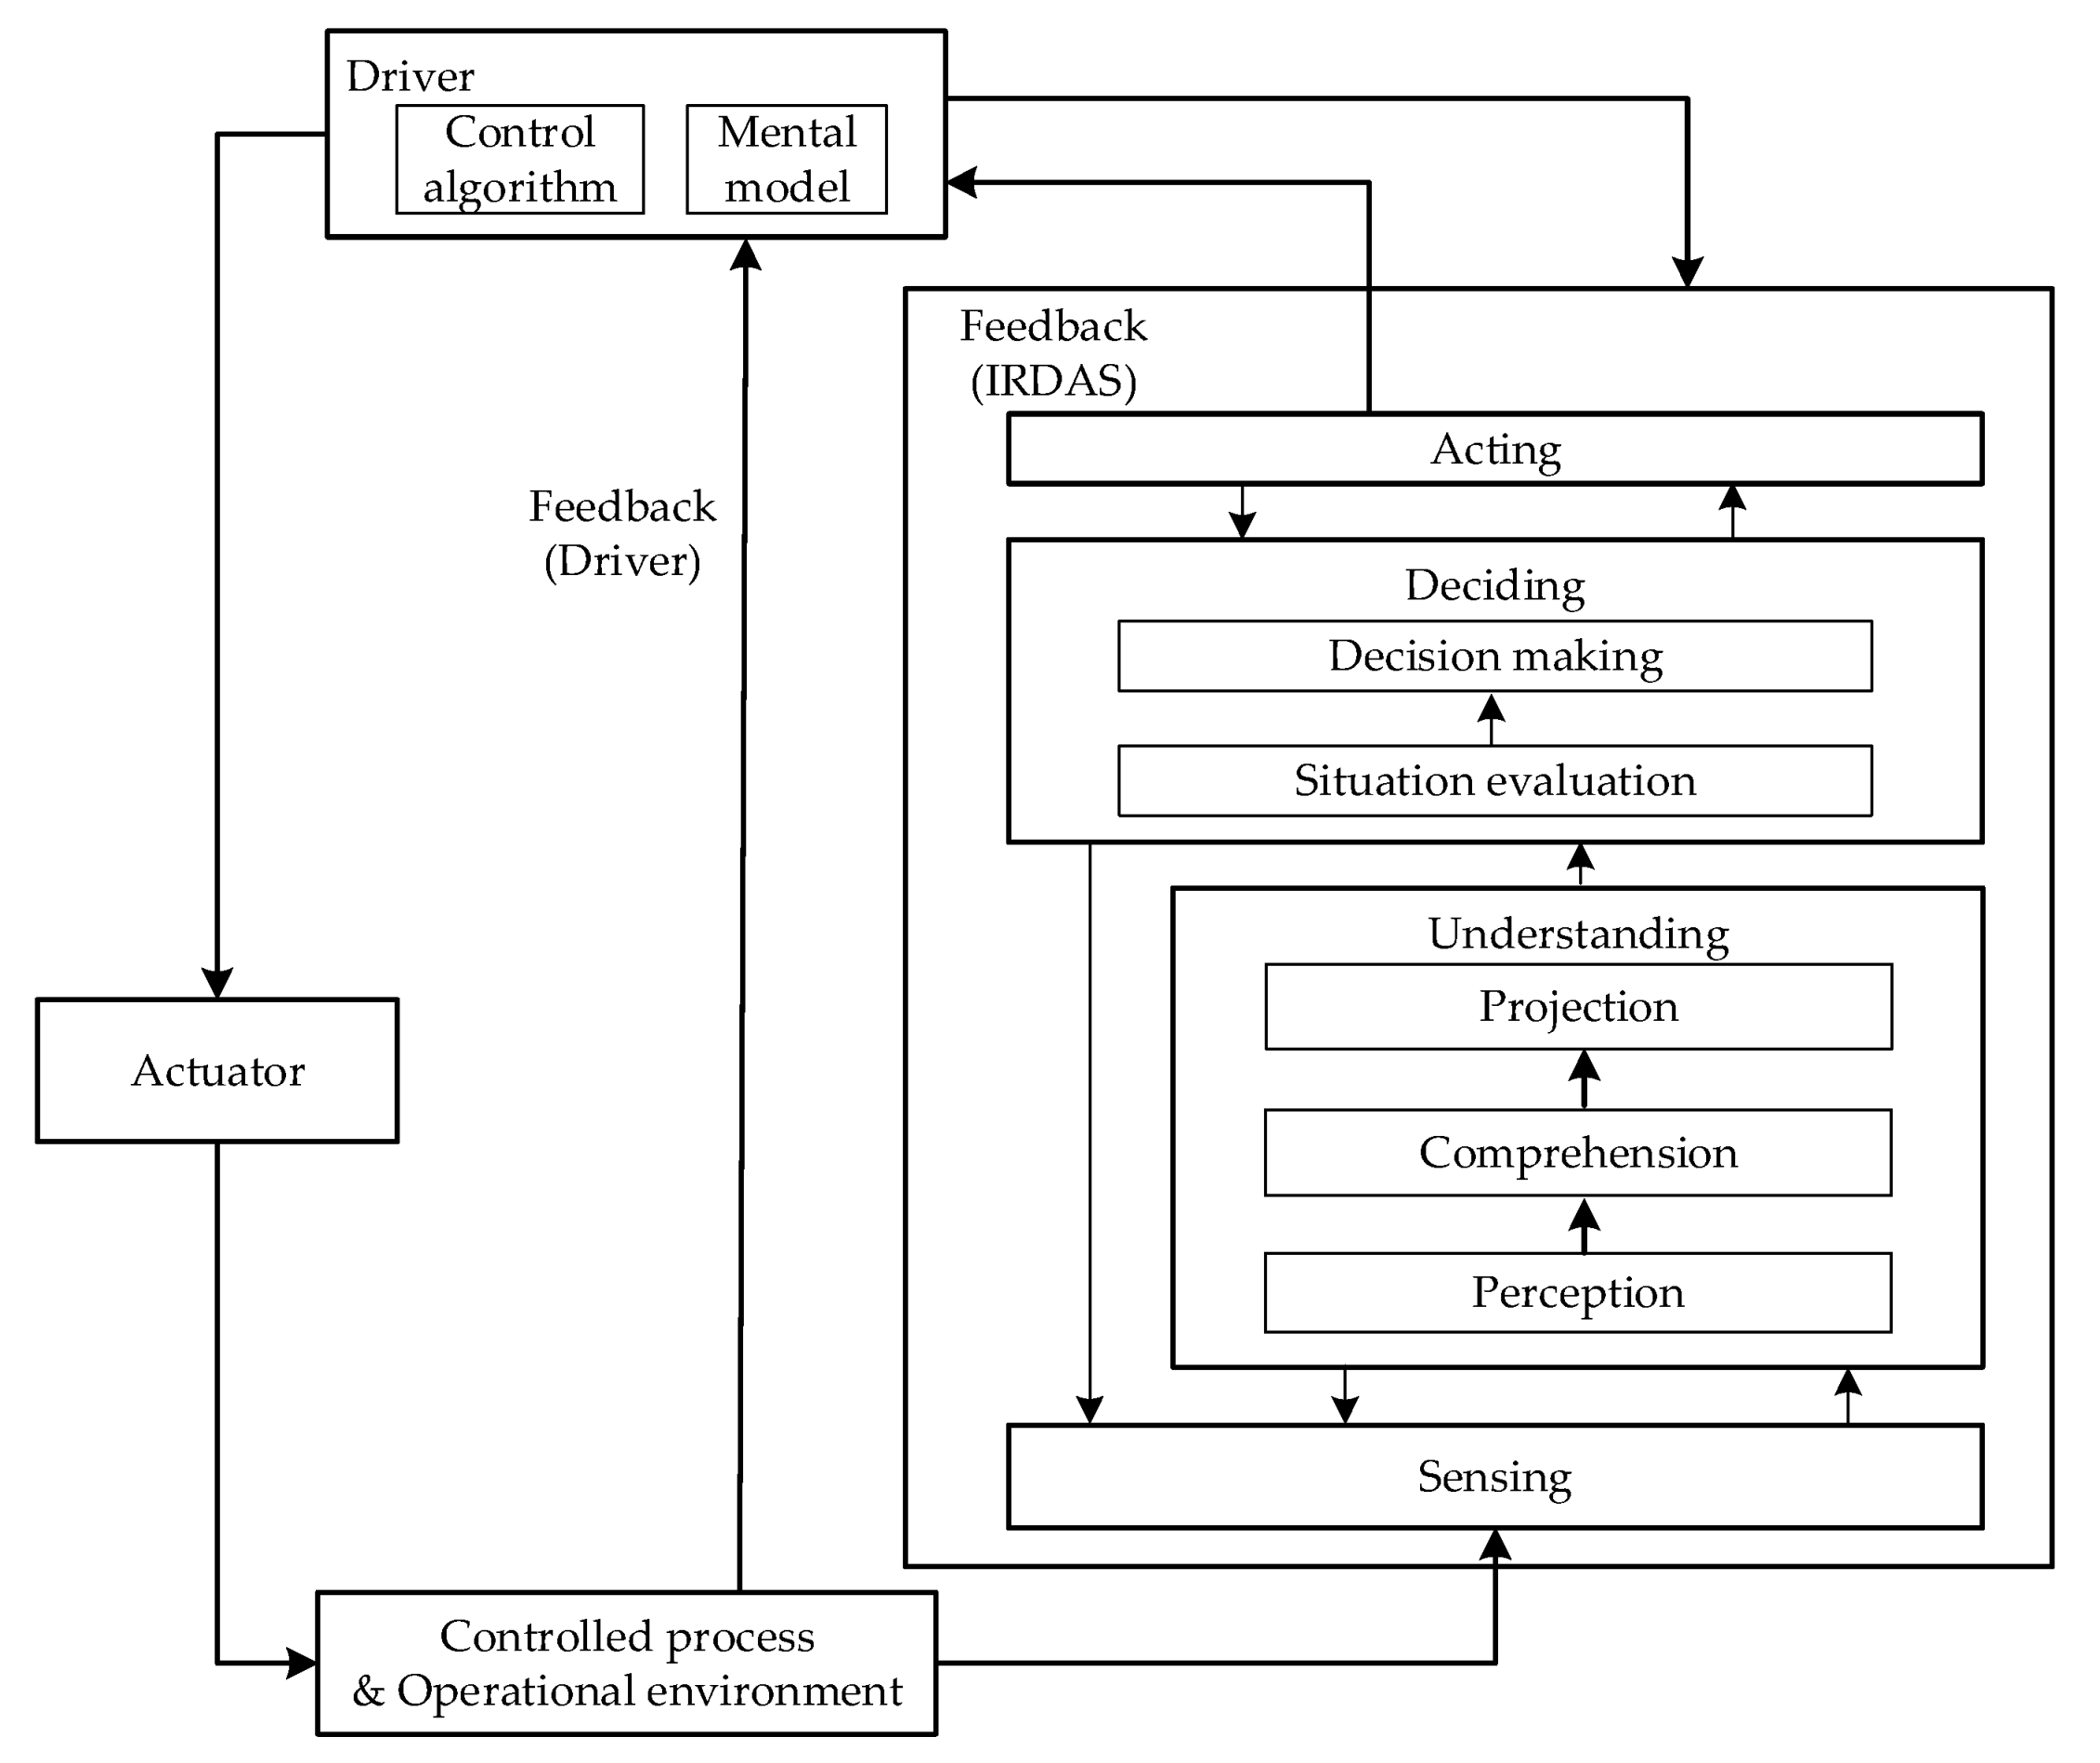
Figure 3.
A brief description of the Train Intelligent Detection System.
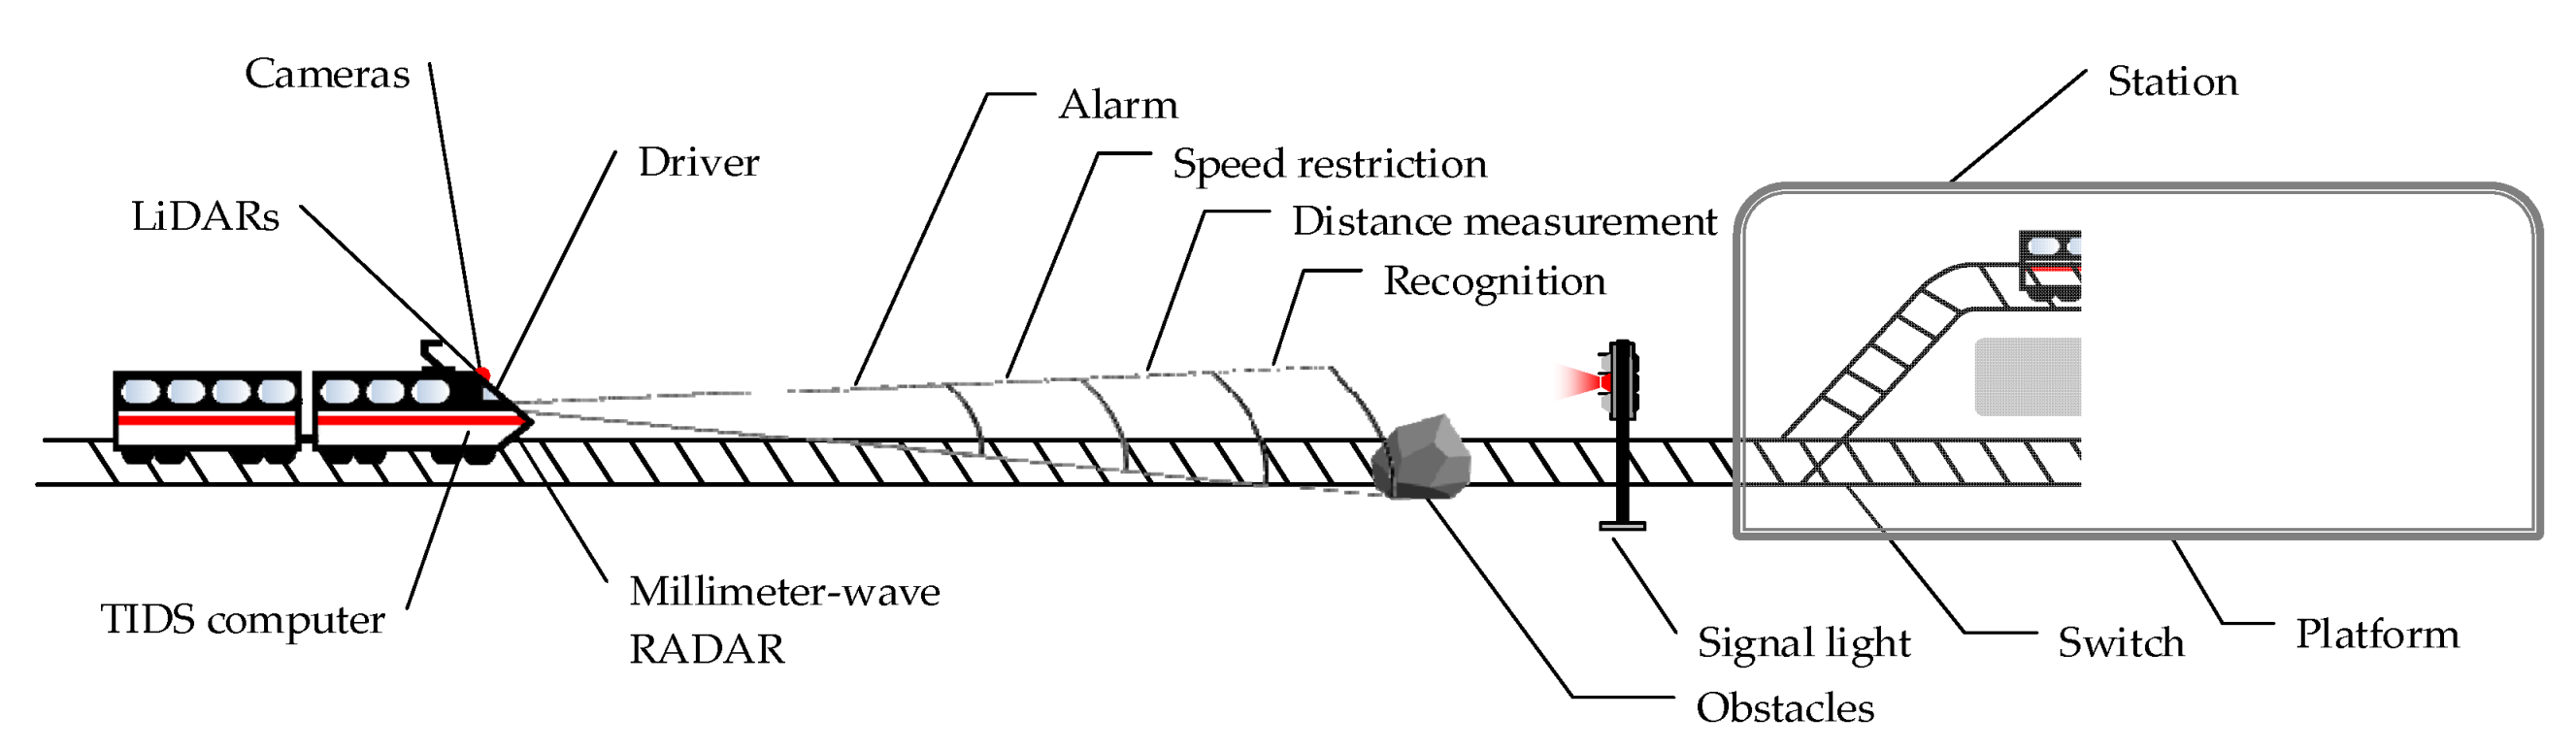
Figure 4.
The control structure of the overall driving system.
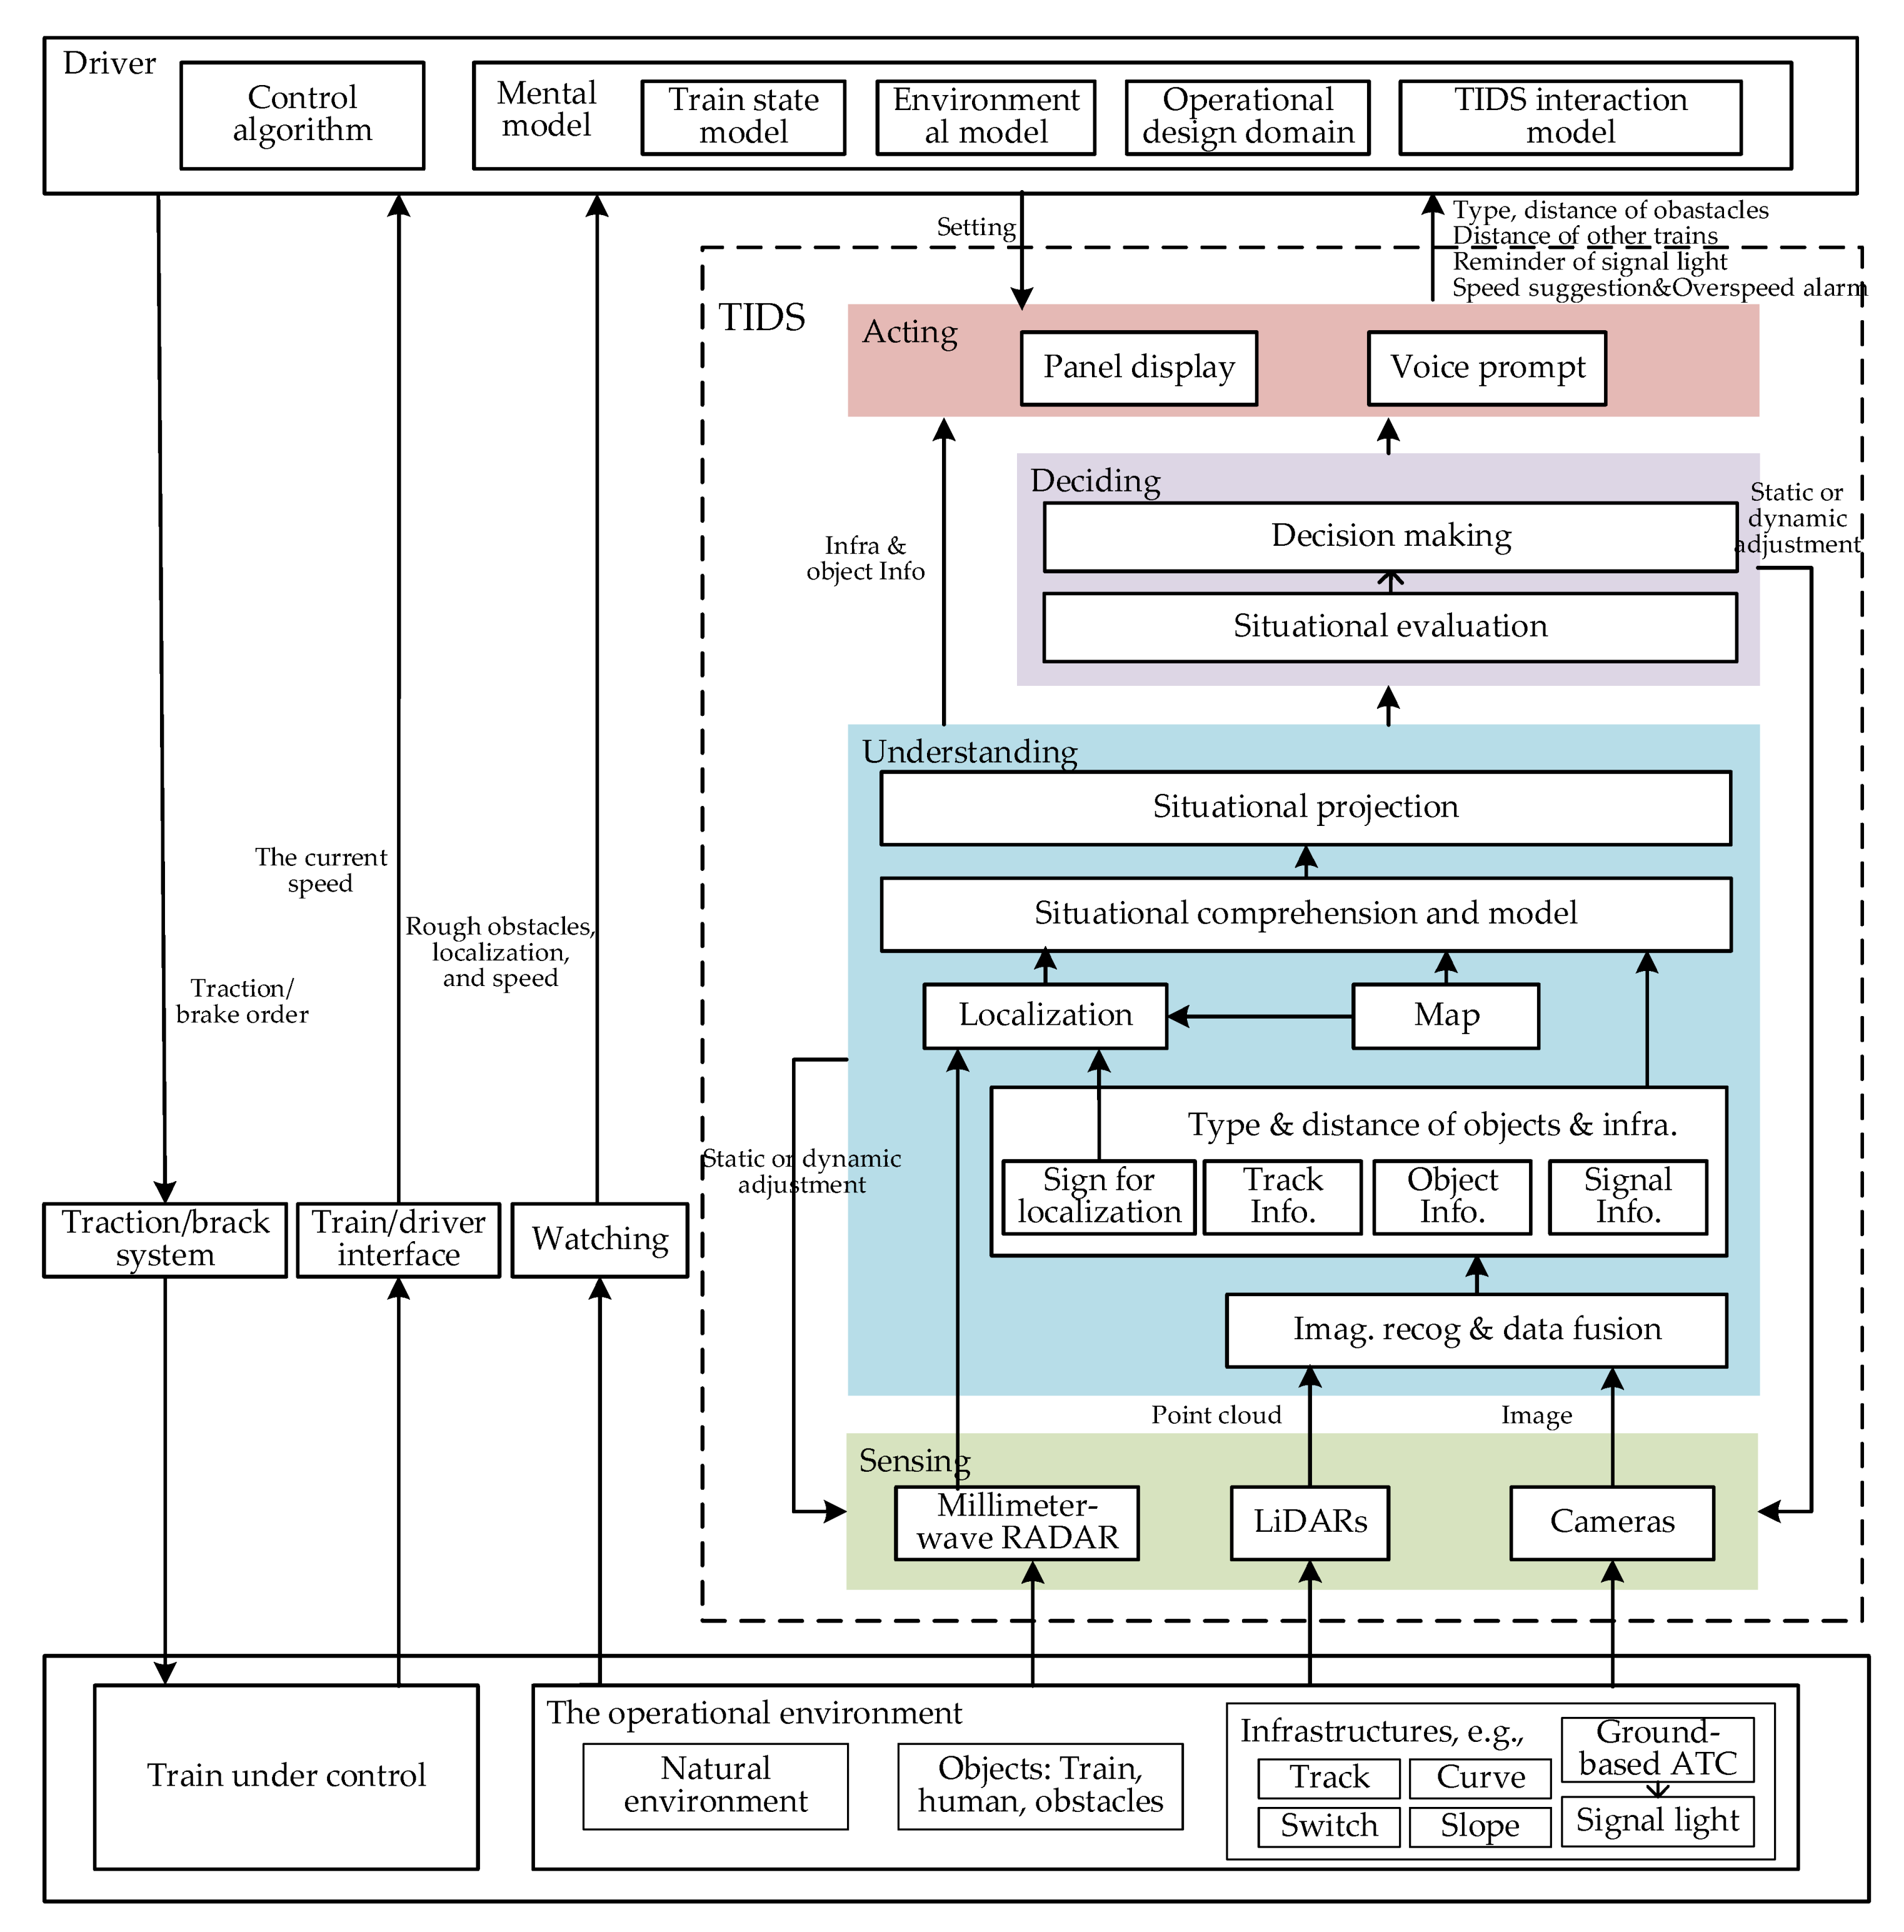
Figure 5.
The hazardous factors network of the human–IRDAS driving system.
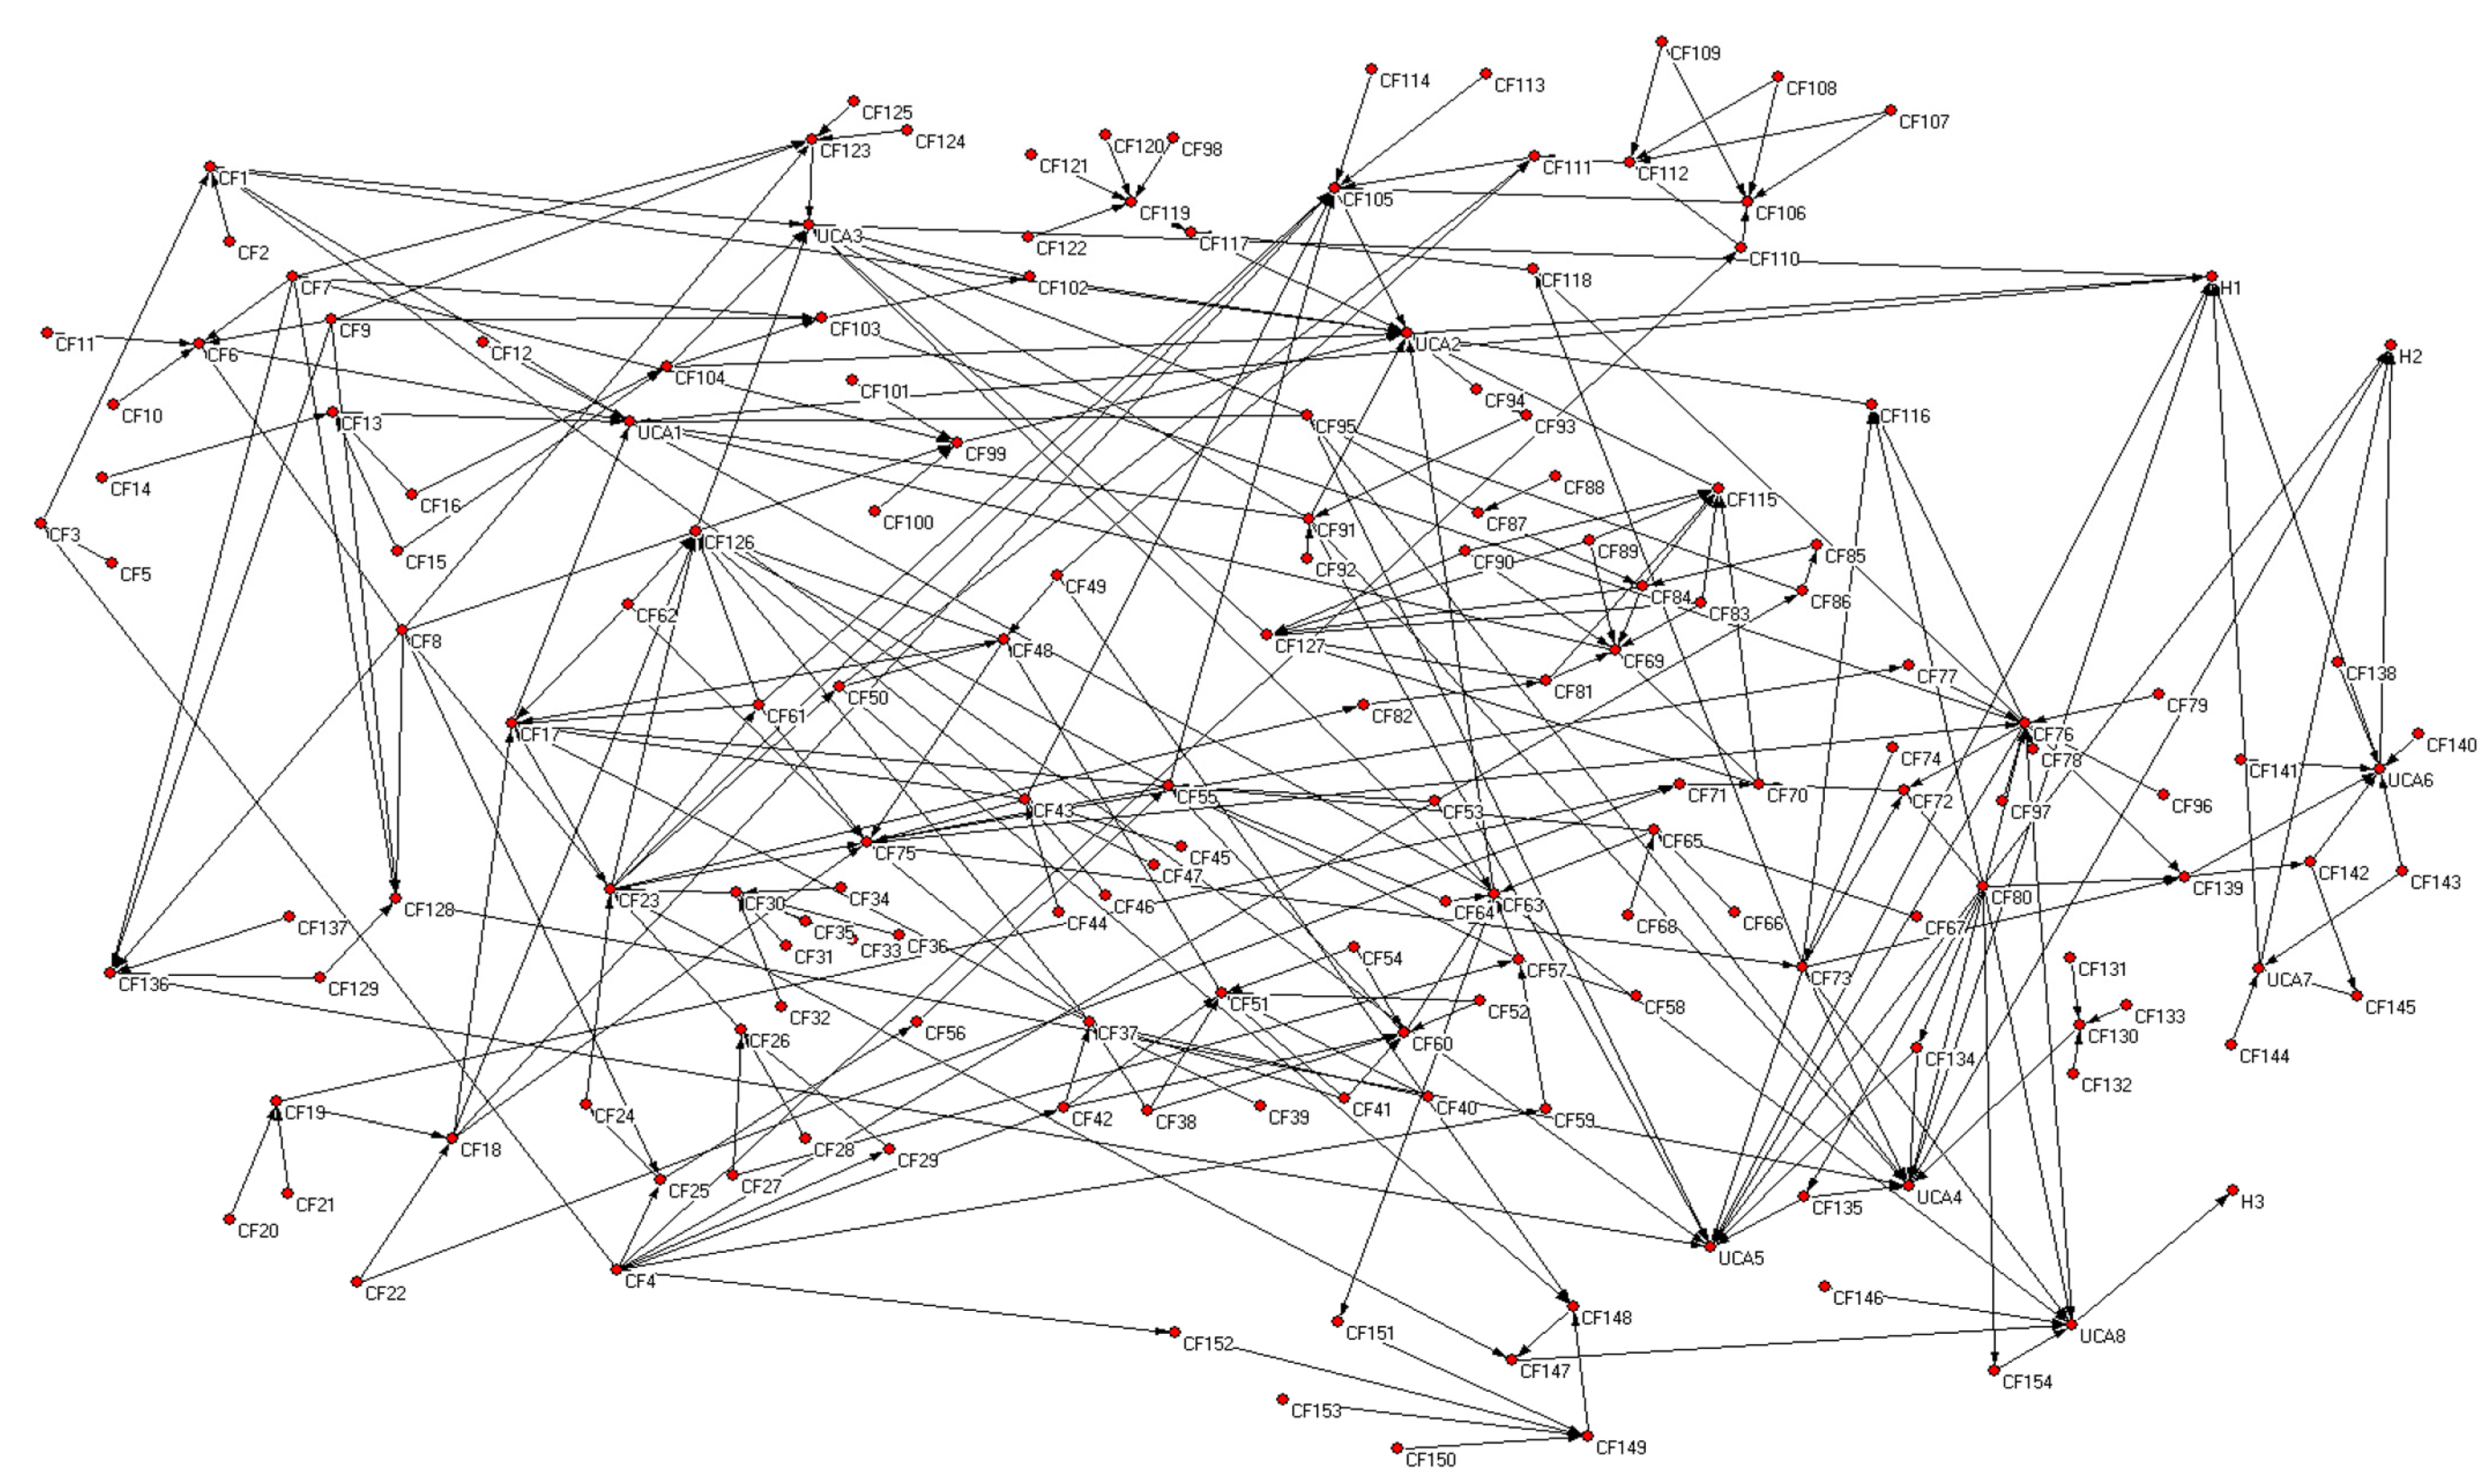
Figure 6.
Active and passive correlation of UCAs and causal factors.

Figure 7.
The betweenness value of UCAs and causal factors.
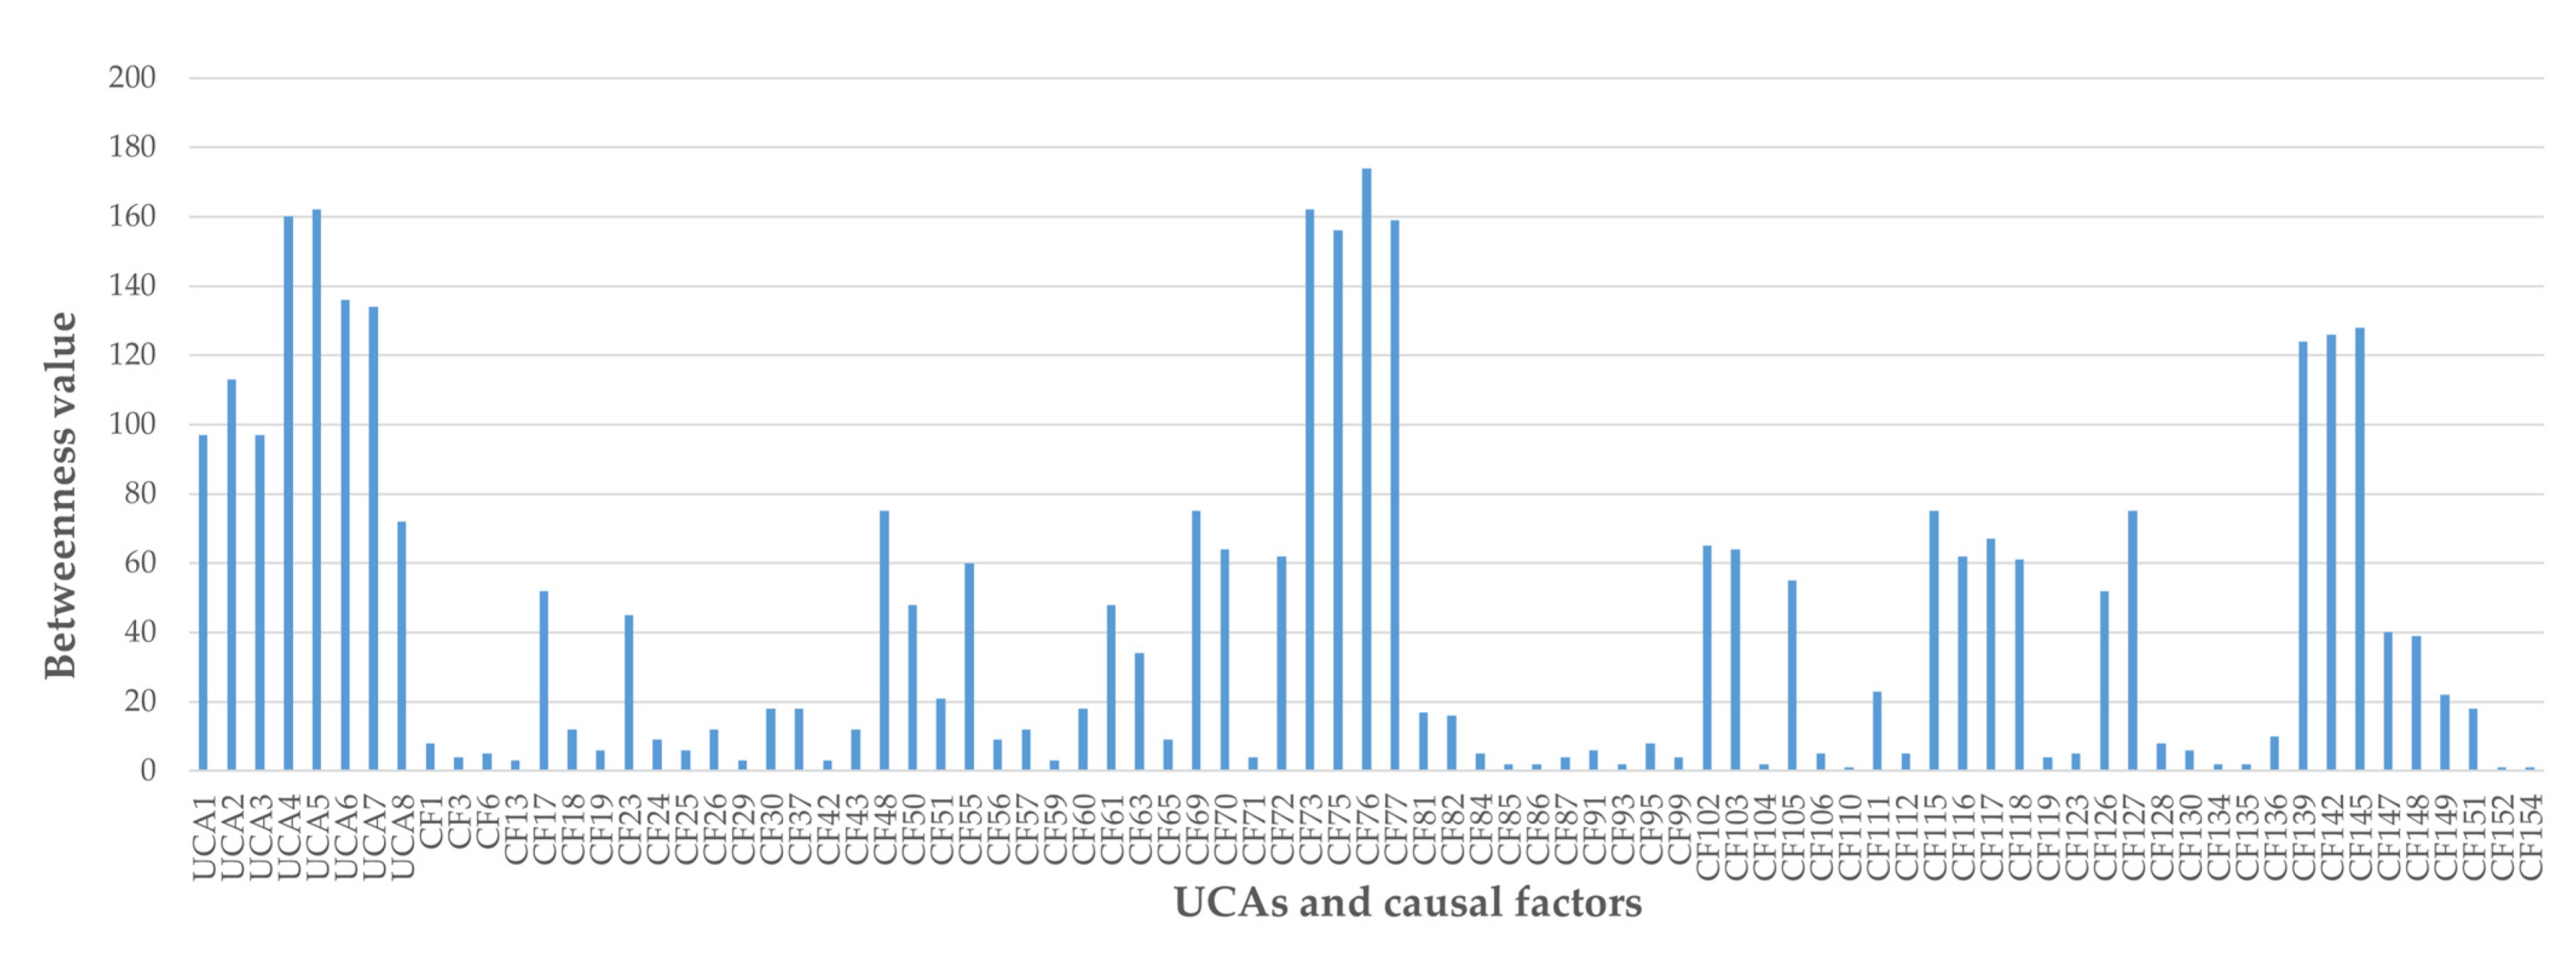
Figure 8.
The cumulative distribution of betweenness.
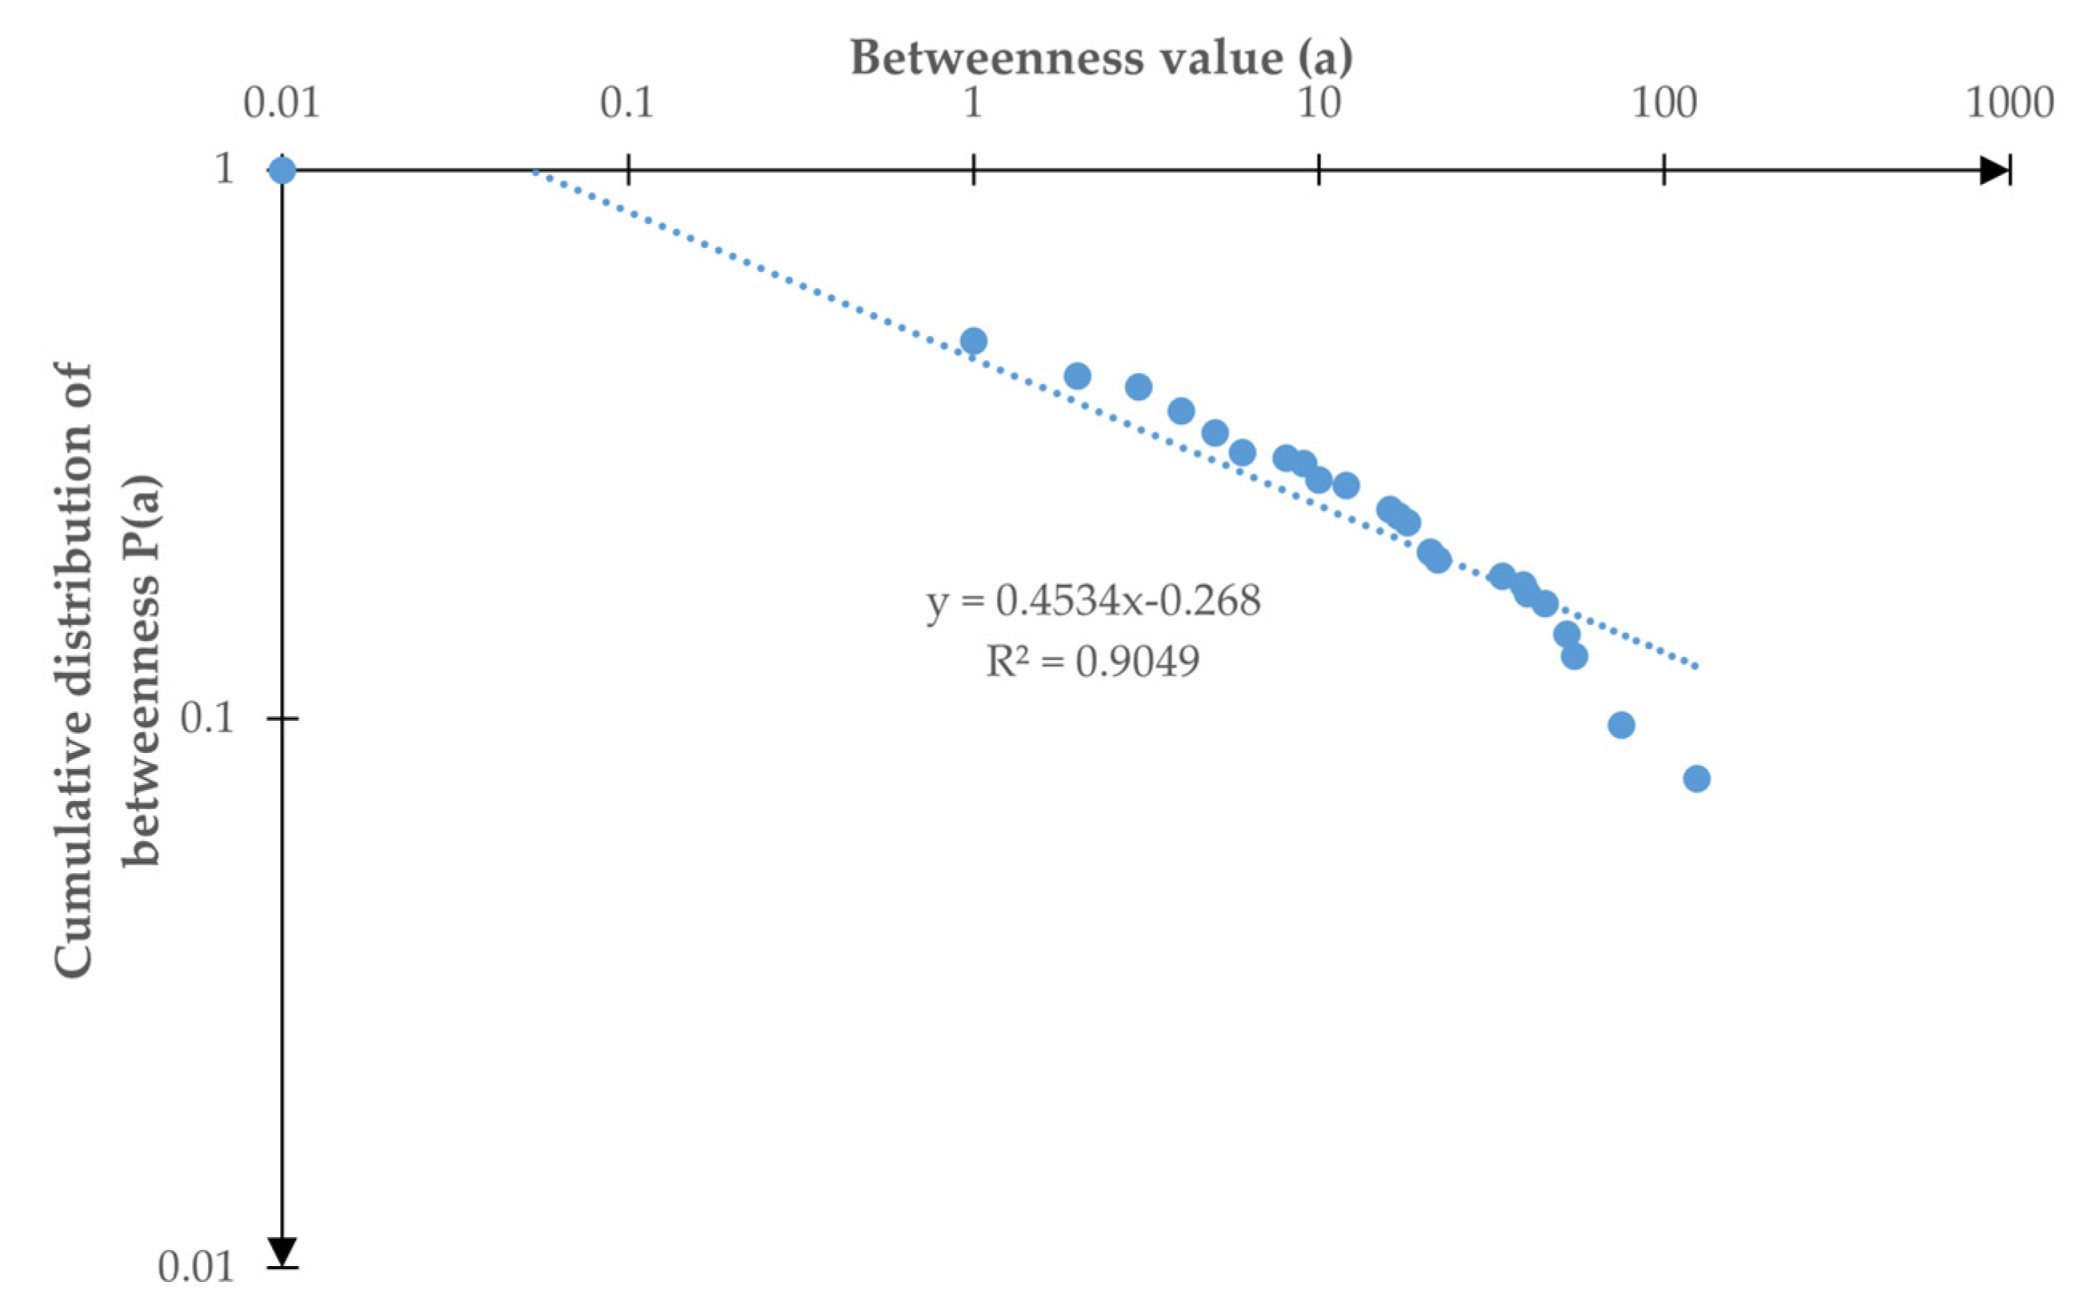
Figure 9.
The change of overall indexes when high betweenness factors are controlled.

Table 1.
Environmental variables in the operational environment of the TIDS.
| Category | Environmental Variable |
|---|---|
| Operational area | Station |
| Track switch | |
| Straight line/curve line | |
| Uphill/downhill/horizontal | |
| Underground/overground/on bridge | |
| Illumination situation | |
| Operational time | Peak/normal |
| Maintenance and test time | |
| Sign | Landmark |
| Position sign | |
| Signal light | |
| Stop sign in station | |
| Natural environment | Rain/snow/sand/fog/wind |
| Sunlight/moonlight | |
| Flood/fire/earthquake | |
| Object | Train (in front, on sidetrack) |
| Human | |
| Buffer stop | |
| Obstacle on track | |
| Obstacle in the air |
Table 2.
The identified unsafe control actions (UCAs).
| Control Action | Not Providing Causes Hazard | Providing Causes Hazard | Too Early, Too Late, Out of Order | Stopped Too Soon, Applied Too Long |
|---|---|---|---|---|
| Brake | UCA1: The driver does not provide a brake before the train breaks the speed/distance restriction regarding human/obstacle (H1). | UCA5: The driver provides brake too late to decelerate to the speed limit of the section ahead (H1 and H2). | ||
| UCA2: The driver does not provide a brake before the train breaks the speed/distance restriction regarding the train in front (H1). | ||||
| UCA3: The driver does not provide a brake before the train breaks the speed/distance restriction regarding the infrastructure in front (H1). | ||||
| UCA4: The driver does not provide a brake before the train exceeds the speed limit of the current section (H1 and H2). | ||||
| UCA8: The driver provides unnecessary emergency brake (H3). | ||||
| Use the TIDS | UCA6: The driver uses the TIDS outside the operational design domain (H1 and H2). | |||
| Turn off the TIDS | UCA7: The driver drives at the speed of assistant mode while the TIDS is off (H1 and H2). |
Table 3.
The ranking of edges of some hazardous factors based on edge importance index.
| Hazardous Factor | Type of Factor | Type of Edge to Be Ranked | Ranking | Meaning of the Edge |
|---|---|---|---|---|
| UCA4 | Terminal | Incoming | ECF76-UCA4 | The lack of localization of the TIDS makes the driver not brake before exceeding the current speed limit. |
| ECF73-UCA4 | Inaccurate or wrong localization of the TIDS makes the driver not brake before exceeding the current speed limit. | |||
| ECF91-UCA4 | The TIDS does not give an effective alarm, so the driver does not brake before exceeding the current speed limit. | |||
| ECF95-UCA4 | The performance variation of the brake system means the brake level from the driver is not enough. | |||
| ECF128-UCA4 | The driver’s lack of enough knowledge about the current speed limit leads to the driver exceeding the speed limit. | |||
| ECF130-UCA4 | The improper speed control of the driver leads to speeding. | |||
| ECF134-UCA4 | The speed limit information in the map is not up to date, and that leads to speeding. | |||
| ECF135-UCA4 | The operational environmental characteristics information of the current section in the map is not up to date, and that leads to speeding. | |||
| UCA6 | Terminal | Incoming | ECF139-UCA6 | The TIDS does not provide enough reminders when leaving the designed zone, which makes the driver still use the TIDS. |
| ECF142-UCA6 | The improper procedure of the driver when entering or leaving designed zones leads to the misuse of the TIDS. | |||
| ECF143-UCA6 | The TIDS cannot be shut off effectively and the driving is disturbed by the TIDS. | |||
| ECF138-UCA6 | The TIDS does not provide enough reminders when operating out of its design zone.. | |||
| ECF140-UCA6 | Not enough infrastructure that provides information to the driver regarding whether the TIDS is currently allowed to be used. | |||
| ECF141-UCA6 | The wrong mental model where the driver does not know exactly about the designed zone of the TIDS. | |||
| CF75 | Middle | Incoming | ECF23-CF75 | The quality of the image from the cameras is too poor which prevents localization signs from being detected. |
| ECF55-CF75 | The confliction of results from image recognition and LiDARs prevents localization signs from being detected. | |||
| ECF37-CF75 | Some characteristics of a localization sign prevent it from being detected by the TIDS. | |||
| ECF43-CF75 | The speed of image recognition is too low, which prevents localization signs from being detected in time. | |||
| ECF48-CF75 | The poor performance of image recognition algorithm based on ML prevents localization signs from being detected. | |||
| ECF18-CF75 | The localization sign is at a position out of the vision of cameras which prevents it from being detected. | |||
| ECF61-CF75 | The TIDS does not know the reduction of its detecting range, which prevents the localization sign from being detected. | |||
| ECF62-CF75 | The standard detection range of localization sign is too short, which prevents the sign from being detected. | |||
| Outgoing | ECF75-CF76 | Missing the localization sign means that the localization information of the TIDS is deficient. | ||
| ECF75-CF73 | Missing the localization sign makes localization information of the TIDS inaccurate or wrong. | |||
| ECF75-CF77 | Missing the localization sign prevents the TIDS from calibrating its localization. | |||
| CF142 | Initial | Outgoing | ECF142-UCA6 | The wrong procedure of the driver on the TIDS when entering/leaving designed zone leads to the use of the TIDS outside of the designed zone. |
| ECF142-CF145 | The wrong procedure of the driver on the TIDS when entering/leaving designed zone leads to the driver’s unawareness of the on/off status of the TIDS. |
Publisher’s Note: MDPI stays neutral with regard to jurisdictional claims in published maps and institutional affiliations. |
© 2021 by the authors. Licensee MDPI, Basel, Switzerland. This article is an open access article distributed under the terms and conditions of the Creative Commons Attribution (CC BY) license (https://creativecommons.org/licenses/by/4.0/).
Share and Cite
MDPI and ACS Style
Zhang, S.; Tang, T.; Liu, J. A Hazard Analysis Approach for the SOTIF in Intelligent Railway Driving Assistance Systems Using STPA and Complex Network. Appl. Sci. 2021, 11, 7714. https://doi.org/10.3390/app11167714
AMA Style
Zhang S, Tang T, Liu J. A Hazard Analysis Approach for the SOTIF in Intelligent Railway Driving Assistance Systems Using STPA and Complex Network. Applied Sciences. 2021; 11(16):7714. https://doi.org/10.3390/app11167714
Chicago/Turabian StyleZhang, Shijie, Tao Tang, and Jintao Liu. 2021. "A Hazard Analysis Approach for the SOTIF in Intelligent Railway Driving Assistance Systems Using STPA and Complex Network" Applied Sciences 11, no. 16: 7714. https://doi.org/10.3390/app11167714
Note that from the first issue of 2016, this journal uses article numbers instead of page numbers. See further details here.