
Terahertz Raman Measurements Using a Spatial Heterodyne Raman Spectrometer
by
Yuqi Sun
1,2, 
Xiaotian Li
1,2,*,
Jiri Galantu
1,
Qihang Chu
1,2,
Jun Chen
1,2,
Zhongkai Liu
1,2,
Xiaotao Mi
1,
Xuefeng Yao
1 and
Pan Li
1,2 1
Changchun Institute of Optics, Fine Mechanics and Physics, Chinese Academy of Sciences, Changchun 130033, China
2
University of Chinese Academy of Sciences, Beijing 101408, China
*
Author to whom correspondence should be addressed.
Appl. Sci. 2021, 11(17), 8094; https://doi.org/10.3390/app11178094
Submission received: 21 July 2021
/
Revised: 16 August 2021
/
Accepted: 27 August 2021
/
Published: 31 August 2021
(This article belongs to the Special Issue State-of-the-Art Laser Measurement Technologies)
Abstract
:We propose a method of measuring the terahertz (THz) Raman spectra of a material. As Raman spectroscopy is a measurement of the relative frequency spectrum relative to the frequency of the excitation source, sometimes it is not necessary to use an expensive THz source and THz detector. Instead, an ultraviolet, visible, or infrared excitation source and corresponding detector can be used. A combination of prisms and gratings is used to widen the field of view at high resolution. The resolution of the system is 4.945 cm−1 (0.149 THz), and the spectral range is 2531.84 cm−1 (75.963 THz). We measured the THz Raman spectra of solid powder, aqueous solutions, and mixtures, and studied the effects of environment, container material, and time of measurement on the spectra. The results show that the system is not significantly affected by interference from the water environment and has good stability and repeatability. This method can be applied in many fields such as material detection and environmental protection.
1. Introduction
Terahertz (THz) waves are electromagnetic waves with frequencies from 0.1 to 10 THz, wavelengths from 30 to 3000 μm, and wavenumbers from 3.3 to 330 cm−1. They are located between the microwave and infrared ranges. A THz spectrum contains a wealth of information such as molecular interactions [1], macromolecular vibration [2], ion vibrational transitions [3], plasmon resonance [4,5], and polarization rotation of ferromagnetic semiconductors [6]. Due to these characteristics, THz spectroscopy has potential application in fields such as biomedicine [7,8,9], astronomy [10], safety [11], and agriculture [12]. Xiaomei Shi et al. used the resonant cavity mode to detect the THz spectrum of α-lactose. This replaced the previous direct detection mode, and the sensitivity was more than 400 times higher than that of the conventional mode. However, the cavity mode transmission caused great material loss and led to reduction of the signal-to-noise ratio (SNR) [13]. Sayuri Yamaguchi et al. used THz time-domain spectroscopy to detect rat brain tumors, but both the THz source and detector had high requirements [14]. In addition, water has strong absorption in the THz range [15], which makes current technology unable to detect THz spectra of aqueous solutions. This greatly limits the application of THz spectroscopy.
To solve the above problems, Raman spectroscopy can be used to measure THz spectra of an object. This can not only overcome the difficulties of detecting THz spectra of aqueous solutions, but also breaks free of the strict constraints on the light source and detector during THz measurement. Considering that the intensity of a Raman signal is ten orders of magnitude lower than that of Rayleigh scattering, improving the intensity of the Raman signal and attenuating the intensity of Rayleigh scattering are the key points of instrument design. C Julien et al. used three cascading monochromators to detect THz Raman spectra [16]. However, the throughput of this method is low and the structure is complex. With further technological development, THz Raman detection systems now use Bragg notch filters (BNFs) to filter low-wavenumber signals. Christophe Moser et al. [17] and Xinru Guan et al. [18] have used a combination of BNFs and a dispersive Raman spectrometer to realize THz Raman measurement. However, the incidence slit of a dispersive Raman spectrometer reduces the throughput and the SNR.
In this paper, we propose a THz detection system using a spatial heterodyne Raman spectrometer structure that has no incident slit, no moving parts, high throughput, good stability, and strong anti-interference ability. We used 532 nm green laser as the light source. In addition, the zero-space frequency of spatial heterodyne Raman spectrometer is not zero, and the detector pixel stores the information of each measured wavelength, which improves the spectral resolution. The system uses BNFs to filter THz Raman signals. The throughput is increased by combining prisms and gratings to widen the field of view. THz Raman spectra were measured for sulfur, organic acids, nucleobases, and other solid samples. The SNR was calculated for sulfur with different integration times and laser powers. The spectra of samples in different containers were measured and analyzed. The same laser power and integration time were used at different times to measure the same sample to verify the stability and repeatability of the system. The aqueous solutions were measured under different concentrations. In addition, measurements were done for solid and liquid mixtures.
2. Theory
2.1. Basic Theory
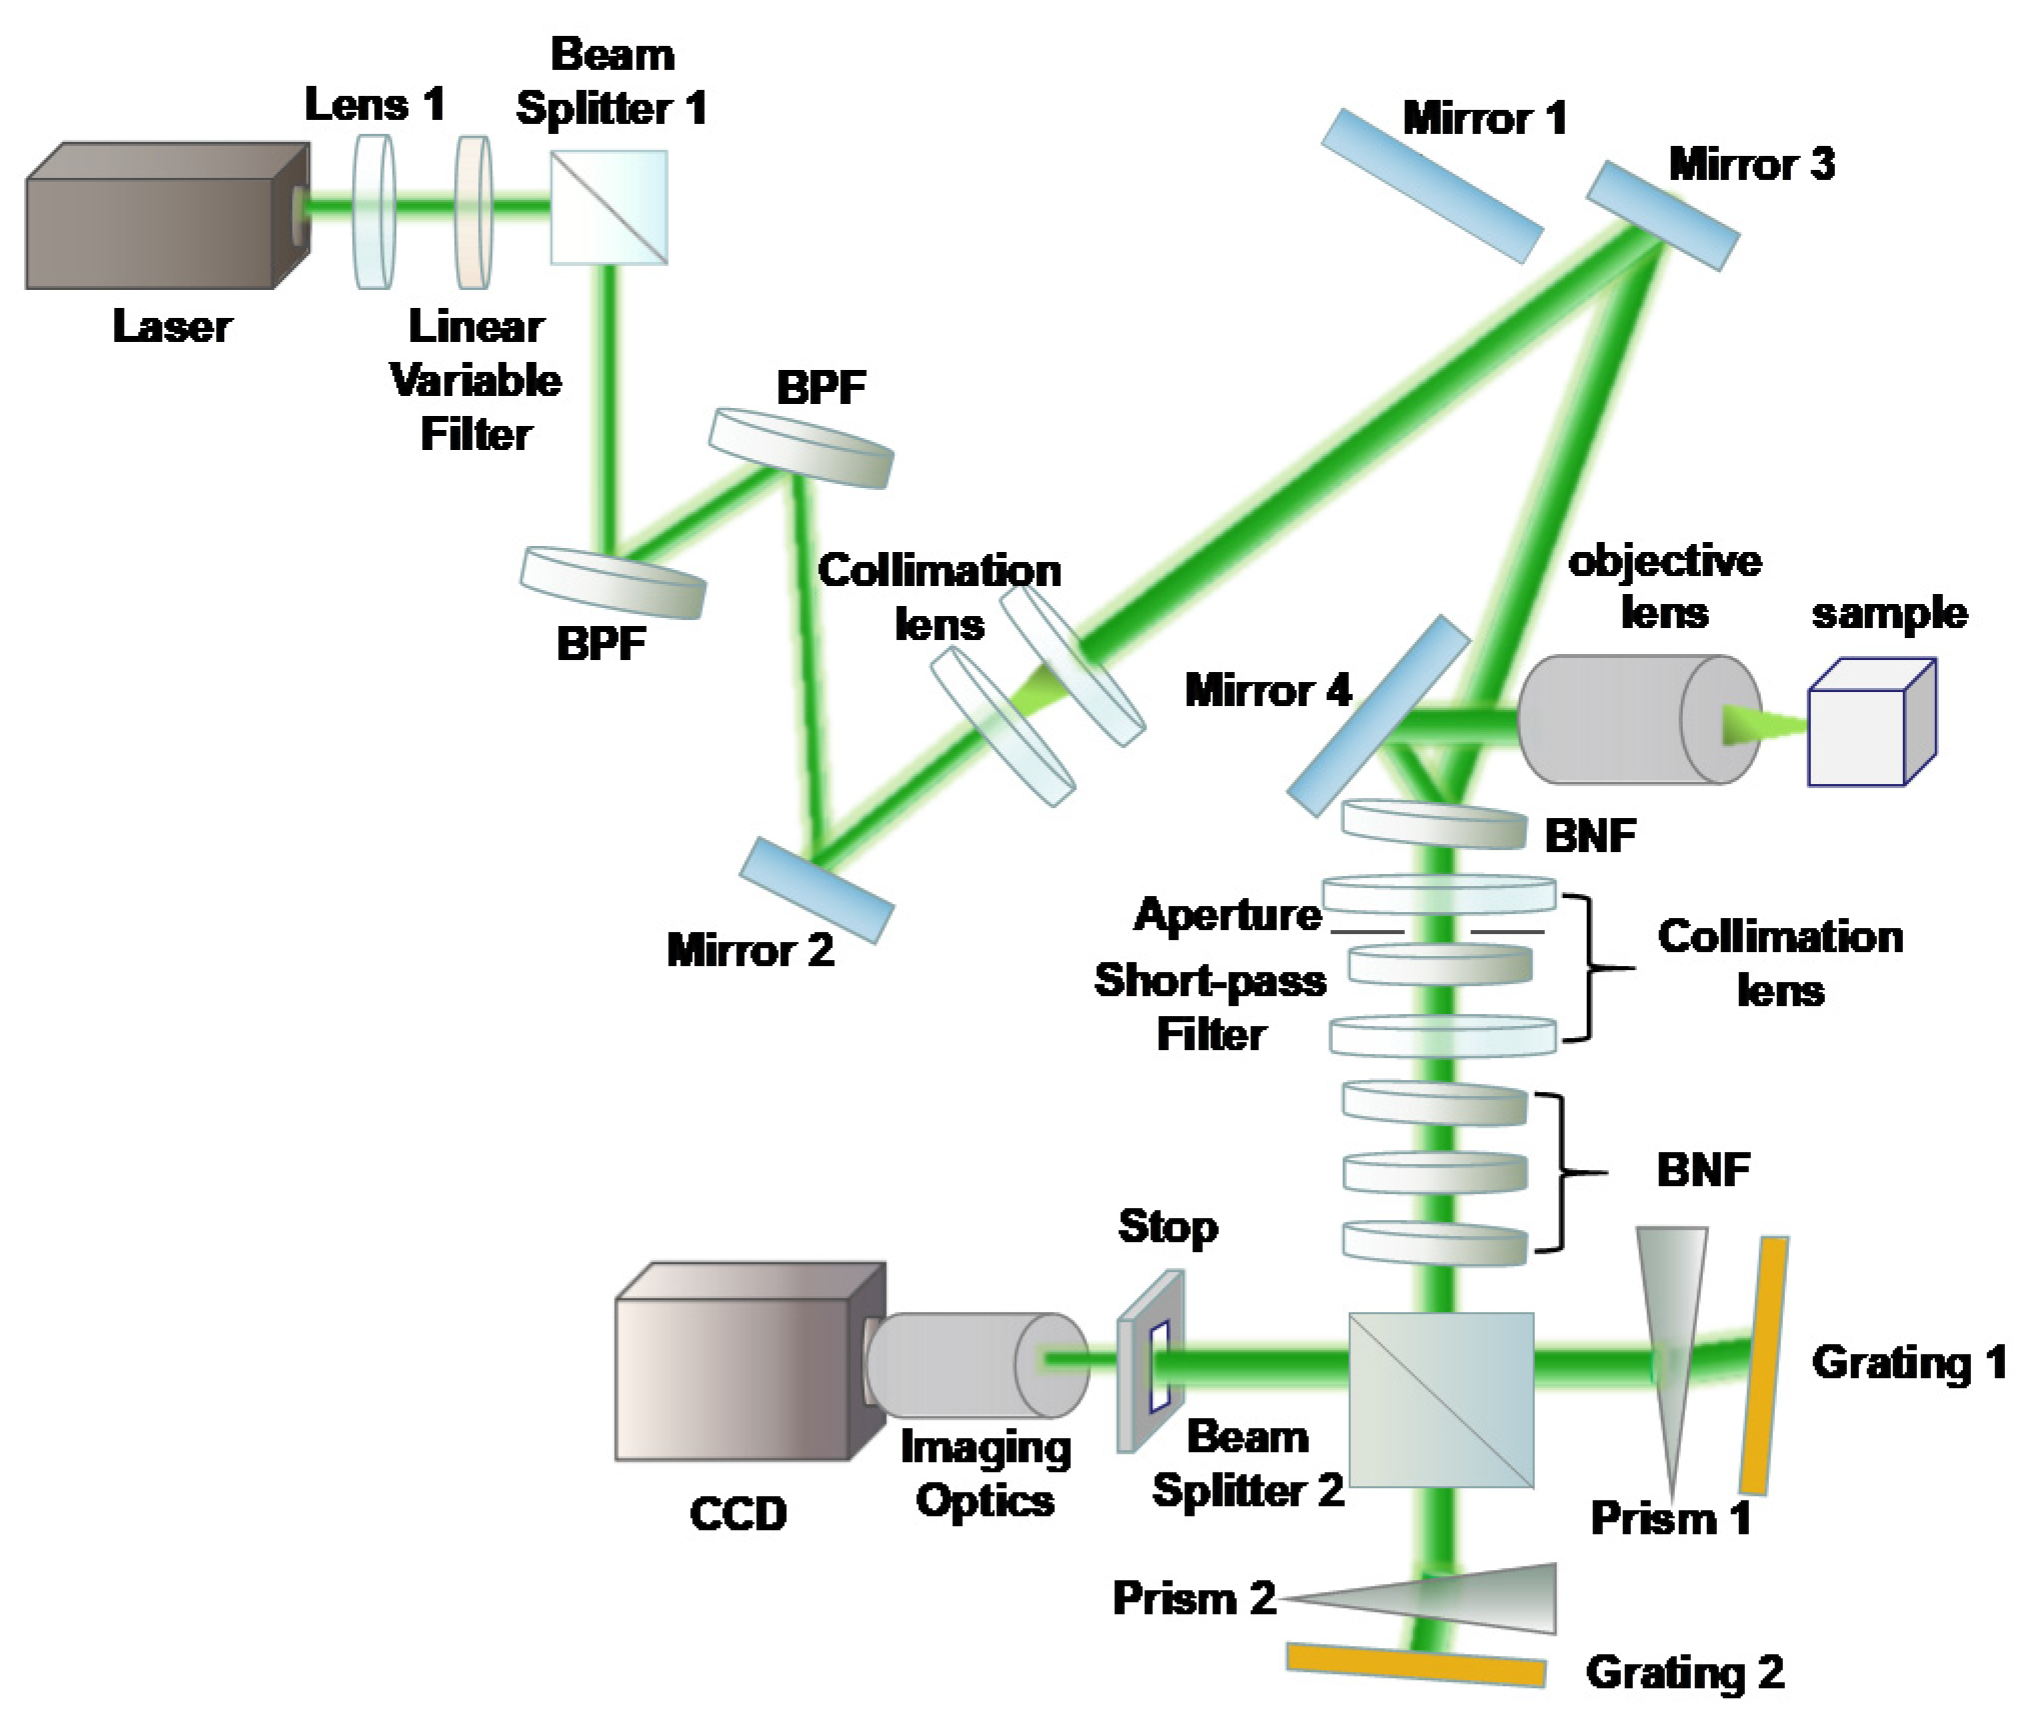
The spatial heterodyne THz Raman spectrometer is depicted in Figure 1. A 532 nm laser beam passes through lens 1 and is linearly varied from 0 to 140 mW using a linear variable filter, and is then incident into beam splitter 1. It is divided into parts with a ratio of 1:9. One part (10%) is used for the dimming path. The other part (90%) is incident to the bandpass filters (BPFs) for laser purification; after the noise is removed, this part is reflected to the collimating lens through mirror 2 and then reflected by mirror 3 and incident to the BNF. It is then reflected from the filter to mirror 4, and then reflected to the objective lens and focused to the sample through the objective lens. The Raman signal generated by the laser beam incident on the sample is reflected to the BNF by mirror 4, and then incident to the BNFs through the collimating lens and the filter. A pinhole aperture is inserted into the collimating lens to remove stray light. To achieve maximum inhibition of Rayleigh light, the BNFs are inclined at an angle to the optical axis and face opposite to each other to avoid interference between them. After selective filtering, the signal is incident into beam splitter 2 and is divided into two equal beams. The two beams are incident into prism 1 (2) on their interference arms at the minimum deviation angle θP and then incident into grating 1 (2).
The refractive index of the prism is n, and α is the apex angle of the prism. The gratings are tilted at a fixed angle (the Littrow angle) to the optical axis so that light at the Littrow wavelength exits the interferometer parallel to the optical axis. The interference between the two beams results in wavenumber-dependent shearing. Light from the beam splitter passes through the aperture and is incident to the imaging optics attached to the detector, resulting in Fizeau-type interference fringes that are received by the detector. The grating equations of the two interference arms are:
where σ is the wavenumber of the incident light, θL is the Littrow angle of the grating, m is the diffraction order, G1,2 are the groove densities of the gratings, and 2γ is the angle between the two output wavelengths (2γ = 0 for the Littrow wavelength). The Littrow wavenumber is σ0. In the first-order approximation, the angle between two output wavefronts of any wavelength is derived as:
The spatial frequency of the interference is:
The Fourier relation between the interferogram and the incident spectrum is:
The spectrum of the reconstructed image can be obtained through an inverse Fourier transform. The spectral resolution of the system depends on the parameter [19] of the grating on the interference arm:
where W is the grating width.
According to the sampling theorem, the spectral range of the system depends on the number of pixels of the detector:
The relationship between spectral resolving power R and maximum field of view Ωmax is:
Therefore, to achieve high resolution and high throughput at the same time, we place a prism with a certain apex angle on the interference arm. To widen the field of view, it is necessary to reduce the quadratic dependence of the phase difference on the incident angle, so that the quadratic coefficient of the incident angle is zero [20]; that is:
According to the above equations, we set the Littrow angle to 2.324°; when the refractive index is 1.527, the apex angle of the prism is 2.665°.
For the spatial heterodyne THz Raman spectrometer system with the widened field of view, the SNR can be calculated as follows:
where η is the optical efficiency, A is the effective area of the system, and T is the total integration time.
2.2. Calibration Theory
In practice, the system error leads to a frequency shift and broadening of spectral lines, resulting in errors in spectral range and resolution. Wavelength calibration can obtain the actual spectral range and resolution. Generally, the wavelength can be calibrated using a light source with a known spectral range. In this study, a mercury lamp light source was used to calibrate the wavelength of the optical system. After measurement of the fringe frequencies of two known emission lines, the Littrow wavelength of the system can be obtained through the following formula:
where λL is the Littrow wavelength, λ1 and λ2 are the known wavelengths of the calibration light source, and f1 and f2 are the fringe frequencies of the known emission lines. According to Equation (2), the Littrow angle of the two diffraction gratings on the interference arms can be deduced:
The spectral resolution is:
The spectral range of the instrument can be obtained from Equation (7).
3. Materials and Methods
3.1. Breadboard
The spatial heterodyne THz Raman spectrometer system consisted of an excitation system, interference spectrometer, and imaging system. The experimental platform is shown in Figure 2, and the main device parameters are shown in Table 1. A 532 nm laser (MSL-FN-532, Changchun New Industries Optoelectronics Tech. Co. Jilin, Changchun, China) was used as the excitation light source. A linear variable filter was used to adjust the laser power from 0 to 140 mW. Beam splitter 1 was used to split the beam, and then the BPFs were used to purify the beam. Then, mirror 2 reflected the beam to the collimating lens group. The sample was placed at the focal point of the objective lens, and the Raman scattering light was excited by the incident laser. Scattering light higher than 550 nm was reflected by a 550 nm short-pass filter (400–543 nm, Thorlab. Shanghai, China), and scattering light lower than 500 nm was reflected by a 500 nm long-pass filter (508–2150 nm, Thorlab). The Rayleigh scattering light was filtered by 532 nm BNFs (Optigrade). The filtered Raman scattering light entered the interference system, and was divided into two coherent beams by beam splitter 2 and incident on the respective prisms and gratings of the two interference arms. After diffraction, the light was returned to beam splitter 2 and combined. The interference fringes were imaged on the target surface of the detector (Ikon-m 934, Andor. Beijing, China) by the imaging optics (AF-S VR Micro-Nikkor 105 mm, Nikon. Beijing, China), and the detector was cooled to −60 °C to reduce the thermal noise inside the sensor chip.
3.2. Calibration
To determine the actual spectral range and spectral resolution of the optical system, we used a low-pressure mercury lamp as the light source for wavelength calibration. The mercury lamp has characteristic peaks at 546.075 nm, 573.964 nm, and 579.067 nm. Figure 3 shows the original interferogram and reconstructed spectrum of the mercury lamp.
According to Equations (11) and (12), two characteristic spectral lines (546.075 nm and 579.067 nm) of the mercury lamp were used for the calibration. The results show that the actual Littrow wavelength of the system is 540.904 nm, the Littrow angle is 2.324°, the system resolution is 4.945 cm−1 (0.149 THz), the spectral range is 2531.84 cm−1 (75.963 THz), and the FWHM of the 546.075 nm characteristic spectral line in the restored spectrum is 5.1 cm−1 (0.153 THz), which is almost the same as the theoretical resolution.
4. Results and Discussion
4.1. THz Raman Spectrum and SNR of Sulfur
The measured sulfur powder concentration was 99.9%, and the integration time was 50 s under laser powers of 5 mW, 38 mW, and 70 mW. The obtained spectrum is shown in Figure 4a. The external vibration of S8 molecules in the low-frequency part shows clear Raman peaks at 27 cm−1 (0.81 THz), 50 cm−1 (1.5 THz), and 83 cm−1 (2.49 THz), and the Raman peak at 151 cm−1 (4.53 THz) is assigned to the asymmetric S–S bending [21]. With the increase of laser power, the intensity of characteristic peak increases significantly. At 50 cm−1 in Figure 4a, when the laser power is 5 mW, 38 mw and 70 mW, the intensities are 0.453, 3.739, and 8.571, respectively. There is an approximate linear relationship between intensity and laser power.
To test the system performance, we calculated the SNR of sulfur with different laser powers and integration times. The strongest 50 cm−1 (1.5 THz) spectral line intensity in the spectrum was divided by the noise value of the system. The result is shown in Figure 4b; the SNR reaches approximately 750 at a low laser power of 60 mW with a short integration time of 20 s. When the integration time is fixed and the laser power is increased to 45 mW, the SNR growth slows down and tends to a fixed value. Similarly, when the laser power is constant and the integration time increases to 5 s, the SNR growth slows down and gradually tends to a fixed value. In the X–Z and Y–Z planes, the SNR curve is approximately a square-root function, which is consistent with the SNR equation [22].
4.2. THz Raman Spectra of Organic Acids
Benzoic acid (BA) is a kind of organic acid. It is a flake- or needle-like crystalline powder with the smell of benzene or formaldehyde. It is directly connected with the carbon atom of a benzene ring by a carboxyl group. It can be used in medical treatments, fuel carriers, plasticizers, perfumes, and preservatives. The THz Raman spectrum of BA is shown in Figure 5a, where the Raman peaks at 29 cm−1 (0.870 THz) and 93.17 cm−1 (2.795 THz) belong to translational vibration of Ag, the Raman peaks at 48.74 cm−1 (1.462 THz) and 117.8 cm−1 (3.534 THz) belong to directional vibration of Bg, and the Raman peak at 73.4 cm−1 (2.202 THz) belongs to directional vibration of Ag [22].
Salicylic acid (2-hydroxy BA) is a white crystalline powder that is similar to BA in structure. It can be used in perfumes, medicines, and pesticides. Figure 5b shows the THz Raman spectrum of 2-hydroxy BA, which is significantly different from Figure 5a, indicating that the measurement system performs well in distinguishing chemical structures of similar substances.
Figure 6 is the spectrum of 2-hydroxy BA at different times (from 10:30 to 16:30 at 30 min intervals). Under the same power and integration time, the signal position and intensity of the Raman spectrum of 2-hydroxy BA obtained at different times have almost no change, which proves the stability of the system.
In addition, gallic acid was placed in different containers (plastic bags, plastic bottles, and glass bottles) to detect the influence of the container on the measurement. The final results are shown in Figure 7, where the thickness of the plastic bags is 0.02 mm, the thickness of the plastic bottles is 0.1 mm, and the thickness of the glass bottles is 0.2 mm. The Raman peak intensity of gallic acid in plastic bags is the highest, and the vibration spectrum can be clearly distinguished. The signal intensity of gallic acid in plastic bottles and glass bottles is weaker, and the peak intensity at 114.7 cm−1 (3.441 THz) is obviously weaker. The results show that the reflection of laser from plastic bottle and glass bottle weakens the Raman signal and affects the measurement results. The influence of containers with different thickness on the measurement results is different. The results of measurement with thin plastic bags as containers are the best, indicating that the spatial heterodyne THz Raman spectroscopy system can be applied to the detection of thin plastic bag packaging samples. This widens the application prospects of THz Raman spectroscopy.
4.3. THz Raman Spectra of Nucleobases
RNA is the intermediate carrier of biological genetic information and participates in protein synthesis and gene expression. The chain molecule is formed by the condensation of nucleotides with phosphate diester bonds. A nucleotide is composed of pentose, phosphoric acid, and a nucleobase. There are four RNA nucleobases: cytosine, uracil, guanine, and adenine. Figure 8 shows the THz Raman spectra of the four nucleobases under a laser power of 50 mW and integration time of 80 s. The measured results are consistent with the theory. The measurement of RNA nucleobases is of great significance for structural research on and identification of biomacromolecules.
4.4. THz Raman Spectra of Aqueous Solutions
The THz Raman spectrometer system was used to measure signals of aqueous solutions. Figure 9 shows the THz Raman spectra of different concentrations of uracil aqueous solution (a) and salicylic acid aqueous solution (b) at a laser power of 50 mW and integration time of 50 s. The Raman peaks in the figure are identical to those for the solid state, and the Raman signal intensity increases with increasing concentration. The lowest measurable concentration of 2-hydroxy BA solution is 0.015 mol/L. This experiment breaks through the difficulties of THz measurement of aqueous solutions and makes it possible to detect low-concentration liquids.
4.5. THz Raman Spectra of Nucleobases
4.5.1. Spectra of Solid Mixtures
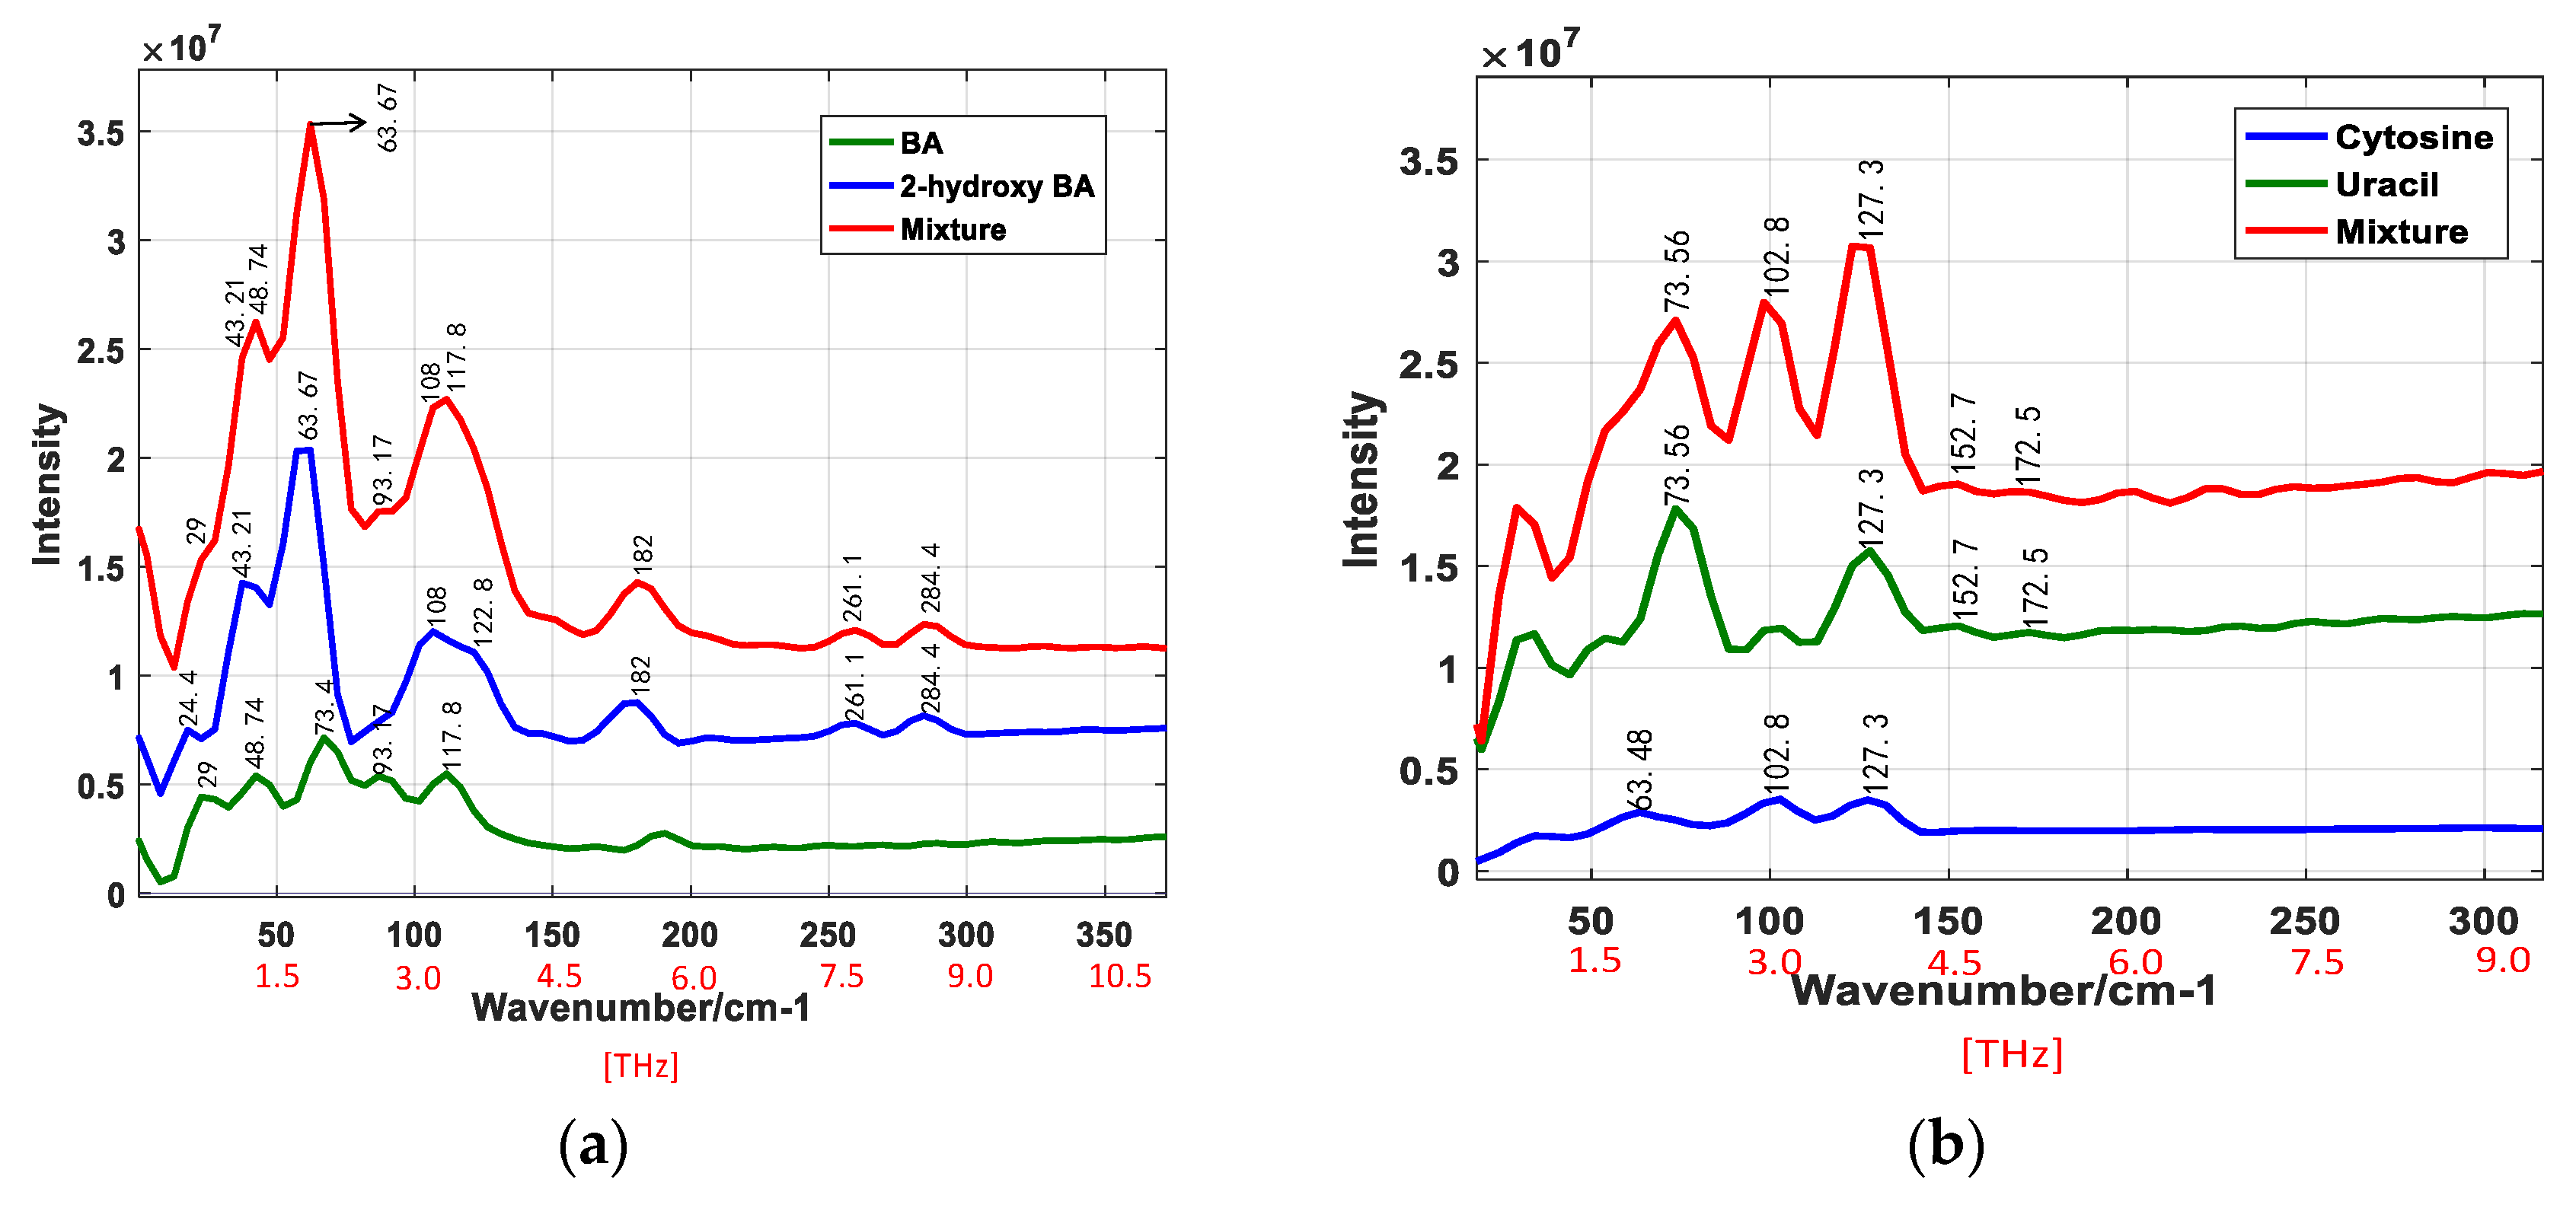
The performance of the system was further tested by measuring mixtures. Figure 10a shows the THz Raman spectra of a mixture of BA powder and 2-hydroxy BA powder with a ratio of 2:1, and Figure 10b shows the THz Raman spectra of a mixture of cytosine powder and uracil powder with a ratio of 1:2. The components of each mixture can still be clearly distinguished in the spectra. Therefore, the spatial heterodyne THz Raman spectrometer can easily be used to identify the compositions of such samples, which further broadens the application range of this system.
4.5.2. Spectra of Liquid Mixtures
Aqueous solutions were also measured. In Figure 10c,d, the spectral lines of the mixtures contain almost all the characteristic peaks of the components, except that a small number of characteristic peaks are masked owing to the mutual cancellation between the characteristic peaks of the components. This provides an experimental basis and technical support for developing THz Raman technology in such fields as water quality, agriculture, and medicine.
5. Conclusions
We have proposed a spatial heterodyne THz Raman spectrometer based on field widening. The system includes 532 nm BNFs for selective filtering of Raman scattering light, two field-widening prisms with an apex angle of 2.665° on the interference arms, and 150 gr/mm gratings.
We measured the THz Raman spectra of sulfur, organic acids, RNA nucleobases, and aqueous solutions. In addition, we measured solid and liquid mixtures. The results show that the system can effectively distinguish the components of a mixture. The calculated SNRs of sulfur samples under different integration times and laser powers show that the system has good stability, and the SNR reaches approximately 750 at a low laser power of 60 mW with a short integration time of 20 s. We measured 2-hydroxy BA at different times under the same integration time and laser power. The positions and intensities of Raman peaks were almost the same, which proved that the system had good repeatability. To test the influence of the container, we measured the THz Raman spectra of a sample in containers of different thicknesses and materials. The results show that the spectral resolution is not significantly affected by the selection of different containers. The spatial heterodyne THz Raman spectrometer system has no incident slit, which effectively improves the throughput. The system has good stability and repeatability, and realizes signal measurement of aqueous solutions in the THz band. It can be applied in such fields as material detection, environmental protection, medicine, and marine exploration.
Author Contributions
Conceptualization, X.L. and Y.S.; methodology, Y.S.; software, Z.L.; validation, Y.S. and X.L.; formal analysis, X.M.; investigation, Q.C.; resources, J.G.; data curation, J.C.; writing—original draft preparation, Y.S.; writing—review and editing, Y.S.; visualization, X.Y. and P.L.; supervision, X.L. All authors have read and agreed to the published version of the manuscript.
Funding
National Natural Science Foundation of China (61975255, U2006209, 61505204), Jilin Province Research Projects in China (20190302047GX, 20200404197YY, 2020SYHZ0040).
Institutional Review Board Statement
Not applicable.
Conflicts of Interest
The authors declare no conflict of interest.
References
- Grechko, M.; Hasegawa, T.; D’Angelo, F.; Ito, H.; Turchinovich, D.; Nagata, Y.; Bonn, M. Coupling between intra- and intermolecular motions in liquid water revealed by two-dimensional terahertz-infrared-visible spectroscopy. Nat. Commun. 2018, 9, 55–57. [Google Scholar] [CrossRef] [PubMed]
- Damari, R.; Weinberg, O.; Krotkov, D.; Demina, N.; Akulov, K.; Golombek, A.; Schwartz, T.; Fleischer, S. Strong coupling of collective intermolecular vibrations in organic materials at THz frequencies. Nat. Commun. 2019, 10, 2403–2412. [Google Scholar] [CrossRef]
- Morimoto, T.; Nagai, M.; Minowa, Y.; Ashida, M.; Yokotani, Y.; Okuyama, Y.; Kani, Y. Microscopic ion migration in solid electrolytes revealed by THz time-domain spectroscopy. Nat. Commun. 2019, 10, 26–33. [Google Scholar] [CrossRef] [PubMed]
- Bandurin, D.A.; Svintsov, D.; Gayduchenko, I.; Xu, S.; Principi, A.; Moskotin, M.; Tretyakov, I.; Yagodkin, D.; Zhukov, S.; Taniguchi, T.; et al. Resonant THz detection using graphene plasmons. Nat. Commun. 2018, 9, 5392. [Google Scholar] [CrossRef] [PubMed] [Green Version]
- Chen, L.; Wei, Y.; Zang, X.; Zhu, Y.; Zhuang, S. Correction: Corrigendum: Excitation of dark multipolar plasmonic resonances at THz frequencies. Sci. Rep. 2016, 6, 27324. [Google Scholar] [CrossRef] [PubMed] [Green Version]
- Huisman, T.J.; Mikhaylovskiy, R.V.; Telegin, A.; Sukhorukov, Y.P.; Granovsky, A.; Naumov, S.; Rasing, T.; Kimel, A.V. THz magneto-optics in the ferromagnetic semiconductor HgCdCr2Se4. Appl. Phys. Lett. 2015, 106, 132411. [Google Scholar] [CrossRef] [Green Version]
- Dixit, V.; Cho, B.K.; Obendorf, K.; Tewari, J. Identifications of household’s spores using mid infrared spectroscopy. J. Spectrochim. Acta Part A Mol. Biomol. Spectrosc. 2014, 123, 490–496. [Google Scholar] [CrossRef] [PubMed]
- Wang, C.H.; Terracciano, A.C.; Masuno, V.A.E. Accurate prediction of THz spectra of molecular crystals of fentanyl and its analogs. J. Sci. Rep. 2021, 11, 11. [Google Scholar] [CrossRef]
- Chen, W.; Peng, Y.; Jiang, X.; Zhao, J.; Zhalo, H.; Zhu, Y. Isomers Identification of 2-hydroxyglutarate acid disodium salt (2HG) by THz Time-domain Spectroscopy. J. Sci. Rep. 2017, 7, 12166. [Google Scholar] [CrossRef] [Green Version]
- Richter, H.; Buchbender, C.; Güsten, R.; Higgins, R.; Klein, B.; Stutzki, J.; Wiesemeyer, H.; Hübers, H.-W. Direct measurements of atomic oxygen in the mesosphere and lower thermosphere using THz heterodyne spectroscopy. Commun. Earth Environ. 2021, 2, 19. [Google Scholar] [CrossRef]
- Hsieh, Y.D.; Nakamura, S.; Abdelsalam, D.; Minamikawa, T.; Mizutani, Y.; Yamamoto, H.; Iwata, T.; Hindle, F.; Yasui, T. Dynamic THz spectroscopy of gas molecules mixed with unwanted aerosol under atmospheric pressure using fibre-based asynchronous-optical-sampling THz time-domain spectroscopy. Sci. Rep. 2016, 6, 28114. [Google Scholar] [CrossRef] [PubMed] [Green Version]
- Xu, W.; Xie, L.; Ye, Z.; Gao, W.; Yao, Y.; Chen, M.; Qin, J.; Ying, Y. Discrimination of Transgenic Rice containing the Cry1Ab Protein using THz Spectroscopy and Chemometrics. Sci. Rep. 2015, 5, 11115. [Google Scholar] [CrossRef]
- Shi, X.; Han, Z. Enhanced THz fingerprint detection with ultrahigh sensitivity using the cavitydefect modes. J. Sci. Rep. 2017, 7, 13147. [Google Scholar] [CrossRef] [PubMed] [Green Version]
- Yamaguchi, S.; Fukushi, Y.; Kubota, O.; Itsuji, T.; Ouchi, T.; Yamamoto, S. Brain tumor imaging of rat fresh tissue using THz spectroscopy. J. Rep. 2016, 6, 30124. [Google Scholar] [CrossRef] [Green Version]
- Ma, Y.; Huang, H.; Hao, S.; Qiu, K.-F.; Gao, H.; Gao, L.; Tang, W.; Zhang, Z.; Zheng, Z.I. Insights into the water status in hydrous minerals using THz time-domain spectroscopy. J. Sci. Rep. 2019, 9. [Google Scholar] [CrossRef]
- Julien, C. A triple monochromator for low-frequency Raman spectroscopy. J. Opt. 1980, 11, 257–267. [Google Scholar] [CrossRef]
- Moser, C.; Havermeyer, F.; Champion, P.M.; Ziegler, L.D. Compact Low Frequency Raman Spectroscopy System. J. Am. Inst. Phys. 2010, 794–795. [Google Scholar] [CrossRef]
- Guan, X.; Jiang, M.; Yang, F.; Yu, Y.; Chen, J. Portable Low Frequency Raman Spectrometer Based on Fliter. In Proceedings of the 2019 IEEE 4th Optoelectronics Global Conference (OGC), IEEE, Shenzhen, China, 3–6 September 2019; pp. 126–130. [Google Scholar] [CrossRef]
- Bell, R.J. Introductory Fourier transform spectroscopy. J. Acad. Press 1972, 41, 149–151. [Google Scholar] [CrossRef]
- Roesler, F.L.; Harlander, J.M. Spatial heterodyne spectroscopy-Interferometric performance at any wavelength without scanning. J. Proc. SPIE-Int. Soc. Opt. Eng. 1990, 1318. [Google Scholar] [CrossRef]
- Nims, C.; Cron, B.; Wetherington, M.; Macalady, J.; Cosmidis, J. Low frequency Raman Spectroscopy for micron-scale and in vivo characterization of elemental sulfur in microbial samples. J. Sci. Rep. 2019, 9, 7971. [Google Scholar] [CrossRef] [Green Version]
- Korobkov, V.S.; Zharikov, N.K. The low-frequency raman spectra of benzoic acid and some of its derivatives. J. Appl. Spectrosc. 1973, 19, 1306–1310. [Google Scholar] [CrossRef]
Figure 1.
Optical structure of the spatial heterodyne THz Raman spectrometer.

Figure 2.
Spatial heterodyne THz Raman spectrometer.

Figure 3.
(a) Interferogram of the mercury lamp. (b) Spatial frequency profile obtained from the FFT. (c) After calibration, the position of the characteristic spectral line of the mercury lamp is 546.07 nm, 573.964 nm, and 579.067 nm.
Figure 3.
(a) Interferogram of the mercury lamp. (b) Spatial frequency profile obtained from the FFT. (c) After calibration, the position of the characteristic spectral line of the mercury lamp is 546.07 nm, 573.964 nm, and 579.067 nm.
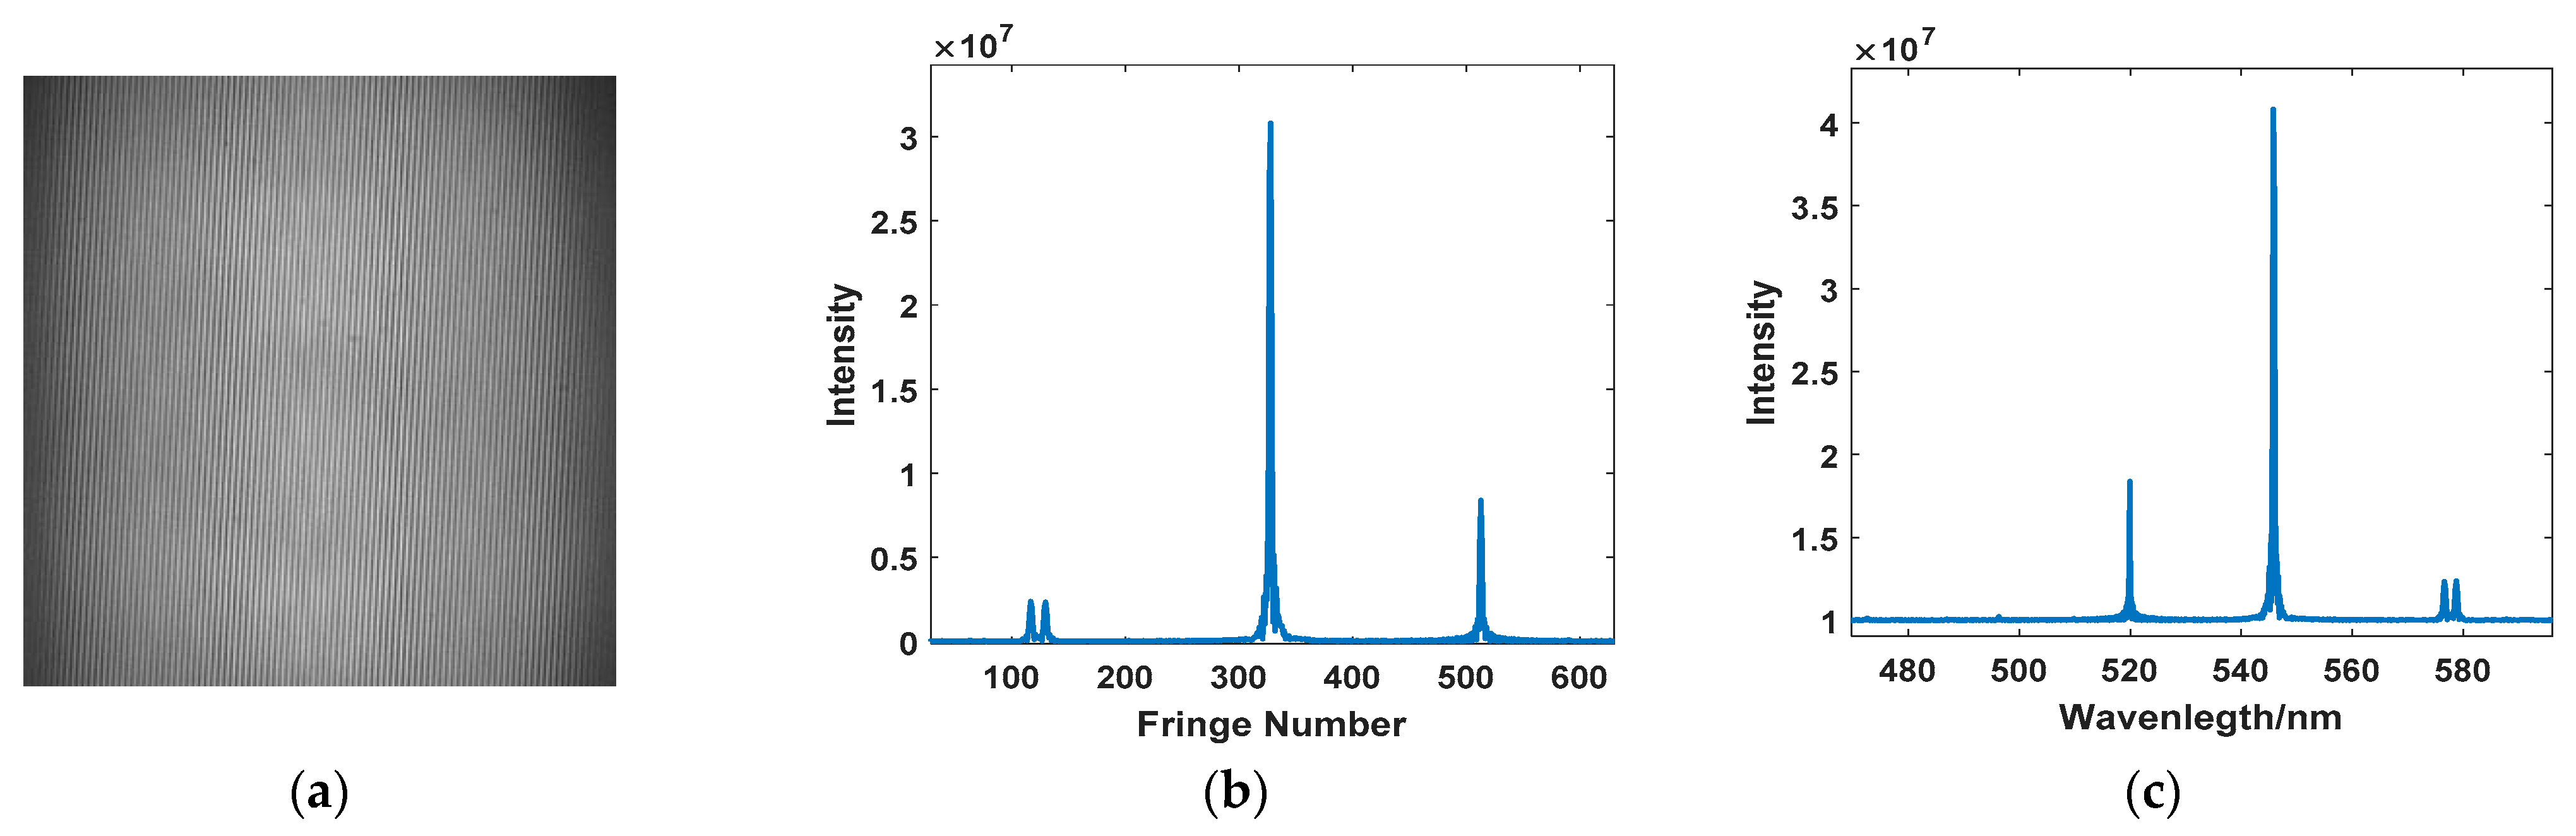
Figure 4.
(a) THz Raman spectra of sulfur at the same integration time and different powers. (b) SNR of sulfur under different laser powers and integration times.
Figure 4.
(a) THz Raman spectra of sulfur at the same integration time and different powers. (b) SNR of sulfur under different laser powers and integration times.
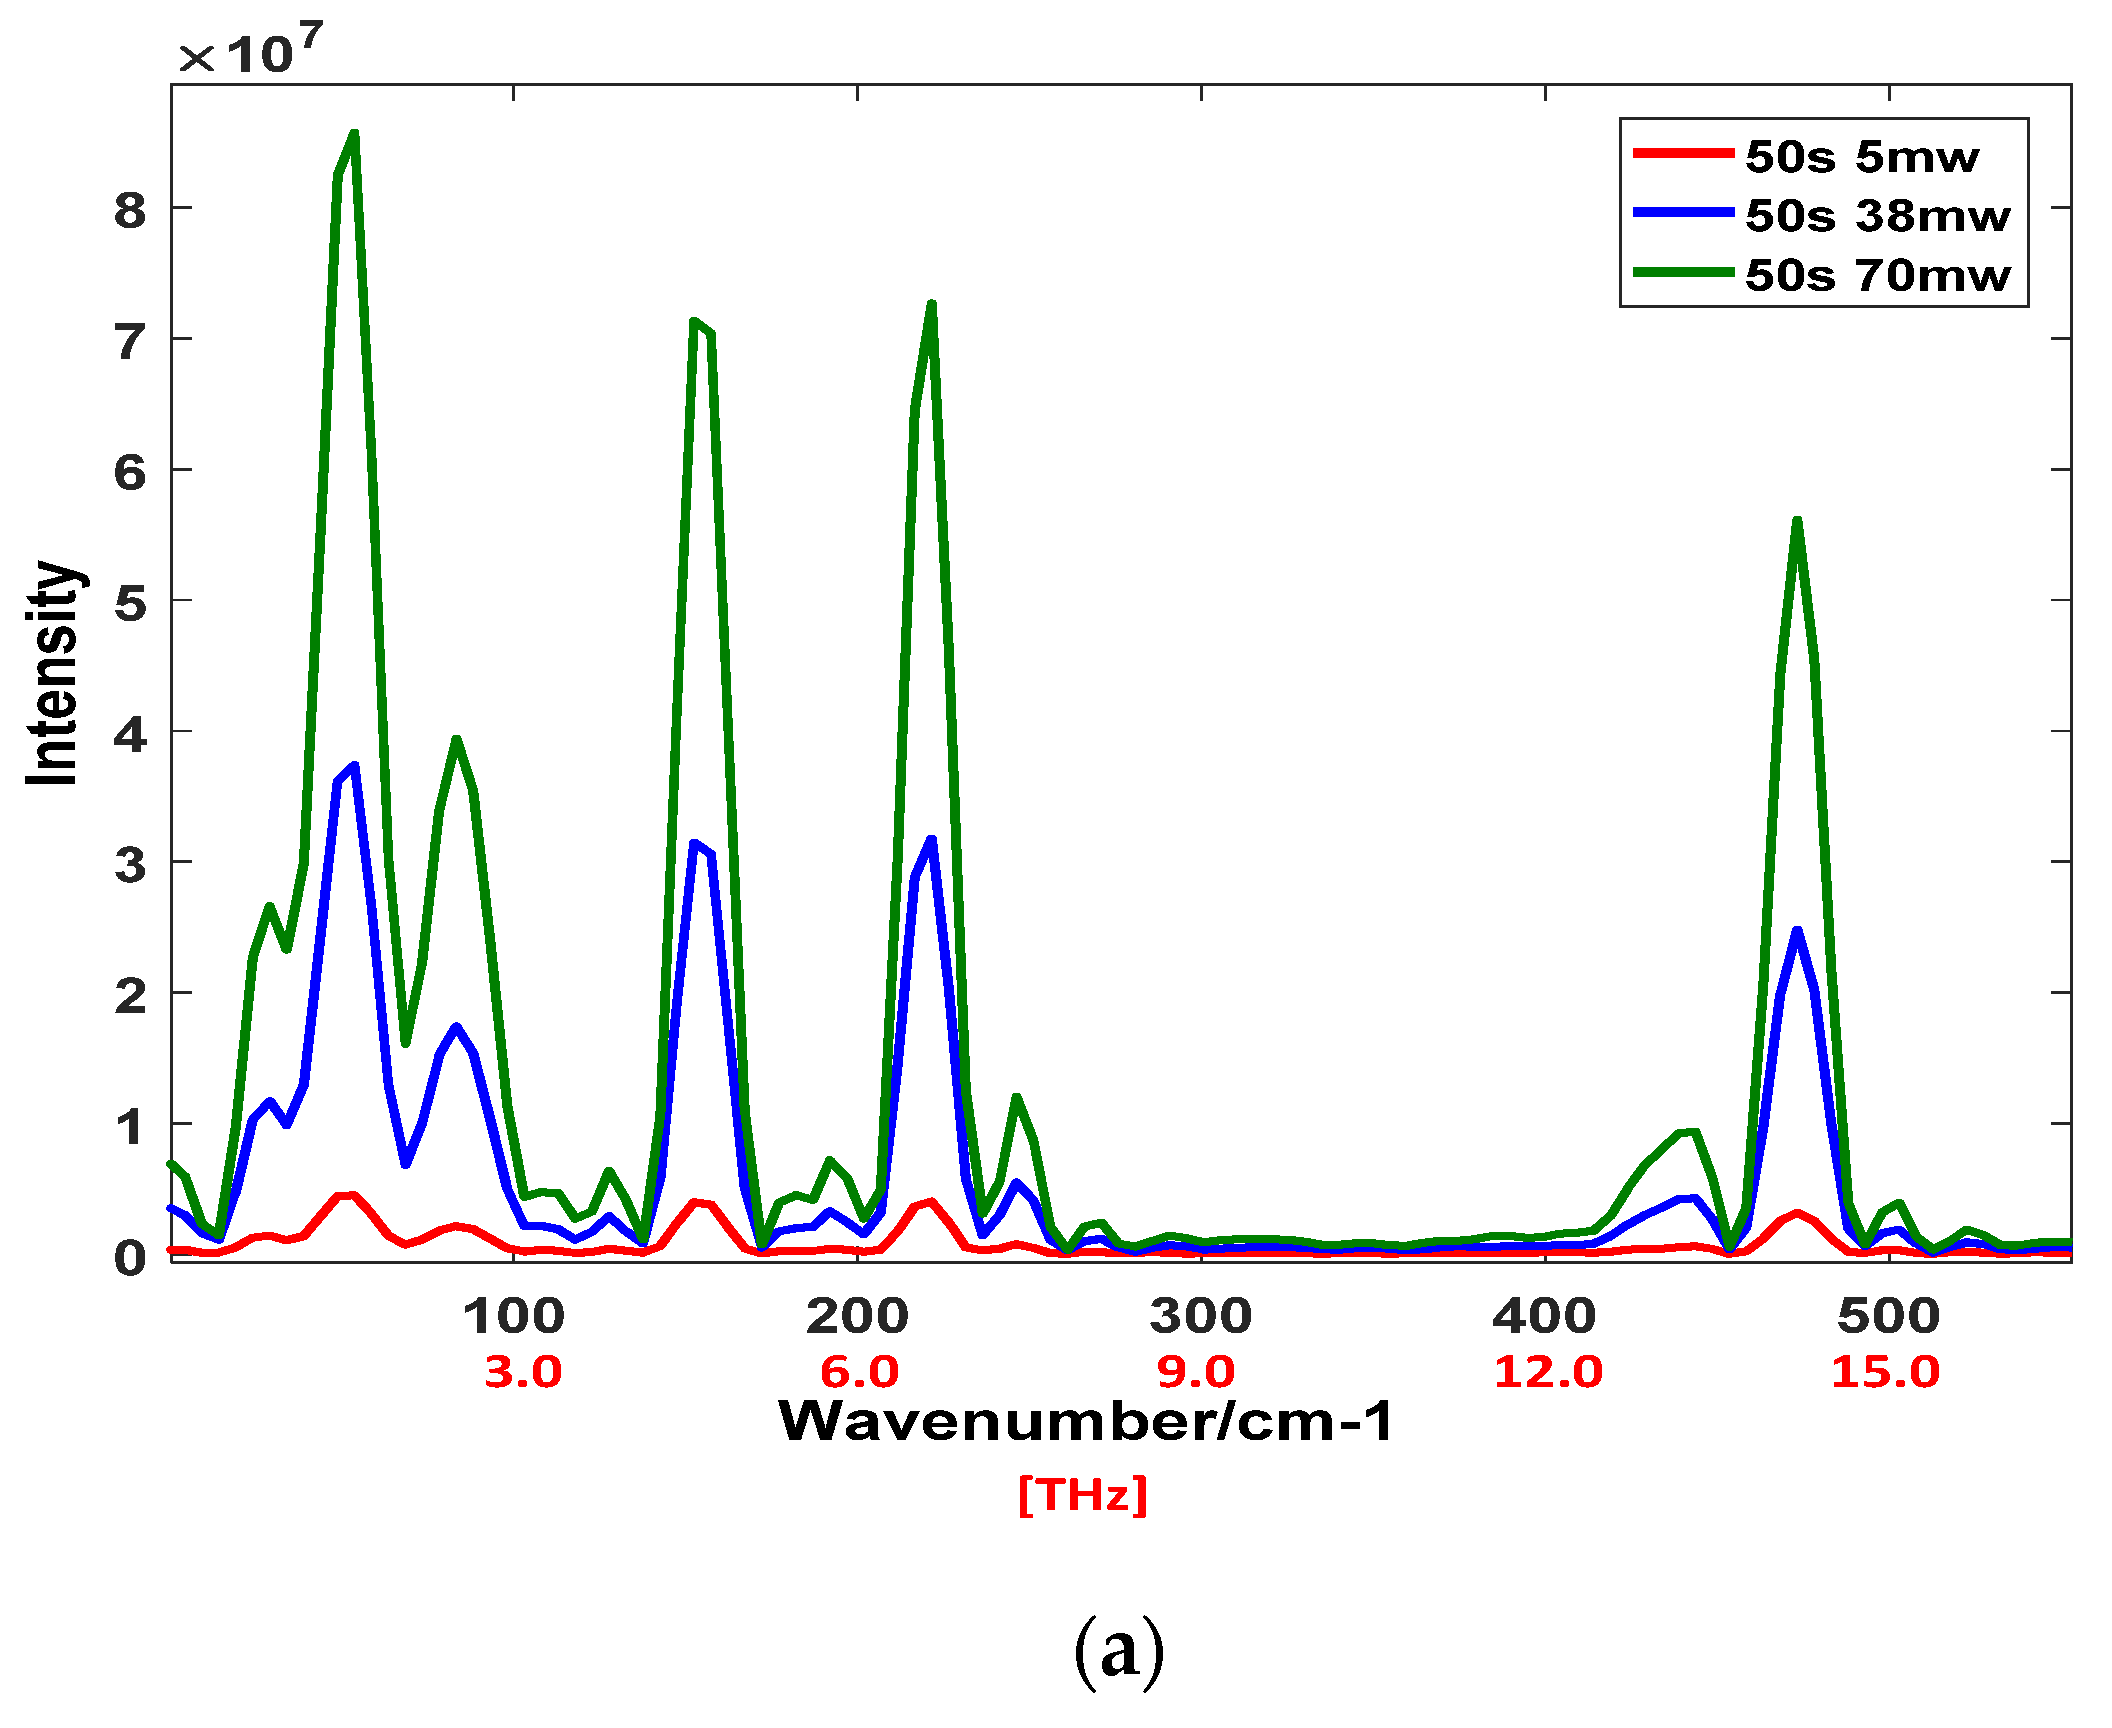
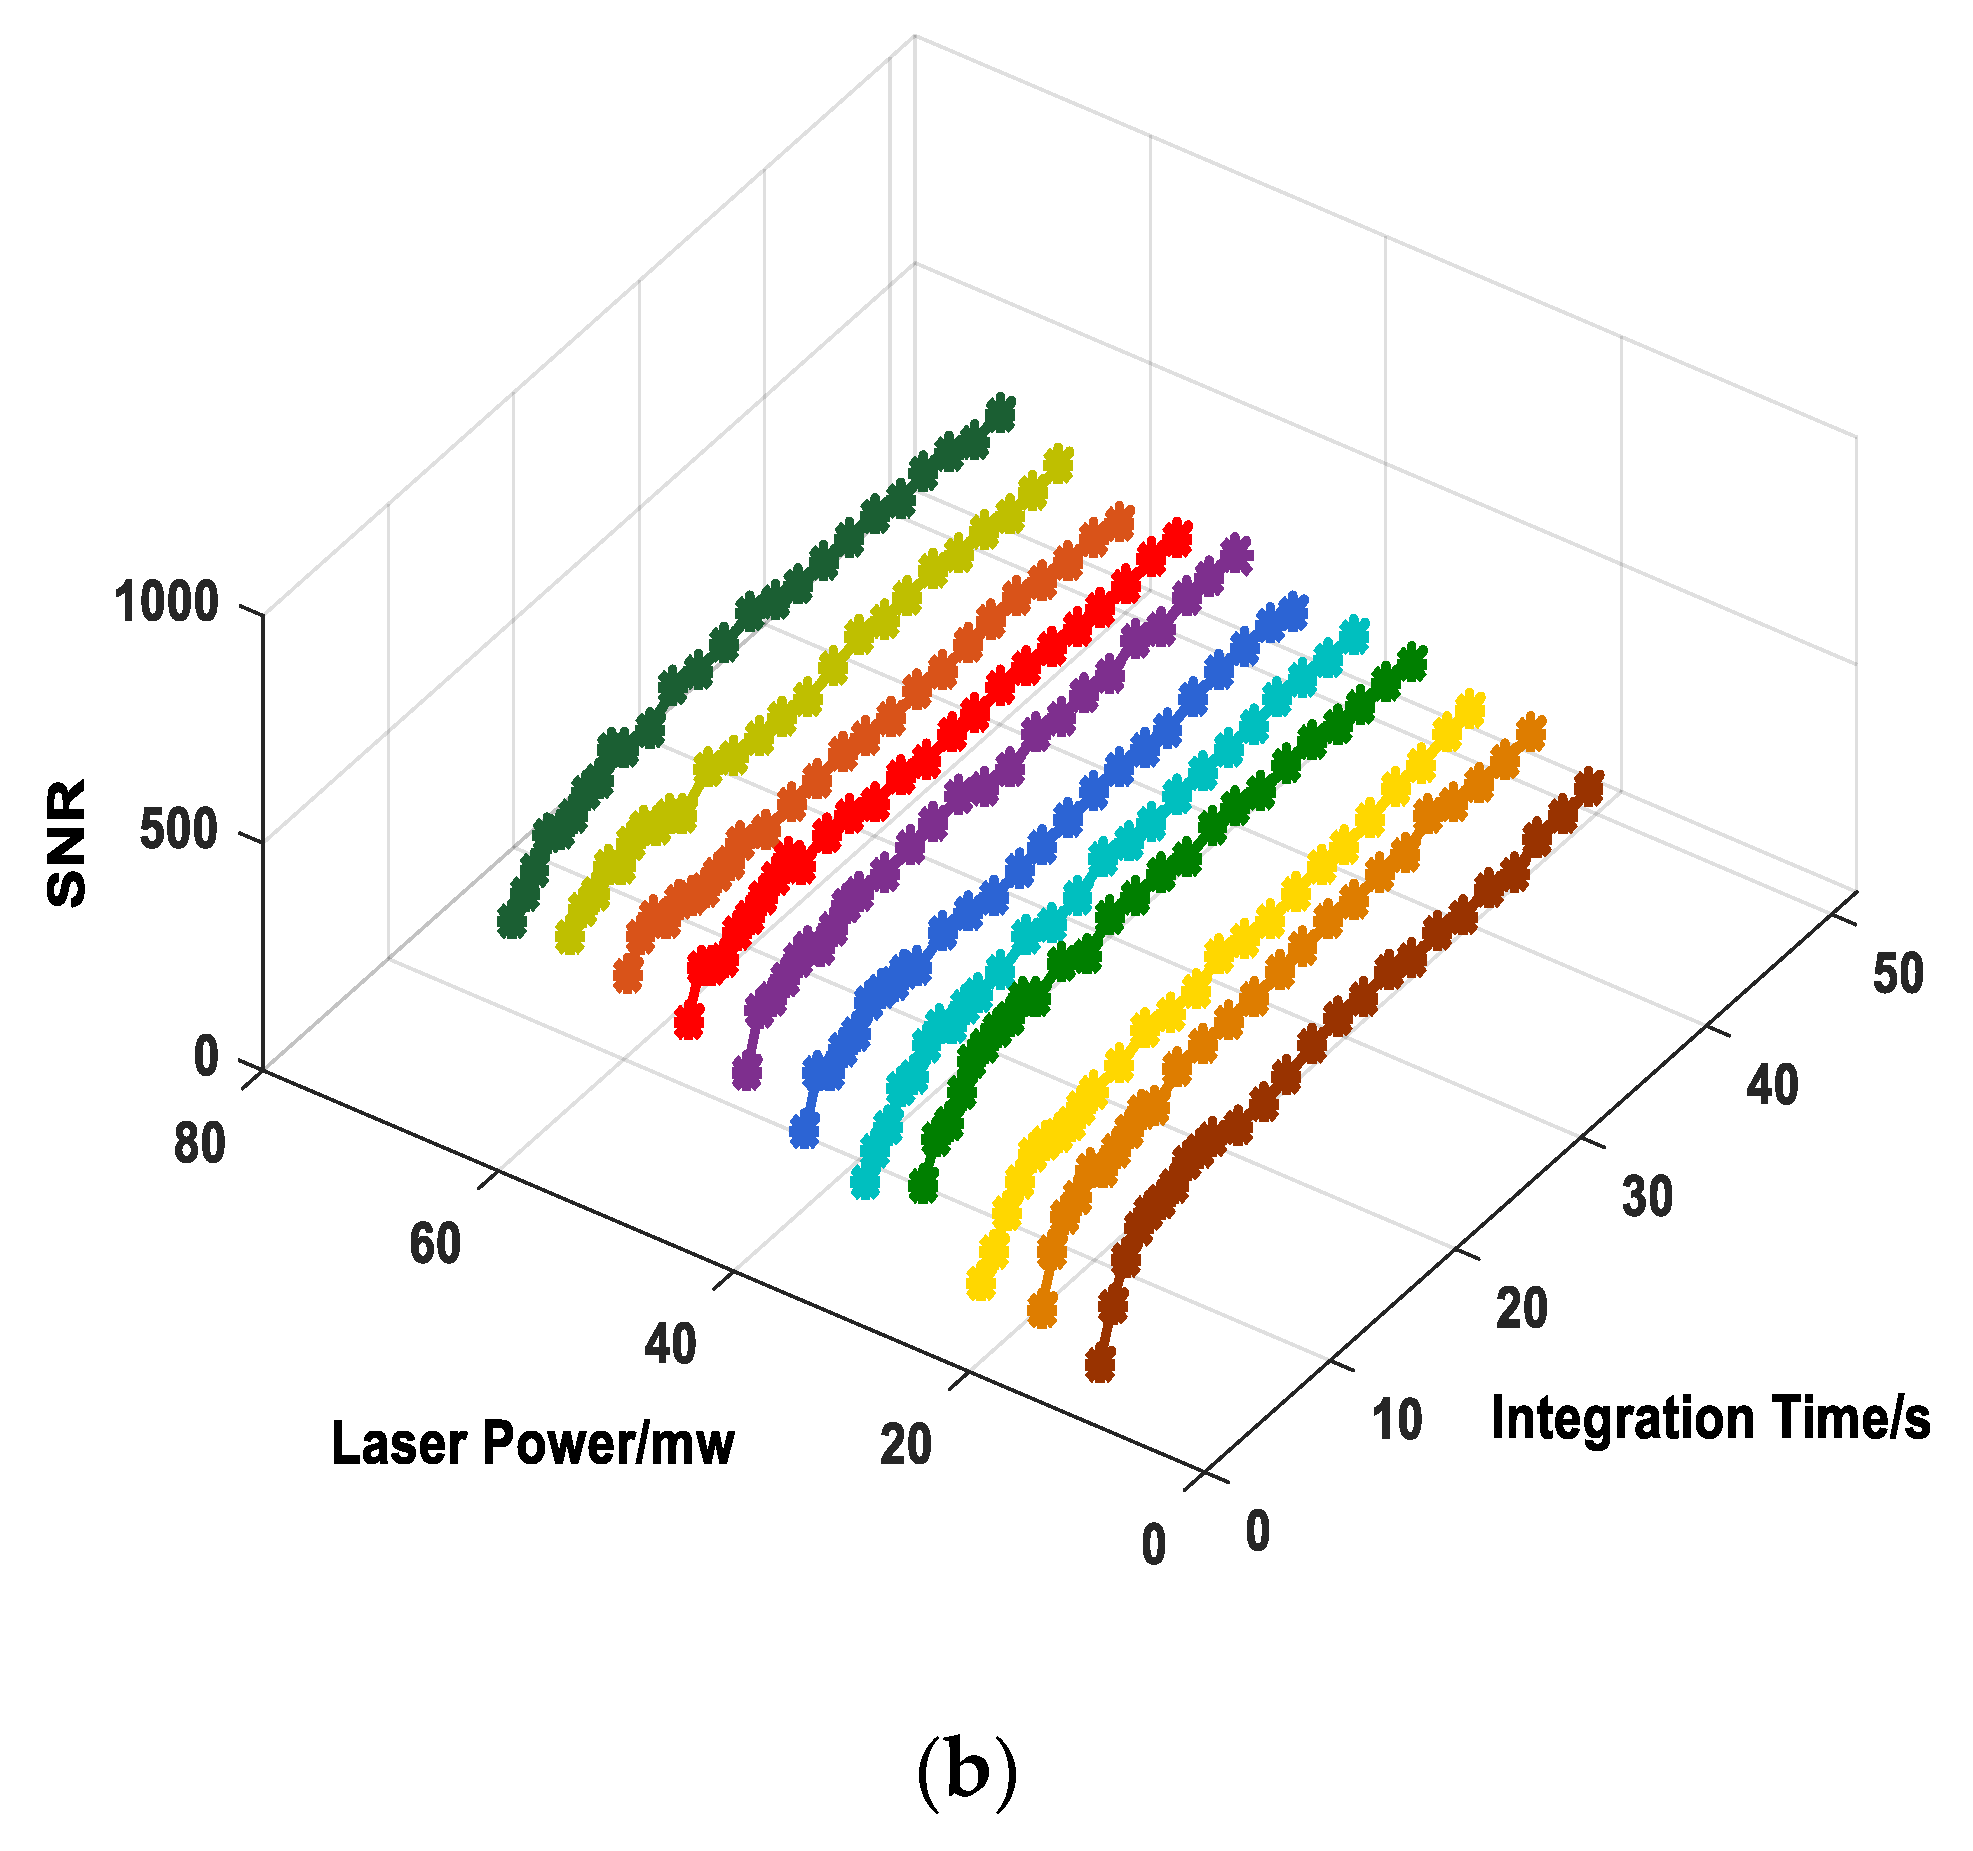
Figure 5.
(a) THz Raman spectra of BA at a laser power of 50 mW with an integration time of 50 s. (b) THz Raman spectra of 2-hydroxy BA at a laser power of 50 mW with an integration time of 50 s.
Figure 5.
(a) THz Raman spectra of BA at a laser power of 50 mW with an integration time of 50 s. (b) THz Raman spectra of 2-hydroxy BA at a laser power of 50 mW with an integration time of 50 s.
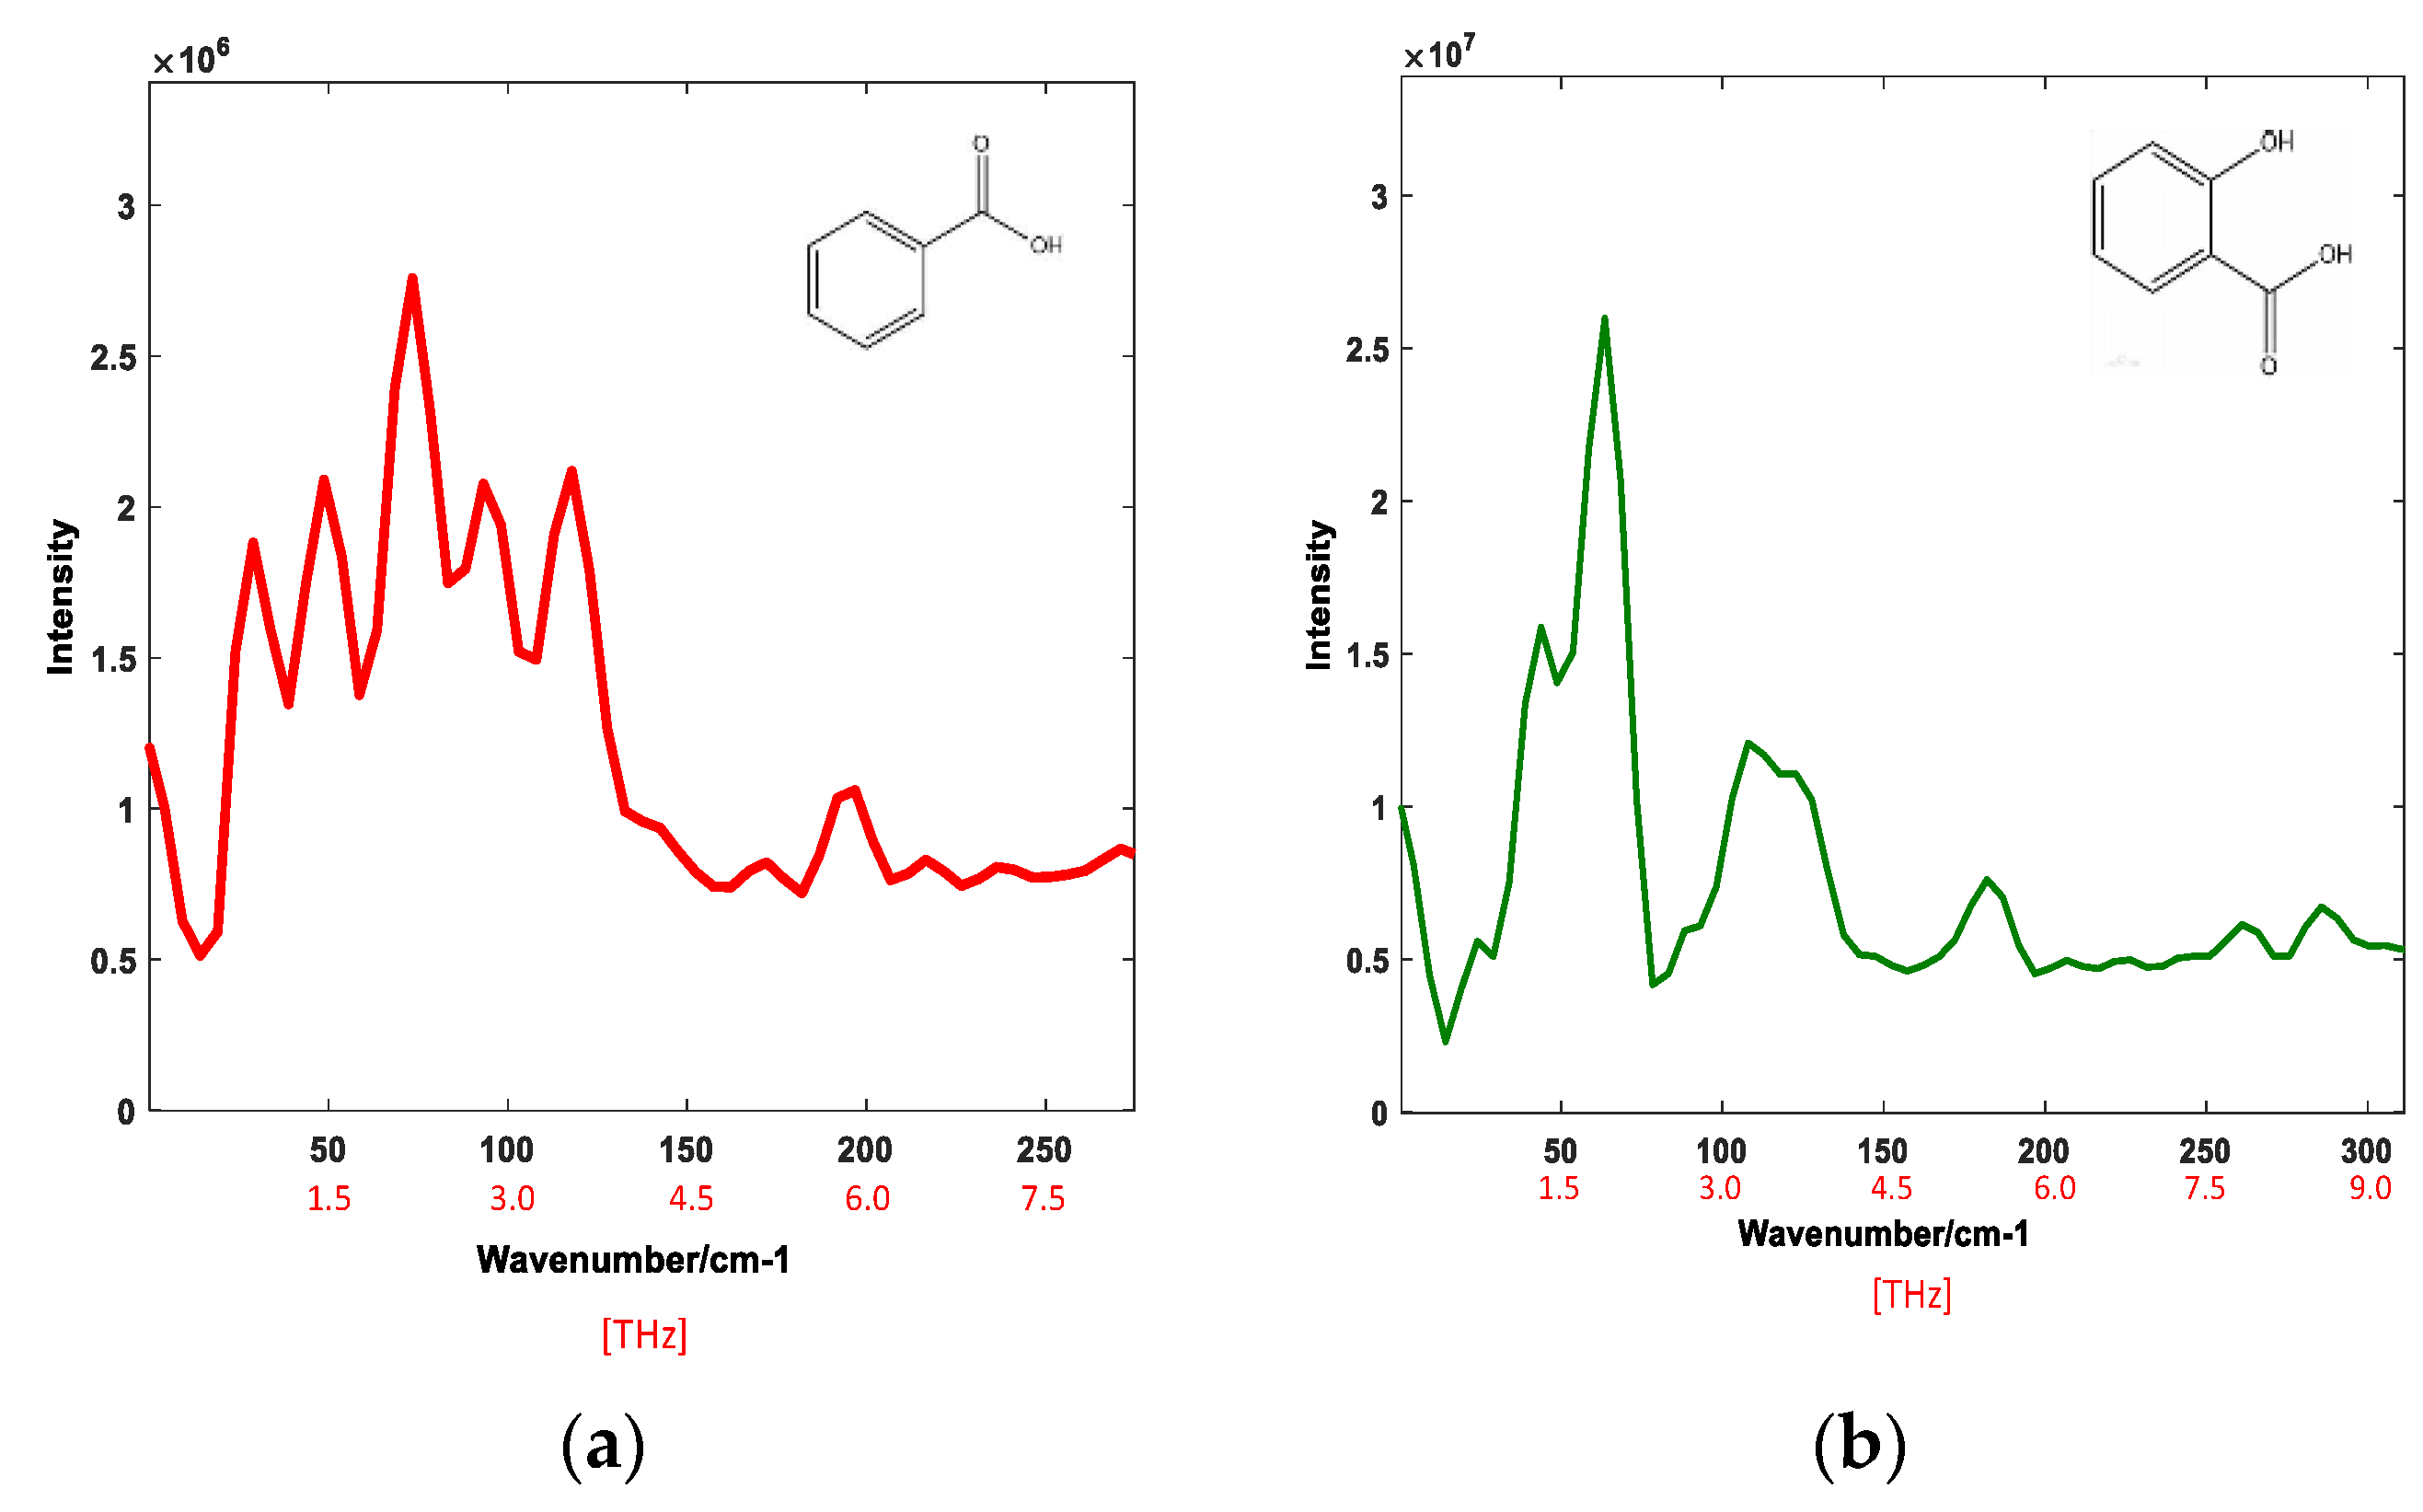
Figure 6.
Spectra of 2-hydroxy BA at different times with a laser power of 50 mW and integration time of 20 s.
Figure 6.
Spectra of 2-hydroxy BA at different times with a laser power of 50 mW and integration time of 20 s.

Figure 7.
Spectra of gallic acid in different containers with a laser power of 50 mW and integration time of 100 s.
Figure 7.
Spectra of gallic acid in different containers with a laser power of 50 mW and integration time of 100 s.
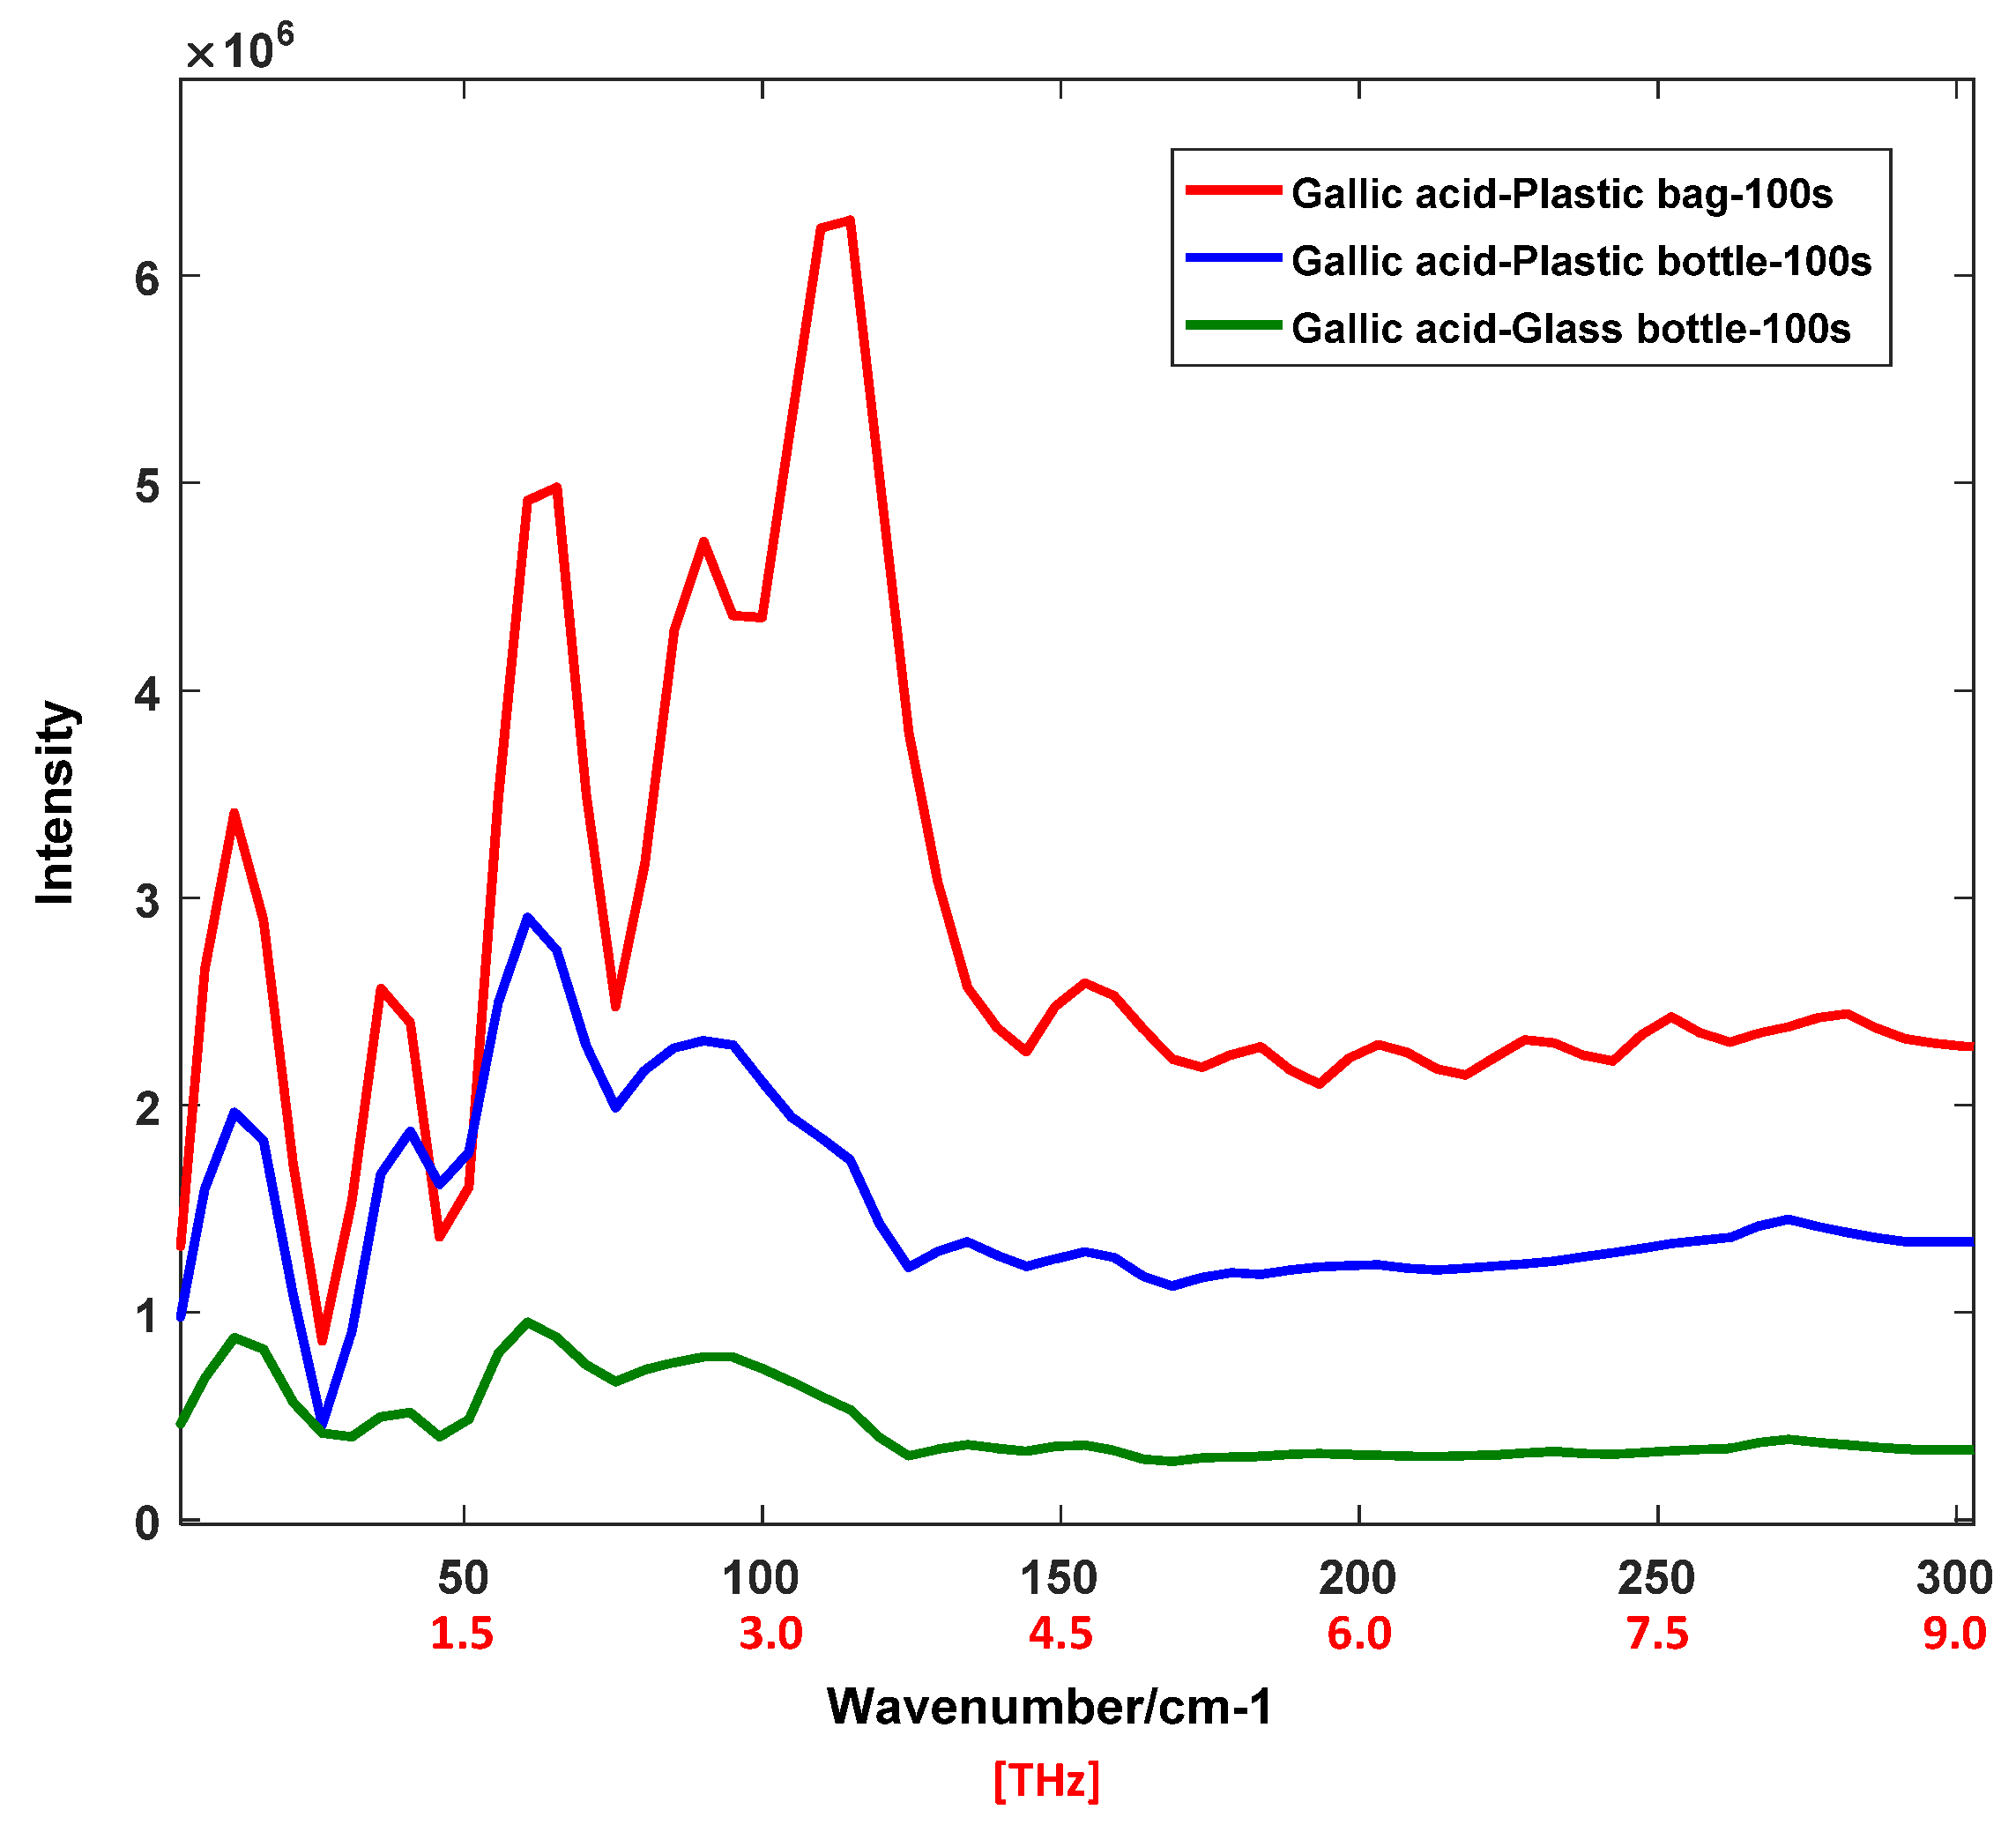
Figure 8.
THz Raman spectra of four nucleobases: (a) cytosine, (b) uracil, (c) guanine, (d) and adenine.
Figure 8.
THz Raman spectra of four nucleobases: (a) cytosine, (b) uracil, (c) guanine, (d) and adenine.

Figure 9.
(a) THz Raman spectra of uracil aqueous solution at different concentrations. (b) THz Raman spectra of 2-hydroxy BA aqueous solution at different concentrations.
Figure 9.
(a) THz Raman spectra of uracil aqueous solution at different concentrations. (b) THz Raman spectra of 2-hydroxy BA aqueous solution at different concentrations.

Figure 10.
(a) THz Raman spectra of BA powder and 2-hydroxy BA at a laser power of 128 mW with an integration time of 50 s. (b) THz Raman spectra of cytosine powder and uracil powder at a laser power of 128 mW with an integration time of 50 s. (c) THz Raman spectra of 0.1 mol/L 2-hydroxy BA aqueous solution and 0.1 mol/L theophylline aqueous solution (ratio 1:5) at a laser power of 128 mW with an integration time of 100 s. (d) THz Raman spectra of 0.1 mol/L theophylline aqueous solution and 0.1 mol/L uracil aqueous solution (ratio 2:1) at a laser power of 128 mW with an integration time of 100 s.


Table 1.
Key parameters of components used in the experimental breadboard.
| Components | Parameters | Performance Index |
|---|---|---|
| Laser | Wavelength | 532 nm, CW |
| Beam diameter | ~2.0 (1/e, mm) | |
| Beam divergence | <1.5 (full angle, mrad) | |
| Grating 1 | Groove density | 150 gr/mm |
| Littrow angle | 2.324° | |
| Grating 2 | Groove density | 150 gr/mm |
| Littrow angle | 2.324° | |
| Prisms | Apex angle | 2.665° |
| Beam splitter | Size | 50.8 × 50.8 × 50.8 mm3 |
| CCD | Pixel numbers | 1024 × 1024 |
| Sensor size | 13.3 × 13.3 nm2 | |
| Pixel size | 13 × 13 | |
| BPF | Design wavelength | 532 nm |
| Diffraction efficiency | 99.8% | |
| Transmittance | >94% | |
| 500 nm long-pass filter | Edge wavelength | 508–2150 nm |
| Transition width | 15 nm | |
| Blocking region | 200–485 nm | |
| 550 nm short-pass filter | Cut-off wavelength | 400–543 nm |
| Transition width | 17 nm | |
| Blocking region | 567–715 nm | |
| BNF | Design wavelength | 532 nm |
| Optical density | OD3 | |
| Transmittance | >92% | |
| Imaging optics | Diameter | 62 mm |
| Focal length | 105 mm |
Publisher’s Note: MDPI stays neutral with regard to jurisdictional claims in published maps and institutional affiliations. |
© 2021 by the authors. Licensee MDPI, Basel, Switzerland. This article is an open access article distributed under the terms and conditions of the Creative Commons Attribution (CC BY) license (https://creativecommons.org/licenses/by/4.0/).
Share and Cite
MDPI and ACS Style
Sun, Y.; Li, X.; Galantu, J.; Chu, Q.; Chen, J.; Liu, Z.; Mi, X.; Yao, X.; Li, P. Terahertz Raman Measurements Using a Spatial Heterodyne Raman Spectrometer. Appl. Sci. 2021, 11, 8094. https://doi.org/10.3390/app11178094
AMA Style
Sun Y, Li X, Galantu J, Chu Q, Chen J, Liu Z, Mi X, Yao X, Li P. Terahertz Raman Measurements Using a Spatial Heterodyne Raman Spectrometer. Applied Sciences. 2021; 11(17):8094. https://doi.org/10.3390/app11178094
Chicago/Turabian StyleSun, Yuqi, Xiaotian Li, Jiri Galantu, Qihang Chu, Jun Chen, Zhongkai Liu, Xiaotao Mi, Xuefeng Yao, and Pan Li. 2021. "Terahertz Raman Measurements Using a Spatial Heterodyne Raman Spectrometer" Applied Sciences 11, no. 17: 8094. https://doi.org/10.3390/app11178094
Note that from the first issue of 2016, this journal uses article numbers instead of page numbers. See further details here.