
Investigation of Degradation Mechanism from Shear Deformation and the Relationship with Mechanical Properties, Lamellar Size, and Morphology of High-Density Polyethylene


Abstract
:
1. Introduction
2. Materials and Methods
2.1. Material
2.2. Fabrication of VPE Thin Film
2.3. Shear Treatment and Remolding of HDPE
2.4. Characterization
2.4.1. Tensile Properties
2.4.2. X-ray Crystallography
2.4.3. Morphological Observation
2.4.4. Evaluation of Molecular Weight and Chemical Composition
3. Results & Discussion
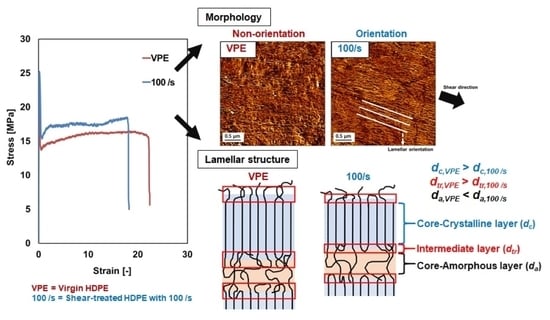
3.1. Tensile Properties
3.2. X-ray Crystallography
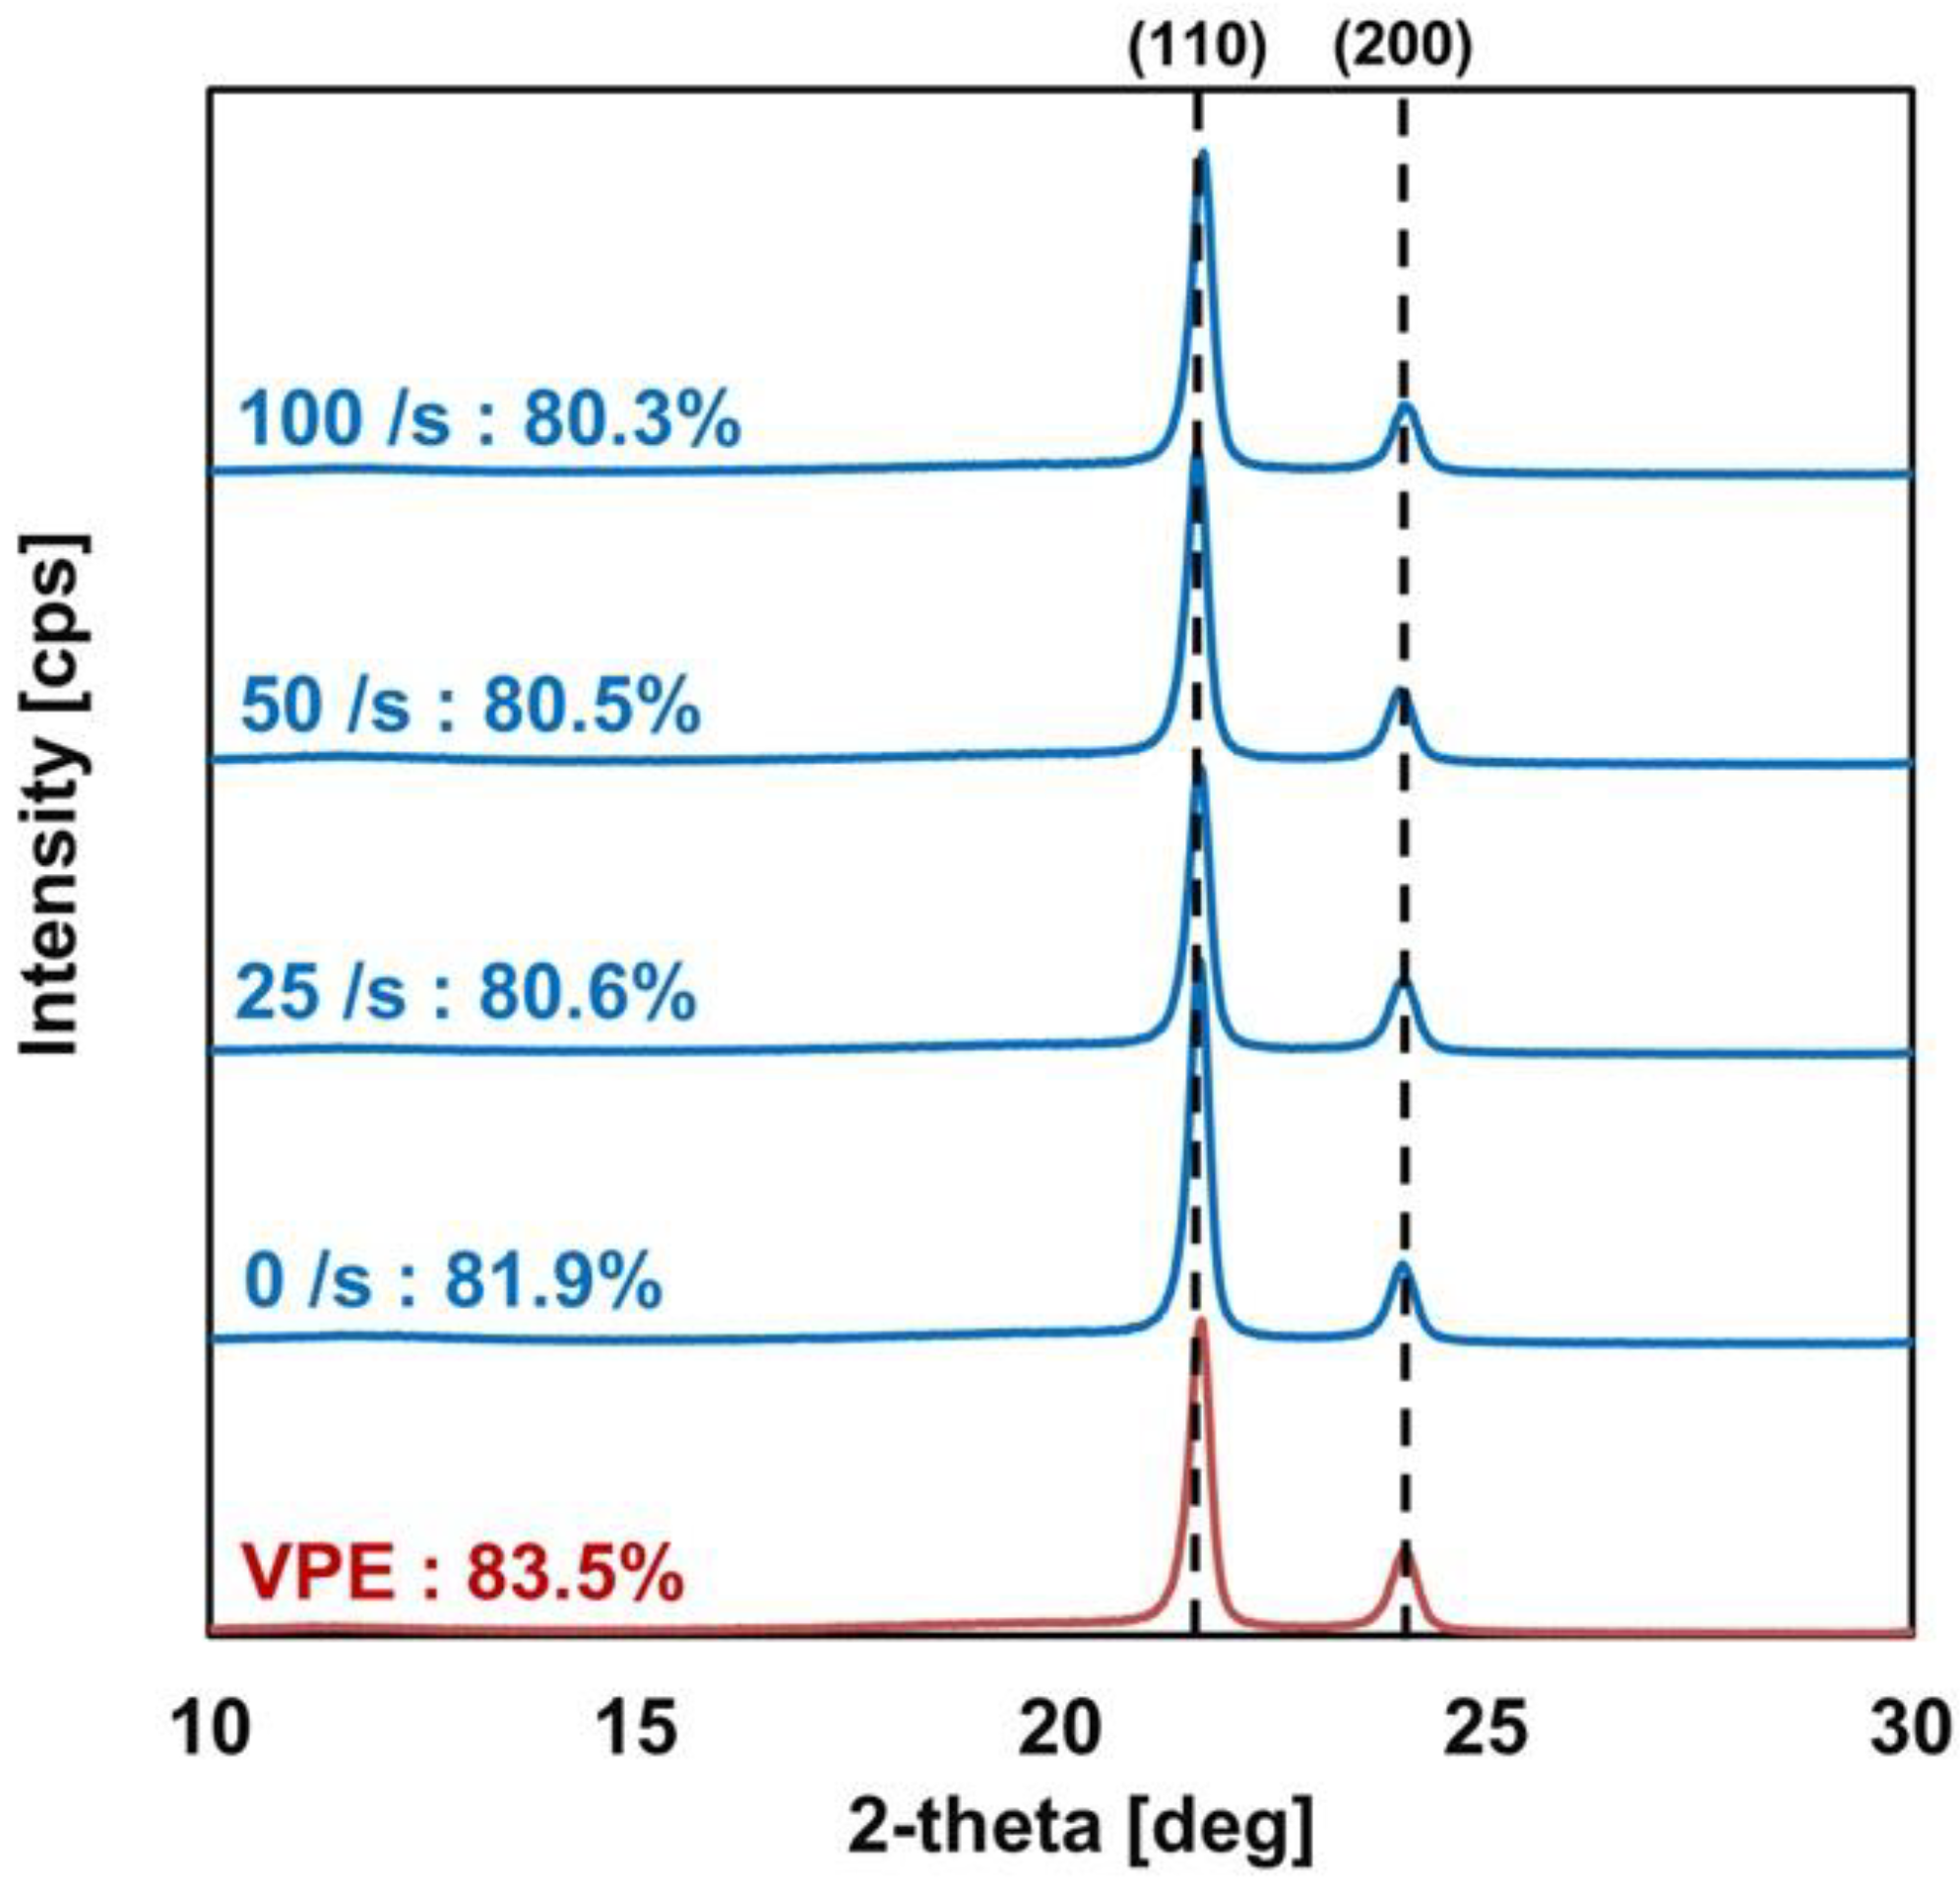
3.2.1. Crystalline Type and Degree of Crystallinity Evaluated by XRD
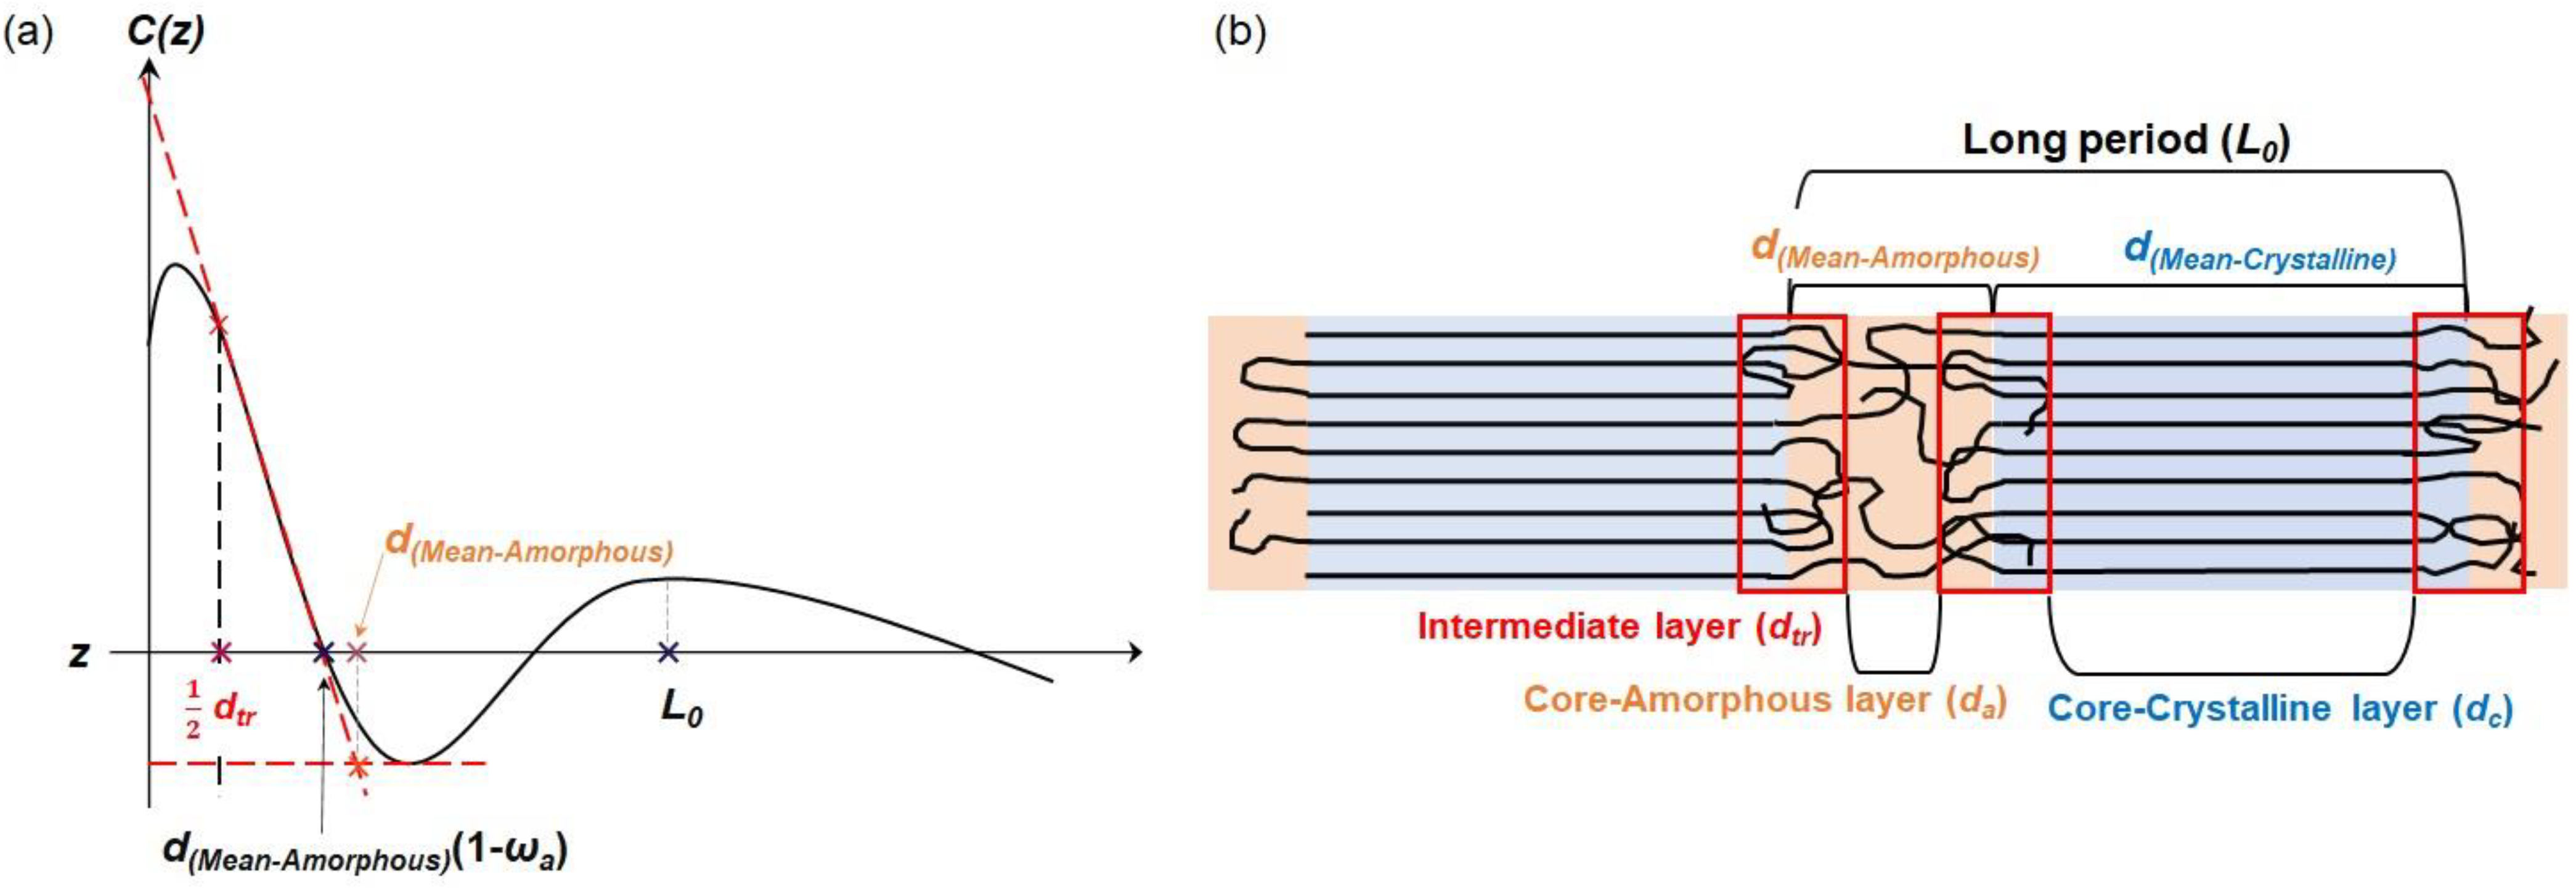
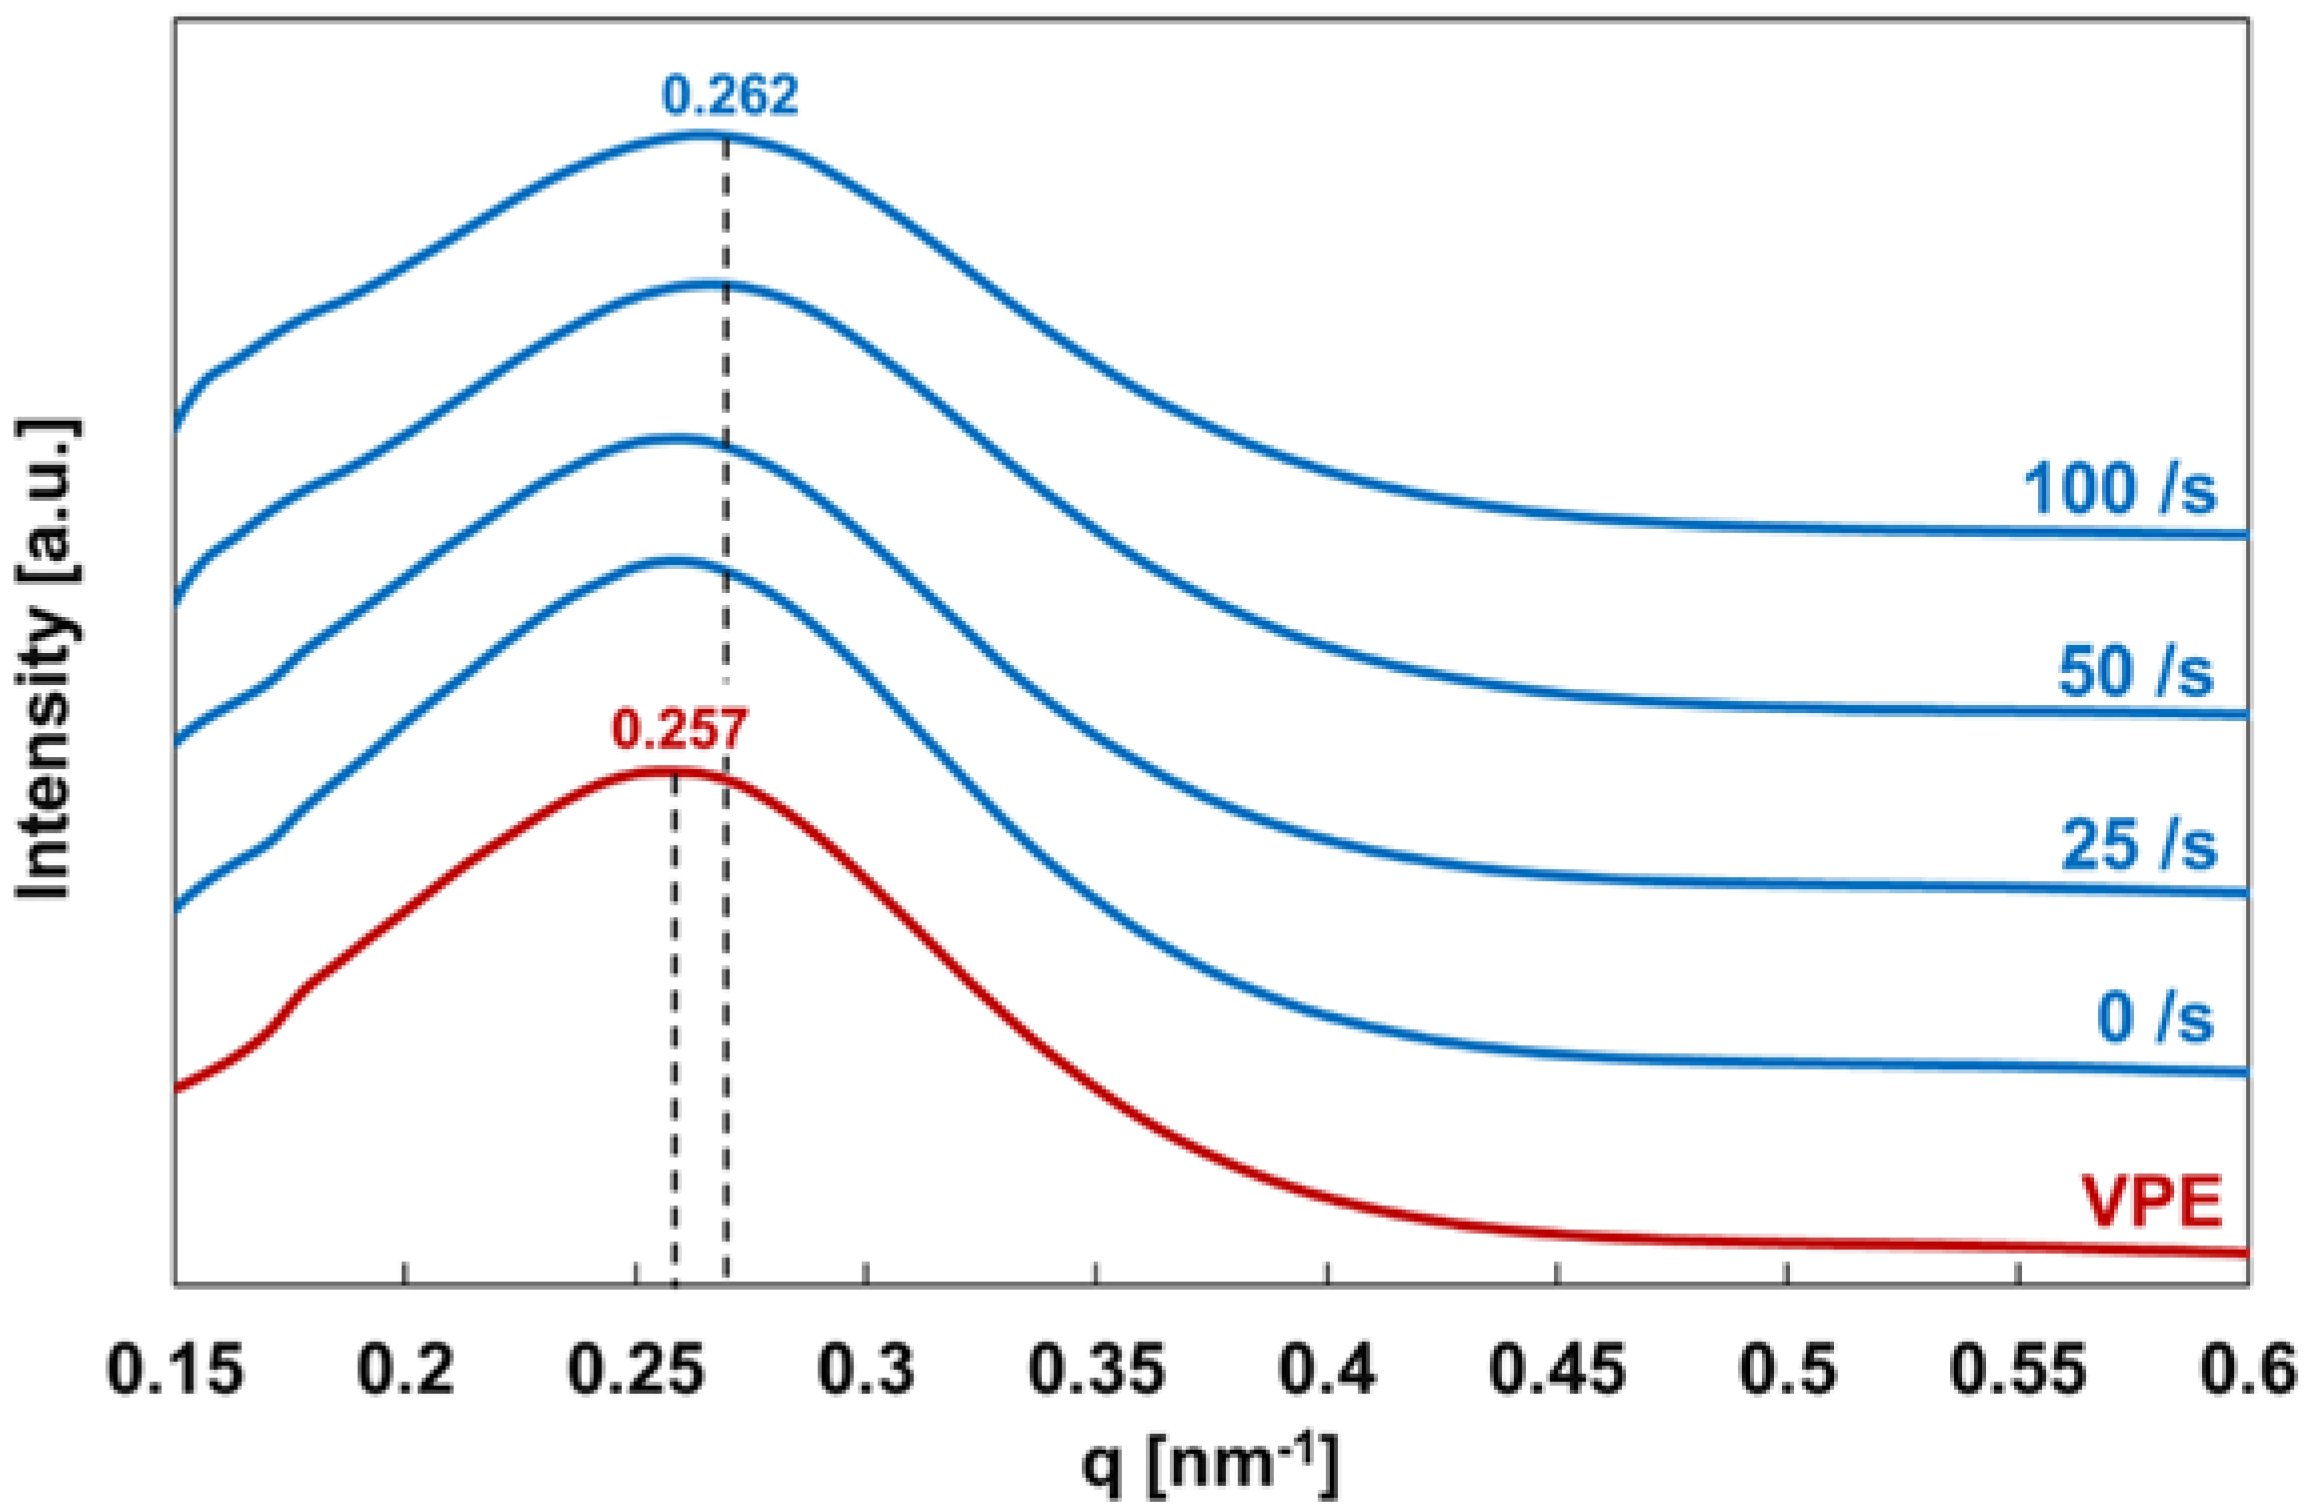
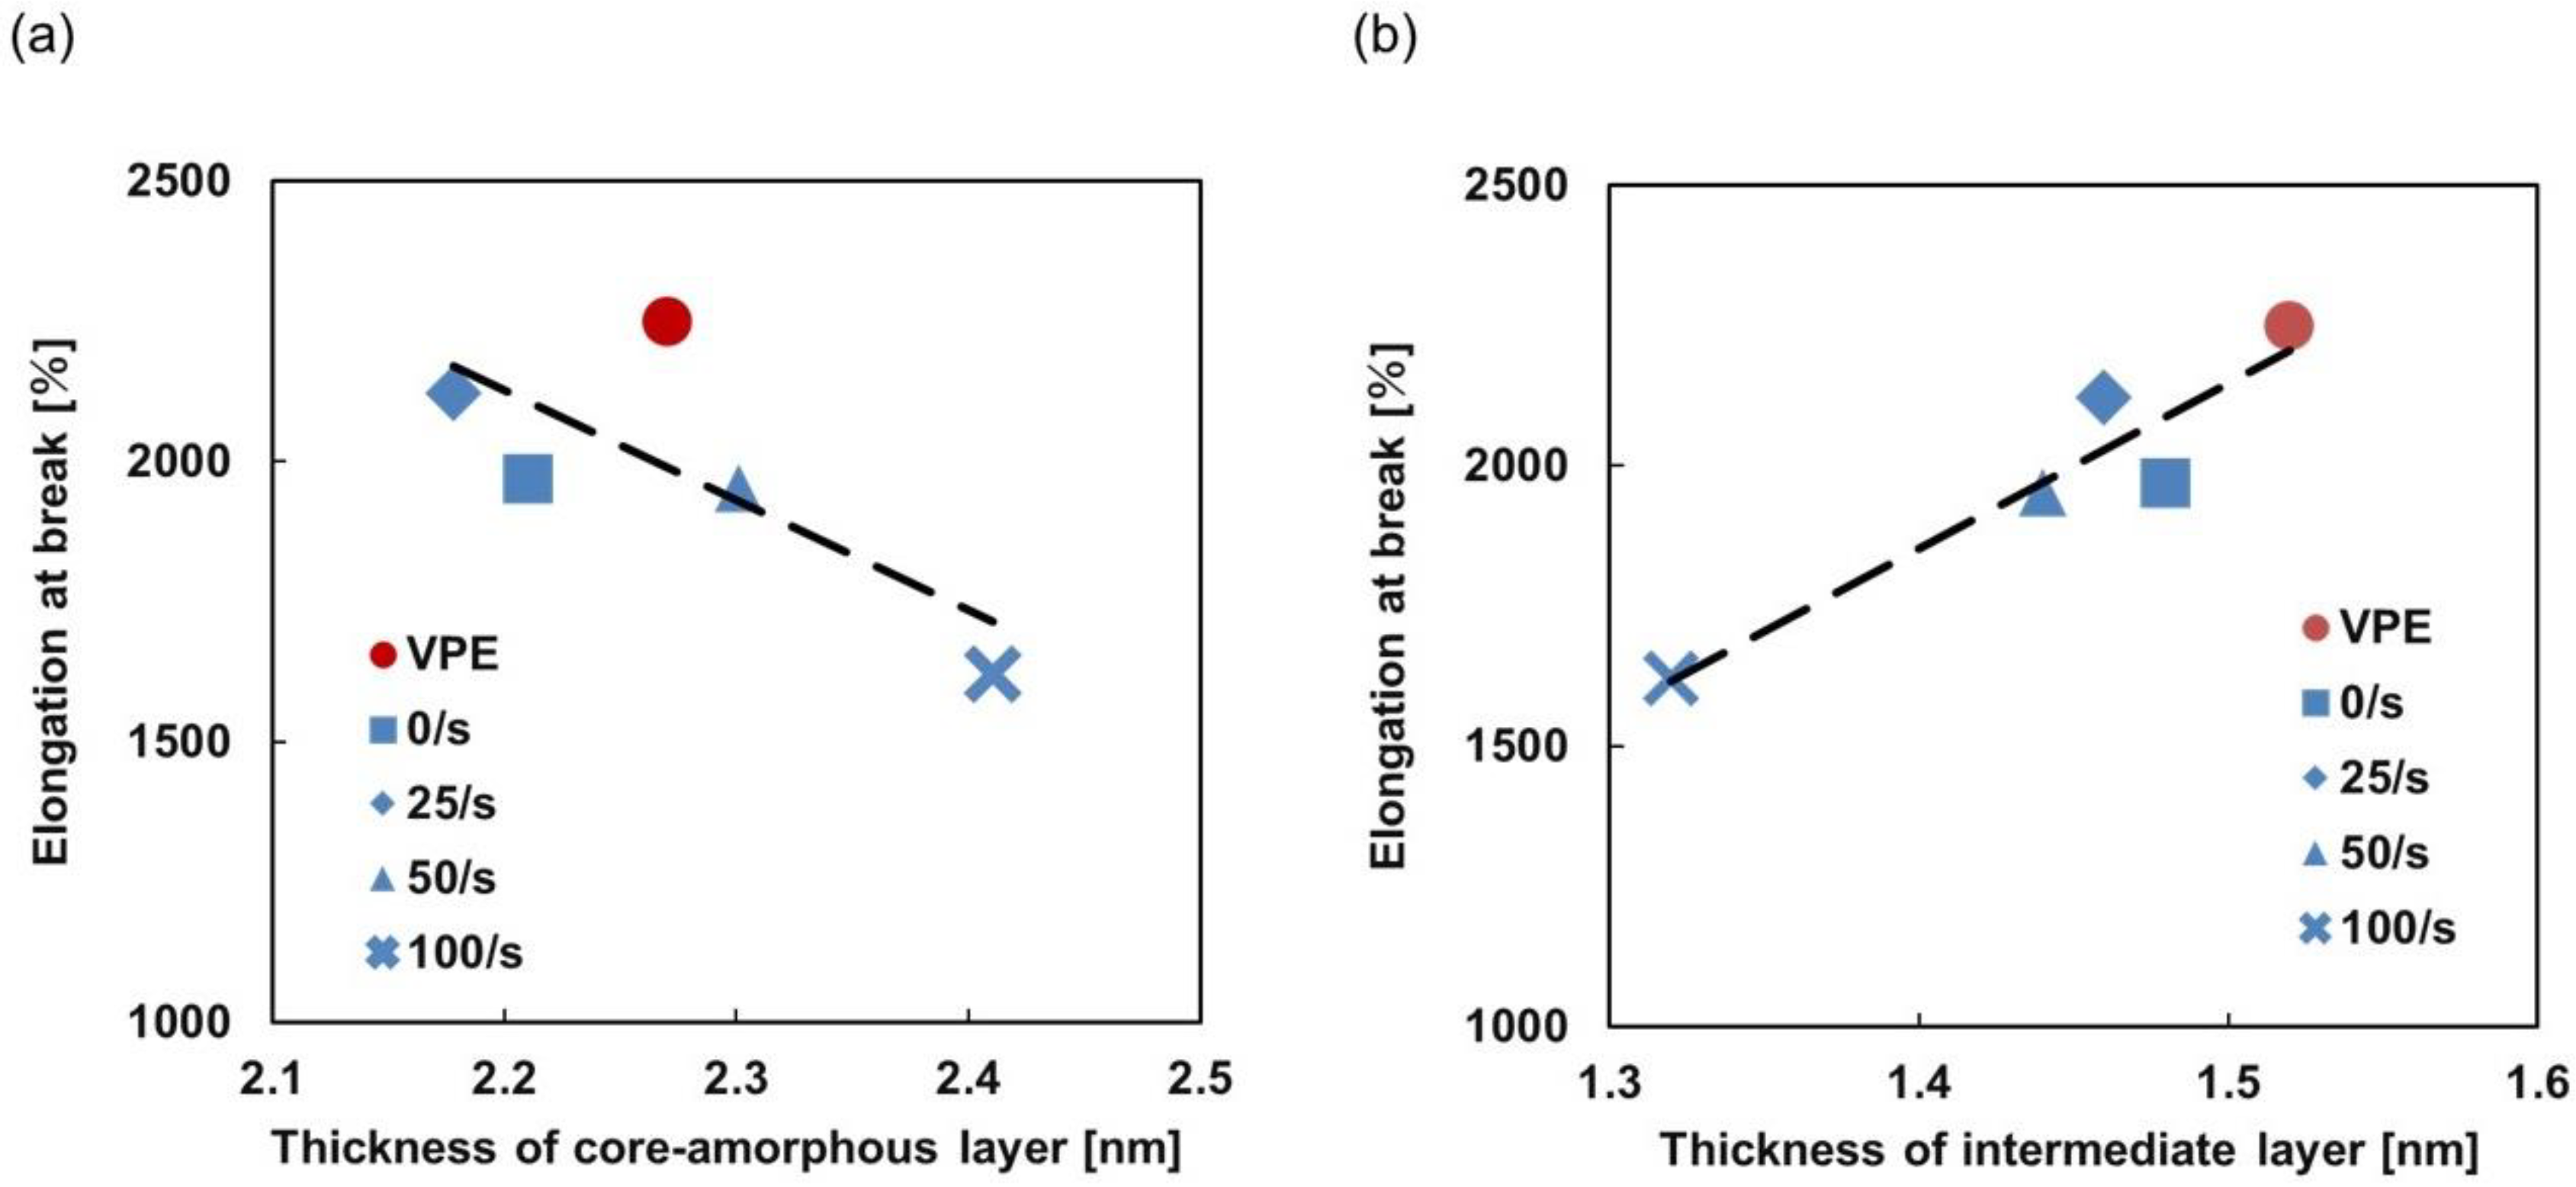
3.2.2. Degree of Crystallinity and Thickness of Lamellar Structure Evaluated by SAXS
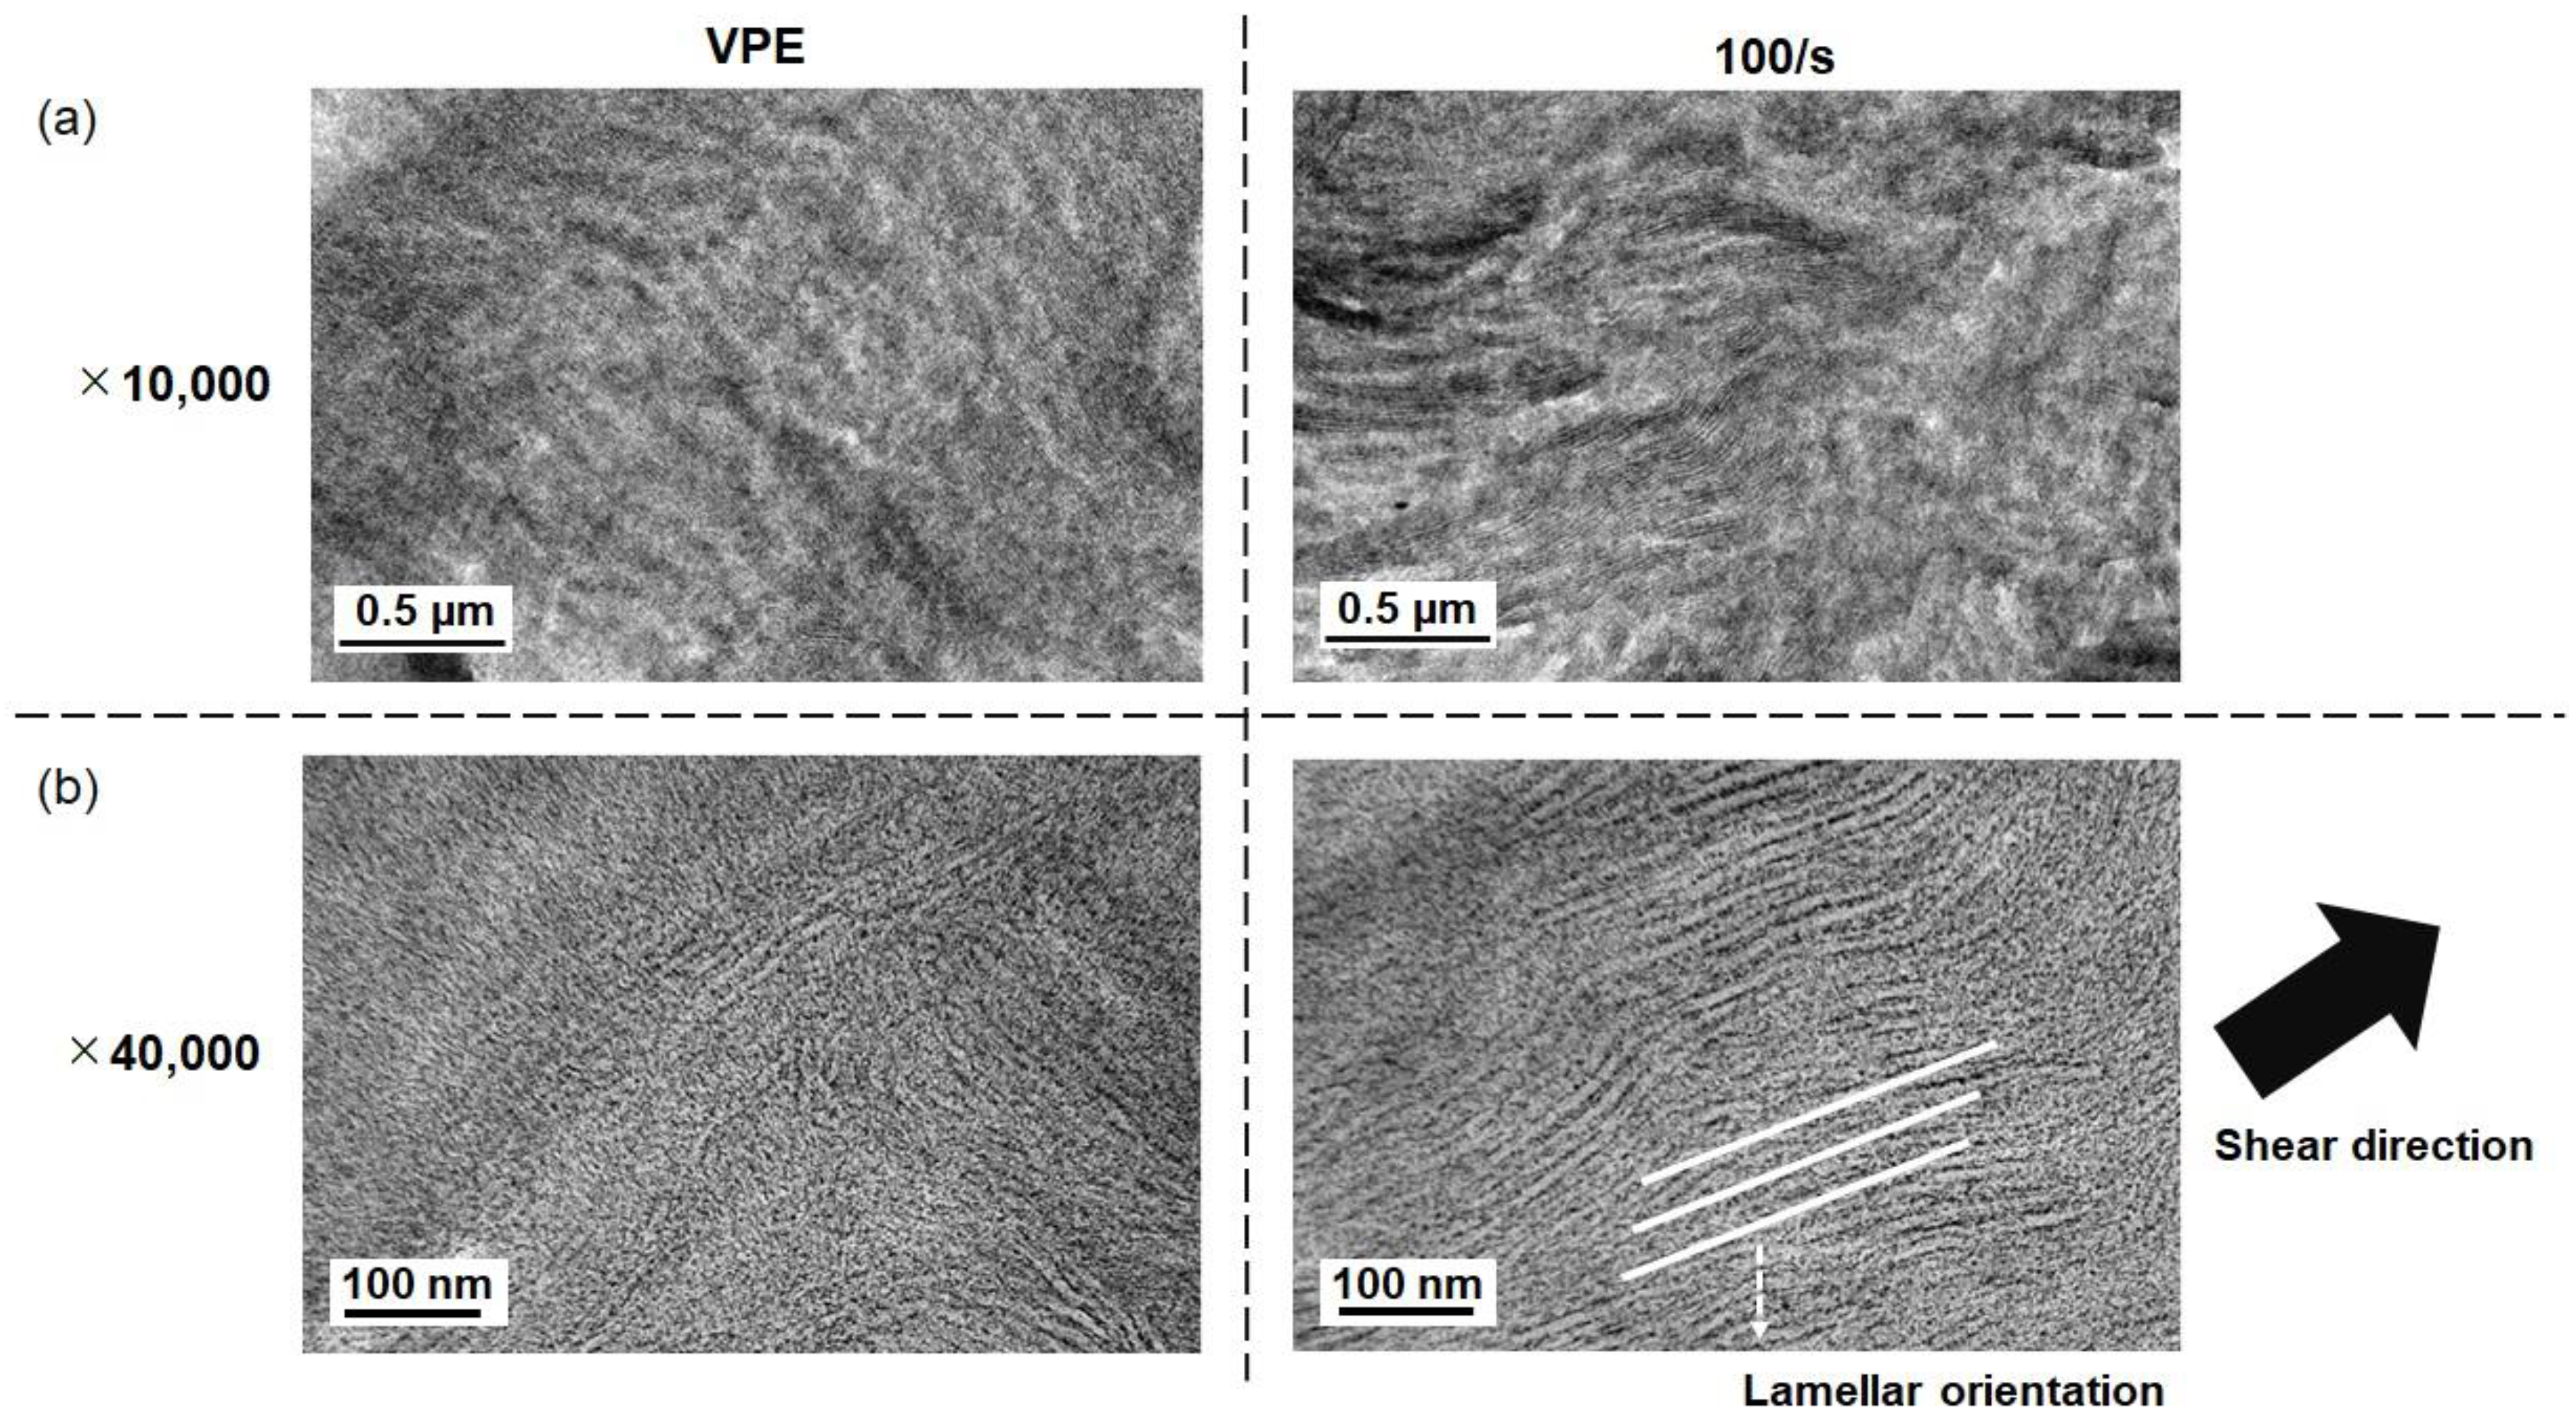
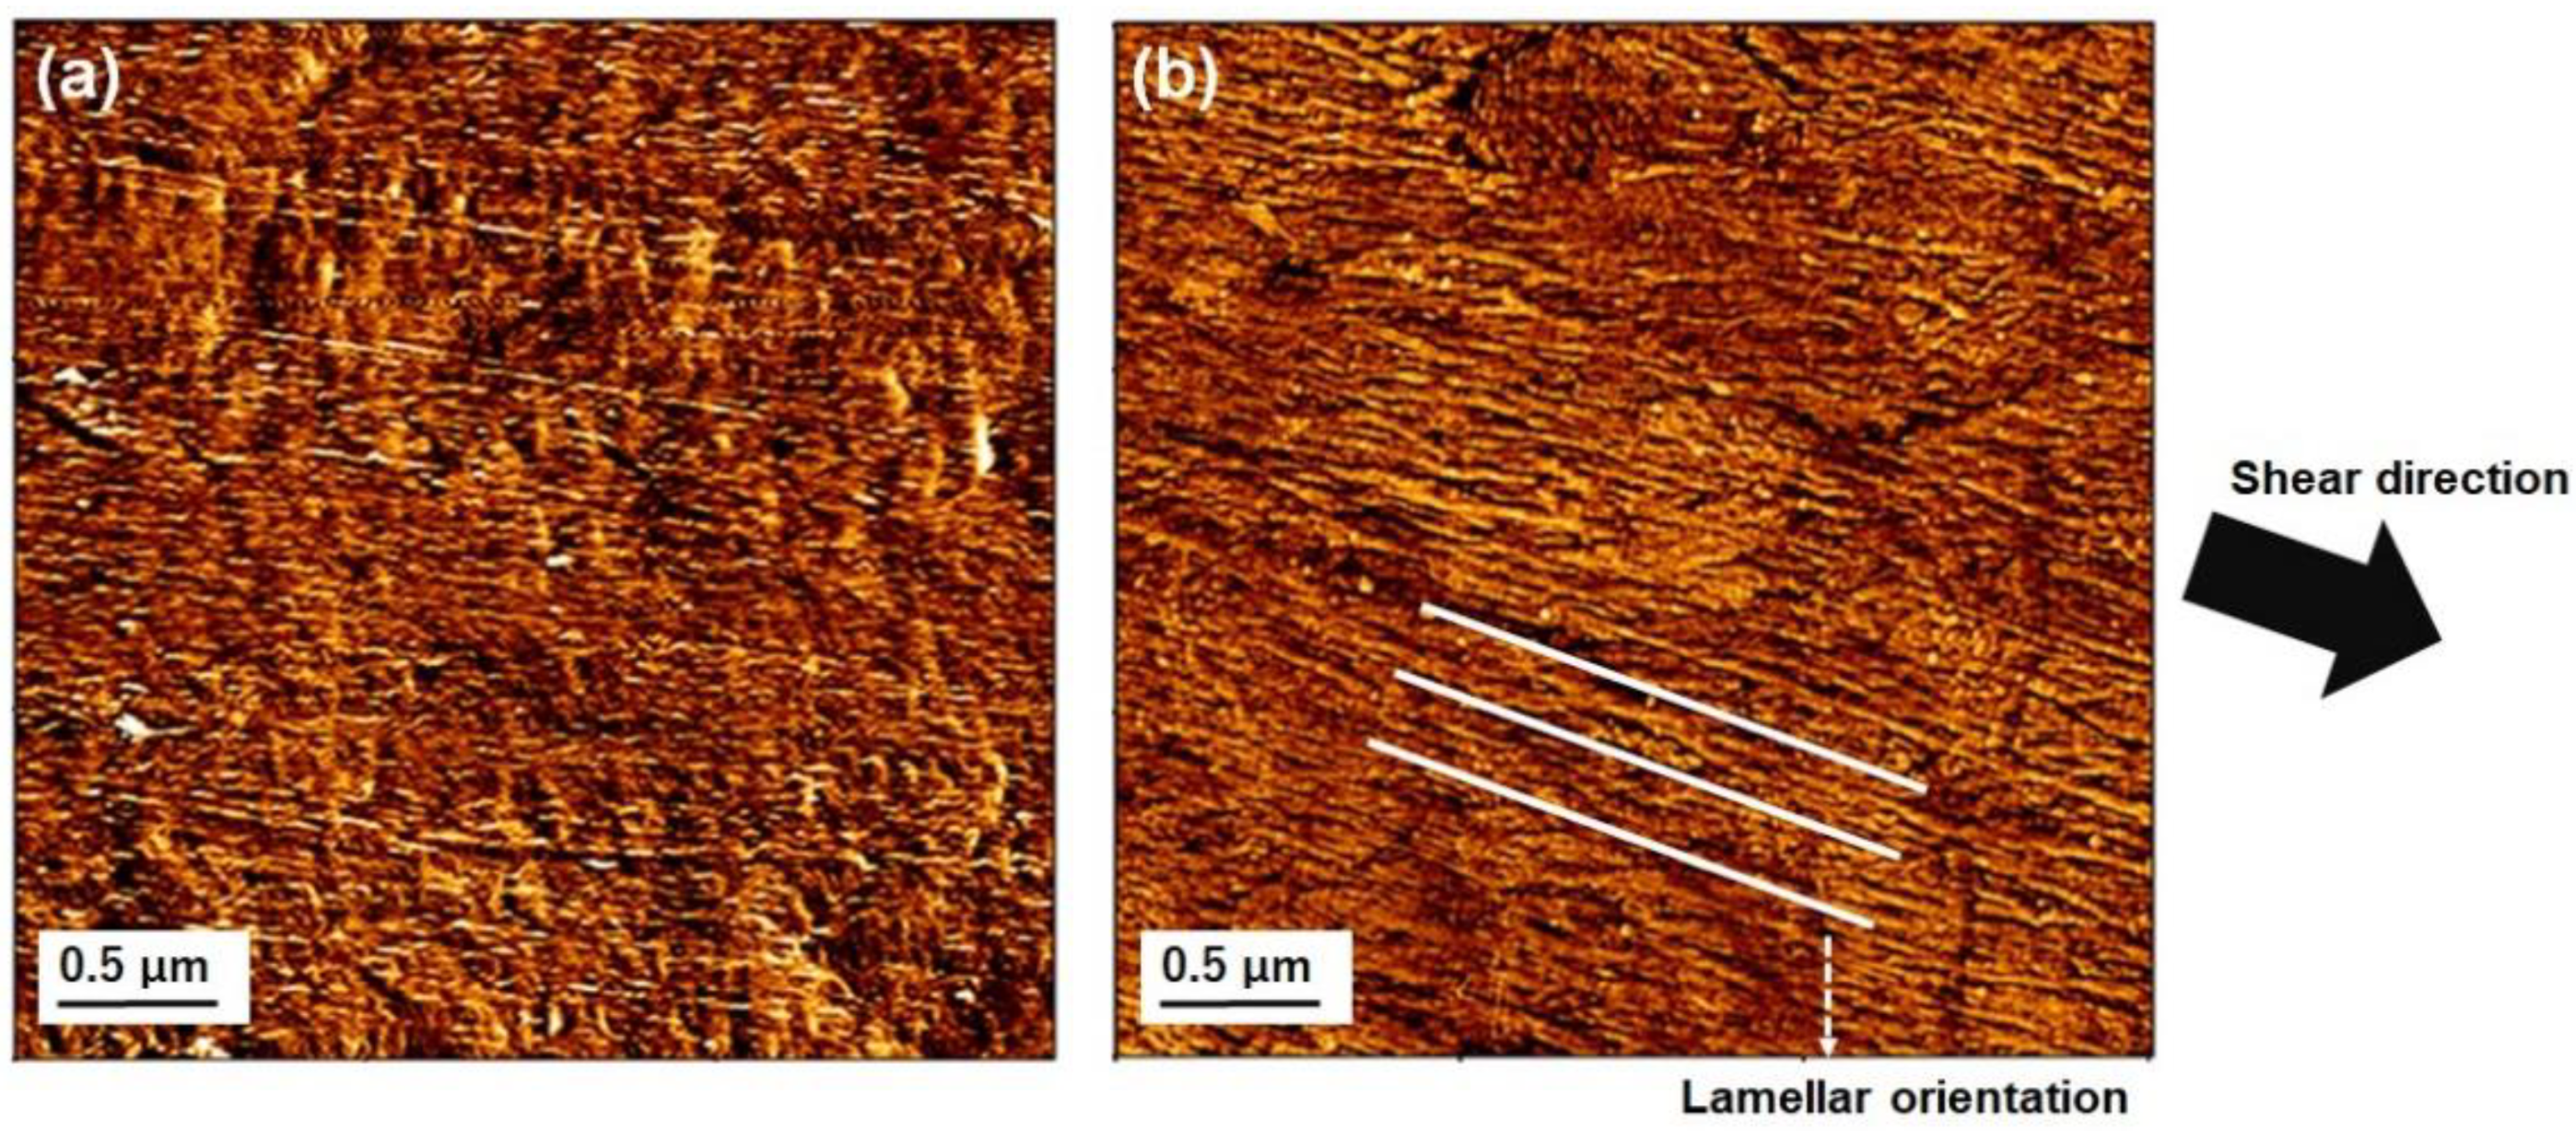
3.3. Morphological Observation
3.4. Evaluation of Molecular Weight and Chemical Composition
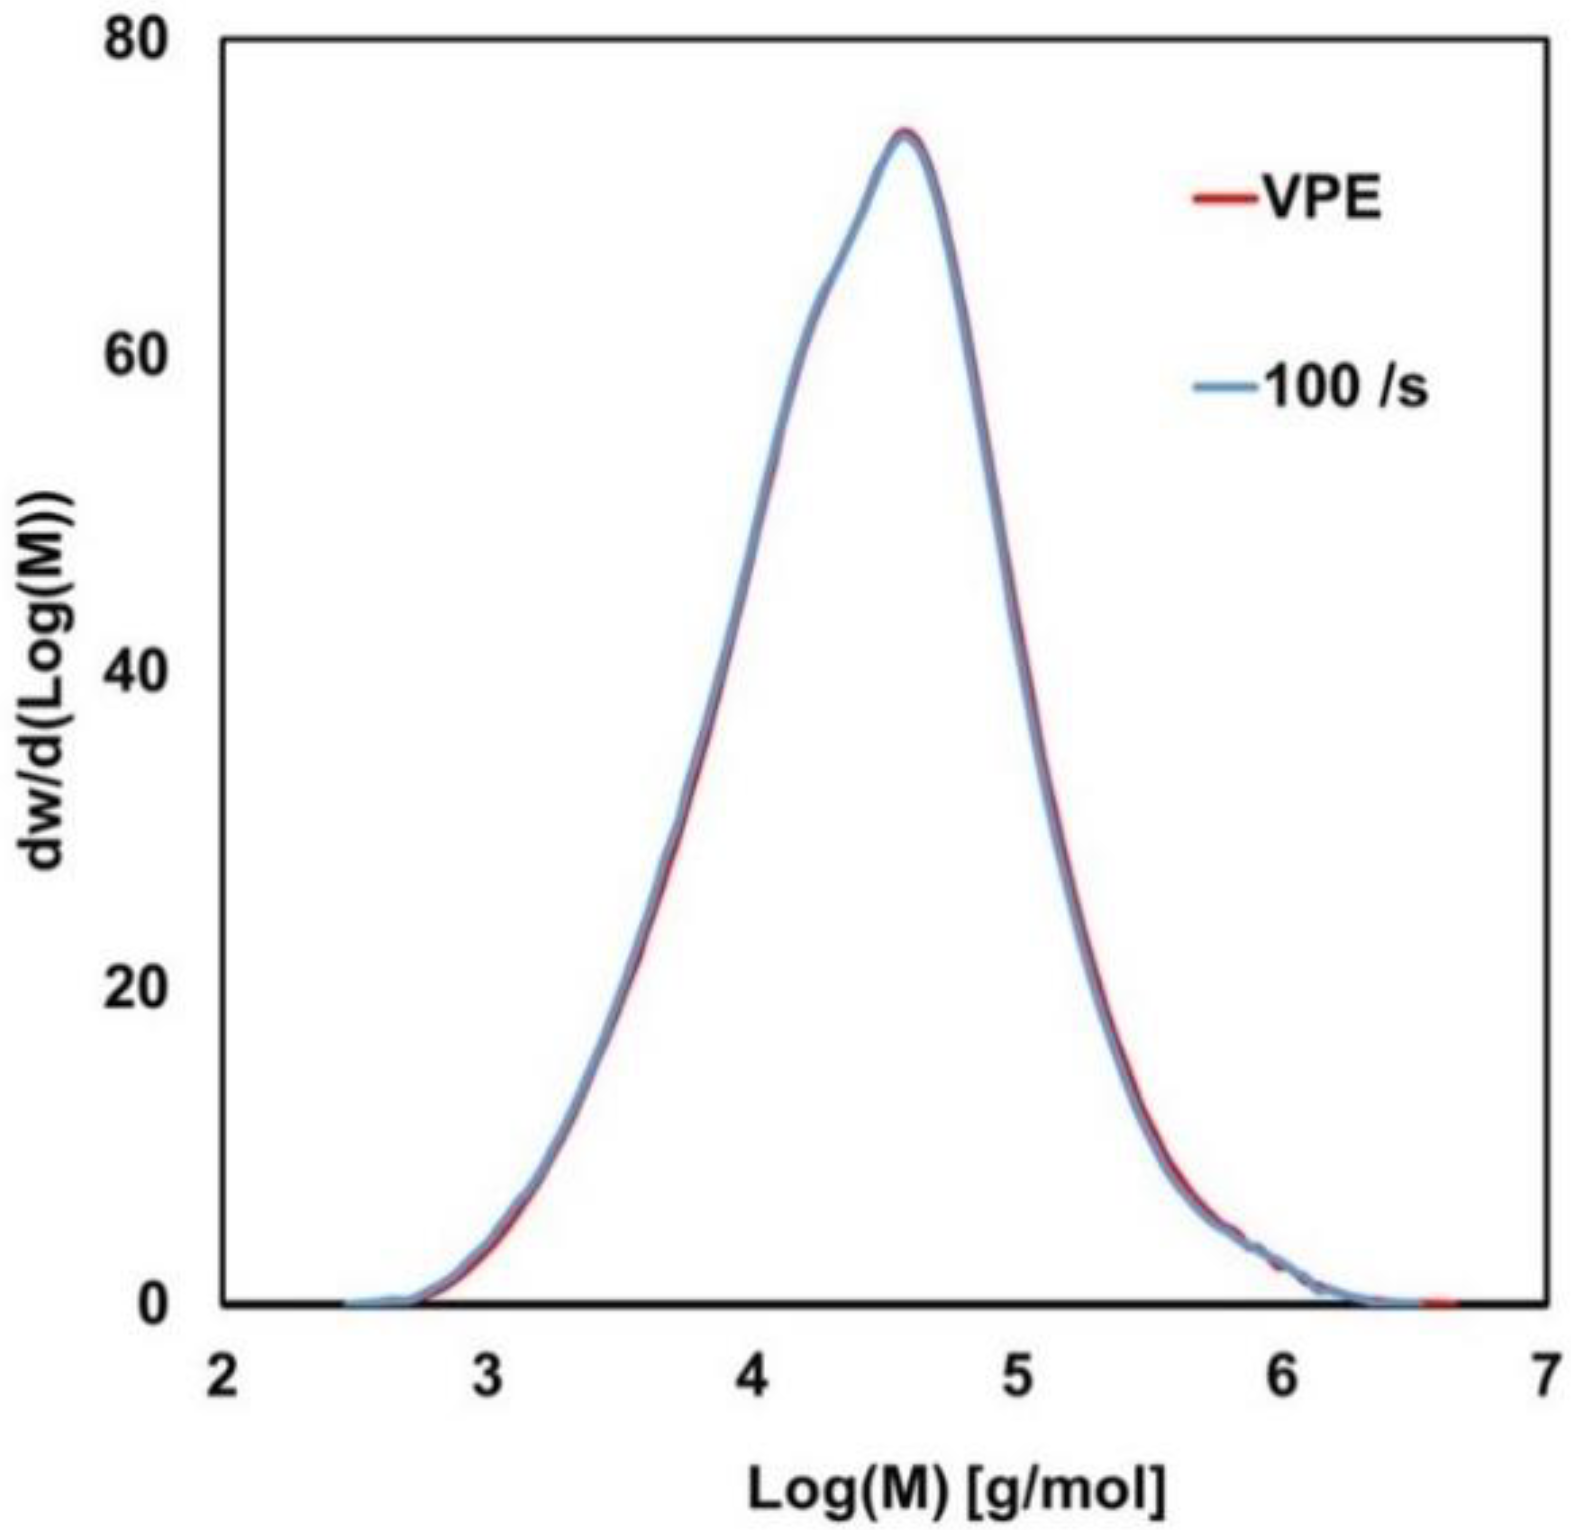
3.4.1. Averaged Molecular Weight and Molecular Weight Distribution
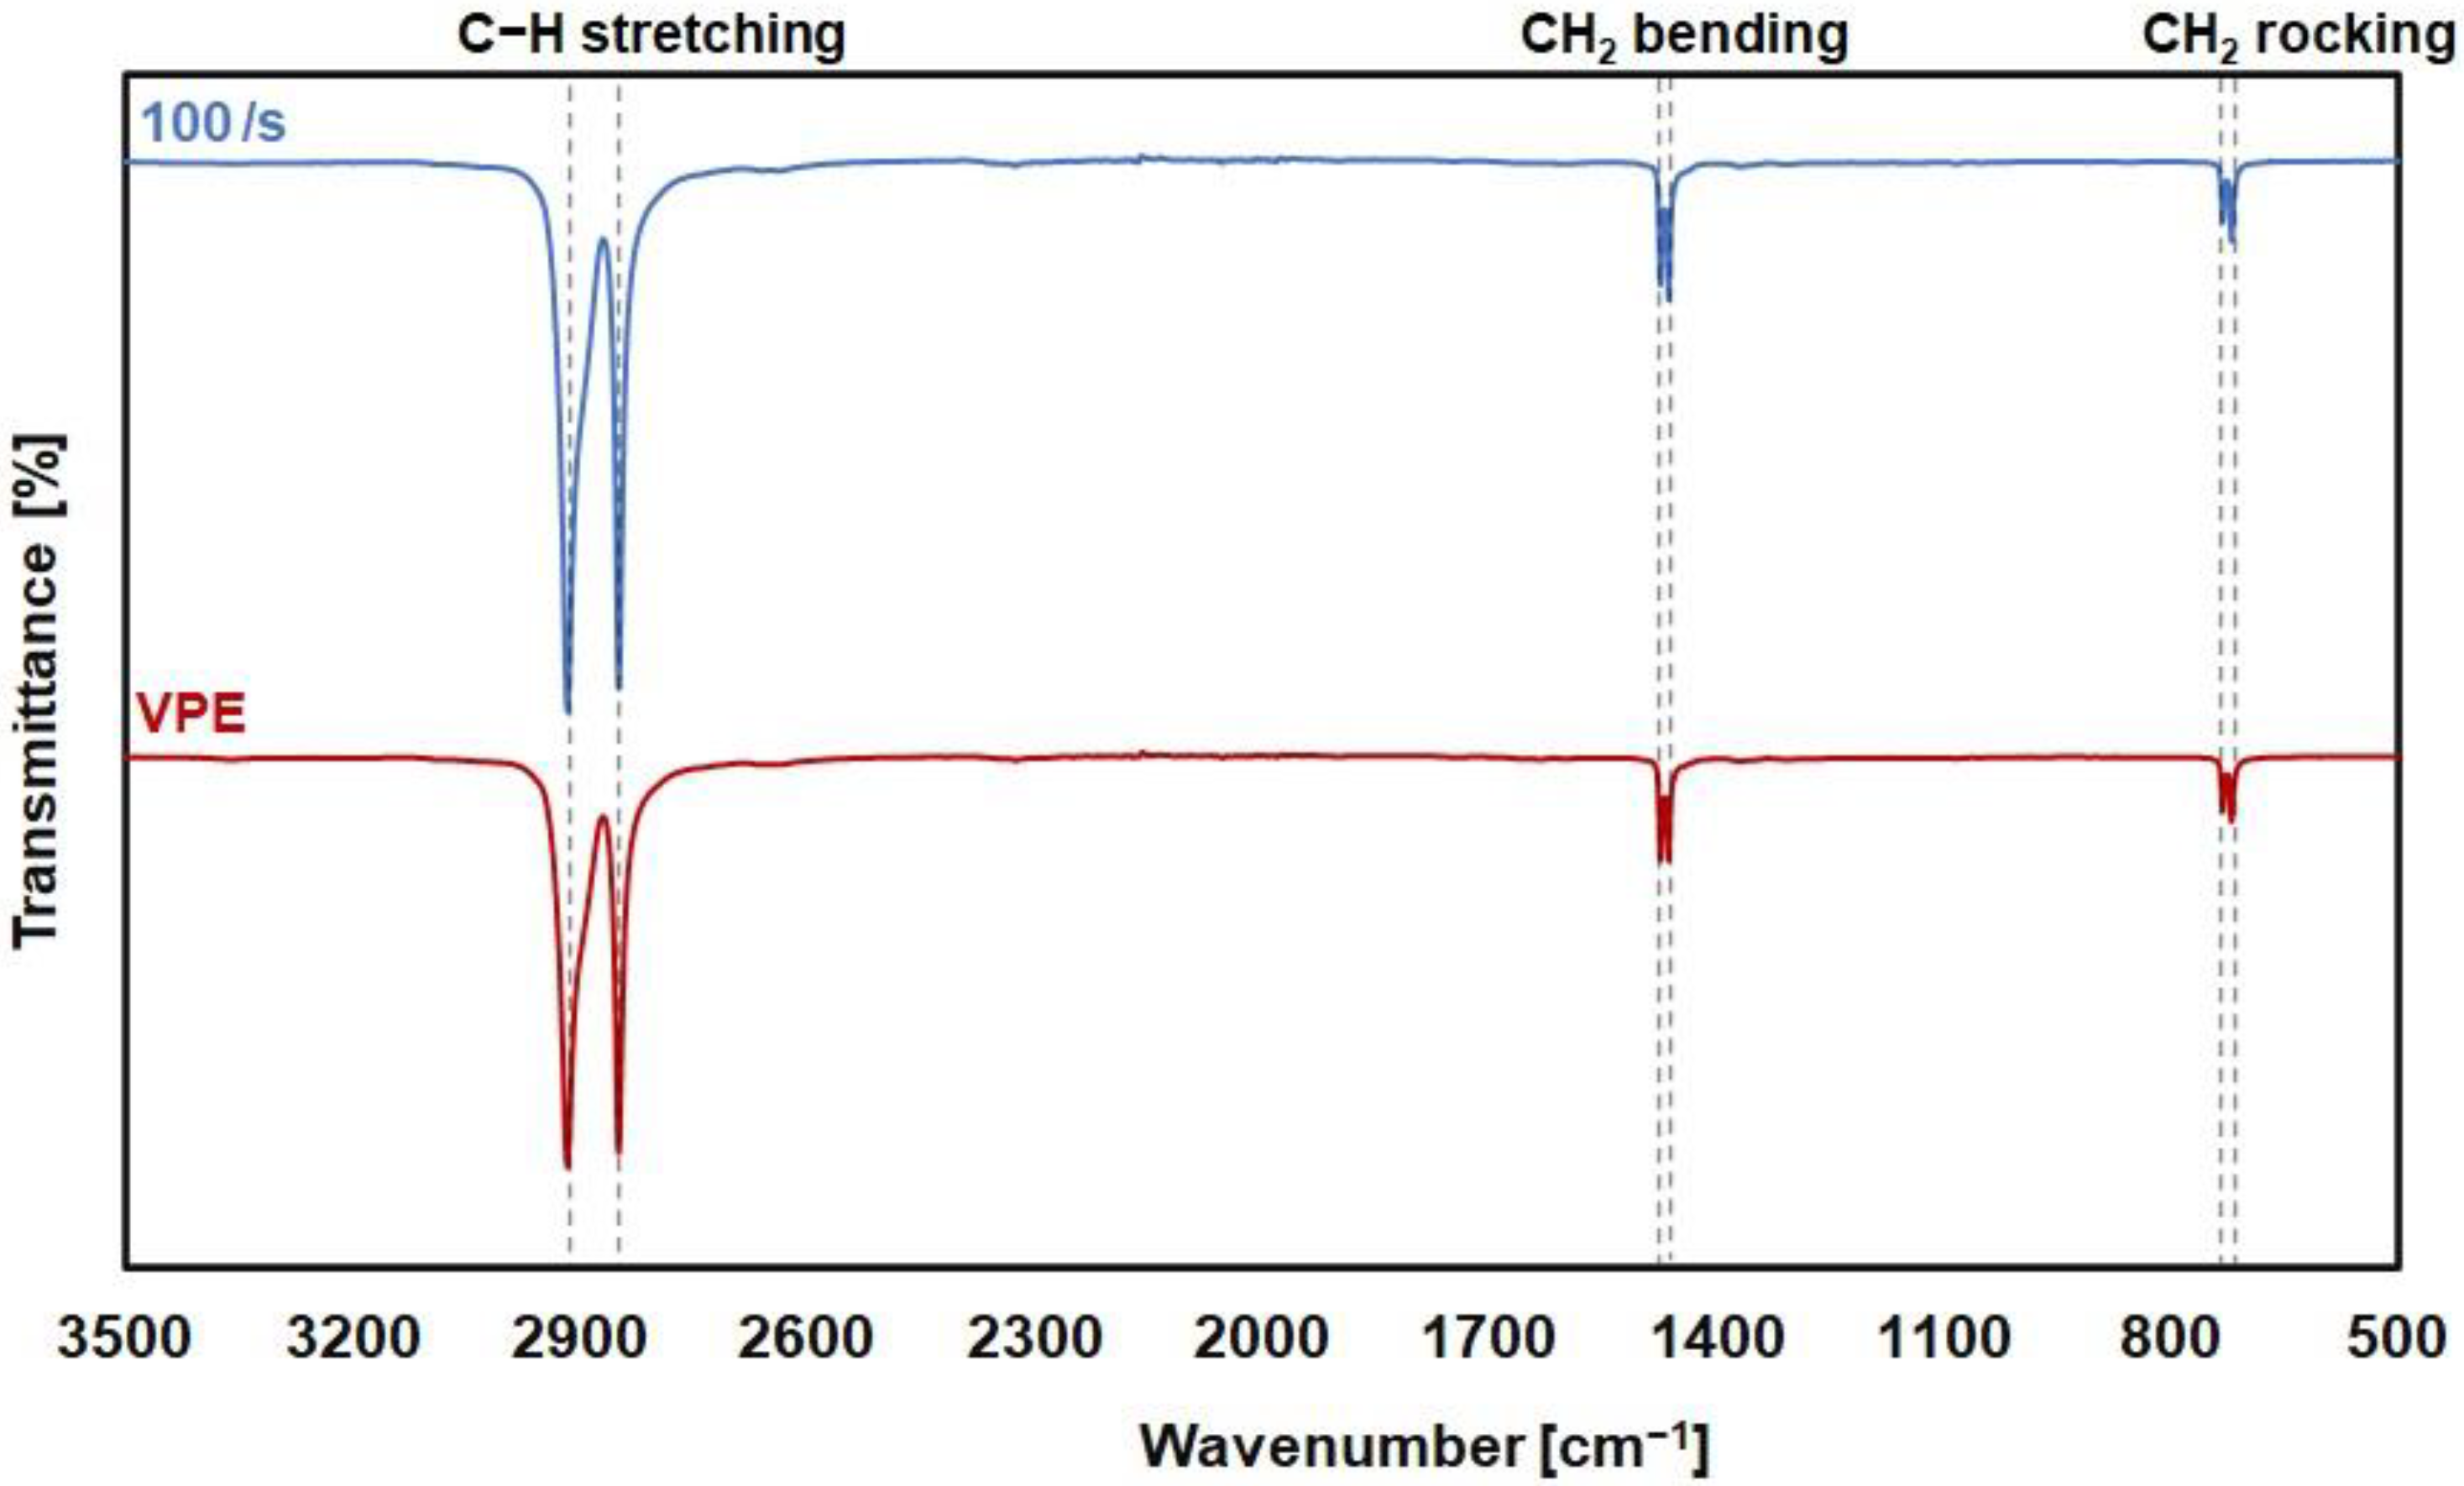
3.4.2. Chemical Composition
4. Conclusions
Author Contributions
Funding
Institutional Review Board Statement
Informed Consent Statement
Data Availability Statement
Conflicts of Interest
References
- Geyer, R.; Jambeck, J.R.; Law, K.L. Production, use, and fate of all plastics ever made. Sci. Adv. 2017, 3, e1700782. [Google Scholar] [CrossRef] [Green Version]
- Plastic Waste Management Institute. An Introduction to Plastic Recycling. 2019. Available online: http://www.pwmi.or.jp/ei/plastic_recycling_2019.pdf (accessed on 16 July 2021).
- Beasmont, N.J.; Aanesen, M.; Austen, M.C.; Börger, T.; Clark, J.R.; Cole, M.; Hooper, T.; Lindeque, P.K.; Pascoe, C.; Wyles, J.R. Global ecological, social and economic impacts of marine plastic. Mar. Pollut. Bull. 2019, 142, 189–195. [Google Scholar] [CrossRef]
- Ministry of the Environment. Resource Circulation Strategy for Plastics. Available online: https://www.env.go.jp/en/focus/jeq/issue/pdf/Volume20January2018.pdf (accessed on 16 July 2021).
- Dodbiba, G.; Takahashi, K.; Sadaki, J.; Fujita, T. The recycling of plastic wastes from discarded TV sets: Comparing energy recovery with mechanical recycling in the context of life cycle assessment. J. Clean. Prod. 2008, 16, 458–470. [Google Scholar] [CrossRef]
- Briassoulis, D.; Aristopoulou, A.; Bonora, M.; Verlodt, I. Degradation characterisation of agricultural low-density polyethylene films. Biosyst. Eng. 2004, 88, 131–143. [Google Scholar] [CrossRef]
- Ragaert, K.; Delva, L.; Geem, K.V. Mechanical and chemical recycling of solid plastic waste. Waste Manag. 2017, 69, 24–58. [Google Scholar] [CrossRef] [PubMed]
- Tominaga, A.; Sekiguchi, H.; Nakano, R.; Yao, S.; Takatori, E. Thermal process-dependence of the mechanical properties and inner structures of pre-consumer recycled polypropylene. AIP Conf. Proc. 2015, 1664, 150011. [Google Scholar]
- Wang, Z.; Ju, J.; Yang, J.; Ma, Z.; Liu, D.; Cui, K.; Yang, H.; Chang, J.; Huang, N.; Li, L. The non-equilibrium phase diagrams of flow-induced crystallization and melting of polyethylene. Sci. Rep. 2016, 6, 32968. [Google Scholar] [CrossRef] [PubMed]
- Li, K.; Matuba, G. Effects of relaxation time and zero shear viscosity on structural evolution of linear low-density polyethylene in shear flow. J. Appl. Polym. Sci. 2018, 135, 46053. [Google Scholar] [CrossRef]
- Liu, Y.; Gao, S.; Hsiao, B.S.; Norman, A.; Tous, A.H.; Throckmorton, J.; Doufas, A.; Zhang, Y. Shear induced crystallization of bimodal and unimodal high density polyethylene. Polymer 2018, 153, 223–231. [Google Scholar] [CrossRef]
- Abad, M.J.; Ares, A.; Barral, L.; Cano, J.; Díez, F.J.; García-Garabal, S.; Ramírez, C. Effects of a mixture of stabilizers on the structure and mechanical properties of polyethylene during reprocessing. J. Appl. Polym. Sci. 2004, 92, 3910–3916. [Google Scholar] [CrossRef]
- Madi, N.K. Thermal and mechanical properties of injection molded recycled high density polyethylene blends with virgin isotactic polypropylene. Mater. Des. 2013, 46, 435–441. [Google Scholar] [CrossRef]
- Mourad, A.I. Thermo-mechanical characteristics of thermally aged polyethylene/polypropylene blends. Mater. Des. 2010, 31, 918–929. [Google Scholar] [CrossRef]
- Franck, A. Understanding Rheology of Thermoplastic Polymers. TA Instruments Application Note No. AAN013. 2008. Available online: http://www.tainstruments.com/pdf/literature/AAN013_V_1_U_Thermoplast.pdf (accessed on 27 August 2021).
- Bagley, E.B.; Storey, S.H.; West, D.C. Post extrusion swelling of polyethylene. J. Appl. Polym. Sci. 1963, 7, 1661–1672. [Google Scholar] [CrossRef]
- Gopalan, M.R.; Mandelkern, L. Degree of crystallinity of linear polyethylene from wide-angle X-ray diffraction. Polym. Lett. 1967, 5, 925–929. [Google Scholar] [CrossRef]
- Papajani, B.; Qoku, E.; Malkaj, P.; Dilo, T. The study of phase compound and the degree of crystallinity of recycled LDPE by X-ray diffractometer and optical microscope. Int. J. Sci. Res. 2015, 4, 2228–2232. [Google Scholar]
- Yao, G.; Duan, T.; Chi, E.; Guo, P.; Li, Y.; Wang, Z. Microbeam two-dimensional small-angle X-ray scattering investigating the effects of reduced graphene oxide on local microstructures of high-density polyethylene/reduced graphene oxide nanocomposite bars. R. Soc. Open Sci. 2019, 6, 181866. [Google Scholar] [CrossRef] [Green Version]
- Strobl, G.R.; Schneider, M.J.; Voigt-Martin, I.G. Model of partial crystallization and melting derived from small-angle X-ray scattering and electron microscopic studies on low-density polyethylene. J. Polym. Sci. Polym. Phys. Ed. 1980, 18, 1361–1381. [Google Scholar] [CrossRef]
- Strobl, G.R.; Schneider, M. Direct evaluation of the electron density correlation function of partially crystalline polymers. J. Polym. Sci. Polym. Phys. Ed. 1980, 18, 1343–1359. [Google Scholar] [CrossRef]
- Ryan, A.J. A direct method to determine the degree of crystallinity and lamellar thickness of polymers: Application to polyethylene. Polymer 1994, 35, 4537–4544. [Google Scholar] [CrossRef]
- Furukawa, T.; Sato, H.; Kita, Y.; Matsukawa, K.; Yamaguchi, H.; Ochiai, S.; Siesler, H.W.; Ozaki, Y. Molecular structure, crystallinity and morphology of polyethylene/polypropylene blends studied by Raman mapping, scanning electron microscopy, wide angle X-ray diffraction, and differential scanning calorimetry. Polym. J. 2006, 38, 1127–1136. [Google Scholar] [CrossRef] [Green Version]
- Jung, M.R.; Horgen, F.D.; Orski, S.V.; Rodriguez, V.C.; Beers, K.L.; Balazs, G.H.; Jones, T.T.; Work, T.M.; Brignac, K.C.; Royer, S.; et al. Validation of ATR FT-IR to identify polymers of plastic marine debris, including those ingested by marine organism. Mar. Pollut. Bull. 2018, 127, 704–716. [Google Scholar] [CrossRef] [PubMed]
- Qin, H.; Zhang, Z.; Feng, M.; Gong, F.; Zhang, S.; Yang, M. The influence of interlayer cations the photo-oxidative degradation of polyethylene/montmorillonite composite. J. Polym. Sci. B Polym. Phys. 2004, 42, 1127–1136. [Google Scholar] [CrossRef]
- Yadegari, A.; Morshedian, J.; Khonakdar, H.A.; Wagenknecht, U.; Heinrich, G.; Malanin, M.; Eichhorn, K.J.; Fischer, D. Correlation of crystal alignment with interphase content in oriented high density polyethylene cast films. CrystEngComm 2016, 18, 2337–2346. [Google Scholar] [CrossRef]
- Yadegari, A.; Morshedian, J.; Khonakdar, H.A.; Wagenknecht, U.; Heinrich, G. Influence of precursor film microstructure on properties of HDPE microporous membranes prepared by stretching. J. Appl. Polym. Sci. 2017, 134, 44725. [Google Scholar] [CrossRef]


| Sample | Elongation at Break [%] | Toughness [MJ/m3] | Young’s Modulus [MPa] | Yield Stress [MPa] | Tensile Fracture Stress [MPa] |
|---|---|---|---|---|---|
| VPE | 2248.4 ± 72.9 | 350.6 ± 14.5 | 384.6 ± 21.2 | 17.5 ± 0.8 | 23.8 ± 0.8 |
| 0/s | 1969.0 ± 159.2 | 268.6 ± 7.2 | 268.6 ± 22.5 | 13.9 ± 0.3 | 18.7 ± 0.3 |
| 25/s | 2122.8 ± 70.6 | 269.7 ± 6.1 | 284.7 ± 7.9 | 13.8 ± 0.2 | 18.6 ± 0.2 |
| 50/s | 1951.8 ± 398.3 | 313.9 ± 14.0 | 314.5 ± 72.3 | 16.3 ± 0.8 | 22.4 ± 0.9 |
| 100/s | 1620.6 ± 370.9 | 342.6 ± 6.5 | 277.7 ± 62.9 | 17.5 ± 0.3 | 25.1 ± 0.2 |
| Sample | qmax [nm−1] | Long Period (L0) [nm] |
|---|---|---|
| VPE | 0.257 | 24.4 |
| 0/s | 0.257 | 24.4 |
| 25/s | 0.257 | 24.4 |
| 50/s | 0.270 | 23.3 |
| 100/s | 0.262 | 23.9 |
| Sample | Crystallinity [%] | Thickness of Lamellar Structure [nm] | |||
|---|---|---|---|---|---|
| Long Period (L0) | Core-Crystalline (dc) | Core-Amorphous (da) | Intermediate Layer (dtr) | ||
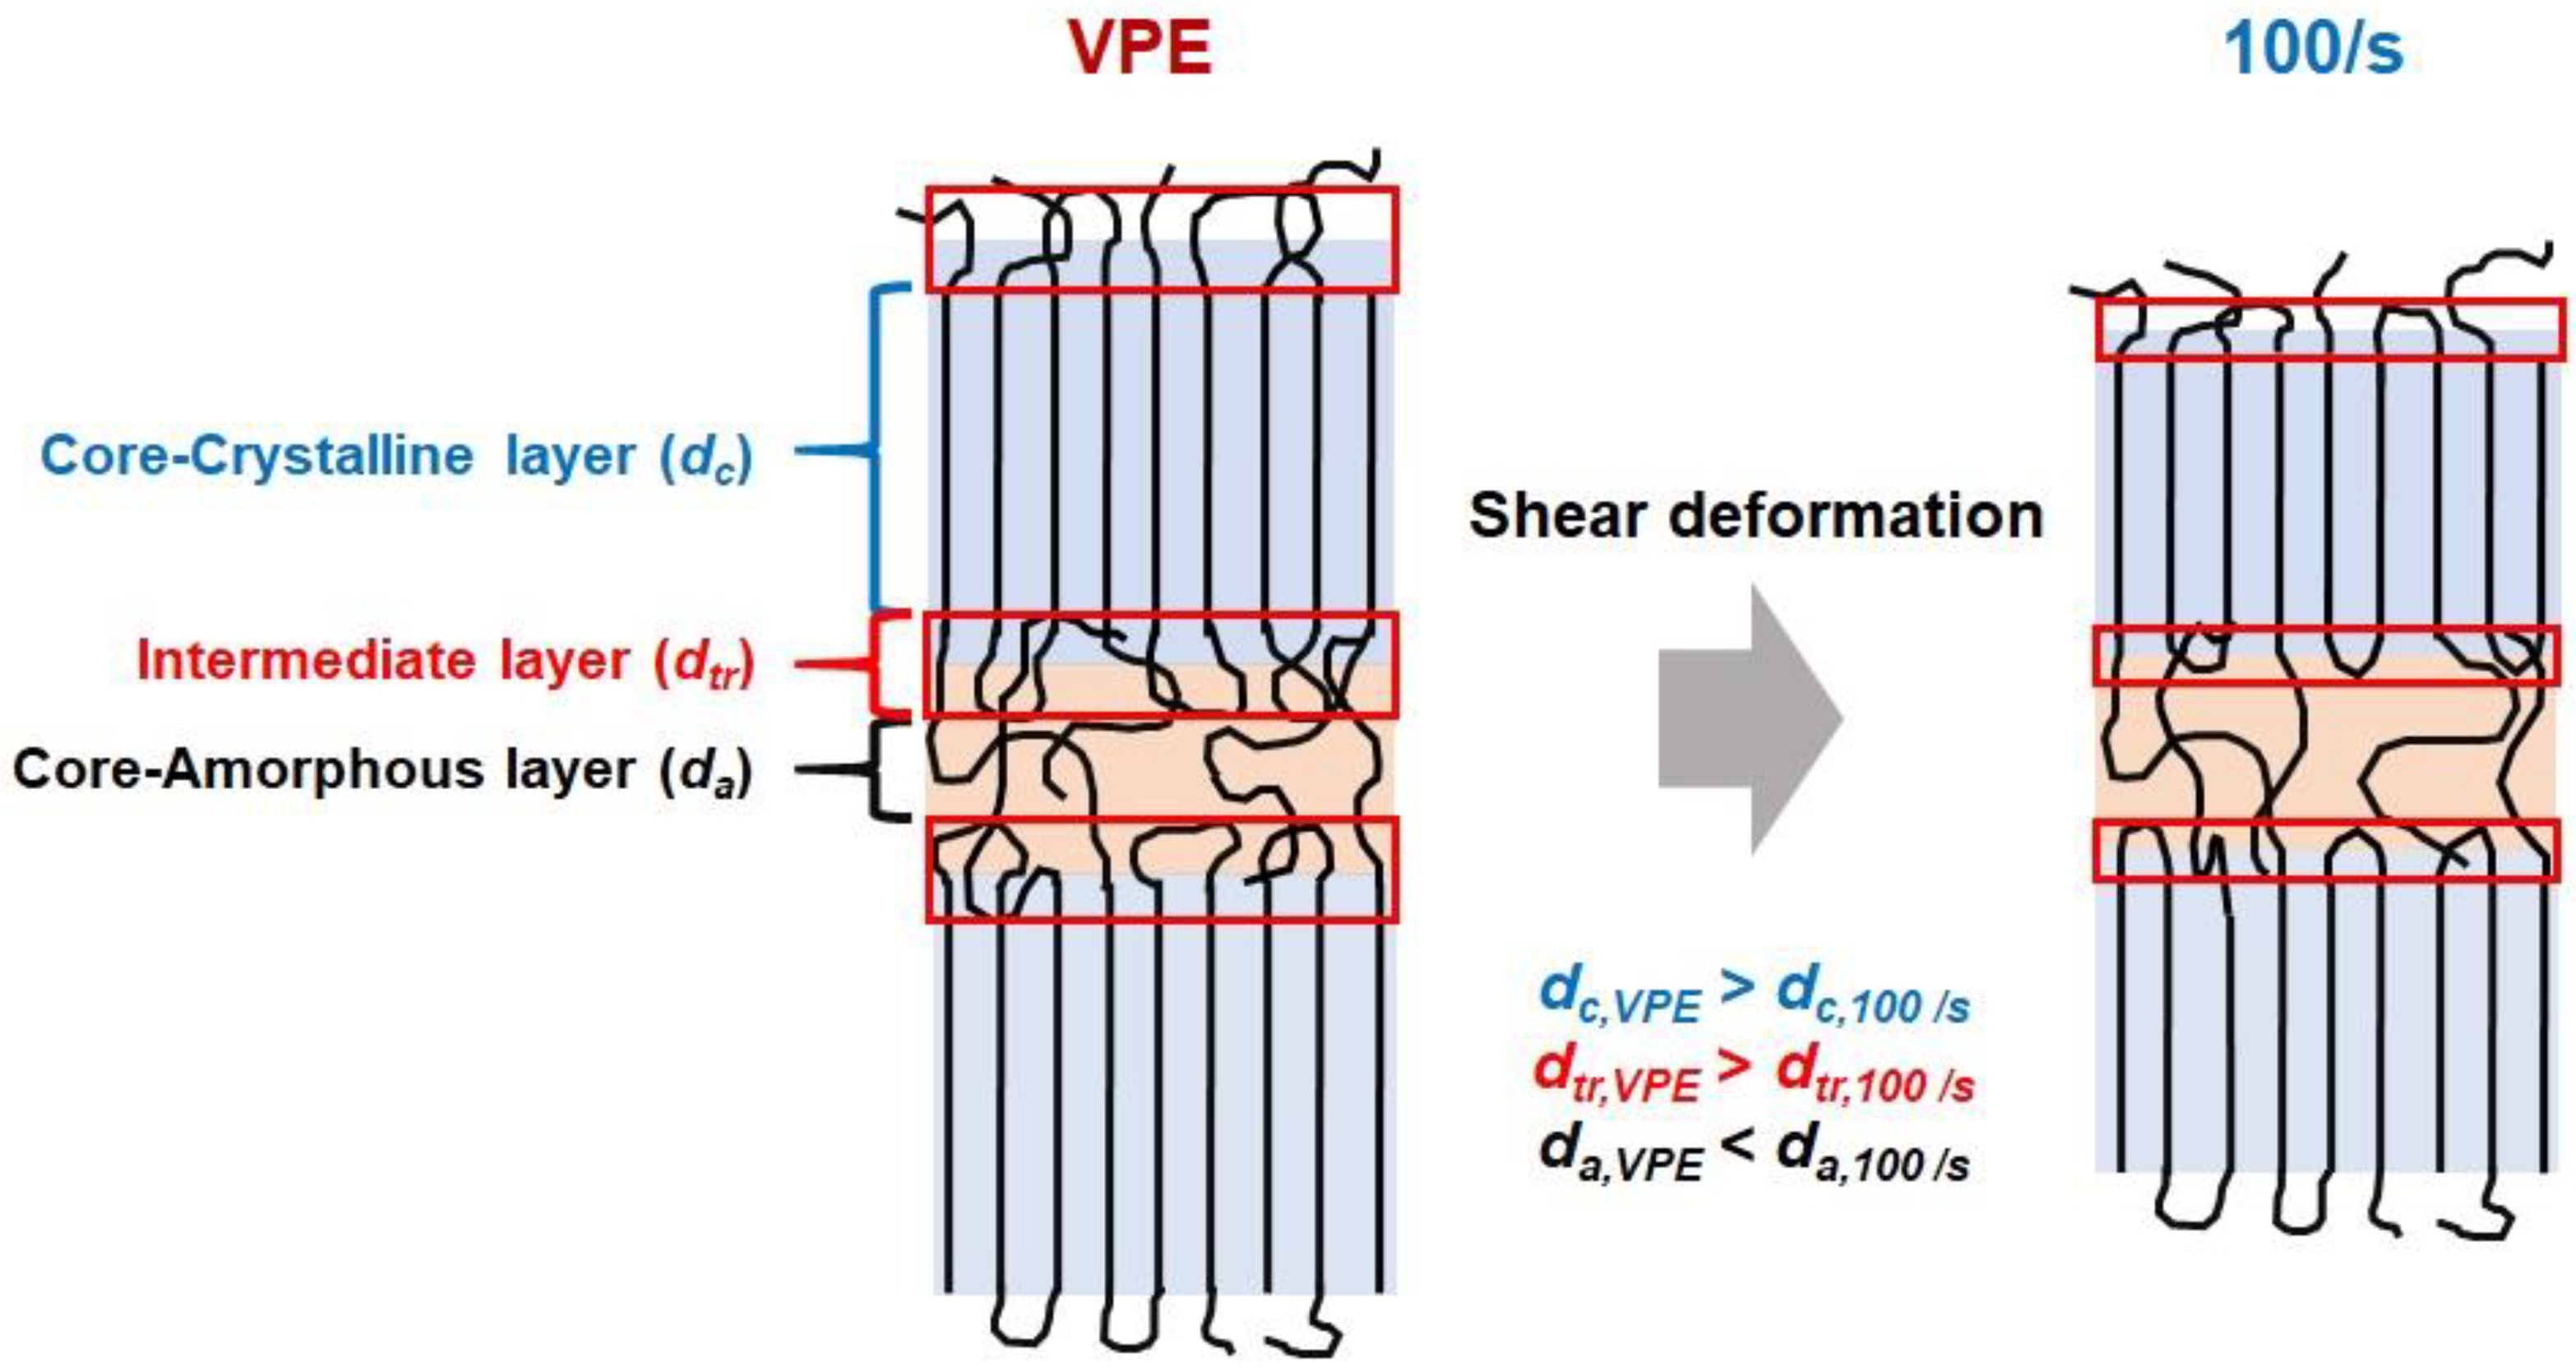
| VPE | 80.47 | 20.80 | 15.49 | 2.27 | 1.52 |
| 0/s | 80.49 | 20.70 | 15.53 | 2.21 | 1.48 |
| 25/s | 80.58 | 20.70 | 15.60 | 2.18 | 1.46 |
| 50/s | 79.57 | 19.80 | 14.62 | 2.30 | 1.44 |
| 100/s | 70.70 | 19.80 | 14.75 | 2.41 | 1.32 |
| Sample | Mn [g/mol] | Mw [g/mol] | Mz [g/mol] | Mw/Mn |
|---|---|---|---|---|
| VPE | 27,644 | 156,167 | 825,827 | 5.65 |
| 100/s | 26,249 | 150,914 | 786,072 | 5.75 |
Publisher’s Note: MDPI stays neutral with regard to jurisdictional claims in published maps and institutional affiliations. |
© 2021 by the authors. Licensee MDPI, Basel, Switzerland. This article is an open access article distributed under the terms and conditions of the Creative Commons Attribution (CC BY) license (https://creativecommons.org/licenses/by/4.0/).
Share and Cite
Kaneyasu, H.; Phanthong, P.; Okubo, H.; Yao, S. Investigation of Degradation Mechanism from Shear Deformation and the Relationship with Mechanical Properties, Lamellar Size, and Morphology of High-Density Polyethylene. Appl. Sci. 2021, 11, 8436. https://doi.org/10.3390/app11188436
Kaneyasu H, Phanthong P, Okubo H, Yao S. Investigation of Degradation Mechanism from Shear Deformation and the Relationship with Mechanical Properties, Lamellar Size, and Morphology of High-Density Polyethylene. Applied Sciences. 2021; 11(18):8436. https://doi.org/10.3390/app11188436
Chicago/Turabian StyleKaneyasu, Haruka, Patchiya Phanthong, Hikaru Okubo, and Shigeru Yao. 2021. "Investigation of Degradation Mechanism from Shear Deformation and the Relationship with Mechanical Properties, Lamellar Size, and Morphology of High-Density Polyethylene" Applied Sciences 11, no. 18: 8436. https://doi.org/10.3390/app11188436