
Assessment of the Effect of Phase Change Material (PCM) Glazing on the Energy Consumption and Indoor Comfort of an Office in a Semiarid Climate


1
Department of Construction Engineering and Management, School of Engineering, Pontificia Universidad Católica de Chile, Av. Vicuña Mackenna 4860, Santiago 7820436, RM, Chile
2
Center for Sustainable Urban Development (CEDEUS), Pontificia Universidad Católica de Chile, Santiago 7520245, RM, Chile
3
TEBE Research Group, Department of Energy, Politecnico di Torino, 10129 Torino, Italy
4
UC Energy Research Center, Pontificia Universidad Católica de Chile, Santiago 7820436, RM, Chile
*
Author to whom correspondence should be addressed.
Appl. Sci. 2021, 11(20), 9597; https://doi.org/10.3390/app11209597
Submission received: 5 August 2021
/
Revised: 4 October 2021
/
Accepted: 6 October 2021
/
Published: 15 October 2021
(This article belongs to the Special Issue Energy Efficient Envelope Technologies for Green, Healthy and Comfortable Buildings)
Abstract
:Office buildings are usually characterized by low thermal inertia, which could cause underperformance in terms of energy consumption. Moreover, the use of large glazed façades in office buildings can cause thermal and visual discomfort due to high solar heat gains and excessive daylight transmitted into the office space. Phase Change Materials (PCMs) integrated into glazing have arisen as an innovative strategy to increase thermal inertia and improve office buildings’ energy performance and indoor comfort at a low cost. This paper aims to analyze the impact of PCM glazing on buildings’ energy performance and occupants’ thermal and visual comfort. The analysis is performed through a one-year real-scale experiment in two offices in Santiago, Chile, with an east-oriented façade and a window-to-wall ratio (WWR) of 56%. The results are analyzed on two timescales: seasonally and daily. Representative days in each season were selected to carry out the analysis. Regarding the energy consumption of the HVAC system, PCM glazing reduces energy consumption during summer and mid-seasons and significantly reduces the peak loads in summer. A meaningful improvement in thermal comfort is achieved due to the control of the mean radiant temperature for the whole year. Considering visual comfort, there is an improvement in the luminance distribution in winter and mid-season cold conditions.
1. Introduction
According to the International Energy Agency (IEA), the building sector is responsible for 40% of CO2 emissions and consumes 36% of end-use energy [1]. There are three principal sources of CO2 emissions from buildings: (1) direct emissions from fossil fuels for indoor conditioning spaces; (2) indirect emissions from electricity consumption by heating, ventilation, and air conditioning (HVAC), domestic hot water (DHW), equipment, appliances, and artificial lighting; and (3) indirect emissions from other sources, such as the embodied energy in construction materials [2]. Heating and cooling are the major end-use energy in buildings (65% of the total buildings’ energy consumption) [2], and they are strongly related to the building envelope. The IEA 2 °C scenario attributes more than 40% of the potential energy savings expected by 2050 to heating and cooling. High energy-efficiency HVAC systems are needed, but essential improvements in building envelopes are required worldwide to achieve this global target [3].
Office buildings are mainly built with glazed façades instead of opaque thermally insulated façades. Usually, the U-value of glazed façades is lower than that of opaque façades. Additionally, glazing façades are characterized by lower thermal inertia. Moreover, office buildings with large glazing façades are affected by excessive solar heat gains and daylight that might cause high cooling energy consumption and thermal and visual discomfort. Therefore, it is necessary to develop new advances in glazing technologies to improve the thermal performance of the glazed façade of office buildings [4].
There are several advanced glazing technologies, such as multilayer glazing, suspended films, vacuum glazing, Low-E coatings, smart glazing, photovoltaic glazing, aerogel glazing, gas-filled glazing, self-cleaning glazing, and Phase Change Materials (PCMs) glazing [5]. PCMs integrated into glazing have emerged as an innovative strategy to provide thermal inertia to the envelope, improve office energy performance, and cost-effectively improve indoor comfort. The main benefit of PCM glazing is enabling the selective optical transmittance of solar radiation so that visible range radiation is mainly transmitted. In contrast, infrared radiation is absorbed and converted to heat, causing the PCM phase change [5]. Consequently, PCM glazing improves thermal comfort and produces a delay between outdoor and indoor conditions [6]. The literature review of Fokaides, et al. [7] shows that PCM glazing’s main benefit is in warm-dominated climates to reduce overheating and significantly reduce cooling energy consumption.
Several experimental studies on PCM glazing have been carried out in recent years. Researchers have focused on the characterization of PCM glazing, determining its impact on thermal and solar performance. The characterization of PCM glazing has been centered on determining solar properties, refractive index, and light transmission. For example, Goia, et al. [8] experimentally determined the spectral and angular solar properties of a double-glazed window filled with PCM paraffin for different cavity thicknesses. In addition, they provided properties to perform numerical thermal and lighting simulations of buildings with PCM glazing. Liu, et al. [9] studied the impact of the refractive index and extinction coefficients for a glazed roof filled with PCM in liquid and solid states. Heim, et al. [10] determined the direct light transmittance of a triple glazed unit with one cavity filled with PCM under constant solar radiation intensity and stable air temperature. They found that the interreflections inside the PCM glazing during the phase change cause nonuniformity in the light transmission. These works provided relevant information to perform thermal and daylight simulations, and they have helped to improve the knowledge of PCM glazing performance compared with other advanced glazing technologies.
On the other hand, studies regarding the impact of PCM glazing on thermal performance have focused on analyzing surface temperature variations, solar transmittance, heat storage, and heat fluxes. Liu, et al. [11] and Liu, et al. [12] studied the impact of solar irradiance, PCM layer thickness, PCM melting temperature, and the air layer convection of a multilayer glazed roof using experimental measurements. They concluded that the PCM layer melting temperature and thickness have crucial effects on controlling solar transmission and improving the window thermal performance. Grynning, et al. [13] and Grynning, et al. [14] studied a characterization of PCM glazing using large-scale measurements in a climate simulator. They carried out different tests for various pulse solar irradiance levels and thermal gradients to compare the performances of a four-pane window with a solar reflector and macro-encapsulated salt with a double-glazed reference window. They found that the four-pane window’s higher thermal inertia decreased the cooling loads and improved thermal comfort. Goia, et al. [15] experimentally studied the impact of PCM glazing on the thermal performance in a full-scale test facility. They found that PCM glazing performed better during summer than a double-glazed unit in terms of energy storage and smoothing and delaying heat fluxes, while the solar heat gain reduction was similar to the heat loss in winter. Another study case was presented in [16], which evaluated a triple glazed window to prevent overheating during summer and to ensure PCM discharge overnight. The review of Li, et al. [17] indicated that research on understanding the optical and thermal properties of PCM glazing could improve the accuracy of numerical simulations, hence decreasing the high costs of experimental works to obtain optimal glazing system solutions. Previous studies have shown a good understanding of PCM glazing properties and their thermal behavior. However, very few studies have evaluated the potential of PCM glazing to reduce buildings cooling loads. Furthermore, the state-of-the-art review shows a lack of experimental studies quantifying the energy savings caused by PCM glazing and evaluating the actual impact of this technology on reducing cooling loads. Pomianowski, et al. [18] and Vigna, et al. [19] indicated that measurements under real operational conditions are indispensable for evaluating the PCM’s thermal performance and the potential to reduce the cooling energy consumption.
Regarding the impact of PCM glazing on occupants’ thermal comfort, Goia, et al. [20] used a modified Predicted Mean Vote (PMV), based on the study of Sullivan [21], that considered the effect of solar radiation on PMV. They evaluated the occupants’ thermal comfort in a room with PCM glazing experimentally and compared it with the obtained results in a reference room equipped with a double-glazed window. They found that, independent of the irradiance level on the window and the season, PCM glazing performs better than the double-glazed window in terms of PMV. Additionally, they observed that correctly choosing the PCM melting temperature is crucial because, if the PCM melts completely before sunset, the window’s internal temperature increases, which causes thermal discomfort. However, they also highlighted a lack of studies on the impact of PCM glazing on thermal comfort for other locations and building shapes based on real-scale experiments.
Concerning the visual comfort of the occupants in daylit spaces with PCM glazing, Refs. [22,23] evaluated, by modeling with Radiance [24], the effects on visual comfort of PCM glazing and selective glazing of an office room with south and west-oriented window façades. They studied different climates (Östersund, Norway; Turin, Italy; Abu-Dhabi, United Arab Emirates) and considered three representative days in summer, winter, and mid-season for the analysis. They assessed visual comfort in terms of DGP and Spatial Useful Illuminance (sEu). They showed that PCM glazing presented lower DGP values than selective glazing during overcast and sunny sky days with the sun in lower positions, or when the sun was not directly visible from the window. The main drawbacks of this study were the lack of validation of the model in Radiance for the PCM window and that only PCM in the solid-state was considered. To the best of our knowledge, there are a lack of experimental studies about the impact of PCM glazing on occupants’ visual comfort.
In summary, the literature review shows that the main identified research gaps are the lack of studies evaluating the effect of PCM glazing on building energy consumption, either by modeling or experimentally, and the absence of real-scale studies to determine the impact of PCM glazing on visual and thermal comfort. To address these research gaps, this paper aims to experimentally investigate the influence of PCM glazing on occupants’ thermal and visual comfort and office energy performance under actual weather conditions. The research consists of a one-year real-scale experiment in two east-oriented façade twin offices; PCM glazing is installed in one office, while the other has double-clear glazing. The window-to-wall ratio (WWR) of both offices is 56%. The offices are located in Santiago, Chile, a semi-aridclimate classified as Bsk according to Köppen-Geiger [25,26] and 3C according to ASHRAE [27]. Santiago’s climate is characterized by high temperatures and solar radiation for more than half of the year, and high-temperature fluctuations between daytime and night-time. The results for energy consumption, thermal comfort, and visual comfort are shown on two timescales: seasonally, and daily.
This paper provides an extensive analysis of the energy, thermal, solar, and daylighting performance of PCM glazing in the actual operational conditions of an office, quantifying the energy consumption and thermal and visual comfort. Architects and building engineers could benefit from the results shown in this paper to make informed decisions during the early building design stage. In addition, researchers could better understand this technology and use the results of this paper to validate thermal and daylighting models.
2. Materials and Methods
This section presents the methodology and the procedure to perform the real-scale experiment in four subsections, showing the test facilities, the experimental campaign and data selection, the experimental setup, and the method to evaluate the energy consumption and thermal and visual comfort.
2.1. Test Facilities
The experiment was conducted in two office rooms with dimensions of 6.52 m × 3.13 m × 2.68 m each (Figure 1), located on the third floor of the San Agustín Building of the School of Engineering at Pontificia Universidad Católica de Chile (33.4993° S, 70.6150° W). The office room with a typical double-clear glazed window filled with air was the reference office, herein called the “AIR room”. The other office was equipped with a double-clear glazed window filled with PCM RT25 from Rubitherm® and was called the “PCM room”. Thus, both offices have the following characteristics:
- WWR was equal to 56%.
- The east-oriented wall was the only façade exposed to outdoor conditions. This façade consisted of glazes and opaque envelopes.
- The opaque part of the east-oriented façade was a heavy-concrete wall of 0.20 m without insulation.
- An upper window consisted of double-clear glazing filled with air to provide daylight.
- Interior walls, ceilings, and floors are adiabatic because each office is adjacent to other occupied spaces on the same level and the above and underneath floors.
- The glazed façade of the PCM room was double-glazed with a cavity filled with PCM. This window was 5 + 4 mm laminated glass, 11.5 mm PCM and 4 + 5 mm laminated glass. Table 1 shows the thermophysical properties of the glazed façade (heat transfer coefficient U-value, visible transmittance Tvis and solar transmittance Tsol) calculated using WINDOW 8.0 [28] and, the experimental data of Goia [29], that used the same paraffin wax and the window properties as our experiment. Figure 2a shows the cross-section of the PCM window, and Figure 2b shows the partial enthalpy of the PCM paraffin according to the manufacturer datasheet [30]. A total of 20.8 kg of paraffin wax was used.
- The glazed façade of the AIR room was double-glazed with a cavity filled with air. This window was 5 + 4 mm laminated glass, 11.5 mm air and 4 + 5 mm laminated glass. Table 1 shows the thermophysical properties of the glazed façade (heat transfer coefficient U-value, visible transmittance Tvis and solar transmittance Tsol).
- Internal gain sources in both rooms were the HVAC system and the measurement equipment (laptop, datalogger, UPS, and sensors). There were no internal gains related to people, artificial lighting, or typical office equipment.
- A wall-mounted heating and cooling HVAC of 18,000 Btu/h (approximately 5.3 kW) was installed in each office to control the indoor air temperature. The thermostats were set at 25 °C for heating and cooling. HVAC can work only in heating or cooling mode. The heating and cooling modes were set according to the weather conditions in each season.
2.2. Experimental Campaign and Data Selection
The experiment was carried out for over a year, starting on 17 February 2020, and finishing on 28 February 2021. Typical office working hours in Chile (9:00 to 18:00 h) were considered in the analysis. Full days with valid data were selected from the complete dataset for thermal comfort, visual comfort, and energy consumption measurements to carry out the performance analysis. A day with valid data was defined as a day with complete measured data for unoccupied offices within working hours. Table 2 shows the number of days with valid data for each season.
Then, three representative days for each season were selected from the entire dataset. For mid-seasons, two groups of three days were selected based on warm and cold outdoor conditions. Sunny, partly cloudy and cloudy days were chosen for the three days in mid-season warm, mid-season cold and winter. In summer, the typical days were sunny or mostly sunny. Table 3 shows the representative days selected.
2.3. Experimental Setup
A meteorological station (Kipp & Zonen) equipped with a Sun tracker, SOLYS 2, and a humidity and temperature probe HMP60, (Vaisala, Finland), was used to measure the outdoor conditions. In addition, pyranometers to measure the vertical global solar radiation and thermocouples to measure the solar-air temperature were installed on the building façade. Table 4 presents the list of sensors for outdoor measurements.
Table 5 shows the sensors used to measure the HVAC power, thermal comfort, visual comfort, and thermal performance of the window. Thermal and visual comfort sensors were centered 1.5 m from the window at a height of 1.15 m to reflect a seated person’s eye (Figure 1). Current/voltage sensors Multivoies (Multichannel energy consumption Data Logging) produced by the OmégaWatt Company, France, were used to measure HVAC power. A SensoData 5500 MK (Sensor Electronic, Poland) was installed in each room to measure thermal comfort, the SensoData was composed of a standard datalogger SensoData 5500 and a set of sensors, SensoTCMod 5507. To evaluate visual comfort, the Complementary Metal Oxide Semiconductor (CMOS) Sensor Sony IMX219 was used to measure the luminance distribution, as reported by [31,32]. They determined that the luminance range varies from 3 to 18,000 cd/m2 with an average accuracy of 3.0% to 17.5%, which is appropriate for interior luminance measurements. Figure 3 shows the locations of the rest of the sensors installed on the window of each room. Figure 4 shows fisheye pictures of both offices at 9:00 and 11:00 h. In the case of the PCM room, Figure 4 shows the PCM in the solid state a 9:00 h, and it is in the liquid state at 11:00 h. Figure 5 also shows general pictures of the experimental setup and the installed sensors.
2.4. Procedure for the Evaluation of Energy Consumption, Thermal Comfort, and Visual Comfort
2.4.1. Energy Consumption
The Multivoies current/voltage sensor was capable of continuously measuring the HVAC power. The HVAC power every 1 min was recorded to identify slight variations of the HVAC power. Daily energy consumption was calculated by integrating the HVAC power over the whole day.
2.4.2. Thermal Comfort
The Predicted Mean Vote (PMV) method was used to evaluate the thermal comfort of the occupants. This index is based on Fanger’s theory [33], and the calculations were performed according to standard UNE/EN/ISO 7730:2005 [34]. The occupants’ activity was considered typical sedentary office work, and the thermal insulation of the clothing was chosen by season according to the standard UNE/EN/ISO 7730:2005 [34], as shown in Table 6.
The PMV index does not consider the influence of transmitted direct solar radiation on thermal comfort. Solar irradiance entering the indoor environment through the glazed façade could dramatically change the thermal sensation. A modified index called PMV*, presented in Equation, was proposed by Sullivan [21] to consider the effects of solar radiation on PMV. Our paper presents the results of PMV and PMV* based on measurements every 5 min.
PMV represents the thermal sensation of a person on a seven-point scale, as shown in Table 7.
2.4.3. Visual Comfort
Daylight Glare Probability (DGP) is used to evaluate visual comfort in daylit spaces. DGP is widely used in the literature as a metric of visual comfort. DGP was developed by Wienold and Christoffersen [35] and referred to “the probability that a person is disturbed instead by the glare magnitude”. DGP values can be between 0 and 1 but are valid only when the results are between 0.2 and 0.8 [35]. Table 8 presents the limits of DGP according to Wienold [36].
A device composed of a Raspberry Pi 3 Model B, a CMOS sensor Sony IMX219 (3.04 mm, f/2), and a miniature equisolid-angle fisheye lens was built to measure DGP. This device takes images with a resolution of 3280 × 2464 pixels. High Dynamic Range (HDR) images were built to calculate DGP by merging Low Dynamic Range (LDR) images varying the sensor exposure. Six LDR images were taken using sequential exposure bracketing of 8 µs, 3.125 ms, 12.5 ms, 0.05 s, 0.2 s, and 0.8 s. The LDR images were merged to build the HDR image using HDRgen [37] software. After merging each HDR image, luminance measurements by Konica LS-160 were used to calibrate the luminance value of the HDR images following the procedure indicated by [38]. This procedure consisted of cropping HDR images to a square encompassing the circular fisheye view, adjusting the projection of the HDR image using the distortion function, setting the pixels outside the fisheye view to black, editing the HDR image header with the projection type and real viewing angle, and validating the luminance values on a gray surface. After performing this procedure, a calibration value for each camera was found and applied to all HDR images to obtain corrected luminance values. This paper presents the results of DGP and luminance maps that were measured every 5 min.
3. Results
The experimental results are shown on two timescales, as explained below:
- Daily results for energy consumption, thermal comfort, and visual comfort are presented as hourly profiles for representative days (Figure 9, Figure 10, Figure 11 and Figure 12). These figures plot daily outdoor temperature and global horizontal irradiance (GHI), daily global vertical radiation on the building façade, transmitted radiation through the window, HVAC power, HVAC energy consumption and energy savings, indoor air temperature and mean radiant temperature (MRT), PMV, PMV*, and DGP.
These results are grouped by season to better understand the seasonal behavior and the impacts of PCM glazing. The seasons analyzed are summer, mid-season warm, mid-season cold, and winter. Mid-season warm and mid-season cold were selected depending on the cooling and heating needs. Mid-season cold is characterized by heating-dominance and comprises autumn from the end of April to June. In contrast, mid-season warm is dominated by cooling energy consumption and occurs in spring between the end of September and December.
3.1. Summer Season
The PCM phase change occurs rapidly during the summer season, even before 10:00 h. Figure 9b shows that the window with PCM presented a lower radiation transmission than that of clear double glazing because the PCM is solid during the first hours of the day. Generally, the short time that the phase change process takes is enough to control the solar gains because the solid PCM obstructs the passage of direct radiation during the morning hours. After the phase change is completed, the vertical radiation transmitted through the windows is equal for both the PCM and reference windows allowing diffuse radiation transmission when the sun is not in the field of view.
The daily cooling energy consumption of HVAC in the PCM room was lower than the energy consumption in the AIR room for all the season (Figure 6) and for most of the daytime (Figure 9c). The total cooling energy savings in summer were 19.6% for two main reasons. First, solid PCM blocked direct solar radiation in the first hours of the day, reducing solar heat gains. Second, the PCM window reduced heat fluxes more than the double-glazed window (Figure 9e), decreasing the heat transmission by conduction through the window. In addition, the peak loads were noticeably lower in the PCM room during sunny days of summer (Figure 9c).
Figure 7 shows that PMV and PMV* in the AIR room presented higher extreme values and greater quantities of values over 1.0 than in the PCM room all summer. This result reflects more moments with a warm and hot thermal sensation in the AIR room than in the PCM room. The quick phase change process in PCM glazing was enough to keep the values of the PMV and PMV* indices close to 0 in the PCM room under direct solar radiation on the façade (Figure 9f,g). This result was mainly due to the mean radiant temperature remaining close to the PCM melting temperature (Figure 9d). Mean radiant temperature was the primary source of higher values of PMV and PMV* because it was observed that mean radiant temperature peaks occurred at the same time as PMV and PMV* peaks.
Regarding visual comfort, the DGP values of the PCM rooms were slightly higher than those of the AIR room (Figure 8). The main difference in DGP between the two rooms occurred during the early morning, and there were no noticeable differences in DGP the rest of the time (Figure 9h). Early in the morning, the DGP of the PCM room was higher because of interreflections of the direct radiation inside the PCM when it was changing phases. Inside the PCM, solar radiation was reflected and transmitted to the interior environment in different directions, producing high brightness and contrast between the window and the opaque surfaces. As a result, the glare source in the PCM room was even higher than that in the AIR room, where the glare source was the solar disk. This effect is shown in Figure 13, where the higher luminance values in the window of the AIR room are concentrated around the solar disk in the sky and not in the building surroundings. In the PCM room with the solid PCM, the higher luminance values are located in all the window areas regardless of whether there is the sky or another surrounding object in the field of view behind the window. This means that the glare source area and the DGP value are higher in the PCM window than in the double-clear glazed window during the morning.
3.2. Mid-Season Warm
Mid-season warm occurs commonly in spring. Cooling is necessary from the end of September. During this season, sunny and partly cloudy days cause a similar time duration of PCM phase change as in the summer season. However, the temperature was not enough to activate the PCM on cloudy days (Figure 10b).
Regarding the daily cooling energy consumption during mid-season warm, the PCM room shows less energy consumption than the AIR room (Figure 6). Thus, the cooling energy saving was 18.4%. There is a slight reduction in the energy consumption in the PCM room during partly cloudy and sunny days (Figure 10c) due to lower heat conduction (Figure 10e) and solar heat gains (Figure 10b) through the PCM window. On the other hand, the peak loads in both rooms are similar (Figure 10c). Otherwise, on cloudy days, there is almost no cooling and heating energy consumption in either office because the thermal inertia of the façade can keep the indoor air temperature within the comfort range, even at lower outdoor temperatures.
For partly cloudy and sunny days, PCM glazing helps to keep the PMV and PMV* (Figure 10f,g) values close to 0 during the morning because solid PCM can maintain the mean radiant temperature in the comfort range (Figure 10d). Indeed, PCM glazing has the same impact on thermal comfort on partly cloudy and sunny days of mid-season warm, as during summer. On the other hand, there is no difference between the two rooms on cloudy days because PMV is mainly dependent on air temperature (controlled by the HVAC) instead of mean radiant temperature. Moreover, Figure 7 shows a significant reduction in the highest PMV and PMV* values, such as in summer, due to the PCM in solid-state blocks of direct solar radiation for a few hours in the morning.
Concerning the impact of PCM glazing on visual comfort, no noticeable difference between the two rooms was observed during partly cloudy and sunny days, similar to the summer season. However, the DGP in the PCM room was slightly higher than that in the AIR room (Figure 10h). The interreflections of the daylight within the PCM in the solid-state cause high luminance, which turns into occupant discomfort due to glare. Figure 10h also shows that the DGP is below 0.25 in both rooms on cloudy days, so there was no glare. Nevertheless, during the first and last hours of the day, the daylight availability decreased in the PCM room, which meant artificial lighting was needed to provide enough indoor illuminance. Consequently, the DGP variation during the whole monitoring period was higher in the PCM room (Figure 8).
3.3. Mid-Season Cold
Mid-season cold occurs commonly in autumn. Unlike summer and mid-season warm, the PCM phase change lasts longer. Moreover, the low outdoor temperatures during the afternoon allow PCM to solidify, releasing heat into the indoor environment. On the other hand, the PCM phase change does not occur during cloudy days, as shown in Figure 11b.
The total heating energy savings in the mid-season cold are 36.2%. The longer time of the phase change reduced the heating demand of the PCM room, which mainly occurred early in the morning and in the evening (Figure 11c). During the afternoon, the PCM usually turns solid and helps to reduce energy consumption, releasing stored heat into the indoor environment. Additionally, Figure 6 shows that the lowest energy consumption takes place in autumn for both rooms.
For partly cloudy and sunny days in mid-season cold, the PCM glazing impact on thermal comfort was the same as in the summer season, where the PCM phase change occurred in the morning and helped to reduce the mean radiant temperature. Despite this, the low thermal inertia of the reference window caused PMV and PMV* to be close to −1.0 in the AIR room during the afternoon, which implies cold thermal sensation (Figure 11f,g). On the other hand, PMV showed no difference between the two rooms on cloudy days because PMV mainly depended on air temperature under this condition. For the whole mid-season cold, there was a significant reduction in PMV and PMV* (Figure 7) higher values, as also occurred in summer and mid-season warm, because the solid PCM blocked the direct solar radiation in the morning.
Unlike the summer and mid-season warm, there was an improvement in visual comfort in the mid-season cold due to the longer PCM phase changes. This fact keeps the PCM room’s indoor luminance conditions more stable than the AIR room with DGP below 0.25, whereas the DGP of the AIR room varied between 0.25 and 0.40 (Figure 11h).
3.4. Winter Season
Overall, the PCM phase change did not occur in the winter season due to the lower solar radiation and temperatures. Instead, the phase change occurred partially only during the afternoon on sunny days (Figure 12b). This can help to improve the thermal comfort sensation as the PCM blocked the solar radiation on sunny days, but energy consumption increased because solid PCM prevents solar heat gains.
The heating energy consumption was similar in both rooms during partly cloudy and cloudy days because the PCM was solid the whole day, and the solar heat gains were negligible (Figure 12c). During sunny days, the PCM blocked the solar heat gains during the morning, increasing the heating demand in the PCM room. In contrast, solar heat gains in the AIR room help to reduce HVAC energy consumption between 10 and 13 h (Figure 12c).
According to Figure 7, high PMV values were observed in winter in the AIR room because of the high glazing temperature, due to sunny or partly cloudy days with low solar altitude that caused high incident solar radiation on the façade during the morning.
As occurred in the other seasons, PMV and PMV* were improved by PCM glazing (Figure 12f,g) because PCM in the solid-state prevented the mean radiant temperature from increasing during mornings of partly cloudy and sunny days (Figure 12d).
The impact of PCM glazing on visual comfort is similar to that of mid-season cold glazing. PCM in the solid-state helps to control the luminance distribution and keeps the DGP values below 0.25 (Figure 12h). Therefore, artificial lighting is needed at early and late working hours. In addition, PCM remains in the solid-state most of the time because there are more cloudy days in winter and sunset occurs earlier, which causes more hours with low DGP values (Figure 8).
3.5. Relation between Energy Savings and Climate Conditions
Figure 14a,b show the relation between daily energy savings, daily maximum outdoor air temperature and daily total global horizontal irradiation, respectively. These figures show increasing cooling energy savings while the maximum outdoor temperature and irradiation increase. This increment is clear in days with irradiation over 6 kWh/m2day and a maximum outdoor temperature over 25 °C. In contrast, no tendency is observed between heating energy savings and these climate variables.
4. Conclusions
This paper covers the need for real-scale experimental studies to determine the impact of PCM glazing on energy performance and the occupants’ comfort of actual office buildings. This article presents an extensive empirical analysis of the effects of PCM glazing on energy consumption and thermal and visual comfort in an office room located in Santiago, Chile, a semiarid climate. PCM glazing corresponds to clear double glazing filled with paraffin RT25. Two rooms were monitored over a year: the PCM room equipped with the PCM window and the AIR room with clear double glazing. The main findings of this paper are:
- Regarding energy consumption, the best PCM window performance was in summer when cooling needs and the peak loads of the PCM room were significantly decreased compared to the AIR room. Furthermore, in mid-seasons, PCM helped to reduce the cooling needs slightly for sunny and partly cloudy days and lower the heating needs at the end of working hours. In contrast, no relevant impact of the PCM window on the office energy performance was found in winter due to the lack of enough solar radiation and low outdoor air temperature to activate the phase change, even on sunny days. It is expected that a PCM with a higher melting temperature would show better results in summer, further decreasing the cooling energy use and the peak load. Nevertheless, the benefits of the PCM window would be lost during the mid-seasons.
- PCM glazing considerably improves thermal comfort in terms of PMV and PMV* compared to the reference window. This improvement is because the PCM phase change occurs mainly during the first hours of the day when direct solar radiation is incident on the east-oriented façade. Therefore, the mean radiant temperature remains close to the melting temperature of 25 °C. Moreover, PCM in the solid-state prevented most solar radiation transmission into the indoor environment, maintaining a PMV* close to zero.
- PCM glazing helps to control luminance distribution and prevent glare during sunny and partly cloudy days of winter and mid-season cold, keeping the DGP values below 0.25. Otherwise, PCM glazing did not present improvements in visual comfort regarding the reference window during summer and mid-season warm because both windows had similar luminance distributions during the whole day. Thus, DGP values are similar in both offices. Under direct solar radiation in the field of view and with the PCM in the solid-state, high luminance values were observed on the window. Interreflections of the direct radiation in the PCM layer might produce a significant fraction of the direct radiation that would be transmitted to the indoor environment. Then, there is glare risk in the PCM room as well as in the AIR room.
In summary, the main benefits of the PCM inside the cavity of a double-glazed façade are (1) improving the occupants’ thermal comfort, (2) reducing the cooling energy consumption and the peak loads during summer, and (3) preventing glare in the winter season. These benefits are caused by the PCM window’s higher thermal inertia and the PCM’s solid-state during the morning hours.
This study fills the gap of experimentally evaluating the effects of PCM windows on offices’ energy consumption and occupants’ comfort. Furthermore, the results presented in this paper allow a better understanding of the PCM window performance toward the development and implementation of this technology. The developed experimental methodology is robust and reliable; thus, it can be replicated in other buildings in different climates to generate insightful information linked to the building function and climates.
Further work must consider the study of other types of PCM, façade orientations, different climates, the comparison against smart/adaptative façades, and cost-effectiveness analysis.
Author Contributions
Conceptualization, D.U. and S.V.; Funding acquisition, S.V.; Investigation, D.U.; Methodology, D.U. and S.V.; Project administration, S.V. and D.U.; Supervision, S.V.; Writing—original draft, D.U.; Writing—review & editing, D.U. and S.V. Both authors have read and agreed to the published version of the manuscript.
Funding
This work was funded by the National Research and Development Agency of Chile (ANID) under research grants Solar hybrid translucent component for thermal energy storage in buildings (acronym: SOLTREN, EraNet-LAC/SOLTREN/03/2017, ELAC2015/T06-0462), ANID/FONDAP/15110020 (CEDEUS) and ANID-PFCHA/Doctorado Nacional/2018-21182016.
Institutional Review Board Statement
Not applicable.
Informed Consent Statement
Not applicable.
Conflicts of Interest
The authors declare no conflict of interest.
References
- IEA. Energy Efficiency: Buildings. The Global Exchange for Energy Efficiency Policies, Data and Analysis. Available online: https://www.iea.org/topics/energyefficiency/buildings/ (accessed on 5 July 2021).
- GABC. Global Roadmap towards Low-GHG and Resilient Buildings; Global Alliance for Buildings and Construction, International Energy Agency, UN Environment: Paris, France, 2016. [Google Scholar]
- IEA. Technology Roadmap: Energy Efficient Building Envelopes; International Energy Agency: Paris, France, 2013. [Google Scholar]
- Rezaei, S.D.; Shannigrahi, S.; Ramakrishna, S. A review of conventional, advanced, and smart glazing technologies and materials for improving indoor environment. Sol. Energy Mater. Sol. Cells 2017, 159, 26–51. [Google Scholar] [CrossRef]
- Cuce, E.; Riffat, S.B. A state-of-the-art review on innovative glazing technologies. Renew. Sustain. Energy Rev. 2015, 41, 695–714. [Google Scholar] [CrossRef]
- Silva, T.; Vicente, R.; Rodrigues, F. Literature review on the use of phase change materials in glazing and shading solutions. Renew. Sustain. Energy Rev. 2016, 53, 515–535. [Google Scholar] [CrossRef]
- Fokaides, P.A.; Kylili, A.; Kalogirou, S.A. Phase change materials (PCMs) integrated into transparent building elements: A review. Mater. Renew. Sustain. Energy 2015, 4, 6. [Google Scholar] [CrossRef] [Green Version]
- Goia, F.; Zinzi, M.; Carnielo, E.; Serra, V. Spectral and angular solar properties of a PCM-filled double glazing unit. Energy Build. 2015, 87, 302–312. [Google Scholar] [CrossRef] [Green Version]
- Liu, C.; Bian, J.; Zhang, G.; Li, D.; Liu, X. Influence of optical parameters on thermal and optical performance of multi-layer glazed roof filled with PCM. Appl. Therm. Eng. 2018, 134, 615–625. [Google Scholar] [CrossRef]
- Heim, D.; Krempski-Smejda, M.; Dellicompagni, P.R.; Knera, D.; Wieprzkowicz, A.; Franco, J. Dynamics of Melting Process in Phase Change Material Windows Determined Based on Direct Light Transmission. Energies 2021, 14, 721. [Google Scholar] [CrossRef]
- Liu, C.; Wu, Y.; Bian, J.; Li, D.; Liu, X. Influence of PCM design parameters on thermal and optical performance of multi-layer glazed roof. Appl. Energy 2018, 212, 151–161. [Google Scholar] [CrossRef]
- Liu, C.; Wu, Y.; Zhu, Y.; Li, D.; Ma, L. Experimental investigation of optical and thermal performance of a PCM-glazed unit for building applications. Energy Build. 2018, 158, 794–800. [Google Scholar] [CrossRef]
- Grynning, S.; Goia, F.; Rognvik, E.; Time, B. Possibilities for characterization of a PCM window system using large scale measurements. Int. J. Sustain. Built Environ. 2013, 2, 56–64. [Google Scholar] [CrossRef] [Green Version]
- Grynning, S.; Goia, F.; Time, B. Dynamic Thermal Performance of a PCM Window System: Characterization Using Large Scale Measurements. Energy Procedia 2015, 78, 85–90. [Google Scholar] [CrossRef] [Green Version]
- Goia, F.; Perino, M.; Serra, V. Experimental analysis of the energy performance of a full-scale PCM glazing prototype. Sol. Energy 2014, 100, 217–233. [Google Scholar] [CrossRef]
- Li, S.; Sun, G.; Zou, K.; Zhang, X. Experimental research on the dynamic thermal performance of a novel triple-pane building window filled with PCM. Sustain. Cities Soc. 2016, 27, 15–22. [Google Scholar] [CrossRef]
- Li, D.; Wu, Y.; Wang, B.; Liu, C.; Arıcı, M. Optical and thermal performance of glazing units containing PCM in buildings: A review. Constr. Build. Mater. 2020, 233, 117327. [Google Scholar] [CrossRef]
- Pomianowski, M.; Heiselberg, P.; Zhang, Y. Review of thermal energy storage technologies based on PCM application in buildings. Energy Build. 2013, 67, 56–69. [Google Scholar] [CrossRef]
- Vigna, I.; Bianco, L.; Goia, F.; Serra, V. Phase Change Materials in Transparent Building Envelopes: A Strengths, Weakness, Opportunities and Threats (SWOT) Analysis. Energies 2018, 11, 111. [Google Scholar] [CrossRef] [Green Version]
- Goia, F.; Perino, M.; Serra, V. Improving thermal comfort conditions by means of PCM glazing systems. Energy Build. 2013, 60, 442–452. [Google Scholar] [CrossRef]
- Sullivan, R. Thermal Comfort Issues in the LRI Study; Internal Memorandum/Report; Windows and Daylighting Group, Lawrence Berkeley National Laboratory: Berkeley, CA, USA, 1986. [Google Scholar]
- Giovannini, L.; Goia, F.; Verso, V.R.M.L.; Serra, V. Phase Change Materials in Glazing: Implications on Light Distribution and Visual Comfort. Preliminary Results. Energy Procedia 2017, 111, 357–366. [Google Scholar] [CrossRef] [Green Version]
- Giovannini, L.; Goia, F.; Lo Verso, V.R.M.; Serra, V. A Comparative Analysis of the Visual Comfort Performance between a PCM Glazing and a Conventional Selective Double Glazed Unit. Sustainability 2018, 10, 3579. [Google Scholar] [CrossRef] [Green Version]
- Radiance. Available online: https://www.radiance-online.org (accessed on 27 July 2021).
- Kottek, M.; Grieser, J.; Beck, C.; Rudolf, B.; Rubel, F. World Map of the Köppen-Geiger climate classification updated. Meteorol. Z. 2006, 15, 259–263. [Google Scholar] [CrossRef]
- Rubel, F.; Brugger, K.; Haslinger, K.; Auer, I. The climate of the European Alps: Shift of very high resolution Köppen-Geiger climate zones 1800-2100. Meteorol. Z. 2017, 26, 115–125. [Google Scholar] [CrossRef]
- ANSI/ASHRAE/IES. Energy-Efficient Design of Low-Rise Residential Buildings (ANSI/ASHRAE/IES Standard 90.2-2018). American Society of Heating, Refrigerating and Air-Conditioning Engineers. 2018. Available online: https://ashrae.library.site/resource/list/12 (accessed on 11 October 2021).
- WINDOW 8.0. Available online: https://windows.lbl.gov/software/window (accessed on 11 October 2021).
- Goia, F. Thermo-physical behaviour and energy performance assessment of PCM glazing system configurations: A numerical analysis. Front. Archit. Res. 2012, 1, 341–347. [Google Scholar] [CrossRef] [Green Version]
- Rubitherm. Data Sheet RT25; 2018. Available online: https://www.rubitherm.eu/en/index.php/productcategory/organische-pcm-rt (accessed on 11 October 2021).
- Kruisselbrink, T.; Aries, M.; Rosemann, A. A Practical Device for Measuring the Luminance Distribution. Int. J. Sustain. Lighting 2017, 19, 75–90. [Google Scholar] [CrossRef] [Green Version]
- Kruisselbrink, T.W.; Dangol, R.; van Loenen, E.J. Recommendations for long-term luminance distribution measurements: The spatial resolution. Build. Environ. 2020, 169, 106538. [Google Scholar] [CrossRef]
- Fanger, P.O. Thermal Comfort: Analysis and Applications in Environmental Engineering; McGraw-Hill: New York, NY, USA, 1972. [Google Scholar]
- ISO. Ergonomics of the thermal environment—Analytical determination and interpretation of thermal comfort using calculation of the PMV and PPD indices and local thermal comfort criteria (ISO 7730:2005). International Organization for Standardization. 2005. Available online: https://www.iso.org/standard/39155.html (accessed on 11 October 2021).
- Wienold, J.; Christoffersen, J. Evaluation methods and development of a new glare prediction model for daylight environments with the use of CCD cameras. Energy Build. 2006, 38, 743–757. [Google Scholar] [CrossRef]
- Wienold, J. Dynamic Daylight Glare Evaluation. In Proceedings of the 11th International IBPSA Conference, Glasgow, UK, 27–30 July 2009. [Google Scholar]
- Ward, G. HDRgen. Available online: http://www.anyhere.com/ (accessed on 17 June 2021).
- Pierson, C.; Cauwerts, C.; Bodart, M.; Wienold, J. Tutorial: Luminance Maps for Daylighting Studies from High Dynamic Range Photography. LEUKOS 2021, 17, 140–169. [Google Scholar] [CrossRef] [Green Version]
Figure 1.
Office dimensions (mm). (a) Room with PCM glazing (main); (b) Room with a double-glazed window (reference).
Figure 1.
Office dimensions (mm). (a) Room with PCM glazing (main); (b) Room with a double-glazed window (reference).

Figure 2.
(a) window dimensions (mm); (b) partial enthalpy of paraffin RT25.

Figure 3.
Sensor’s position. Dimensions in mm. TI and TE refer to thermocouples in the interior and exterior surface of the window, respectively. HF refers to heat flux sensors. ANEM refers to the anemometer. PYR and PYRA refer to the pyrgeometer and pyranometer, respectively.
Figure 3.
Sensor’s position. Dimensions in mm. TI and TE refer to thermocouples in the interior and exterior surface of the window, respectively. HF refers to heat flux sensors. ANEM refers to the anemometer. PYR and PYRA refer to the pyrgeometer and pyranometer, respectively.
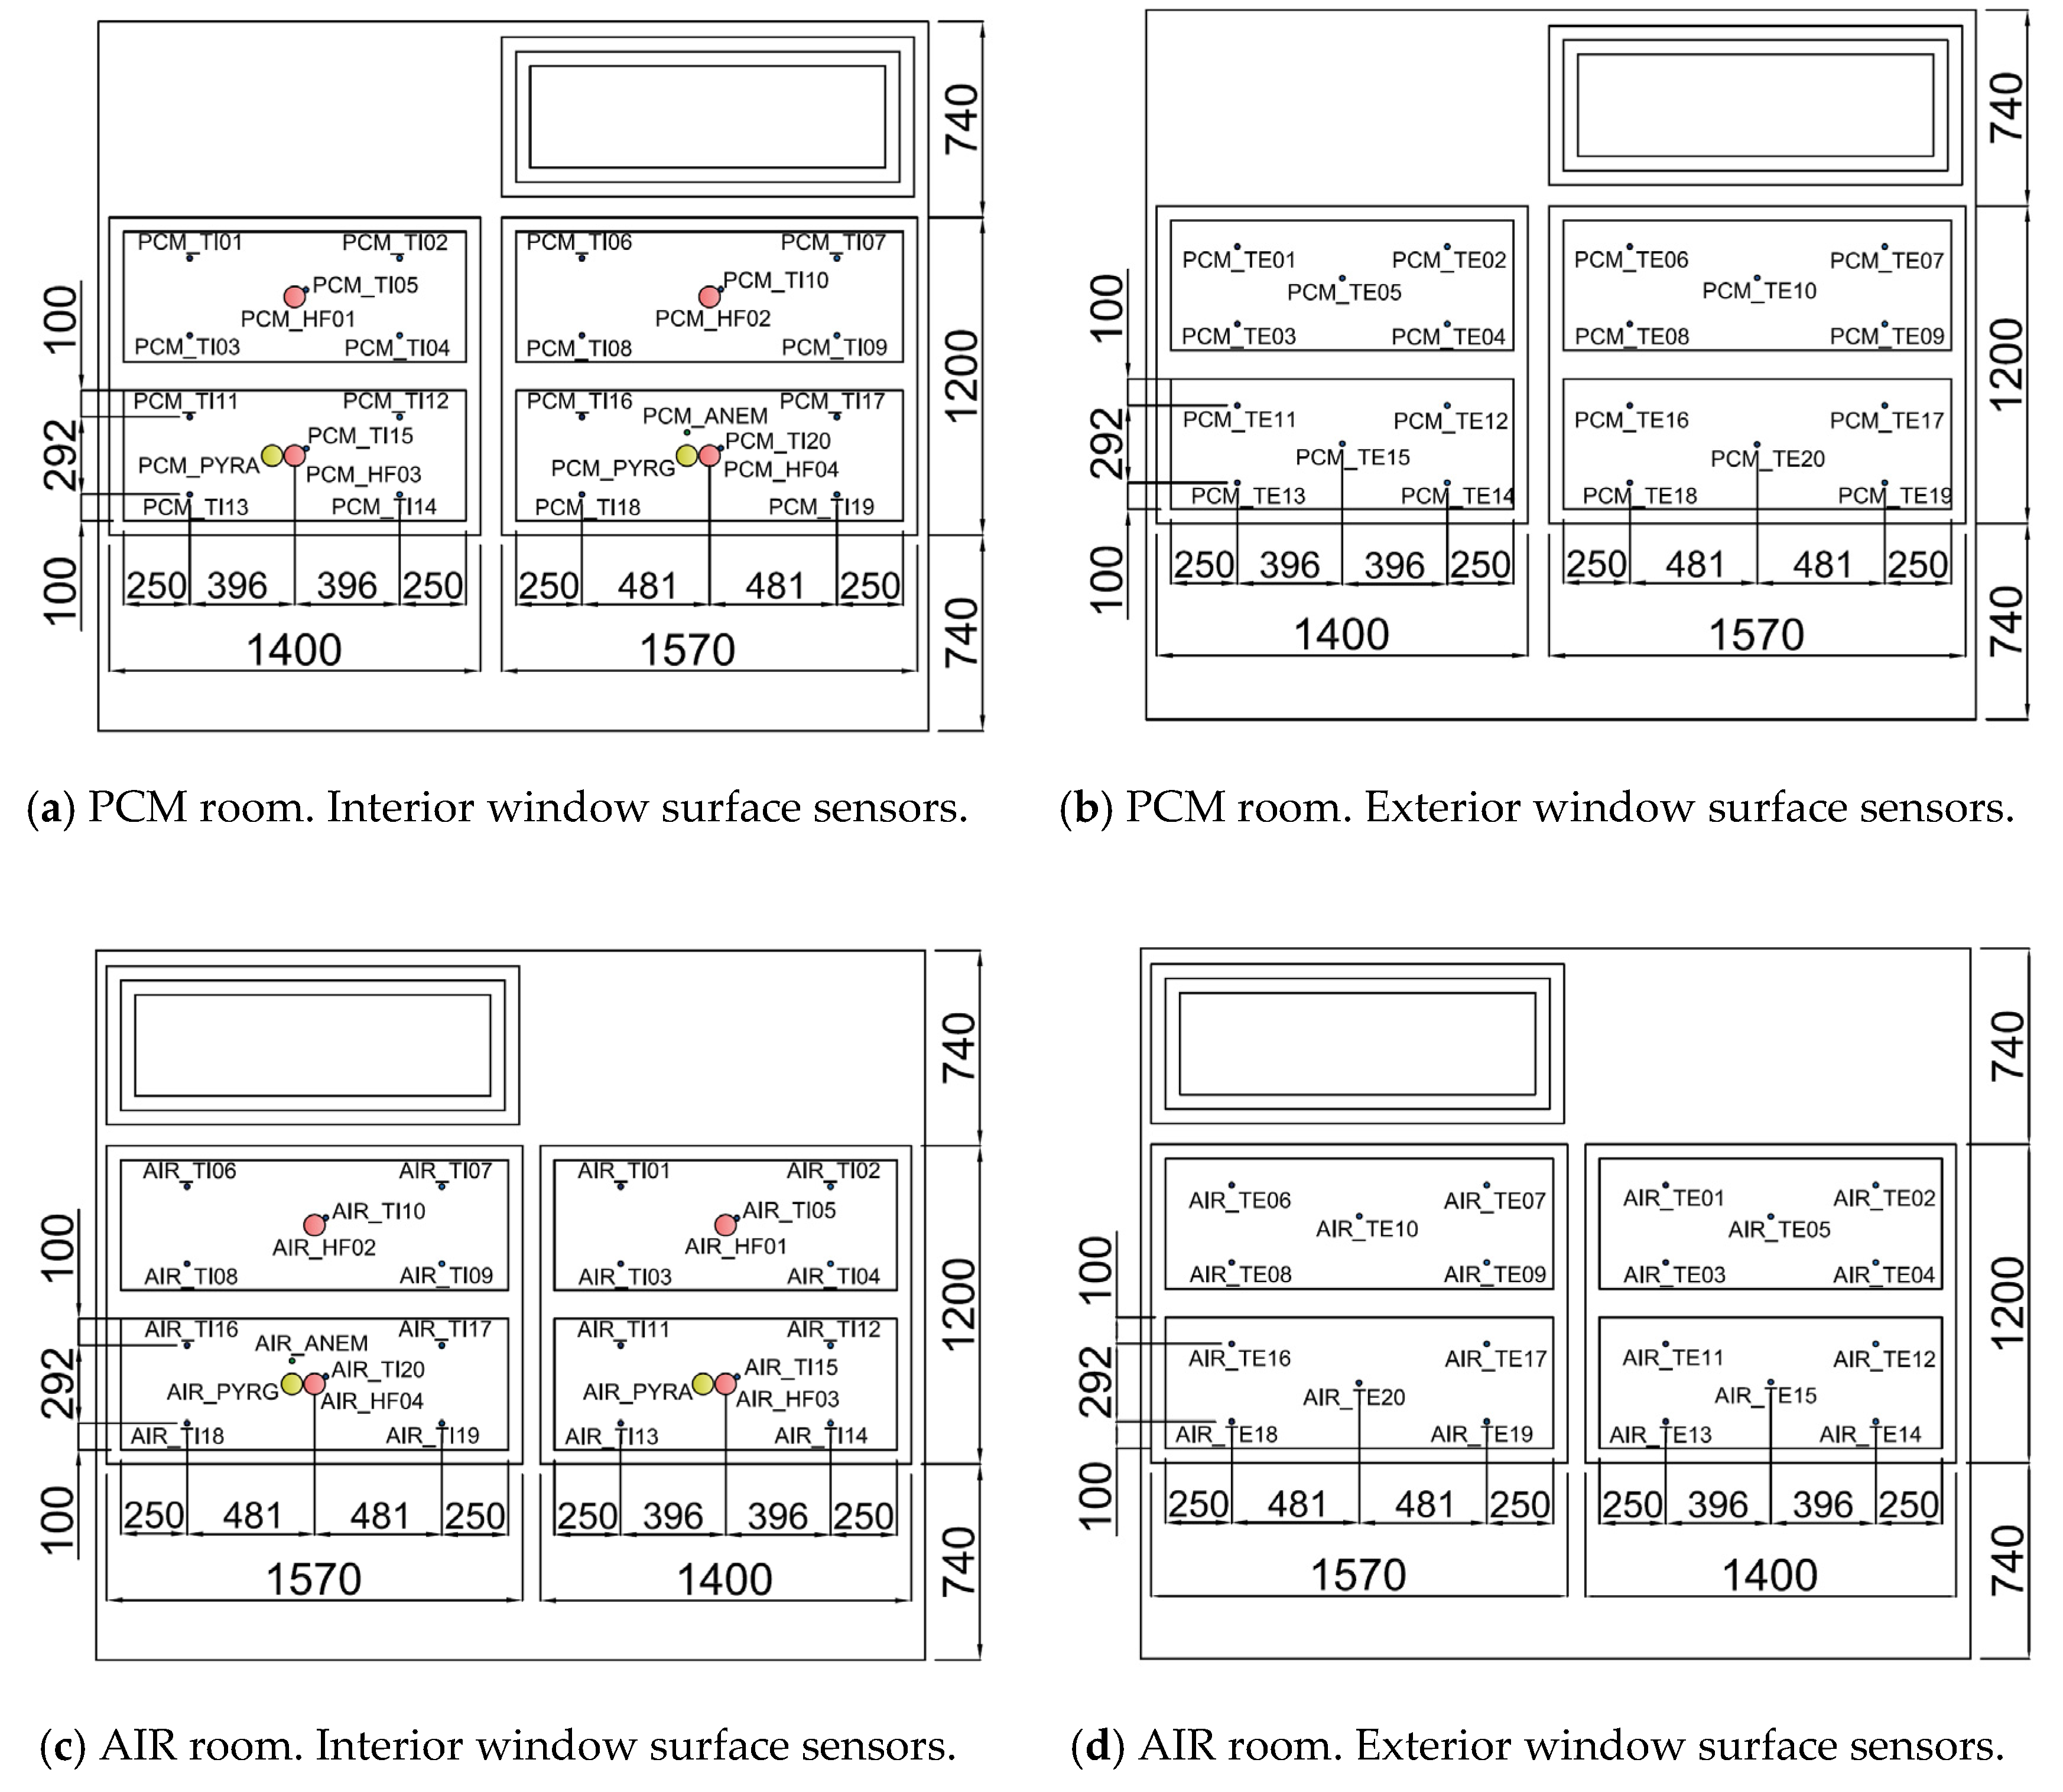
Figure 4.
Pictures of the experimental setup of both offices and PCM in solid-state and liquid state. 20 February 2020, at local time (UTC-3).
Figure 4.
Pictures of the experimental setup of both offices and PCM in solid-state and liquid state. 20 February 2020, at local time (UTC-3).
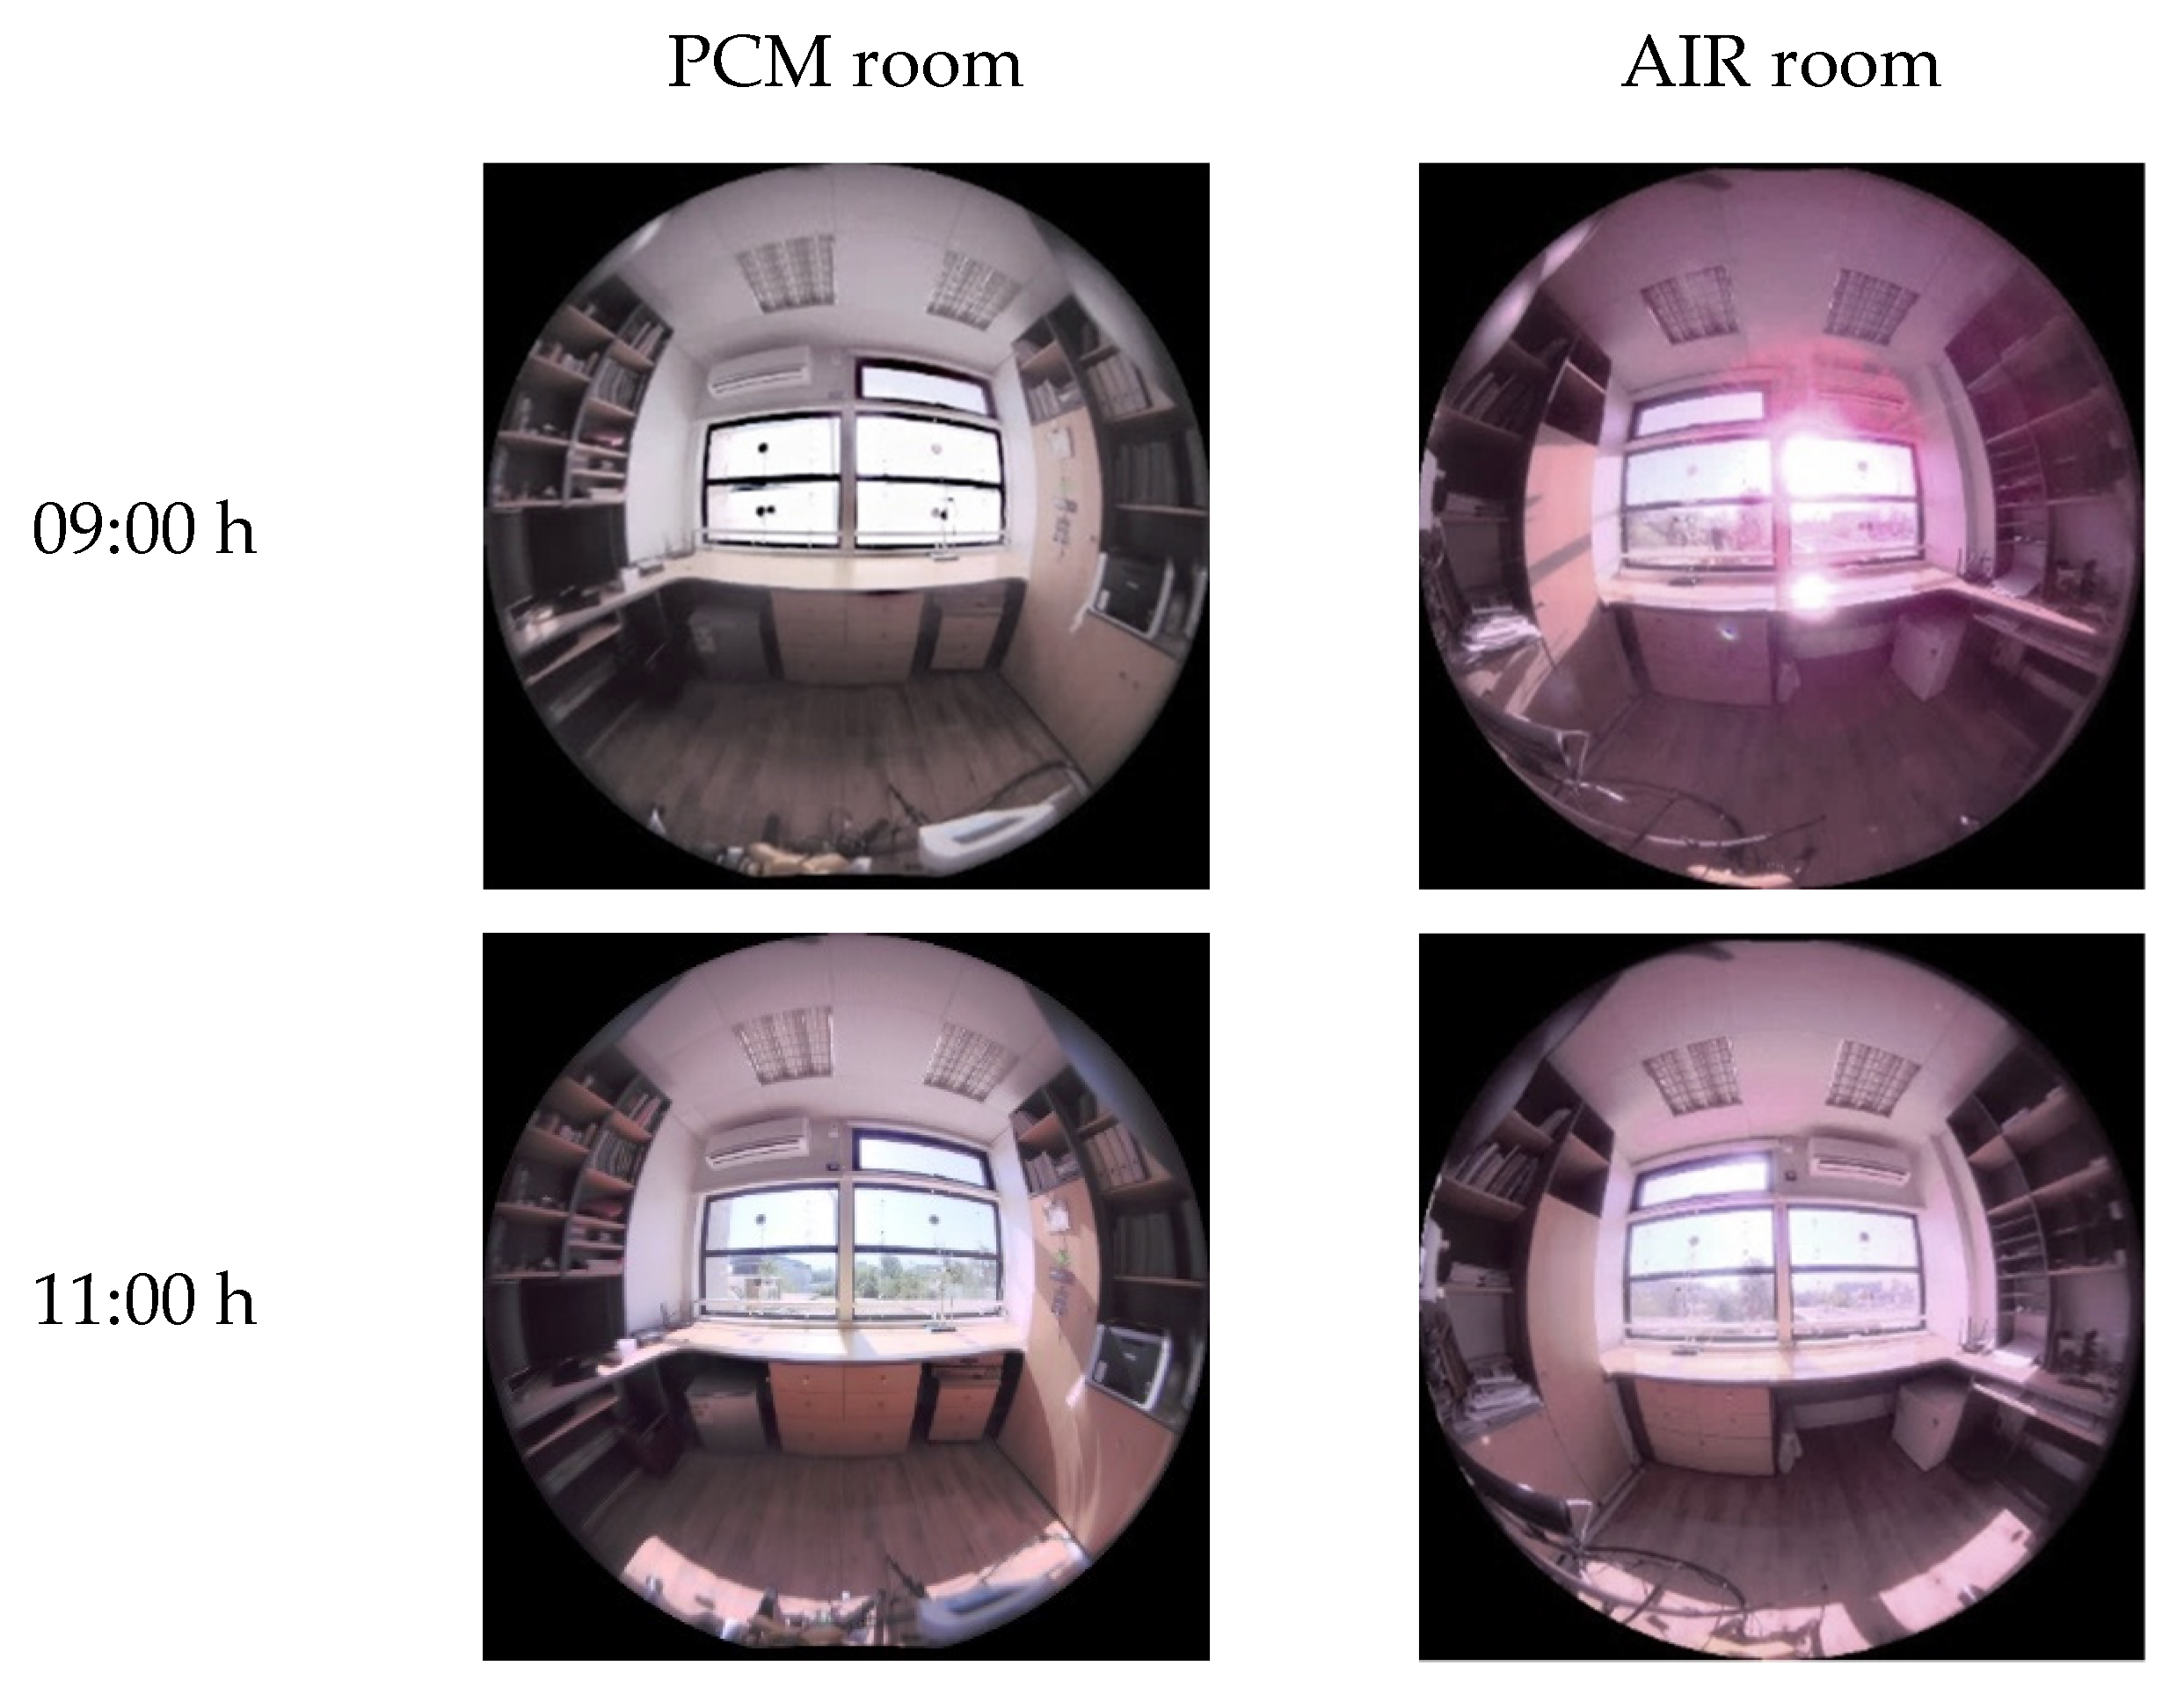
Figure 5.
Pictures of the experimental setup.
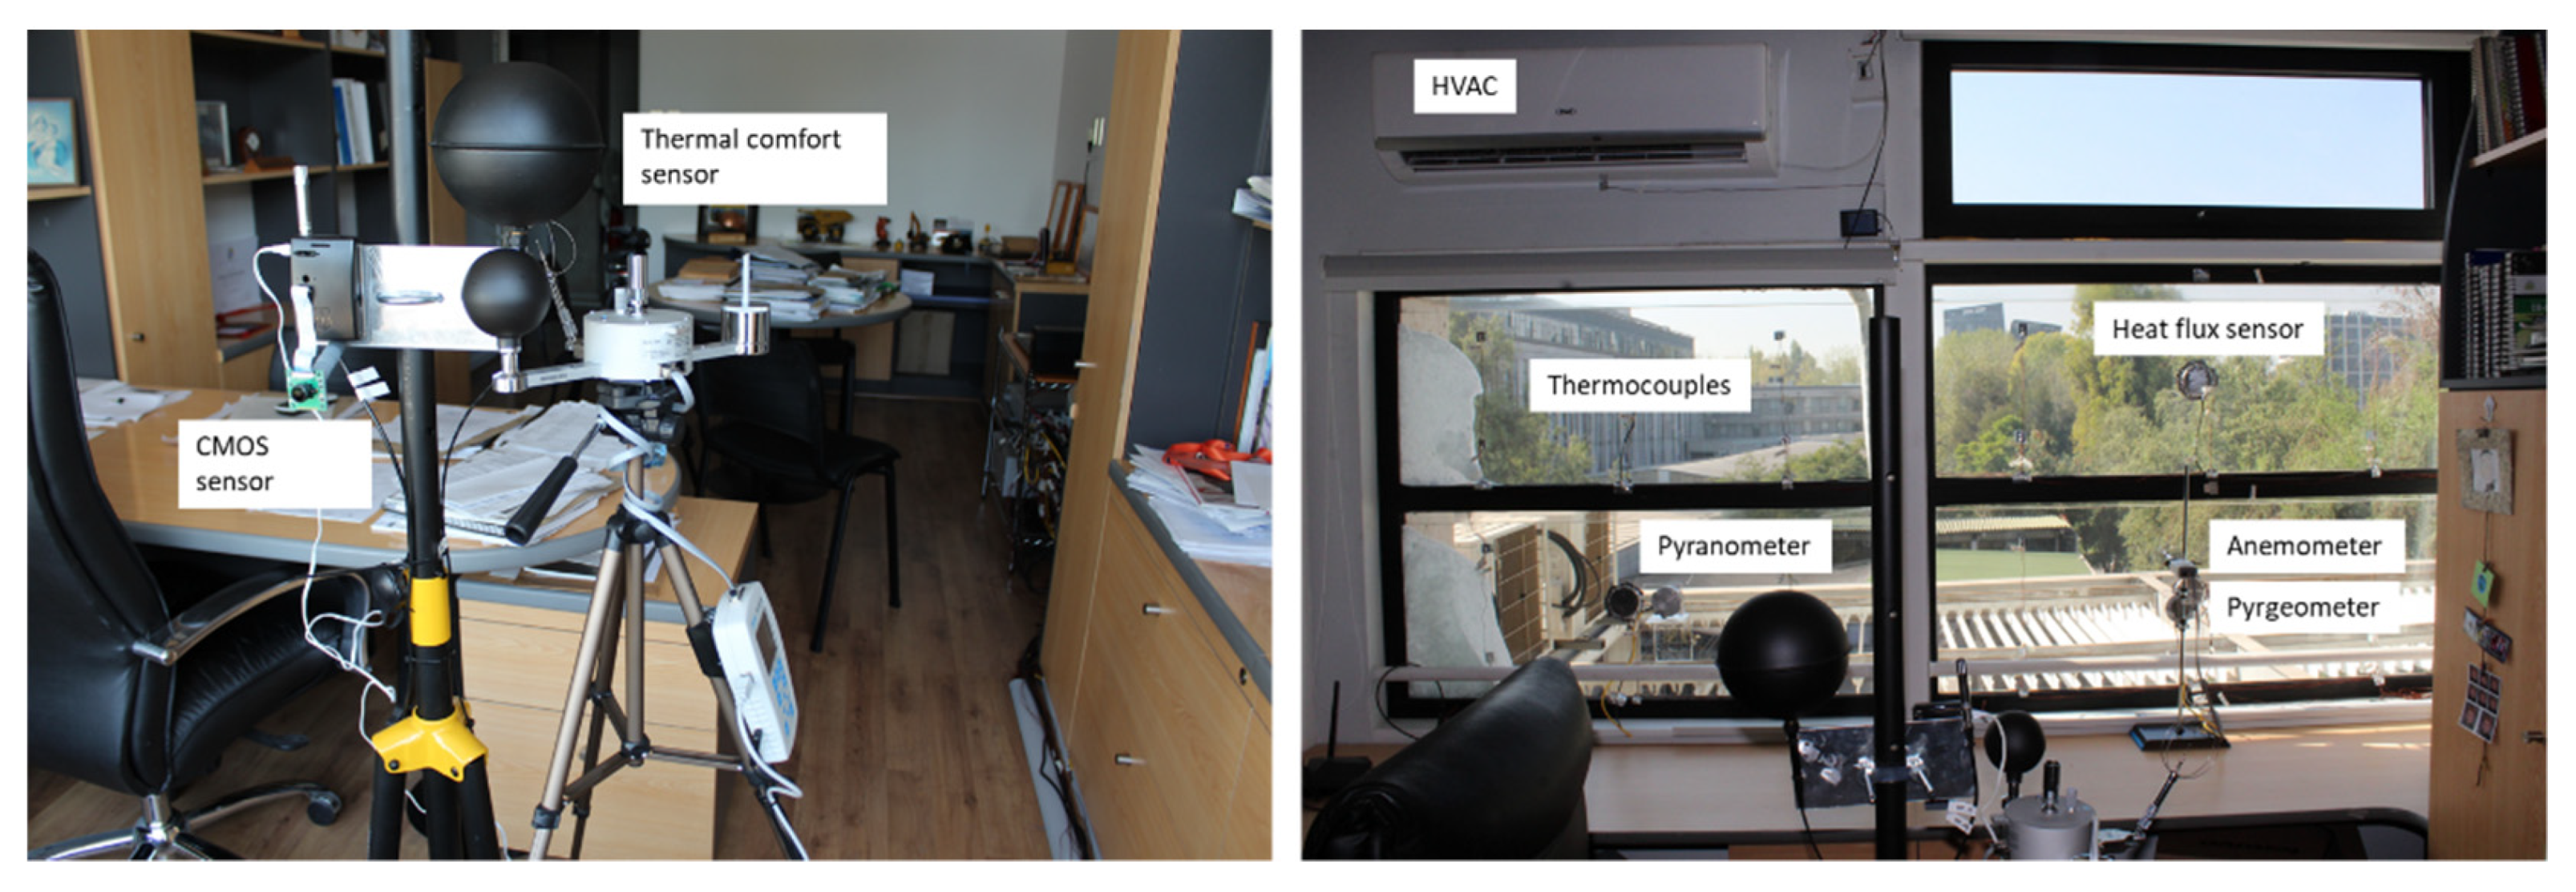
Figure 6.
Seasonal result of daily energy consumption (EC). Winter is not included because of insufficient days with valid data.
Figure 6.
Seasonal result of daily energy consumption (EC). Winter is not included because of insufficient days with valid data.

Figure 7.
Seasonal result of PMV and PMV*.
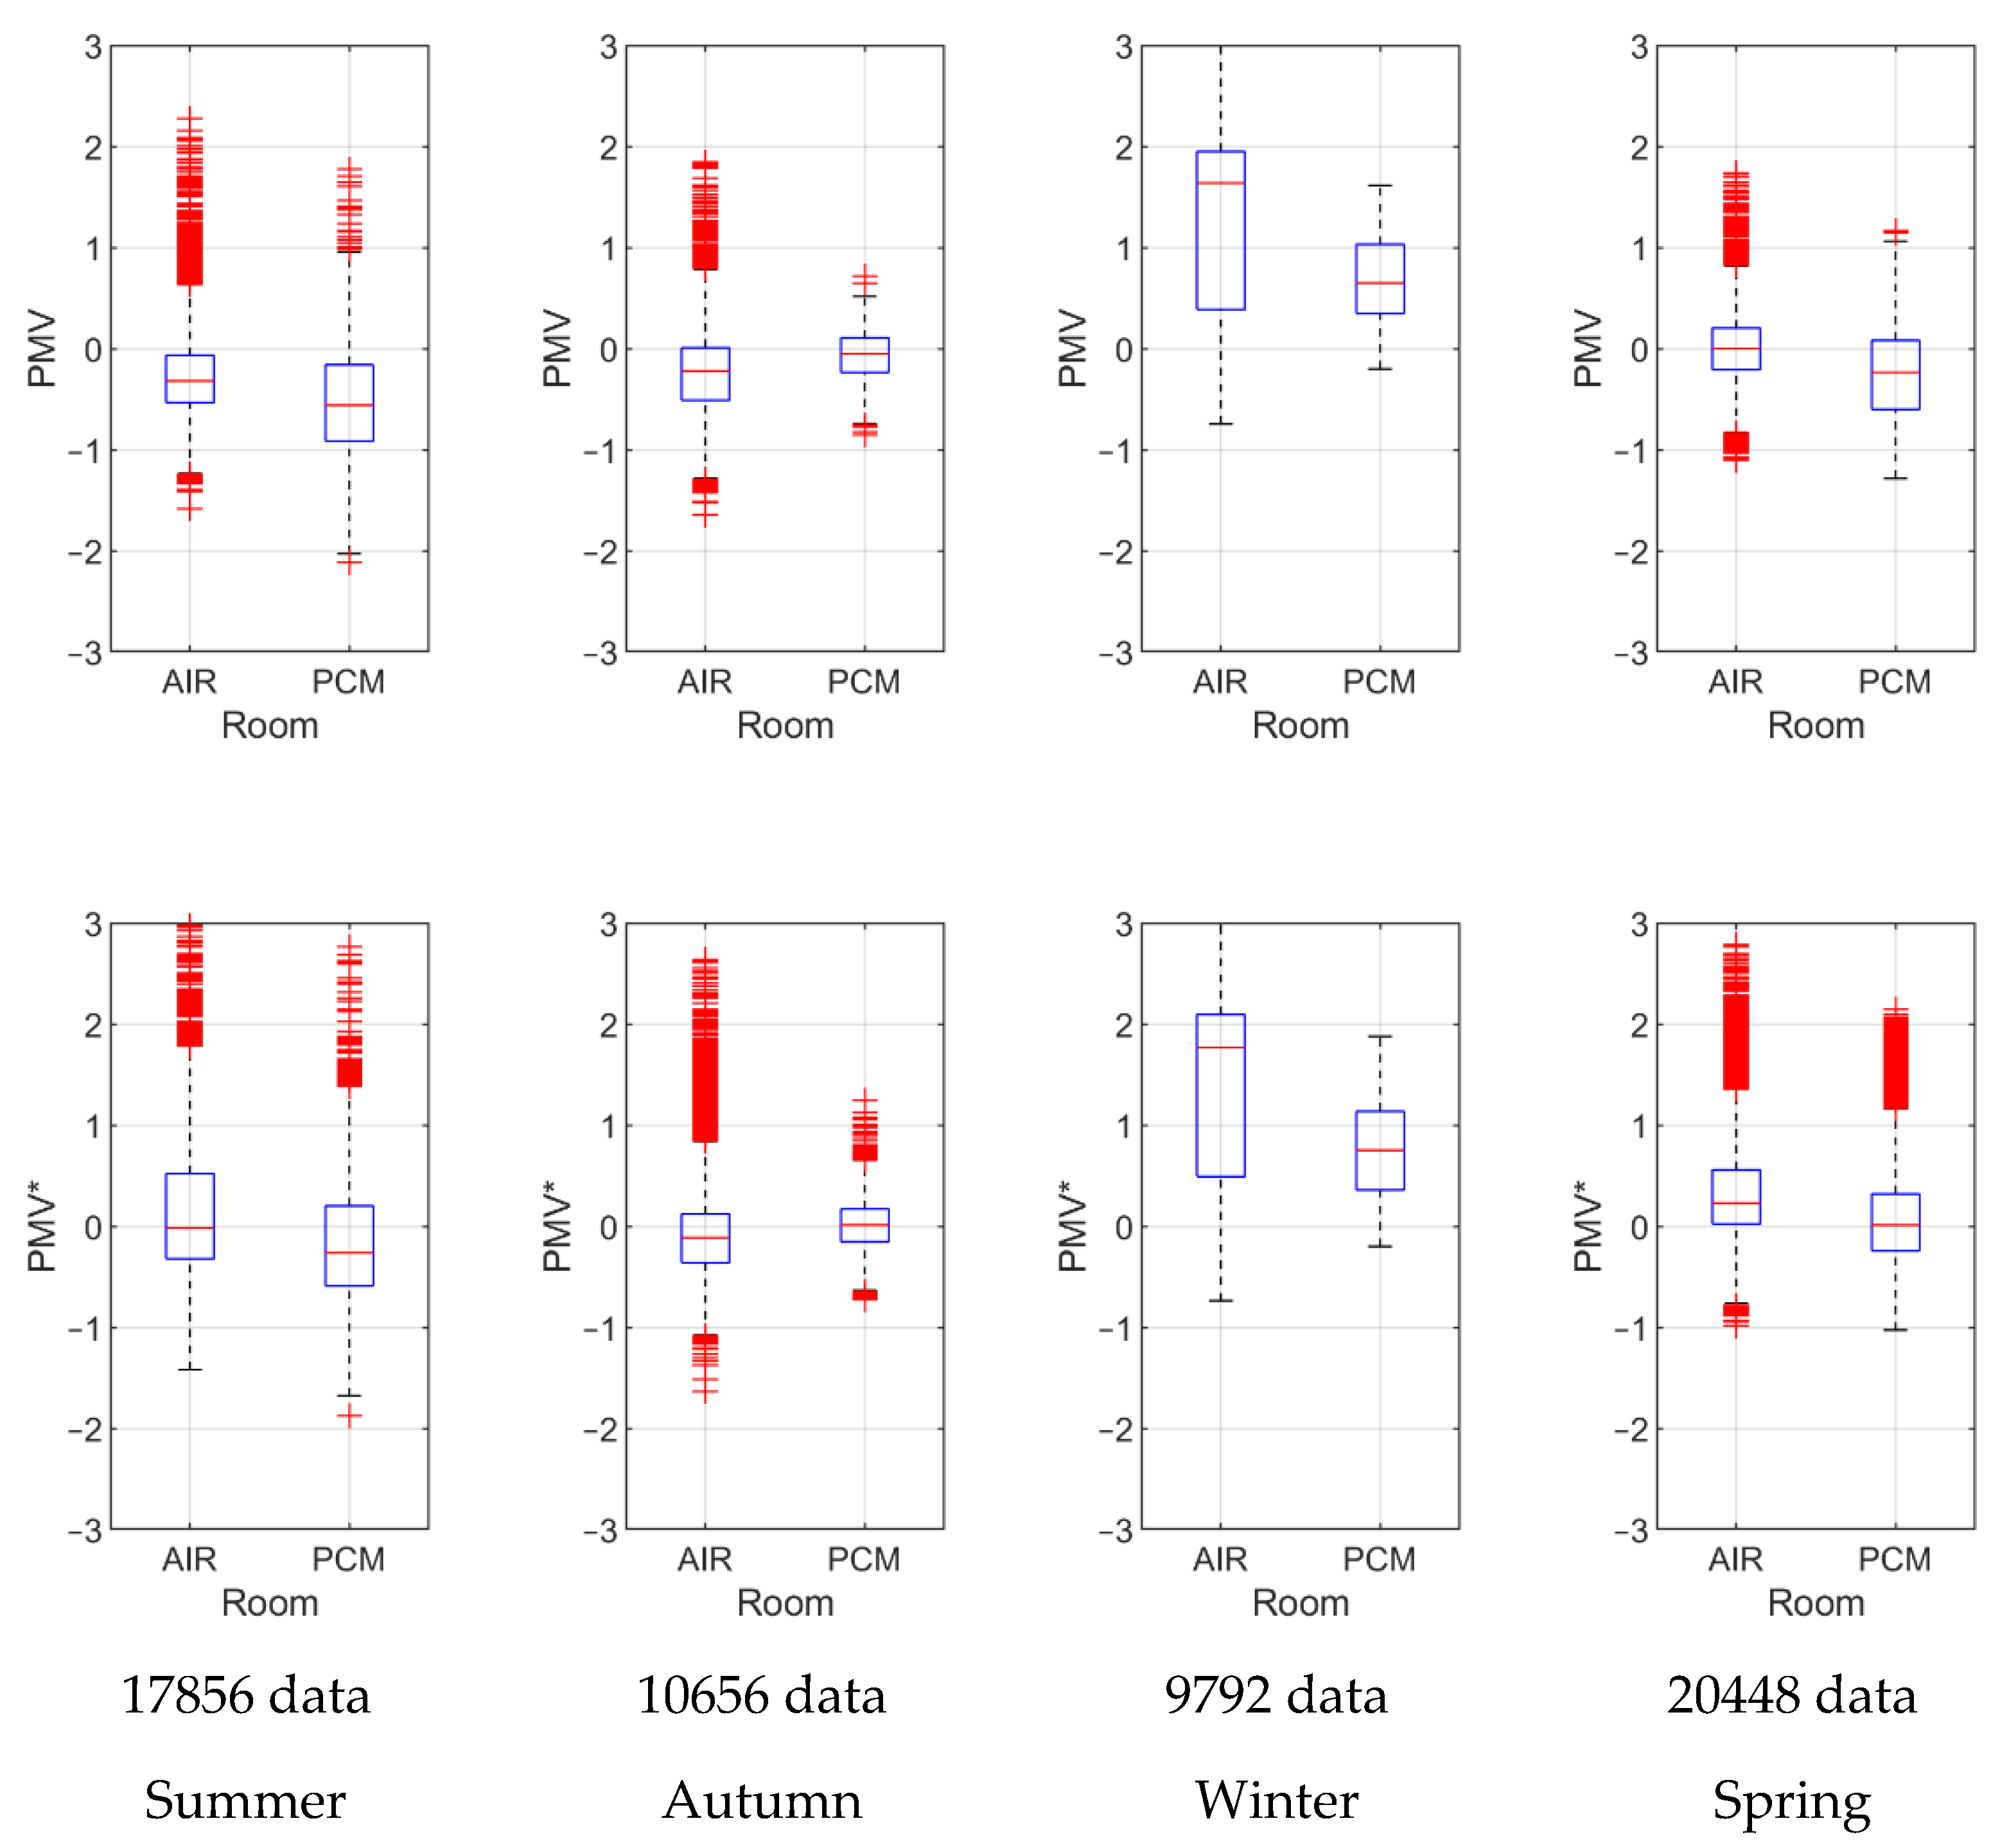
Figure 8.
Seasonal results of DGP.

Figure 9.
Results for representative days of summer. (a) Outdoor temperature and global horizontal radiation (GHI); (b) global vertical radiation; (c) HVAC power and energy consumption; (d) indoor air temperature & mean radiant temperature (MRT); (e) heat flux; (f) PMV; (g) PMV*; (h) DGP.
Figure 9.
Results for representative days of summer. (a) Outdoor temperature and global horizontal radiation (GHI); (b) global vertical radiation; (c) HVAC power and energy consumption; (d) indoor air temperature & mean radiant temperature (MRT); (e) heat flux; (f) PMV; (g) PMV*; (h) DGP.
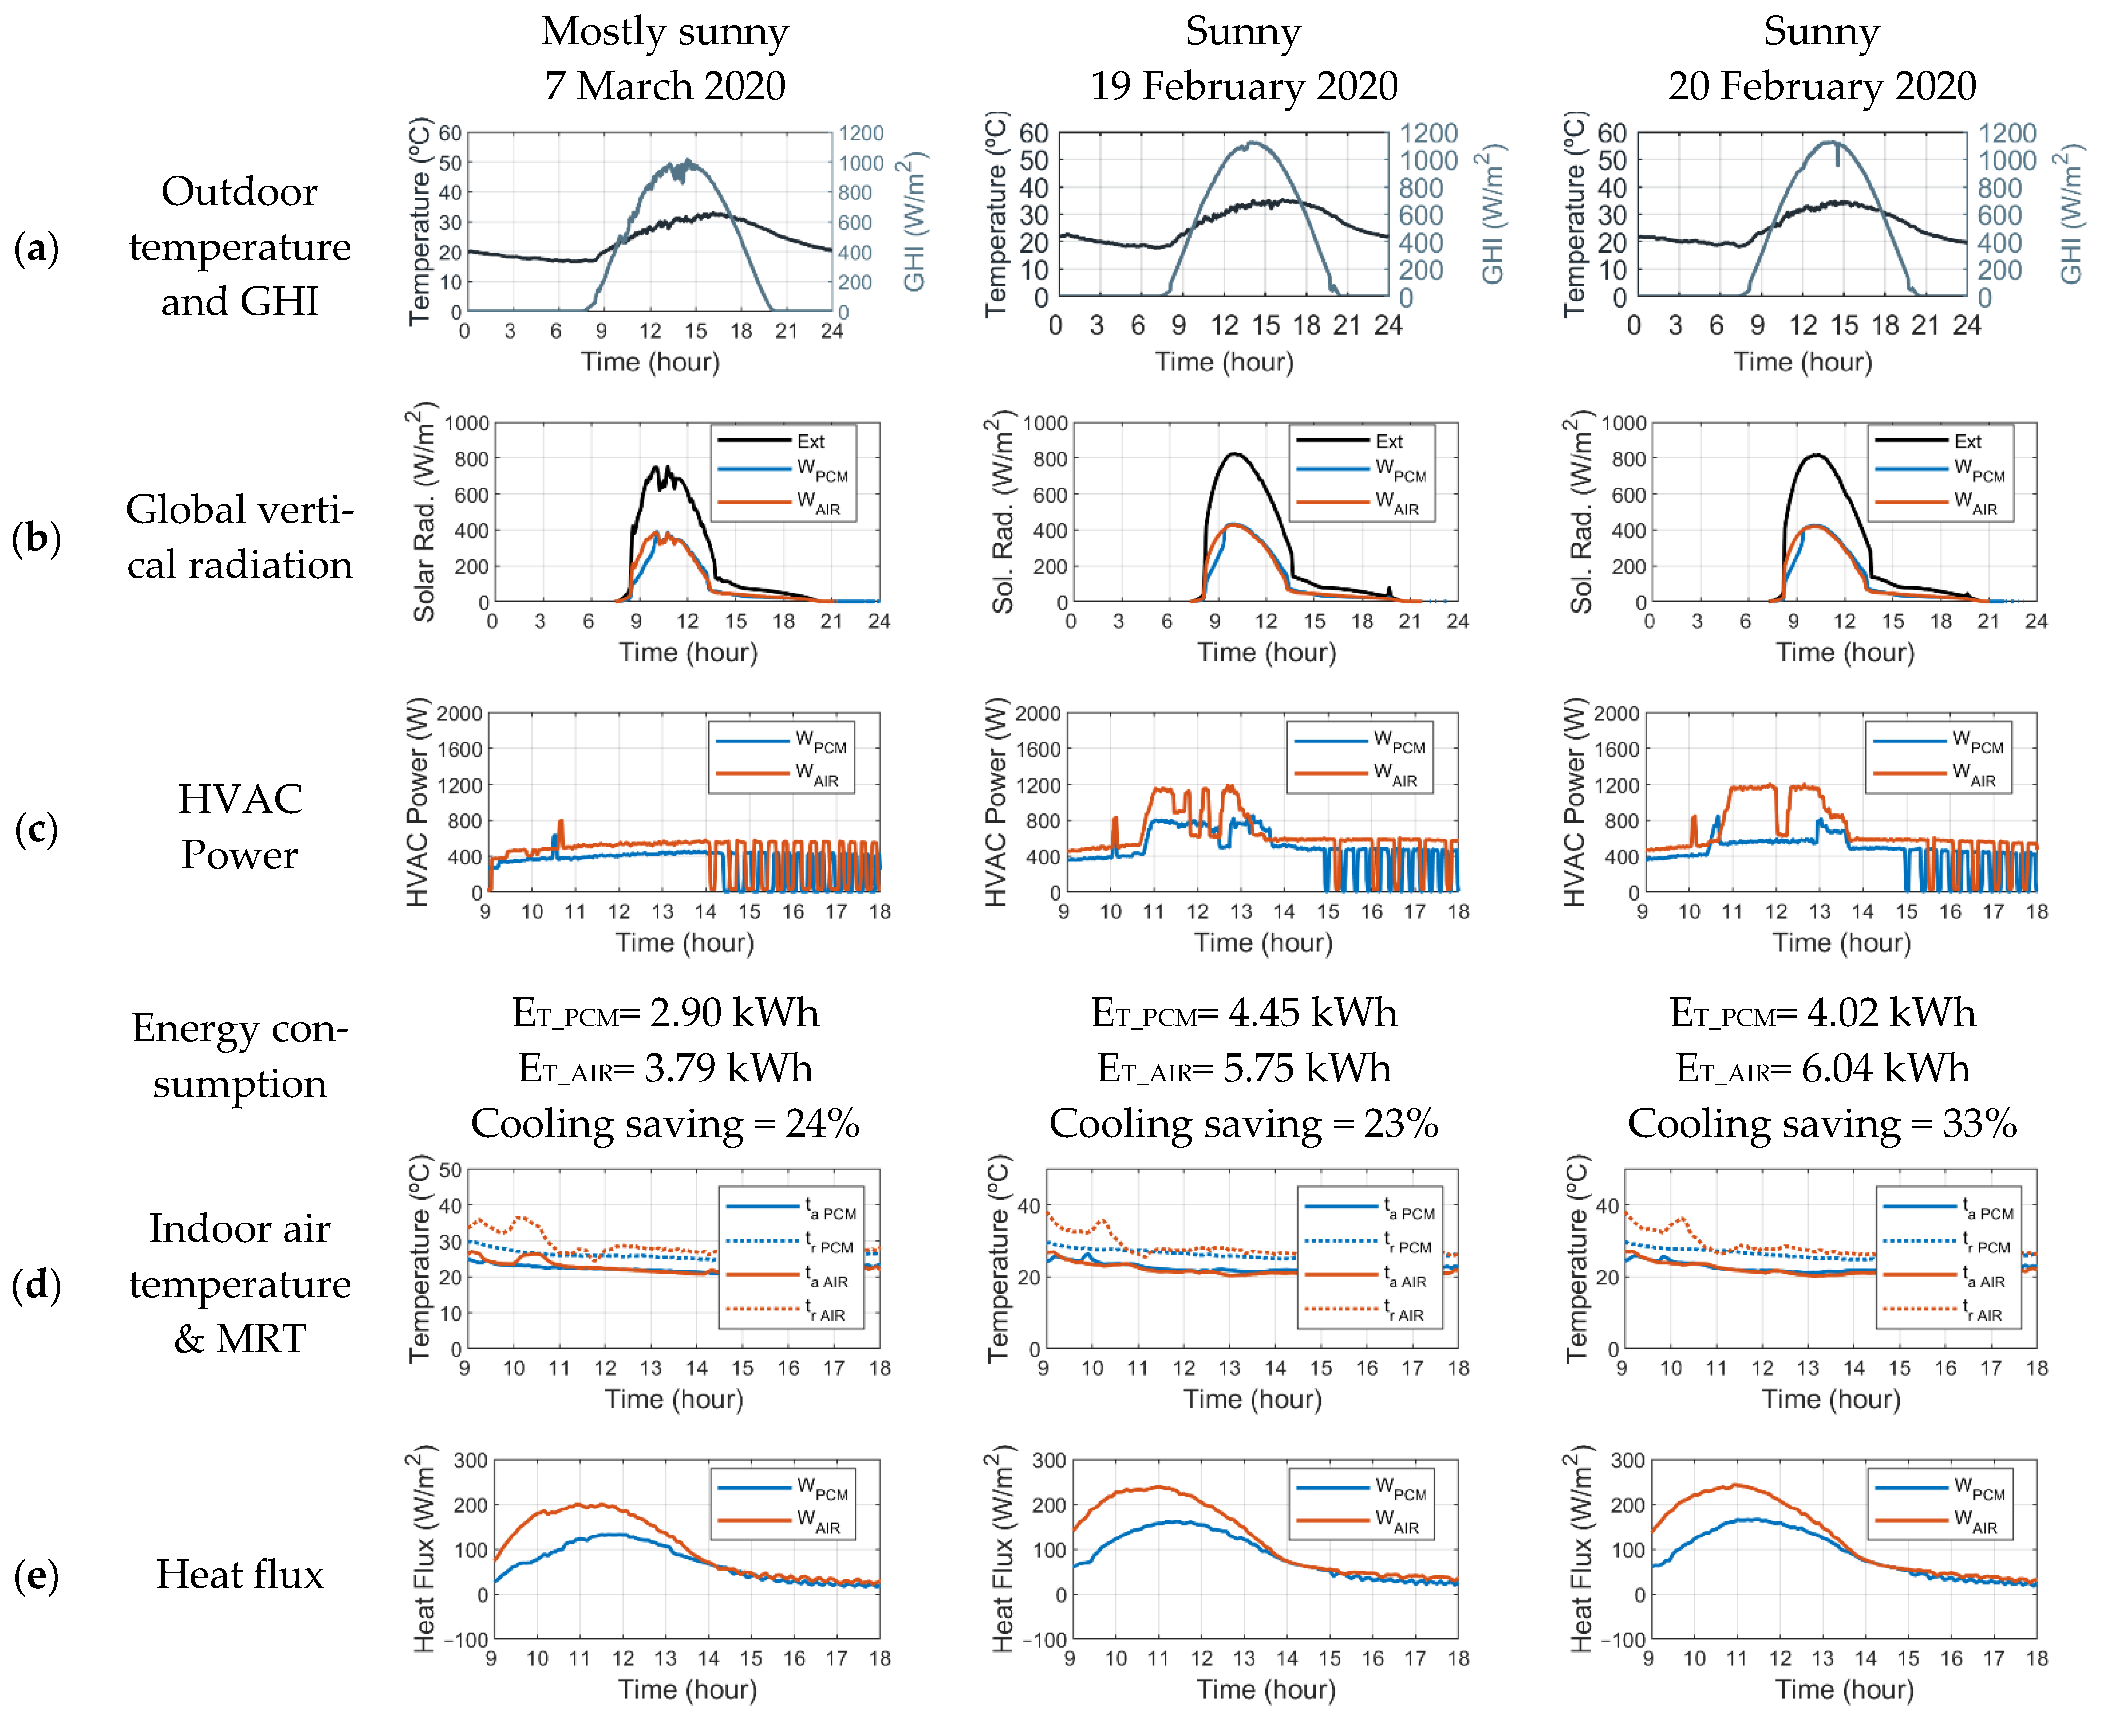

Figure 10.
Results for representative days of mid-season warm. (a) Outdoor temperature and global horizontal radiation (GHI); (b) global vertical radiation; (c) HVAC power and energy consumption; (d) indoor air temperature & mean radiant temperature (MRT); (e) heat flux; (f) PMV; (g) PMV*; (h) DGP.
Figure 10.
Results for representative days of mid-season warm. (a) Outdoor temperature and global horizontal radiation (GHI); (b) global vertical radiation; (c) HVAC power and energy consumption; (d) indoor air temperature & mean radiant temperature (MRT); (e) heat flux; (f) PMV; (g) PMV*; (h) DGP.
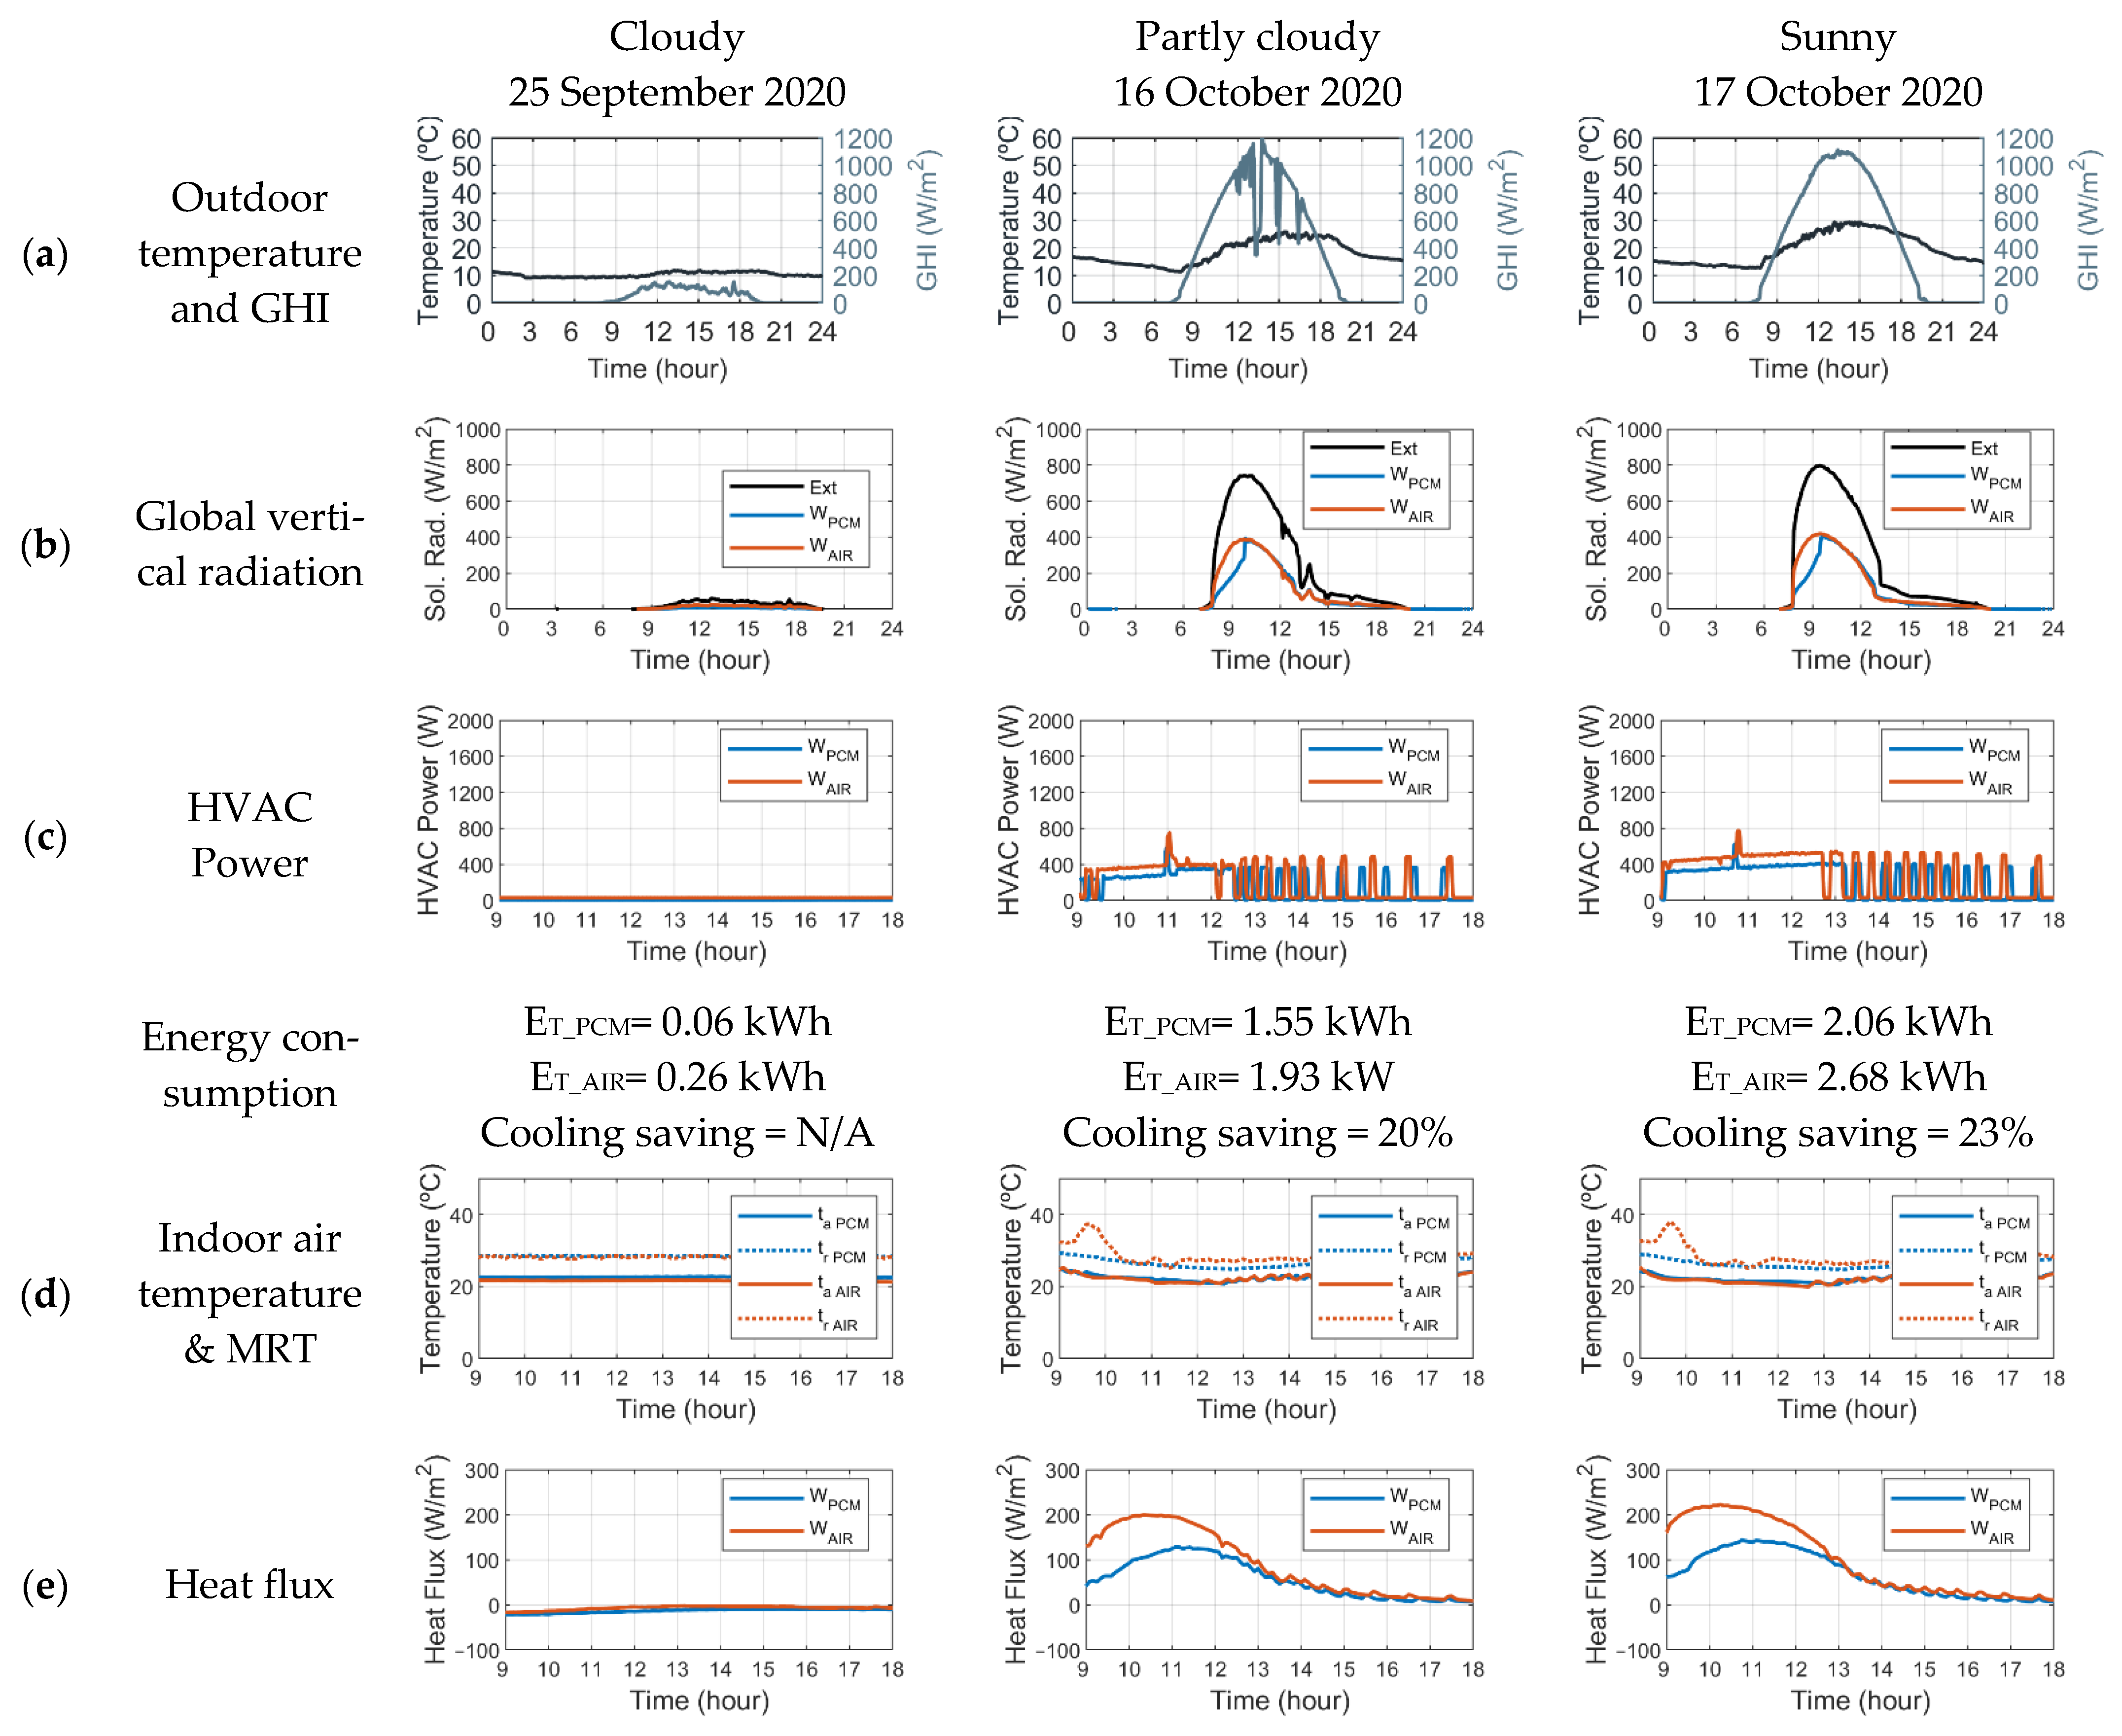

Figure 11.
Results for representative days of mid-season cold. (a) Outdoor temperature and global horizontal radiation (GHI); (b) global vertical radiation; (c) HVAC power and energy consumption; (d) indoor air temperature & mean radiant temperature (MRT); (e) heat flux; (f) PMV; (g) PMV*; (h) DGP.
Figure 11.
Results for representative days of mid-season cold. (a) Outdoor temperature and global horizontal radiation (GHI); (b) global vertical radiation; (c) HVAC power and energy consumption; (d) indoor air temperature & mean radiant temperature (MRT); (e) heat flux; (f) PMV; (g) PMV*; (h) DGP.

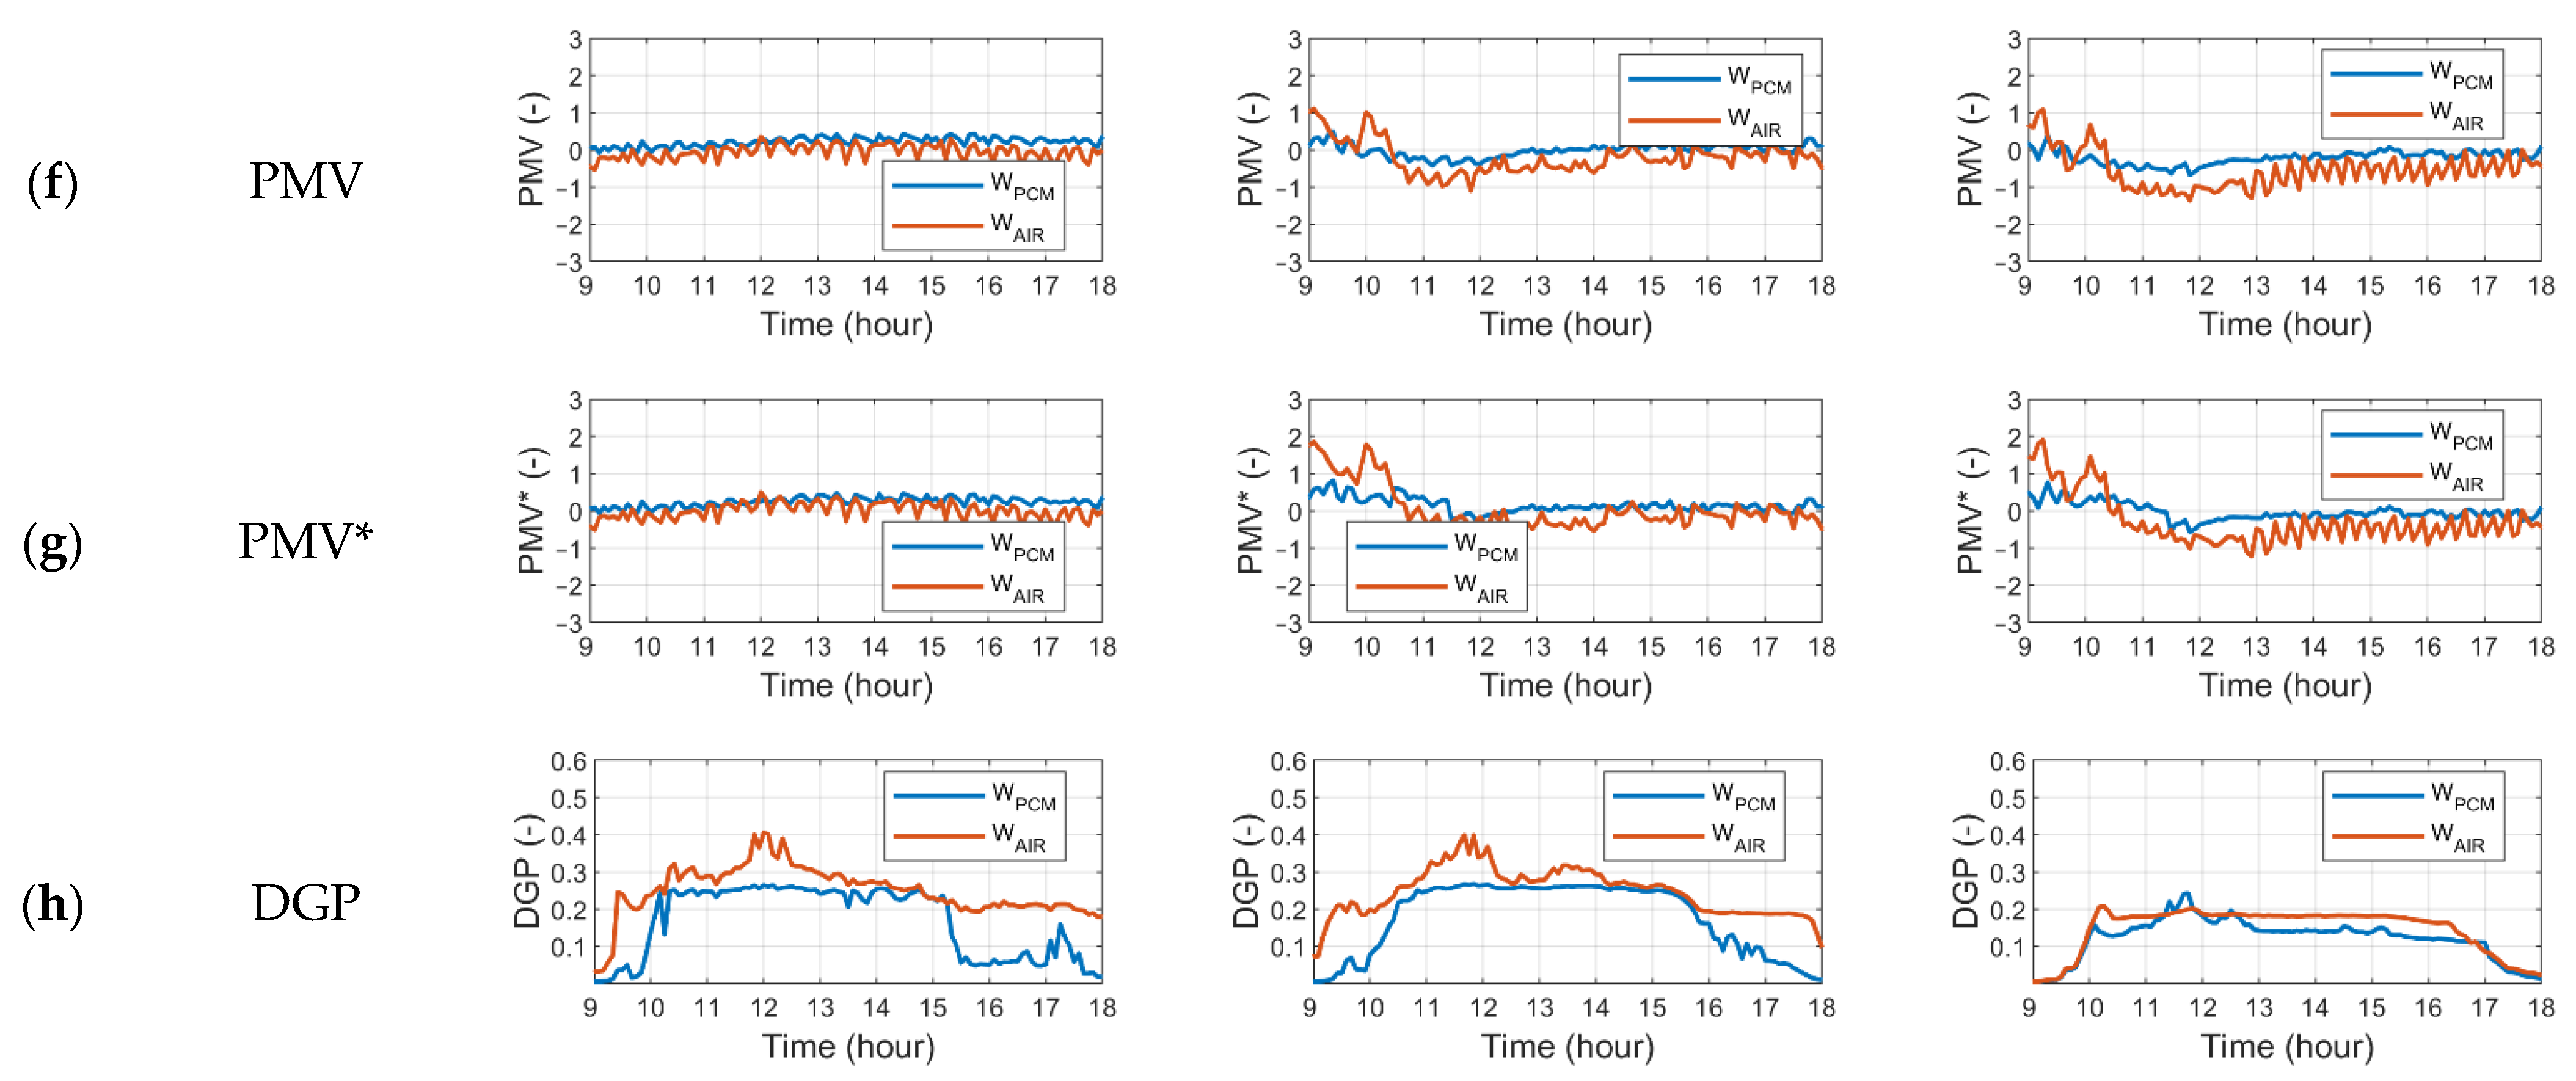
Figure 12.
Results for representative days of winter. (a) Outdoor temperature and global horizontal radiation (GHI); (b) global vertical radiation; (c) HVAC power and energy consumption; (d) indoor air temperature & mean radiant Ttemperature (MRT); (e) heat flux; (f) PMV; (g) PMV*; (h) DGP.
Figure 12.
Results for representative days of winter. (a) Outdoor temperature and global horizontal radiation (GHI); (b) global vertical radiation; (c) HVAC power and energy consumption; (d) indoor air temperature & mean radiant Ttemperature (MRT); (e) heat flux; (f) PMV; (g) PMV*; (h) DGP.


Figure 13.
Luminance map of 7 March 2020, at 9:30 a.m. in local time (UTC-3).

Figure 14.
(a) Relation between daily energy savings and daily maximum outdoor temperature. (b) Relation between daily energy savings and daily total global horizontal irradiance.
Figure 14.
(a) Relation between daily energy savings and daily maximum outdoor temperature. (b) Relation between daily energy savings and daily total global horizontal irradiance.


Table 1.
Thermophysical properties of the PCM window and double-glazed window.
| PCM Window (Liquid) | PCM Window (Solid) | Double-Glazed Window | |
|---|---|---|---|
| U-value (W/m2K) | 4.07 | 4.07 | 2.96 |
| Tvis (-) | 0.70 | 0.50 | 0.78 |
| Tsol (-) | 0.68 | 0.41 | 0.69 |
Table 2.
Quantity of days with valid data.
| Season | Energy Consumption | Thermal Comfort | Visual Comfort |
|---|---|---|---|
| Summer | 73 | 62 | 55 |
| Autumn | 32 | 37 | 33 |
| Spring | 63 | 71 | 68 |
| Winter | 6 | 34 | 45 |
Table 3.
Representative days for each season.
| Season | Day | Type | Tmin (°C) | Tmax (°C) | Tavg (°C) | It (Wh/m2day) |
|---|---|---|---|---|---|---|
| Summer | 19 February 2020 | Sunny | 17.8 | 35.4 | 25.9 | 8749 |
| 20 February 2020 | Sunny | 18.3 | 34.6 | 25.3 | 8651 | |
| 7 March 2020 | Mostly sunny | 16.6 | 33.0 | 23.6 | 7370 | |
| Mid-season warm | 17 October 2020 | Sunny | 12.7 | 29.4 | 19.7 | 8330 |
| 16 October 2020 | Partly cloudy | 4.6 | 25.9 | 18.2 | 7683 | |
| 25 September 2020 | Cloudy | 9.0 | 11.9 | 10.4 | 954 | |
| Mid-season cold | 16 May 2020 | Sunny | 11.2 | 28.5 | 19.0 | 4145 |
| 11 May 2020 | Partly cloudy | 7.7 | 22.0 | 13.9 | 4274 | |
| 19 May 2020 | Cloudy | 7.4 | 12.6 | 10.0 | 1312 | |
| Winter | 13 July 2020 | Sunny | 7.3 | 25.6 | 14.7 | 3752 |
| 9 July 2020 | Partly cloudy | 7.3 | 18.8 | 11.3 | 3069 | |
| 10 July 2020 | Cloudy | 8.4 | 14.5 | 10.7 | 1233 |
Table 4.
List of sensors of meteorological station and for outdoor measurements.
| Sensor | Measurement | Model | Company | Quantity | Accuracy |
|---|---|---|---|---|---|
| Pyrheliometer | Direct solar radiation | CHP1 | Kipp & Zonen | 1 | ±3% |
| Sun trucker | - | SOLYS 2 | Kipp & Zonen | 1 | - |
| Pyranometer | Diffuse solar radiation | CMP11 | Kipp & Zonen | 2 | ±1.35% |
| Pyranometer | Global horizontal solar radiation | CMP11 | Kipp & Zonen | 1 | ±1.35% |
| Humidity and temperature probe | Relative humidity and temperature | HMP60 | Vaisala | 1 | ±3% (temp) & ±5% (RH) |
| Thermocouple | Solar-air temperature | Type T | Pelican Wire | 1 | ±5% |
| Pyranometer | Global vertical solar radiation | CMP11 | Kipp & Zonen | 1 | ±1.35% |
Table 5.
List of sensors for each room.
| Sensor | Measurement | Model | Company | Quantity | Accuracy |
|---|---|---|---|---|---|
| Current/voltage sensor | HVAC power | Multivoies | OmégaWatt | 1 | ±2% |
| Thermocouples | Surface temperature | Type T | Pelican Wire Company | 20 | ±5% |
| Heat flux sensor | Heat flux | HFP01 | Hukseflux | 4 | ±5% |
| Pyranometer | Transmitted solar radiation | CMP11 | Kipp & Zonen | 1 | ±1.35% |
| Pyrgeometer | Longwave radiation | CGR3 | Kipp & Zonen | 1 | ±5.7% |
| Humidity and temperature probe | Relative humidity and temperature | HMP60 | Vaisala | 1 | ±3% (temp) & ±5% (RH) |
| Anemometer | Air velocity | SensoData 5500 Anemo | Sensor Electronic | 1 | ±0.02 m/s |
| Thermal comfort sensor | PMV | SensoData 5500 MK | Sensor Electronic | 1 | - 1 |
| Globe thermometer | Mean radiant temperature | Testo 0602 0743 | Testo | 1 | ±1% |
| CMOS sensor | Luminance distribution | IMX 219 | Sony | 1 | ±3% to ±17.5% |
| Raspberry Pi 3 | Data acquisition | Model B | Raspberry Foundation | 1 | - |
| Data Acquisition System | Data acquisition | 34972A | Keysight | 1 | - |
1 Thermal comfort sensor is equipped with a natural wet, air and globe thermometer with an accuracy of ±0.1 °C, a humidity probe with an accuracy of ±2%, and an air speed probe with an accuracy of ±0.02 m/s.
Table 6.
Parameters for thermal comfort analysis.
| Season | M (met) | Icl (clo) |
|---|---|---|
| Summer | 1.2 | 0.5 |
| Mid-seasons | 1.2 | 0.7 |
| Winter | 1.2 | 1.0 |
Table 7.
PMV scale.
| Sensation | Value |
|---|---|
| Cold | −3 |
| Cool | −2 |
| Slightly cool | −1 |
| Neutral | 0 |
| Slightly warm | +1 |
| Warm | +2 |
| Hot | +3 |
Table 8.
Glare rating of DGP (based on [36]).
Table 8.
Glare rating of DGP (based on [36]).
| Sensation | Range |
|---|---|
| Imperceptible | <0.35 |
| Perceptible | 0.35–0.40 |
| Disturbing | 0.40–0.45 |
| Intolerable | >0.45 |
Publisher’s Note: MDPI stays neutral with regard to jurisdictional claims in published maps and institutional affiliations. |
© 2021 by the authors. Licensee MDPI, Basel, Switzerland. This article is an open access article distributed under the terms and conditions of the Creative Commons Attribution (CC BY) license (https://creativecommons.org/licenses/by/4.0/).
Share and Cite
MDPI and ACS Style
Uribe, D.; Vera, S. Assessment of the Effect of Phase Change Material (PCM) Glazing on the Energy Consumption and Indoor Comfort of an Office in a Semiarid Climate. Appl. Sci. 2021, 11, 9597. https://doi.org/10.3390/app11209597
AMA Style
Uribe D, Vera S. Assessment of the Effect of Phase Change Material (PCM) Glazing on the Energy Consumption and Indoor Comfort of an Office in a Semiarid Climate. Applied Sciences. 2021; 11(20):9597. https://doi.org/10.3390/app11209597
Chicago/Turabian StyleUribe, Daniel, and Sergio Vera. 2021. "Assessment of the Effect of Phase Change Material (PCM) Glazing on the Energy Consumption and Indoor Comfort of an Office in a Semiarid Climate" Applied Sciences 11, no. 20: 9597. https://doi.org/10.3390/app11209597
Note that from the first issue of 2016, this journal uses article numbers instead of page numbers. See further details here.