
Microplastics in Wastewater and Drinking Water Treatment Plants: Occurrence and Removal of Microfibres


Department of Chemical and Environmental Engineering, University of Oviedo, C/Julián Clavería s/n, 33006 Oviedo, Spain
*
Author to whom correspondence should be addressed.
Appl. Sci. 2021, 11(21), 10109; https://doi.org/10.3390/app112110109
Submission received: 1 October 2021
/
Revised: 22 October 2021
/
Accepted: 26 October 2021
/
Published: 28 October 2021
(This article belongs to the Special Issue Textile Microfibers Pollution: Impacts, Behavior, and Mitigation)
Abstract
:Microplastics (MPs), and specifically microfibres (MPFs), are ubiquitous in water bodies, including wastewater and drinking water. In this work, a thorough literature review on the occurrence and removal of MPs, and specifically MPFs in WWTPs and DWTPs, has been carried out. When the water is treated, an average microfiber removal efficiency over 70% is achieved in WWTPs and DWTPs. These high percentages are still inefficient for avoiding the presence of a large number of microfibres in treated wastewater and also in tap water. RSF, DAF, oxidation ditch and CAS processes have been described as the most efficient treatments for eliminating MPFs from wastewater treatment. It is remarkable the wide range of the data reported on this topic; for example, treated wastewater contains between not detected and 347 MPFs/L, whereas tap water contains between not detected and 168 MPFs/L. Microfibres constitute more than half of the MPs found in treated wastewater and sewage sludge, whereas in DWTP effluents the percentage of MPFs is around 32%. Nevertheless, the relative amount of MPFs reported in tap water is notably higher (71%). Microfibres from WWTPs are discharged to the environment, being a source of MP pollution. Additionally, MPs released by DWTPs directly enter the drinking water lines, which constitute a direct route for MP human consumption, so that it has been estimated that an adult may ingest an average value of 7500 MPFs per year only via tap water. Thus, this review provides an update on the performance of WWTPs and DWTPs in removing MPs from water, which is an issue of great interest.
1. Introduction
Nowadays, Microplastics (MPs) can be considered ubiquitous in the environment. These microcontaminants can be originated from different sources. Certainly, these pollutants can be emitted as ‘primary MPs’ (i.e., tiny particles designed for commercial use intentionally included in cosmetics, personal care products, paints, shower gel, washing textiles, etc.) or ‘secondary MPs’, which result from the breakdown of larger plastic items, such as those coming from industrial and agricultural activities, fishing activities, tyre wear or mismanagement of plastics [1,2,3]. Most of these MPs end up in water masses [4,5,6,7].
Microfibres can be found in different aquatic environments—namely, oceans [8,9], lakes [10,11], wastewater [12,13], sea ice [14,15], the deep sea [16,17], rivers [18,19,20], drinking water [21,22,23], surface water [24], bays [25] and marine sediments [26,27,28]. This ubiquity notably contributes to the pollution of the environment, being a risk for fauna and flora [29,30], and for even humans. Additionally, it is known that fibres are present in everyday foods, such as common salt, sugar, honey, beer, bottled water, tap water, fish, lobster, mussels and oysters, which favours human ingestion of MPs [31,32]. A recent study reported that a person may ingest between 39,000–52,000 MPs per year via food and beverages, values that depend on age and sex. In addition, this value could be increased by another 90,000 MPs annually with the ingestion of bottled water and by 4000 MPs if tap water is also consumed [33]. Additionally, MPs are not only potentially harmful to humans via ingestion; the inhalation of airborne MPs (including fibres) and dermal contact also have to be considered [34]. Specifically, the presence of these microparticles in the atmosphere increase their entry into the human body by 74,000–121,000 MPs per year [33]. Moreover, it has been suggested that nanoplastics could cross the epidermal barrier, although it is not the major entry route of these particles [35]. The potential risk of MPs is enhanced by their hydrophobic character; thus, they have the capacity to adsorb chemical additives and toxic pollutants, such as metals, PCBs, pesticides, etc., on their surface [34,36,37,38].
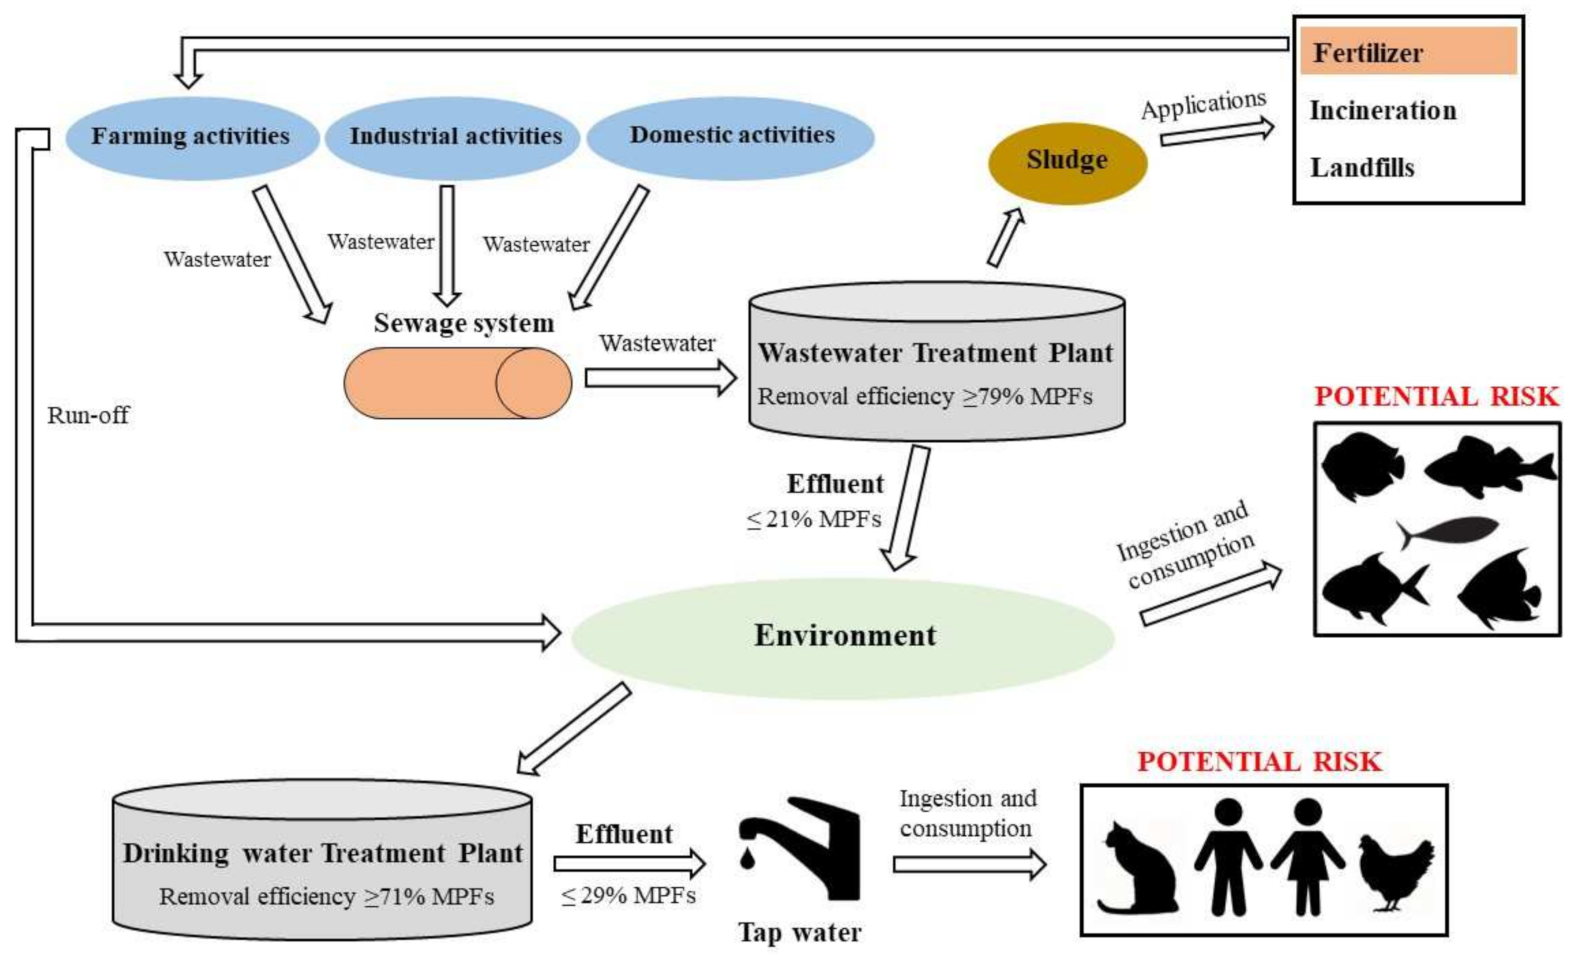
In order to reduce the dispersion of microfibres and other MPs in the environment, wastewater treatment plants (WWTPs) and drinking water treatment plants (DWTPs) should be considered as hotspots in which to tackle this environmental problem (Figure 1).
In this work, a review on the current status of the occurrence and removal of MPs in WWTPs and DWTPs was carried out. The incidence of MPs, especially microfibres, and the performance of treatment processes to reduce the presence of MPs in treated wastewater and drinking water was analysed. For wastewater from WWTPs a total of 67 studies from 23 countries were reviewed (Table 1), whereas for sludge 41 studies from 19 countries were evaluated (Table 2). In the case of DWTPs and tap water, a total of 9 studies from 6 countries and 11 studies from 20 countries, respectively, were considered (Tables 3 and 4). The vast majority of studies were carried out in Europe (48%) and Asia (43%); in particular, most of them were conducted in China (approximately 27% of the total studies reviewed).
2. Microplastics and Microfibres in WWTPs
MPs originated in industrial and urban activities can be driven into the sewage system, arriving to wastewater treatment plants (WWTPs). Even though these facilities can remove even more than 90% of MPs from wastewater, still millions of MPs are discharged to the environment in treated water each day [12,39,40]. Although great variability of data has been reported, the MP concentration usually ranges between 6.10 × 10² and 3.14 × 10⁴ particles/L in influent and 0.01 and 2.97 × 10² particles/L in effluent [39,41].
At the household level, microfibres can be originated in items of clothing and furnishing, whereas at the industrial level, microfibres come from the automotive sector and the construction and clothing industries, amongst others [42]. It is remarkable that the clothing industry generates around 42 million tonnes of microfibres annually [43]. Microfibres originated in laundry contributes 35% of the global release of primary MPs to the environment, and the vast majority of these microparticles found in wastewater come from household chores [2]. For example, between 1.1 × 10⁵ and 1.3 × 10⁷ polyester and cotton fibres can be emitted in only one wash [44,45]. Additionally, the use of garments also contributes to the emission of microfibres to the atmosphere due to wear and tear [46,47]. Most of these microfibres are introduced into the sewage system by means of surface runoff, and they subsequently arrive at WWTPs [48]. For instance, in Paris it was reported that fallout deposits an average value of 106.2 microfibres·m−2 per day [49,50].
In a conventional WWTP, wastewater treatment is carried out in different stages that can be classified as follows: pretreatment, primary treatment, secondary treatment and tertiary treatment. The pretreatment is a physical process that aims to remove large debris and/or residues contained in the wastewater, such as oil, grease, sand and solid wastes, in order to avoid clogging and other problems that would affect the correct performance of the facility [40]. This stage includes screening systems and grit and grease removal systems. Different works analysed the presence of MPs throughout WWTP operations. It has been reported that 45% of MPs are removed during the pretreatment process [48,51]. After that, a primary clarifier is commonly used to eliminate suspended solids [40]. Different parameters, such as the structure of suspended solids, the concentration, the retention time and shape of the settling tanks, affect the sedimentation capacity of the solid particles [40,52,53,54,55]. It has been found that primary treatment together with pretreatment could reduce the concentration of MPs with respect to raw wastewater by 78–98% [40,56]. Primary treatment can achieve different removal efficiencies with respect to pretreatment, depending on the specific characteristics of the settling tank, varying from 22% to 99% [48,51,52,57]. Once primary sludge is separated from the wastewater, the effluent from the primary treatment undergoes a secondary treatment consisting of a biological treatment that usually takes place under aerobic conditions [40]. Therefore, the aeration system used to supply the necessary oxygen for the process may make some MPs pass into the atmosphere. After the biological treatment, a settler is employed to separate the treated water from the secondary sludge [40]. For example, a study developed in Spain reported a MP removal efficiency of 67% in secondary treatment relative to primary treatment [48], whereas there was a 28% removal efficiency in a study from China [57]. Finally, a tertiary treatment is sometimes employed. The processes carried out in this stage depend on different factors, such as legal requirements, water reuse, etc. A coagulation–flocculation process followed by disinfection by chlorination or UV irradiation are the most common processes [40,58]. It has been reported that chlorination only reduces the MP concentration by 7%. However, other tertiary treatments such as rapid sand filtration (RSF) allow removals between 45% and 97%. The best results are obtained with membrane systems that remove more than 99% of the MP concentration [12,40]. In addition, photocatalytic degradation could be an effective method for MP elimination in wastewater; however, further research should be carried out in order to improve this technology’s performance [59,60].
2.1. Microfiber Occurrence in WWTPs
Table 1. shows an overview of the incidence of MPs, and specifically microfibres, in the influent and the effluent of different WWTPs worldwide. A total of 67 studies on WWTPs from 23 different countries were reviewed, and as far as we know, this is the first review on microfiber incidence in WWTPs.

Table 1.
Overview of the incidence of MPs, and specifically microfibres, in the influent and the effluent of different WWTPs worldwide. “W” followed by a number refers to different WWTP analysed in the cited reference.
Table 1.
Overview of the incidence of MPs, and specifically microfibres, in the influent and the effluent of different WWTPs worldwide. “W” followed by a number refers to different WWTP analysed in the cited reference.
| Treated Water (m3/day) | Influent | Effluent | MPF Removal (%) | Number of MPFs per Day | References | ||||||
|---|---|---|---|---|---|---|---|---|---|---|---|
| (MPs/L) | % MPFs | (MPFs/L) | (MPs/L) | % MPFs | (MPFs/L) | Influent | Effluent | ||||
| Australia | - | - | - | - | 1 | - | - | - | - | - | [61] |
| W1: 3.1 × 10⁵ W2: 1.7 × 10⁴ W3: 1.3 × 10⁴ | W2: 1.44 W3: 2.20 | - | - | W1: 1.5 W2: 0.48 W3: 0.28 | W1: 80 W2: 50 W3: 86 | W1: 1.2 W2: 0.24 W3: 0.24 | - | - | W1: 3.7 × 10⁸ W2: 4.1 × 10⁶ W3: 3.1 × 10⁶ | [62] | |
| W1: 1.3 × 10⁵ W2: 6.5 × 10⁴ W3: 1.5 × 10⁵ | W1: 92 W2: 98 W3: 55 | W1: 83.7 W2: 81.6 W3: 49.1 | W1: 77 W2: 80 W3: 27 | W1: 0.18 W2: 0.96 W3: 0.91 | W1: 66.7 W2: 88.5 W3: 72.5 | W1: 0.12 W2: 0.85 W3: 0.66 | W1: 99.8 W2: 98.9 W3: 97.6 | W1: 1.0 × 10¹⁰ W2: 5.2 × 10⁹ W3: 4.1 × 10⁹ | W1: 1.6 × 10⁷ W2: 5.5 × 10⁷ W3: 9.9 × 10⁷ | [63] | |
| 4.8 × 10⁴ | 11.80 | 35.6 | 4.20 | 2.76 | 57.8 | 1.60 | 61.9 | 2.0 × 10⁸ | 7.7 × 10⁷ | [64] | |
| Canada | 4.9 × 10⁵ | 31.1 | 69.1 | 21.5 | 0.5 | 60 | 0.3 | 98.6 | 1.5 × 10¹⁰ | 2.5 × 10⁸ | [65] |
| 8 × 10⁷ | - | - | - | 1.76 | 82 | 1.44 | - | - | 1.2 × 10⁸ | [66] | |
| China | 2 × 10⁴ | 79.9 | 40 | 31.96 | 28.4 | 45 | 12.78 | 60.0 | 6.4 × 10⁸ | 2.6·108 | [57] |
| 1.2 × 10⁵ | 0.28 | 79 | 0.22 | A: 0.13 B: 0.05 | A: 46 B: 50 | A: 0.06 B: 0.03 | A: 72.7 B: 86.4 | 2.6 × 10⁷ | 5.1 × 10⁶ | [67] | |
| W1: 5.5 × 10⁵ W2: 2 × 10⁵ W3: 1.2 × 10⁶ | W1: 4.2 W2: 0.5 W3: 1.4 | W1: 42.8 W2: 60 W3: 42.9 | W1: 1.80 W2: 0.3 W3: 0.60 | W1: 2.7 W2: 0.3 W3: 0.6 | W1: 100 W2: 100 W3: 66.7 | W1: 2.7 W2: 0.3 W3: 0.4 | W1: 0 W2: 0 W3: 33.3 | W1: 9.9 × 10⁸ W2: 6 × 10⁷ W3: 7.2 × 10⁸ | W1: 1.5 × 10⁹ W2: 6 × 10⁷ W3: 4.8 × 10⁸ | [68] | |
| 1.2 × 10⁵ | 6.55 | 17.7 | 1.16 | 0.59 | 30.4 | 0.18 | 84.5 | 1.4 × 10⁸ | 2.2 × 10⁷ | [69] | |
| 1 × 10⁶ | 12.03 | 86 | 10.35 | 0.59 | 86 | 0.51 | 95.1 | 1.0 × 10¹⁰ | 5.1 × 10⁸ | [70] | |
| 6.0 × 10⁵ | 126 | 43 | 54.18 | 30.6 | 61 | 18.67 | 65.5 | 3.3 × 10¹⁰ | 1.1 × 10¹⁰ | [71] | |
| 3.3 × 10⁸ b | - | - | - | 1.72 | 39.5 | 0.68 | - | - | 2.2 × 10⁸ | [72] | |
| 1.5 × 10⁵ | 288.5 | 62 | 178.87 | 22.9 | 40 | 9.16 | 94.9 | 2.7 × 10¹⁰ | 1.4 × 10⁹ | [73] | |
| 3 × 10⁵ | 16.0 | 57.2 | 9.15 | 2.9 | 93.1 | 2.70 | 70.5 | 2.8 × 10⁹ | 8.1 × 10⁸ | [74] | |
| W1: 7 × 10⁴ W2: 3 × 10⁵ | W1: 23.3 W2: 80.5 | W1: 62 W2: 60 | W1: 13.98 W2: 48.30 | W1: 7.9 W2: 30.3 | W1: 65 W2: 75 | W1: 5.14 W2: 22.73 | W1: 63.2 W2: 52.9 | W1: 9.8 × 10⁸ W2: 1.5 × 10¹⁰ | W1: 3.6 × 10⁸ W2: 6.8 × 10⁹ | [75] | |
| - | W1: 129.3 b W2: - | W1: 8 W2: - | W1: 10.34 W2: - | W1: 14.3 W2: 8.25 | W1: 5 W2: 18 | W1: 0.72 W2: 1.49 | W1: 93.0 | - | - | [76] | |
| - | W1: 10.30 W2: 22.05 | W1: 15.5 W2: 17.7 | W1: 1.60 W2: 3.90 | W1: 0.24 W2: 0.34 | W1: 25 W2: 96.3 | W1: 0.06 W2: 0.33 | W1: 96.3 W2: 91.5 | - | - | [77] | |
| W1: 1 × 10⁵ W2: 1.5 × 10⁴ W3: 3 × 10⁴ W4: 9.5 × 10⁴ | W1: 1290 b W2: 538.67 W3: 958 W4: 650 | W1: 40 W2: 68 W3: 85 W4: 70 | W1: 516 W2: 366.30 W3: 814.3 W4: 455 | W1: 20.96 W2: 31.85 W3: 40.67 W4: 20.44 | W1: 70 W2: 65 W3: 70 W4: 75 | W1: 14.67 W2: 20.70 W3: 28.47 W4: 15.33 | W1: 97.2 W2: 94.4 W3: 96.5 W4: 96.6 | W1: 5.2 × 10¹⁰ W2: 5.5 × 10⁹ W3: 2.4 × 10¹⁰ W4: 4.3 × 10¹⁰ | W1: 1.5 × 10⁹ W2: 3.1 × 10⁸ W3: 8.5 × 10⁸ W4: 1.5 × 10⁹ | [78] | |
| W1: 1 × 10⁵ W2: 4.5 × 10⁴ W3: 1 × 10⁵ W4: 4 × 10⁴ | W1&W2: 8.72 W3: 1.70 W4: 0.70 | W1&W2: 18 W3: 85 W4: 40 | W1&W2: 1.57 W3: 1.45 W4: 0.28 | W1: 0.78 W2: 0.62 W3: 0.10 W4: 0.07 | W1: 45 W2: 46 W3: 80 W4: 100 | W1: 0.35 W2: 0.29 W3: 0.08 W4: 0.07 | W1: 77.7 W2: 81.5 W3: 94.5 W4: 75 | W1&W2: 2.3 × 10⁸ W3: 1.5 × 10⁸ W4: 1.1 × 10⁷ | W1: 3.5 × 10⁷ W2: 1.3 × 10⁷ W3: 8.0 × 10⁶ W4: 2.8 × 10⁶ | [79] | |
| W1: 4 W2: 60 W3: 30 W4: 10 W5: 15 | W1: 430 W2: 540 W3: 1150 W4: 2154 W5: 1692 | W1: 0 W2: 0 W3: 17.2 W4: 28.6 W5: 27.3 | W1: 0 W2: 0 W3: 197.8 W4: 616.0 W5: 461.9 | W1: 0 W2: 0 W3: 400 W4: 750 W5: 300 | W1: 0 W2: 0 W3: 36.9 W4: 46.2 W5: 66.7 | W1: 0 W2: 0 W3: 147.6 W4: 346.5 W5: 200.1 | W1: 0 W2: 0 W3: 25.4 W4: 43.8 W5: 56.7 | W3: 5.9 × 10⁶ W4: 6.2 × 10⁶ W5: 6.9 × 10⁶ | W3: 4.4 × 10⁶ W4: 3.5 × 10⁶ W5: 3.0 × 10⁶ | [80] | |
| Denmark | 2.1 × 10⁶ | 7827 a,b (2223–18,285) | ~1.3 | 101.8 | 120.3 a (19–447) | ~1.3 | 1.56 | 98.5 | 2.1 × 10¹¹ | 3.3 × 10⁹ | [81] |
| Finland | 1 × 10⁴ | 57.6 | 91.3 | 52.6 | 1.05 | 47.6 | 0.5 | 99.1 | 5.3 × 10⁸ | 5 × 10⁶ | [51] |
| - | 610 | 29.5 | 180 | 13.5 | 36.3 | 4.9 | 97.3 | - | - | [82] | |
| W1: 1 × 10⁸ W2: 5 × 10⁶ W3: 7 × 10⁶ W4: 3.2 × 10⁷ | - | - | - | W1: 0.03 W2: 0.005 W3: 0.1 W4: 0.02 | W1: 100 W2: 100 W3: 75 W4: 72.5 | W1: 0.03 W2: 0.005 W3: 0.075 W4: 0.015 | - | - | W1: 3 × 10⁹ W2: 2.5 × 10⁷ W3: 5.3 × 10⁸ W4: 4.8 × 10⁸ | [83] | |
| 2.7 × 10⁵ | 567.1 | 78 | 442.2 | 6.84 | 30 | 2.04 | 99.5 | 1.2 × 10¹¹ | 5.5 × 10⁸ | [84] | |
| France | 2.4 × 10⁵ | 293 | 100 | 293 | 35 | 100 | 35 | 88.1 | 7.0 × 10¹⁰ | 8.4 × 10⁹ | [49] |
| 8 × 10⁴ | 244 | 25 | 61 | 2.84 | 40 | 1.14 | 98.1 | 4.9 × 10⁹ | 9.1 × 10⁷ | [85] | |
| Germany | 5.0 × 10³ b | - | - | - | 1.82 | 61 | 1.11 | - | - | 5.5 × 10⁶ | [86] |
| 1 × 10⁴ | - | - | - | 5.9 3 | 25 23.3 | 1.48 1.00 | - | - | 1.5 × 10⁷ 1 × 10⁷ | [87] | |
| W1: 8 × 10⁴ W2: 6.3 × 10⁴ | - | - | - | W1: 7.0 W2: 14 | W1: 0 W2: 21.4 | W1: 0 W2: 3 | - | - | W2: 1.9 × 10⁸ | [88] | |
| Hong Kong | W1: 8.3 × 10⁴ W2: 1.8 × 10⁶ | W1: 2.06 W2: 1.01 | W1: 71 W2: 55 | W1: 1.46 W2: 0.56 | W1: 0.27 W2: 0.40 | W1: 13 W2: 40 | W1: 0.04 W2: 0.16 | W1: 97.3 W2: 71.4 | W1: 1.2 × 10⁸ W2: 1.0 × 10⁹ | W1: 3.3 × 10⁶ W2: 2.9 × 10⁸ | [89] |
| 9.3 × 10⁴ | 10.36 | 80.4 | 8.33 | - | - | - | - | 7.8 × 10⁸ | - | [90] | |
| Iran | 2.2 × 10⁴ | 12.67 | 94.9 | 12.02 | 0.42 | 77.5 | 0.33 | 97.3 | 2.6 × 10⁸ | 7.3 × 10⁶ | [91] |
| 6.1 × 10⁴ | - | - | - | W1: 1.91 W1: 2.11 | W1: 50.7 W1: 57.3 | W1: 0.97 W1: 1.21 | - | - | 1.2 × 10⁸ | [92] | |
| 2.9 × 10⁴ b | 9.2 | 73.1 | 6.73 | 0.58 | 67.4 | 0.39 | 94.2 | 1.9 × 10⁸ | 1.1 × 10⁷ | [93] | |
| Israel | 3 × 10⁴ | 64.78 129.67 | 73.8 69.5 | 47.78 90.11 | 1.97 7.30 | 90.4 94 | 1.78 6.86 | 92.4 96.3 | 1.4 × 10⁹ 2.7 × 10⁹ | 5.3 × 10⁷ 2.1 × 10⁸ | [94] |
| Italy | 4 × 10⁵ | 2.5 | 20 | 0.5 | 0.4 | 25 | 0.1 | 80 | 2 × 10⁸ | 4 × 10⁷ | [95] |
| 1.8 × 10⁴ | 3.64 | 50 | 1.82 | 0.52 0.2 | 45 100 | 0.23 0.2 | 87.4 89.0 | 3.3 × 10⁷ | 4.1 × 10⁶ 3.6 × 10⁶ | [96] | |
| Korea | W1: 3.5 × 10⁴ W2: 1.1 × 10⁵ W3: 1.3 × 10⁵ | W1: 29.85 W2: 16.45 W3: 13.87 | W1: 50.1 W2: 59 W3: 78.9 | W1: 14.95 W2: 9.7 W3: 10.95 | W1: 0.44 W2: 0.14 W3: 0.28 | W1: 59.1 W2: 64.3 W3: 42.9 | W1: 0.26 W2: 0.09 W3: 0.12 | W1: 98.3 W2: 99.1 W3: 98.9 | W1: 5.2 × 10⁸ W2: 1.1 × 10⁹ W3: 1.4 × 10⁹ | W1: 9.1 × 10⁶ W2: 9.9 × 10⁶ W3: 1.6 × 10⁷ | [97] |
| 2.6 × 10⁵ a | 98.28 a (10–470) | 31.8 | 31.25 | 0.11 a (0.004–0.51) | 17.7 | 0.02 | 99.9 | 8.1 × 10⁹ | 5.2 × 10⁶ | [98] | |
| Netherlands | W1: 2.2 × 10⁵ W2: 7.2 × 10⁵ W3: 3.6 × 10⁴ W4: 9.2 × 10³ W5: 3.6 × 10⁴ W6: 3.3 × 10⁵ W7: 7.2 × 10⁴ | W1: 910 W3: 73 W4: 238 W5: 91 W7: 68 | W3: 92 W4: 100 W5: 100 | W3: 67 W4: 238 W5: 91 | W1: 39 W2: 61 W3: 65 W4: 81 W5: 56 W6: 55 W7: 55 | W3: 50 W4: 100 W5: 100 | W3: 65 W4: 81 W5: 56 | W3: 25.4 W4: 66.0 W5: 38.5 | W3: 2.4 × 10⁹ W4: 2.2 × 10⁹ W5: 3.3 × 10⁹ | W3: 1.8 × 10⁹ W4: 7.5 × 10⁸ W5: 2.0 × 10⁹ | [99] |
| Poland | 1.5 × 10⁴ | 195.78 a (19.4–552.2) | 71 | 139 | 0.34 a (0.028–0.96) | 52 | 0.18 | 99.9 | 2.0 × 10⁹ | 2.6 × 10⁶ | [100] |
| Russia | 9.6 × 10⁵ | 3787 | 12.3 | 467 | 148 | 10.8 | 16 | 96.6 | 4.5 × 10¹¹ | 1.5 × 10¹⁰ | [101] |
| Scotland | 2.6 × 10⁵ | 15.7 | ~18.5 | 2.90 | 0.25 | ~18.5 | 0.05 | 98.3 | 7.6 × 10⁸ | 1.3 × 10⁷ | [52] |
| 1.7 × 10⁵ a | ~6 a (3–10) | ~63 | 3.78 | ~1 a (<1–3) | ~63 | 0.63 | 83.3 | 6.3 × 10⁸ | 1.1 × 10⁸ | [102] | |
| South Korea | 2.5 × 10⁵ | 227 | - | - | 49 | - | - | - | - | - | [103] |
| W1: 2.7 × 10⁵ b W2: 4.7 × 10⁵ W3: 2.1 × 10⁴ | W1: 4200 W2: 31,400 W3: 5840 | W1: 46.7 W2: 14.6 W3: 18.5 | W1: 1960 W2: 4600 W3: 1080 | W1: 33 W2: 297 W3: 66 | W1: 12.1 W2: 5.7 W3: 22.7 | W1: 4 W2: 17 W3: 15 | W1: 99.8 W2: 99.6 W3: 98.6 | W1: 5.2 × 10¹⁰ W2: 2.2 × 10¹² W3: 2.3 × 10¹⁰ | W1: 1.1 × 10⁸ W2: 8.0 × 10⁹ W3: 3.1 × 10⁸ | [104] | |
| Spain | 3.5 × 10⁴ | 3.20 | 7 | 0.22 | 0.31 | 18 | 0.06 | 72.7 | 7.7 × 10⁶ | 2.1 × 10⁶ | [48] |
| 4 × 10⁴ | - | - | - | 0.44 | 95 | 0.42 | - | - | 1.7 × 10⁷ | [105] | |
| 1.2 × 10⁴ | 4.40 | 48.1 | 2.12 | 0.92 1.08 | 96.7 90.8 | 0.89 0.98 | 53.8 58.0 | 2.5 × 10⁷ | 1.1 × 10⁷ 1.2 × 10⁷ | [106] | |
| 4.5 × 10⁴ | - | - | - | 12.8 | 20 | 2.56 | - | - | 1.2 × 10⁸ | [107] | |
| 2.8 × 10⁴ a,b | 574.92 a (274.7–1567.5) | 34 | 195.5 | 41.77 a (7.15–131.35) | 40 | 16.7 | 91.5 | 5.5 × 10⁹ | 4.7 × 10⁸ | [108] | |
| W1: 5.2 × 10⁴ b W2: 82.2 | W1: 645 W2: 1567 | W1: 51.4 W2: 43.1 | W1: 331.6 W2: 675.6 | W1: 16.40 W2: 131.35 | W1: 44.7 W2: 45.8 | W1: 7.33 W2: 60.16 | W1: 97.9 W2: 91.1 | W1: 1.7 × 10¹⁰ W2: 5.6 × 10⁷ | W1: 3.8 × 10⁸ W2: 5.0 × 10⁶ | [109] | |
| 6.5 × 10³ | 2.74 | 73.9 | 2.02 | 0.98 | 92.9 | 0.91 | 55.0 | 1.3 × 10⁷ | 5.9 × 10⁶ | [110] | |
| Sweden | 3.7 × 10⁵ b | 533 | - | - | 4 | - | - | - | - | - | [111] |
| 5.2 × 10³ | 15.1 | 70.9 | 10.7 | 0.008 | 50 | 0.004 | 99.9 | 5.5 × 10⁷ | 2.1 × 10⁴ | [112] | |
| Thailand | 1.3 × 10⁵ | 12.2 | 46.7 | 5.7 | 2.0 | 50 | 1.0 | 82.5 | 7.3 × 10⁸ | 1.3 × 10⁸ | [113] |
| Turkey | W1: 183 W2: 87 | W1: 26.56 W2: 23.44 | W1: 54.8 W2: 87.7 | W1: 14.55 W2: 20.56 | W1: 7.00 W2: 4.11 | W1: 44.4 W2: 86.5 | W1: 3.11 W2: 3.56 | W1: 78.6 W2: 82.7 | W1: 2.7 × 10⁶ W2: 1.8 × 10⁶ | W1: 5.7 × 10⁵ W2: 3.1 × 10⁵ | [114] |
| W1: 1.5 × 10⁵ W2: 4.3 × 10⁴ W3: 1.2 × 10⁴ | W1: 2.8 W2: 3.1 W3: 1.5 | W1: 66 W2: 95 W3: 94 | W1: 1.85 W2: 2.95 W3: 1.41 | W1: 1.6 W2: 0.7 W3: 0.6 | W1: 41 W2: 51 W3: 58 | W1: 0.66 W2: 0.36 W3: 0.35 | W1: 64.3 W2: 87.8 W3: 77.2 | W1: 2.8 × 10⁸ W2: 1.3 × 10⁸ W3: 1.7 × 10⁷ | W1: 9.9 × 10⁷ W2: 1.6 × 10⁷ W3: 4.2 × 10⁶ | [115] | |
| UK | 3.1 × 10⁴ b | 7011 a (955–17,214) | - | - | 15.7 a (2–54) | - | - | - | - | - | [116] |
| USA | W1: 1.4 × 10⁵ b W2: 2.3 × 10⁴ W3: 1.4 × 10⁴ | W1: 147 W2: 126 W3: 147 | W1: 64.8 W2: 66.6 W3: 67.5 | W1: 95.18 W2: 83.92 W3: 99.23 | W1: 3.7 W2: 17.6 W3: 17.2 | W1: 75.7 W2: 88.6 W3: 81.4 | W1: 2.8 W2: 15.6 W3: 14 | W1: 97.1 W2: 81.4 W3: 85.9 | W1: 1.3 × 10¹⁰ W2: 1.9 × 10⁹ W3: 1.4 × 10⁹ | W1: 3.8 × 10⁸ W2: 3.5 × 10⁸ W3: 2.0 × 10⁸ | [117] |
| 1.2 × 10⁵ a,b | - | - | - | 0.09 a (0.047–0.19) | 78.3 | 0.07 | - | - | 8.2 × 10⁶ | [118] | |
| 1.2 × 10⁵ a | - | - | - | 0.05 a (0.004–0.195) | 59 | 0.03 | - | - | 3.6 × 10⁶ | [119] | |
| W1: 2.5 × 10⁶ W2: 1.7 × 10³ | W1: 133 W2: 83.3 | W1: 62 W2: 54.5 | W1: 82.46 W2: 45.40 | W1: 5.9 W2: 2.6 | W1: 61 W2: 84.7 | W1: 3.60 W2: 2.20 | W1: 95.6 W2: 95.2 | W1: 2.1 × 10¹¹ W2: 7.7 × 10⁷ | W1: 9 × 10⁹ W2: 3.7 × 10⁶ | [120] | |
| 5 × 10⁴ | - | - | - | 0.098 | 21 | 0.021 | - | - | 1.1 × 10⁶ | [121] | |
| 1.1 × 10⁶ | 1 | - | - | 8.8·10−4 | - | - | - | - | - | [122] | |
a Data obtained from the average values of different WWTPs (W ≥ 6) analysed in the study. b Study included industrial wastewater treatment plants and/or facilities that treated industrial wastewater. (MPs/L) and (MPFs/L) are shown as the mean value, whereas in parentheses the minimum and maximum values found are reported.
Regarding the MP concentrations found in the influent of WWTPs, there is a wide dispersion of data with reported concentrations between 0.28 and 31,400 MPs/L, with the average value being 907 MPs/L. With respect to MPFs, notable amounts are usually found in these influents, with an average value of 199 MPFs/L. The reported microfiber concentration range between not detected and 4600 MPFs/L. Approximately more than half of the MPs detected in the influent of WWTPs correspond to microfibres, in concordance with different studies that indicate that fibres and fragments are the most predominant particle in wastewater, with abundances of 56% and 34%, respectively [123]. As it happened, in the influent, a broad range of MP concentrations was measured in WWTPs effluents, ranging between not detected and 750 MPs/L. The average value of MP concentration in the effluent is 29, a value that is 97% of the average influent value. The MPF abundance with respect to the total MPs is similar in influents and effluents with percentages of 50–60. Thus, MPF concentrations in the effluent range between not detected and 347 MPFs/L, so high amounts of microfibres are discharged with the treated wastewater to the environment. It has been estimated that an average value of 79% of microfibres are removed from urban wastewater during treatment. These removed MPs are mainly retained in the sludge [12,40]. So, MP concentrations of 400–7000 and 1500–170,000 MPs/kg have been measured, respectively, in wet and dry mixed sludge [51,52,58,87,96,100,108,122,124]. Fibres are the most common MP found in the sewage sludge, followed by fragments, beads and films [58,125,126]. In particular, Corradini et al. [127] reported that 90% of MPs found in the sludge are microfibres.
Considering all the case studies reported in Table 1, a WWTP can receive between 5.9 × 10⁶ and 2.2 × 10¹² MPFs per day, whereas between 2.1 × 10⁴ and 1.1 × 10¹⁰ MPFs/day are emitted to the environment. In addition, the great abundance of these microparticles and the difficulty in removing them during the water treatment processes is evident. Thus, the large number of microfibres emitted to the environment indicate that WWTPs must be considered as an important environmental source of MPFs [123]. The large number of studies on the occurrence of MPs in WWTPs reported so far reflects the importance of this issue. For this reason, research is necessary to improve the performance of WWTPs regarding MP removal in general and the removal of MPF in particular.
2.2. Technologies for Microfiber Removal in WWTPs
Different processes (physical, chemical and biological) are employed in WWTPs to treat wastewater [12]. Although these facilities are not specifically designed to remove MPs from wastewater, high removal efficiencies are achieved (≥90%) [48,62,63,65,67,81,83,84,97,102,107]. However, this is still insufficient due to the large number of MPs that are emitted from the WWTPs into the environment [41]. This may change in the coming years since the European Parliament has recently submitted a proposal to regulate the environmental problems associated with the presence of MPs in treated water and sewage sludge. In this context, the foreseeable approval of this proposal by the European Commission (that is being studied) would imply a regulation of the presence of these micropollutants in WWTPs [128].
According to Table 1, 17% of the reviewed studies have a MPF removal efficiency lower than 60%. In addition, 33%, 11% and 28% have reported a capacity of MPF elimination in the ranges 60–90%, 90–95% and 95–99%, respectively. Removal efficiency higher than 99% is found in just 11% of the studies. To determine which technologies are the best for removing MPFs from wastewater, all studies that have achieved at least 95% of MPF removal will be discussed hereafter.
A conventional activated sludge system (CAS) is a process commonly applied in WWTPs. This system includes an aeration tank, which is used for biological degradation of organic matter, and a secondary clarifier (sedimentation tank), where the sludge is separated from the treated wastewater [129]. There are different studies where this technology is analysed to remove MPs, and specially microfibres, reporting removal efficiencies of MPFs between 95% and 99.9% [63,81,89,100,101,109,112,117,120]. Some WWTPs applied CAS together with advanced processes, such as biological active filter (BAF) [82,84] or trickling filter, followed by granular sand filter [120]. The simultaneous operation of CAS and BAF reaches MPF removal efficiencies of 97–99.5% [82,84], whereas 95% is obtained using CAS combined with a trickling filter and granular sand filter [120].
Well-established and common biological nutrient removal processes, such as anaerobic/oxic (A/O) and anaerobic/anoxic/aerobic (A2O) processes can be found in several WWTPs. In the anaerobic tanks, the phosphorus is released, while in the anoxic tank a denitrification takes place, and the organic matter is removed in the aerobic tank, with high cost-effectiveness and efficiency [130,131,132,133]. A microfiber removal efficiency of 96.5% can be achieve using the A/O (anaerobic/oxic) process [78]. On the other hand, higher MPF removal efficiencies could be achieved using A2O technologies in WWTPs, such as 98.3% [97] or almost 100% [99]. The simultaneous combination of several processes should increase the removal efficiency, although Yuan et al. [77] reported that the implementation of A2O together with advanced denitrification, ultrafiltration (UF) and ozone technologies achieved values of 95.1%, whereas 96.3% was obtained together with membrane bioreactor (MBR).
Oxidation ditch is a modified activated sludge biological treatment process that uses long solids retention times to remove biodegradable matter. Typically, this system consists of a ring, oval or horseshoe-shaped basin through which the wastewater flows. Flow to the oxidation ditch is aerated and mixed with return sludge from a secondary clarifier [134]. A WWTP that uses this process removes around 97–98% of MPFs using the oxidation ditch alone or together with an A2O system [52,78,91]. If the process consists of an anaerobic, anoxic and aerobic basin that use filled carrier, an MPF elimination of 99% can be achieved [97].
Sequencing batch reactors (SBR) are also a modified type of activated sludge process for wastewater treatment. Oxygen is bubbled through the mixture of wastewater and biomass. The aeration and mixing is discontinued after the biological reactions are complete, the biomass settles (sludge) and the treated supernatant is removed [135]. After that, the reactor is filled again, and the process is repeated. Lee and Kim [97] reported 99% of microfiber removal by SBR systems, whereas 98% was described for this process by Kazour et al. [85].
Coagulation–flocculation is a typical chemical treatment which is followed by a physical separation, usually a sedimentation. Coagulation consists of the destabilisation of colloidal particles, whereas flocculation implies the agglomeration of the destabilised particles in floccules by the addition of chemical reagents—namely, coagulants and flocculants [136,137]. This process is frequently employed in drinking water treatment plants (DWTPs), although it is also used in WWTPs. For example, in a tertiary treatment consisting of a coagulation–flocculation process and rapid sand filtration (RSF), 98.6% of MPF removal can be reached [104]. The implementation of this technology with advanced processes, such as ozone and membrane disc-filter, would increase the removal efficiency of microfibres in treated water to above 99.6% [104].
RSF is a widely used low-cost technology applied to wastewater treatment due to its rapid and efficient removal of contaminants [12]. Their main disadvantage regarding MP removal is the possible fragmentation of these micropollutants into smaller particles [56]. RSF has reported removal rates of MPFs that can reach 96% [94].
In general, according to the reviewed literature, the most effective technique for removing MPs in WWTPs is a membrane bioreactor (MBR), achieving efficiencies near to 100% [51,67,84]. However, depending on the characteristics of wastewater and operating conditions, efficiencies lower than 80% [106] and even of 25% have been reported [99]. MBR consists of a biological reactor with suspended solids removal by a perm-selective membrane, e.g., microfiltration or ultrafiltration [12]. Only the smallest particles can pass through the membranes, so high effluent quality can be achieved [138]. In comparison with other processes developed for wastewater treatment, MBR presents as main disadvantages high membrane costs, high energy demand, low flux and maintenance issues [139]. For microfibres, a high removal efficiency of 99% has been described for this system [51], although values lower than 90% [67,96] and even as low as 54% [106] have also been found.
Therefore, to eliminate MPFs from wastewater, the different processes or technologies cited above can be employed with different MPF removal efficiencies—for example, MBR (54–99%), RSF (58–96%), oxidation ditch (96.6–97.2%), SBR (98–99%), coagulation-flocculation (98.6–99.8%), CAS (95–99.9%) and A2O (95–99.9%), with the last three being the techniques that show better performance regarding MPF removal.
From an economics point of view and according to the literature [40], the technologies mentioned above can be classified based on their installation and maintenance cost as follows: low-cost (RSF, DAF, oxidation ditch and CAS), low–medium cost (SBR and A2O), medium cost (discfilter) and high cost (DM and MBR). Thus, considering the low and low–medium cost, the technologies with the best performance in removing MPs and microfibres are conventional activated sludge (CAS), oxidation ditch and sequencing batch reactor (SBR).
Optimising these technologies and/or complementing them with other processes is still a challenge for avoiding the release of large quantities of MPs, and especially microfibres, from WWTPs to the environment.
2.3. Microfibres Retained in Sludge
Sludge is a waste generated from different physical, biological and chemical processes employed for wastewater treatment. Certainly, sewage sludge is the main residue originated in the WWTPs. Sludge is principally generated during primary treatment (primary clarifier) and secondary treatment (secondary clarifier), and it is called “primary sludge” and “secondary sludge” [140]. Sometimes, when advanced wastewater treatment processes are employed, tertiary sludge can also be generated during tertiary treatment. For sludge management, primary and secondary sludge (and also tertiary sludge in cases in which it has been generated) are combined, obtaining a so called “mixed sludge”. The mixed sludge can be managed in different ways (anaerobic digestion, dewatering, incineration, etc.), depending on its final fate [140,141]. Depending on the sludge origin, its characteristics are different with respect to its composition and physical properties. The composition of the sludge is a key parameter for the management of this residue. During wastewater treatment processes, many pollutants, such as heavy metals and organic contaminants, are retained in the sludge [140,141]. Specifically, it is well known that most of the MPs removed during wastewater treatment are entrapped in the sludge [12,40]. Again, fibres are the most common MPs found in sewage sludge, mainly coming from textile handling and the washing of clothes [141].
The different processes used in the sludge line can alter the amount and characteristics of the MPs entrapped in it. For example, Mahon et al. [58] analysed the occurrence of MPs after sludge treatment by means of anaerobic digestion, thermal drying and lime stabilisation. These authors found that after lime stabilisation MPs were smaller compared with the previous two stages due to the combination of basic pH, high temperature and mechanical mixing that produce the fragmentation of MPs. It was reported that fibres are more resistant to fragmentation and degradation in sludge treatment processes than other MP forms [125].
Different devices (belt filter press, plate and frame filter press, decanter centrifuge, etc.) can be employed for sludge dewatering. Li et al. [142] analysed the effect of dewatering processes on the MPs entrapped in sludge. These authors reported that low-density MPs tend to remain in the aqueous phase during centrifugation, whereas the inorganic conditioners added during filtration are notably difficult to remove based on their MP analysis. In both cases, it was found that the number of MPs was underestimated due to methodological issues.
The large amount of sewage sludge produced globally makes necessary the proper management of this organic waste. Sludge management methods can substantially differ in each region of the world. In the European Union, the annual production of sewage sludge is around 10 million tons (expressed as dry solids) [143]. Sludge management in the EU is regulated and, as happens in all cases of waste management, prevention and reuse are the most preferred options [144]. The most common use of sludge is in agricultural soils as fertiliser, since sludge is rich in organic matter and nutrients (nitrogen, phosphorus and potassium). However, as was commented above, organic and inorganic pollutants can be accumulated in sludge, which entails potential risks when sludge is applied to soils [145,146]. It has been estimated that 44,000–300,000 (Europe) and 63,000–430,000 (North America) MP tons are scattered on agricultural soils each year by sewage sludge application [147,148]. Specifically, microfibres are the most abundant MP particle (≥50%), so a large amount of MPFs are being added to the soil, which entails potential harmful effects on fauna and flora [39,149].
Sludge can also be incinerated to generate energy; in this case, MPs entrapped are degraded, but it is important to consider that this management option contributes to greenhouse gases (GHG) emission [150].
An overview of the incidence of MPs, and specifically microfibres, in sewage sludge worldwide is shown in Table 2.
Table 2.
Overview of the incidence of MPs, and specifically microfibres, in sewage sludge worldwide. “W” followed by a number refers to different WWTP analysed in the cited reference.
Table 2.
Overview of the incidence of MPs, and specifically microfibres, in sewage sludge worldwide. “W” followed by a number refers to different WWTP analysed in the cited reference.
| Dry Sludge Generated per Day (kg) | Dry Sludge | Number of MPFs per Day Retained in Sludge | References | |||
|---|---|---|---|---|---|---|
| (MPs/g) | % MPFs | (MPFs/g) | ||||
| Australia | W1: 9 × 10⁴ W2: 7.1 × 10⁴ W3: 1 × 10⁵ | W1: 56.5 W2: 51.2 W3: 48.5 | W1: 86.5 W2: 98 W3: 82.7 | W1: 48.9 W2: 50.2 W3: 40.1 | W1: 4.4 × 10⁹ W2: 3.6 × 10⁹ W3: 4.0 × 10⁹ | [63] |
| 1.5 × 10⁶ b | 7.91 b | 30.5 | 2.41 b | 3.7 × 10⁶ | [64] | |
| Canada | 1.4 × 10⁶ | 19.3 | 68.9 | 13.3 | 1.9 × 10¹⁰ | [65] |
| China | - | 240.3 | 17.5 | 42.05 | - | [57] |
| Part A: 9.2 × 10³ Part B: 28.8 | Part A: 0.72 Part B: 4 | Part A: 50 Part B: 0 | Part A: 0.36 Part B: 0 | 3.3 × 10⁶ | [67] | |
| 1.3 × 10⁶ | 46.3 | 35 | 16.21 | 2.1 × 10¹⁰ | [71] | |
| - | 22.4 | 21 | 4.70 | - | [73] | |
| 1.1 × 10⁵ | 2.92 | 65 | 1.90 | 2.1 × 10⁸ | [74] | |
| - | W1: 13.4 W2: 63.4 | W1: 60 W2: 75 | W1: 8.0 W2: 47.6 | - | [75] | |
| - | W1: 14 W2: 12.1 W3: 5.02 W4: 9.36 | W1: 80 W2: 70 W3: 40 W4: 77 | W1: 11.2 W2: 8.5 W3: 2.01 W4: 7.21 | - | [78] | |
| - | W1&W2: 6908.3 W3: 2190.4 W4: 234.7 | W1&W2: 17 W3: 83 W4: 35 | W1&W2: 1174.4 W3: 1818.0 W4: 82.2 | - | [79] | |
| 2.0 × 10⁸ | 22.7 | 63 | 14.3 | 2.9 × 10¹² | [142] | |
| 1 × 10⁶ | 4.04 | 18.7 | 0.76 | 7.6 × 10⁸ | [151] | |
| - | 220 | 7.3 | 16.06 | - | [152] | |
| - | 5.55–13.46 | 75.8–88.8 | 4.21–11.95 | - | [153] | |
| - | W1: 960.9 W2: 550.8 | W1: 31 W2: 40 | W1: 297.9 W2: 220.3 | - | [154] | |
| 6.5 × 10⁴ | W1: 5.16 W2: 2.19 W3: 0.25 | W1: 15 W2: 85 W3: 35 | W1: 0.77 W2: 1.86 W3: 0.09 | 1.8 × 10⁸ | [155] | |
| Finland | 9.6 × 10⁴ | 170.9 | 94.2 | 161 | 1.6 × 10⁷ | [51] |
| 6 × 10⁷ | 186.7 | - | - | - | [84] | |
| France | 6.4 × 10⁴ | 16.13 | 77.2 | 12.46 | 8.0 × 10⁸ | [85] |
| Germany | 1.2 × 10³ | 12.5 | - | - | - | [86] |
| 2.9 × 10¹¹ | 495 | 46 | 227.7 | 6.7 × 10¹³ | [156] | |
| 3.5 × 10⁷ b | 0.20 b | 19.9 | 0.04 b | 7 × 10⁶ | [157] | |
| Iran | - | W1: 6.57 W2: 5.57 | W1: 55.1 W2: 44.2 | W1: 3.62 W2: 2.46 | - | [92] |
| 1.4 × 10⁴ | 129 | 87.5 | 112.9 | 1.6 × 10⁹ | [158] | |
| Ireland | - | 8.51 a (4.20–15.39) | 75.8 | 6.45 | - | [58] |
| Italy | 3 × 10⁴ | 112.8 | 47.25 | 53.3 | 1.6 × 10⁹ | [95] |
| 3.4 × 10³ | 4.74 | 20 | 0.95 | 3.3 × 10⁶ | [96] | |
| Korea | W1: 2.0 × 10⁴ W2: 6.1 × 10⁴ W3: 5.6 × 10⁴ | W1: 14.90 W2: 9.66 W3: 13.20 | W1: 24.2 W2: 47.2 W3: 45.8 | W1: 3.61 W2: 4.56 W3: 6.04 | W1: 7.3 × 10⁷ W2: 2.8 × 10⁸ W3: 3.4 × 10⁸ | [97] |
| Netherlands | - | W1: 0.66 W2: 0.51 W7: 0.76 | - | - | - | [99] |
| Norway | 3.47 × 10⁴ (3.5 × 10³–1.05 × 10⁵) | 6.08 a (1.70–19.84) | 28.9 | 1.76 | 6.1 × 10⁷ | [124] |
| Poland | - | 31.3 a (6.7–62.6) | 85 | 26.59 | - | [100] |
| Scotland | - | 2 | - | - | - | [52] |
| Spain | - | 112 | 94 | 105.6 | - | [105] |
| 1.9 × 10⁴ | 165 | 84 | 138.6 | 2.6 × 10⁹ | [107] | |
| - | 50.1 | 15 | 7.52 | - | [159] | |
| Sweden | 8.0 × 10³ | 1401 | - | - | - | [111] |
| - | 16.7 | 72.5 | 12.1 | - | [112] | |
| Thailand | - | 103.4 | 32.2 | 33.3 | - | [113] |
| UK | 3.06 × 10⁶ | 3408 a (301–10,380) | - | - | - | [116] |
| USA | 1.09 × 10⁶ | 1 | - | - | - | [122] |
a Data obtained from the average values of different WWTPs (W ≥ 6) analysed in the study. (MPs/g) and (MPFs/g) are shown as the mean value, whereas in parentheses the minimum and maximum values found are reported. b Values are expressed in L−1. Parts A and B correspond to two parallel treatment systems within the same WWTP.
As can be seen in Table 2, MP concentration in dry sludge ranges between 0.51 and 6908 MPs/g, with and average value of 320 MPs/g. In general, approximately 53% of these MPs correspond to microfibres, so this is the form most detected in sludge, although fragments, films and pellets can also be found [39]. Additionally, the number of microfibres reported in sewage sludge notably varies (between not detected and 1808 MPFs/g), with the mean being a value of 101 MPFs/g. Considering all of the case studies reported, it is estimated that between 3.3 × 10⁶ and 6.7 × 10¹³ MPFs are found in the total daily sludge generated by a WWTP. The search for new technologies for the removal of pollutants, and specifically MPs, from sludge is a key aspect in the foreseeable future to achieve the requirements of regulations and to improve the valorisation of this waste.
2.4. Analytical Methods Used to Analyse MPs from Wastewater and Sludge Samples
Different factors, such as the sampling method, pretreatment process and detection techniques, can affect the analysis and quantification of MPs and microfibres from wastewater and sludge samples.
The most common way of sampling wastewater is by storing the sample in a container and filtering it through sieves of different mesh sizes. This method of sampling is represented in 51% of the studies reported in Table 1 [48,51,52,57,61,64,65,70,71,76,78,80,81,89,90,93,95,97,98,99,100,101,102,103,104,105,106,107,108,109,110]. Additionally, other methods used imply the direct filtration of samples during sampling (12%) [66,67,73,74,75,118,121,122], automatic collection of single or composite samples during a time interval (15%) [49,68,83,84,91,94,96,114,116,117] or use of a device for pumping and filtration of the samples (22%) [62,63,69,72,79,82,83,84,85,86,87,88,98,111,116,119]. Such a device allows the processing of large quantities of aqueous samples, which means that the sample taken is more representative. In addition, authors reported the use of sieves with different mesh sizes, affecting the size range of MPs [62,67,69,70,72,74,78,79,80,91,107]. Samples are pretreated before MPs detection in order to remove from MPs the organic and inorganic impurities. The most common way to purify samples implies an oxidation using the reagent of Fenton [51,64,66,94,97,100,109,114], although some authors reported the use of enzymatic digestion [76,81,86,111,116] or only hydrogen peroxide as oxidizing agent [72,73,75,78,89,90,91,98]. After this digestion step, a subsequent separation using a brine solution is frequently carried out. Some authors mentioned omitting the oxidation process and directly using the brine solution [48,85,99,106]. In all cases, samples are filtered after being treated with the brine solution. Finally, a visual sorting of MPs is conducted using an optical microscope [89,100,104,108,109,110,115] or stereomicroscope [92,95,96,98,107,117], although some authors reported the use of a fluorescence microscope to differentiate MPs from impurities [75,91,93,94,103]. To complete the study, FTIR [45,48,51,61,62,63,64,65,66,67,68,72,73,77,78,79,82,83,84,86,87,89,90,92,95,96,97,98,99,102,103,105,106,107,108,109,110,111,112,113,114,115,116,117], Raman spectroscopy [57,69,71,74,75,76,80,81,85,88,91,94] or a combination of both techniques are often used to determine the chemical composition of MPs [51,66,103,121].
Regarding dewatered or wet sludge samples, they are stored in containers. A pretreatment is necessary to purify MPs, and the most common alternative is using an oxidizer-like reagent of Fenton or hydrogen peroxide (references in Table 2). After that, a brine solution is used to isolate MPs from inorganic impurities. Finally, the detection techniques are the same as those employed for water samples.
3. Microplastics and Microfibres in DWTPs
Drinking water sources are subject to pollution and require appropriate treatment to assure the accomplishment of chemicals standards and the absence of pathogenic agents. Drinking water treatment plants (DWTPs) employ several different water treatment processes to provide safe drinking water for consumers through tap water systems. The most common processes used in these facilities include coagulation–flocculation, followed by sedimentation, filtration and disinfection [160,161].
The coagulation–flocculation process consists of the addition of chemicals that favour the aggregation of particles that subsequently settle in a clarifier (sedimentation process) [12,161,162,163]. After that, the purification of water continues by means of a filtration process. Pore size and filter material (sand, activated carbon, gravel, etc.) vary depending on the treatment process. Microorganism removal and turbidity reduction occurs during the filtration step [161,162,163]. Finally, a disinfection process has to be carried out in order to ensure the absence of pathogenic agents in the drinking water. The disinfecting techniques most frequently employed are chlorination, ozonation and ultraviolet irradiation [164,165].
MP occurrence in DWTPs has not received as much attention as MPs in WWTPs [164,165]. However, this is a topic of increasing interest since MPs contained in drinking water could be potentially risky for human health [161,164,165,166]. For example, Cox et al. [33] reported that an American citizen could ingest around 4000 MPs per year by consumption of tap water.
Table 3 summarises the incidence of MPs, and particularly microfibres, in DWTPs. As can be observed, there is a wide variety in the concentration MPs, with values that go from absence to 6614 MPs/L in the influent and from absence to 930 MPs/L in the effluent, with an average value of 739 MPFs/L and 236 MPFs/L, respectively. MP concentrations found in influents and effluents of DWTPs are similar or even higher than those reported for WWTPs. It must be considered that water for human consumption is exposed to the possible entry of more MPs through several routes, such as environmental degradation of plastics and physical wear of plastic items, industrial discharges, deposition from airborne MPs, etc. [164]. It is remarkable that the abundance of microfibres in most cases is much lower in the influents of DWTPs than those obtained in the influents of WWTPs. This is probably due to the origin of the water—i.e., in DWTPs the influent is obtained from different water sources (aquifers, reservoirs, etc.), whereas in WWTPs the influents correspond to wastewater (mainly of urban origin) coming from the sewage system.
The percentage of MPFs with respect to the total MPs is similar in the DWTP influents and effluents (between 6% and 67%); MPF abundance in DWTP influents is between 0.03 and 176 MPFs/L, with an average value of 110 MPFs/L, whereas in WWTP effluents this average value is 13 MPFs/L. Considering the available data, the removal efficiency of MPFs during the treatment of drinking water is between 25% and 90%.
The DWTPs analysed in this work (Table 3) received between 7.8 × 10⁶ and 5.2 × 10¹⁴ MPFs per day, whereas between 1 × 10⁸ and 7.4 × 10¹³ MPFs/day are emitted to the environment by DWTP effluent.
In general, DWTPs are less efficient in removing MPs and microfibres than WWTPS as a consequence of the usually simpler treatment carried out in the DWTPs [167,168,169,170,171,172,173,174]. In fact, some WWTPs achieve removal efficiencies above 99%, whereas the highest MPF removal efficiency found in literature for a DWTP was 90.4%, and it was achieved in a DWTP that included coagulation–sedimentation, deep-bed filtration, ozonation and granular activated carbon [171]. Thus, improving MP removal in DWTP is a mandatory issue for the future since this would notably reduce the ingestion of potentially hazardous MPs by humans.
As was noted in samples from WWTPs, different factors can affect the analysis and quantification of MPs and microfibres from DWTPs. The most common way of sampling is by storing the samples in containers and then filtering them through sieves of different mesh size [21,167,168,169,170,173] or sampling by direct filtration [171,172,174]. In order to isolate MPs from impurities, an oxidation of the sample (using only hydrogen peroxide or reagent of Fenton) is conducted, followed by a separation using a NaCl or ZnCl2 solution [171,172,174]. Finally, a visual sorting of MPs is carried out by employing a stereomicroscope [168,171,173]; however, Sarkar et al. (2021) used a fluorescence microscope to differentiate MPs from impurities [172]. As in the case of wastewater and sludge samples, FTIR and Raman spectroscopy are employed as classical techniques for determining the chemical composition of MPs [21,167,168,169,170,171,172,173,174].
Table 3.
Overview of the incidence of MPs and microfibres in DWTPs. “D” followed by a number refers to different DWTPs analysed in the cited reference.
Table 3.
Overview of the incidence of MPs and microfibres in DWTPs. “D” followed by a number refers to different DWTPs analysed in the cited reference.
| Treated Water (m3/day) | Influent | Effluent | MPF Removal (%) | Number of MPFs per Day | References | ||||||
|---|---|---|---|---|---|---|---|---|---|---|---|
| (MPs/L) | % MPFs | (MPFs/L) | (MPs/L) | % MPFs | (MPFs/L) | Influent | Effluent | ||||
| China | - | - | - | - | 440 a | 16 | 70.4 | - | - | - | [21] |
| 1.2 × 10⁸ | 6614 | 64.9 | 4295 | 930 | 66.7 | 620 | 85.6 | 5.2 × 10¹⁴ | 7.4 × 10¹³ | [167] | |
| 1 × 10⁵ | 2753 | 22 | 605.7 | 351.9 | 50 | 176 | 70.9 | 6.1 × 10¹⁰ | 1.8 × 10¹⁰ | [168] | |
| Czech Republic | D1: 3.2 × 10⁵ D2: 8.6 × 10³ D3: 7.8 × 10³ | D1: 1473 D2: 1812 D3: 3605 | D1: 11.4 D2: 6.1 D3: 36.8 | D1: 168 D2: 111 D3: 1325 | D1: 443 D2: 338 D3: 628 | D1: 28.4 D2: 3.6 D3: 46.8 | D1: 126 D2: 12 D3: 294 | D1: 25 D2: 89.2 D3: 77.8 | D1: 5.4 × 10¹⁰ D2: 9.6 × 10⁸ D3: 1.0 × 10¹⁰ | D1: 4.0 × 10¹⁰ D2: 1.0 × 10⁸ D3: 2.3 × 10⁹ | [169] |
| D1: 1.6 × 10⁴ D2: 3.5 × 10⁴ | D1: 23 D2: 1296 | D1: 21.7 D2: 9.7 | D1: 5 D2: 126 | D1: 14 D2: 151 | D1: 21.4 D2: 7.9 | D1: 3 D2: 12 | D1: 40 D2: 90.4 | D1: 7.8 × 10⁷ D2: 4.4 × 10⁹ | D1: 4.7 × 10⁷ D2: 4.2 × 10⁸ | [170] | |
| Germany | 2.0 × 10⁵ | 0–0.007 | - | - | 0–0.001 | - | - | - | - | - | [171] |
| India | 3.8 × 10⁵ | 17.88 | 57 | 10.2 | 2.75 | 54.5 | 1.5 | 85.3 | 3.9 × 10⁹ | 5.7 × 10⁸ | [172] |
| Spain | - | 0.96 | 59 | 0.56 | 0.06 | 56 | 0.03 | - | - | - | [173] |
| Thailand | - | D1: 0.94 D2: 0.55 | - | - | D1: 0.68 D2: 0.62 | D1: 6.4 D2: 22.5 | D1: 0.04 D2: 0.14 | - | - | - | [174] |
a Data obtained from the average values of different DWTPs (D ≥ 6) analysed in the study. (MPs/L) and (MPFs/L) are shown as the mean value, whereas in parentheses the minimum and maximum values found are reported.
4. Microfiber Incidence in Tap Water
As the global population grows and the environment becomes further affected by climate change, the problem of water scarcity will accelerate and access to fresh drinking water will dwindle. Addressing the crisis of water scarcity is one of the major challenges of the current world [162,175]. Access to safe water is clearly essential for human health and well-being and, as commented before, safe drinking water is obtained by the purification of water from freshwater bodies in DWTPs [175]. During this process, the elimination of water pollutants that are potentially harmful to human health is essential, and MPs are one of these pollutants [175].
The analysis of MPs in tap water was carried out in several countries and reported data are summarised in Table 4. DWTPs can achieve notable MP removal efficiency (Table 3), but MPs are still present in DWTP effluents. In addition, household pipes can be made of durable plastic (PVC, PE and fittings of PA), which could deteriorate over time and contribute to the increase in MPs in tap water [21,171]. However, this contribution from pipes to MP concentration is not always significant and, for example, Shen et al. [168] did not find a difference between MP concentration in the effluent of DWTP and tap water.
Table 4.
Overview of the incidence of MPs and MPFs in drinking water. “P” followed by a number refers to samples of tap water taken at different points analysed in the cited reference.
Table 4.
Overview of the incidence of MPs and MPFs in drinking water. “P” followed by a number refers to samples of tap water taken at different points analysed in the cited reference.
| (MPs/L) | % MPFs | (MPFs/L) | References | |
|---|---|---|---|---|
| Brazil | P1: 194 P2: 438 | - | - | [176] |
| China | 440 a (0–1257) | 74.03 | 5.44 | [21] |
| P1: 1.6 P2: 0.9 P3: 0.3 | 99.2 | P1: 1.59 P2: 0.89 P3: 0.30 | [177] | |
| 343.5 | 49 | 168.30 | [168] | |
| Cuba | 7.17 | 98.3 | 7.05 | [22] |
| Denmark | 0.30 a (0.18–0.6) | 82 | 0.25 | [178] |
| Ecuador | 4.02 | 98.3 | 3.95 | [22] |
| Finland | 47 | 1 | 0.47 | [23] |
| France | 1.82 | 98.3 | 1.79 | [22] |
| 97 | 8 | 7.76 | [23] | |
| Germany | 0.0007 | - | - | [171] |
| 53 | 9 | 4.77 | [23] | |
| 0 | 0 | 0 | [179] | |
| 0.91 | 98.3 | 0.89 | [22] | |
| India | 6.24 | 98.3 | 6.13 | [22] |
| Indonesia | 3.23 | 98.3 | 3.18 | [22] |
| Ireland | 1.83 | 98.3 | 1.80 | [22] |
| Japan | 27 a (7–65) | 17 | 4.59 | [23] |
| Lebanon | 6.64 | 98.3 | 6.53 | [22] |
| Norway | 1 | - | - | [180] |
| Saudi Arabia | P1: 1.9 P2: 4.67 | - | - | [181] |
| Slovakia | 3.83 | 98.3 | 3.76 | [22] |
| Switzerland | 2.74 | 98.3 | 2.69 | [22] |
| Uganda | 3.92 | 98.3 | 3.85 | [22] |
| UK | 7.73 | 98.3 | 7.60 | [22] |
| USA | 9.24 | 98.3 | 9.08 | [22] |
| 46 | 13 | 5.98 | [23] |
a Data obtained from the average values of samples of tap water taken at different points (p ≥ 6) analysed in the study. (MPs/L) is shown as the mean value, whereas in parentheses the minimum and maximum values are reported.
As can be seen in Table 4, the MP concentration in tap water varies between not detected and 1257 MPs/L, with percentages of microfibres that vary from 1% to 99%, so MPF concentrations are between not detected and 168 MPFs/L, with and average value of 10 MPFs/L. It is noteworthy that, in general, MPFs are the MP form most commonly found in tap water.
Regarding MPs analysis in tap water, the procedure is similar to that described for WWTP and DWTP. The most common way to obtain the samples involves a storage container [21,22,23,172,173,174,175,176,177,181] and subsequent filtration or a direct filtration through sieves with different mesh size [171,178,179,180]. In general, samples are oxidized, with H2O2 being the oxidizer agent most frequently used [23]. Nevertheless, some authors employ acids (for example HCl) to degrade organic impurities of the samples [21,171,179]. Finally, a visual sorting using the same techniques employed for wastewater samples is carried out [21,22]. The World Health Organization (WHO) recommended that an adult person should drink 2 L of water per day [182]. According to this recommendation and Table 4 data, it can be estimated that an approximate average of 154 MPs per day could be ingested by a person, i.e., 56,210 MPs per year, which is a value much higher than the value estimated by Cox et al. [33] for an American citizen (4000 MPs per year). Additionally, microfiber intake would be 20 MPFs per day (7519 MPFs per year). Thus, a large amount of MPs and microfibres (4.5 × 10⁶ MPs and 6.0 × 10⁵ MPFs, respectively) can be ingested only from tap water over a person’s lifetime, considering a life expectancy of 80 years. According to the European Commission’s Science Advice for Policy organ (SAPEA) and WHO-published reports, there is no evidence of the harmful effects of MPs on humans [183]. Certainly, as far as we know, there is not any published study that has directly examined the effects of these micropollutants on people. The only available studies that have been carried out have exposed cells or human tissues to MPs or have used animals such as mice or rats [184,185]. In these works, it has been reported that mice fed large quantities of MPs showed inflammation in their small intestines. In addition, mice exposed to MPs had a lowered sperm count and fewer, smaller pups, compared with control groups. Moreover, some of the in vitro studies on human cells or tissues also suggest toxicity [184,185]. Hence, a precautionary approach is warranted to limit human exposure to plastic particles since the risk is uncertain but potentially serious.
5. Future Prospects
MPs have been detected everywhere researchers have looked: in deep oceans, in Arctic snow and Antarctic ice, in shellfish, in table salt, in honey, in drinking water, etc., and they are ubiquitous in aquatic environments. There is no evidence reported in the literature about the hazardous effects of MPs on human health, but “no data” does not imply “no risk”, so further research should be carried out to address this troublesome knowledge gap.
Data found in the literature show a wide range of values regarding MP and MPF concentrations in all cases (WWTPs, sludge, DWTPs and tap water), which implies high variability worldwide. It is evident that WWTPs and DWTPs are hotspots in which to face MP, and specifically MPF, pollution. Existing technologies in WWTPs, such as CAS, oxidation ditch and MBR, show high microfiber removal efficiency in general (≥99%). However, it is not enough, and it seems necessary to dig deeper into these treatment processes so that practically total removal of microfibres from wastewater can be achieved. Additionally, technologies applied in DWTPs must be improved in the future to achieve better MP removal efficiencies since, currently, these values are between 28% and 94%, with removal efficiencies of MPFs below 90%. Thus, improving the performance of existing processes and searching for new ones for reducing the presence of MPs in treated wastewater and drinking water should be a priority, not only from an environmental point of view but also to accomplish compliance with future regulations on MPs. Finally, MPs removed during wastewater treatment processes are mostly accumulated in sludge, so new alternatives for sewage sludge management have to be investigated in order to enhance sludge valorisation options without being a risk for the environment.
Author Contributions
Conceptualization, D.S. and A.L. (Amanda Laca); methodology, D.S.; validation, M.D., A.L. (Adriana Laca) and A.L. (Amanda Laca); formal analysis, D.S.; resources, D.S.; data curation, A.L. (Adriana Laca); writing—original draft preparation, D.S. and A.L. (Amanda Laca); writing—review and editing, D.S., A.L. (Amanda Laca), A.L. (Amanda Laca) and M.D.; visualization, M.D.; supervision, A.L. (Adriana Laca) and M.D. All authors have read and agreed to the published version of the manuscript.
Funding
This research received no external funding.
Institutional Review Board Statement
Not applicable.
Informed Consent Statement
Not applicable.
Data Availability Statement
Not applicable.
Conflicts of Interest
The authors declare no conflict of interest.
Abbreviations
| A/O | Anaerobic/oxic |
| A2O | Anaerobic/anoxic/aerobic |
| BAF | Biological active filter |
| CAS | Conventional activated sludge |
| DAF | Dissolved air flotation |
| DM | Dynamic membrane |
| DWTP | Drinking water treatment plant |
| EU | European Union |
| GHG | Greenhouse gases |
| MBR | Membrane bioreactor |
| MP | Microplastic |
| MPF | Microfiber |
| PA | Polyamide |
| PCBs | Polychlorinated biphenyls |
| PE | Polyethylene |
| PVC | Polyvinyl chloride |
| RSF | Rapid sand filtration |
| SAPEA | Science Advice for Policy by European Academies |
| SBR | Sequencing batch reactor |
| UF | Ultrafiltration |
| WHO | World Health Organization |
| WWTP | Wastewater treatment plant |
References
- Auta, H.S.; Emenike, C.U.; Fauziah, S.H. Distribution and importance of microplastics in the marine environment: A review of the sources, fate, effects, and potential solutions. Environ. Int. 2017, 102, 165–176. [Google Scholar] [CrossRef]
- Boucher, J.; Friot, D. Primary Microplastic in the Oceans: A Global Evaluation of Sources; IUCN: Gland, Switzerland, 2017; p. 43. [Google Scholar] [CrossRef]
- Li, W.C.; Tse, H.F.; Fok, L. Plastic waste in the marine environment: A review of sources, occurrence and effects. Sci. Total Environ. 2016, 566–567, 333–349. [Google Scholar] [CrossRef]
- Horton, A.A.; Walton, A.; Spurgeon, D.J.; Lahive, E.; Svendsen, C. Microplastics in freshwater and terrestrial environments: Evaluating the current understanding to identify the knowledge gaps and future research priorities. Sci. Total Environ. 2017, 585, 127–141. [Google Scholar] [CrossRef] [Green Version]
- Padervand, M.; Lichtfouse, E.; Robert, D.; Wang, C. Removal of microplastics from the environment. A review. Environ. Chem. Lett. 2020, 18, 807–828. [Google Scholar] [CrossRef]
- Petersen, F.; Hubbart, J.A. The occurrence and transport of microplastics: The state of the science. Sci. Total Environ. 2021, 758, 143936. [Google Scholar] [CrossRef]
- Xu, S.; Ma, J.; Ji, R.; Pan, K.; Miao, A.J. Microplastics in aquatic environments: Occurrence, accumulation, and biological effects. Sci. Total Environ. 2020, 703, 134699. [Google Scholar] [CrossRef]
- Barrows, A.P.W.; Cathey, S.E.; Petersen, C.W. Marine environment contamination: Global patterns and the diversity of microparticle origins. Environ. Pollut. 2018, 237, 275–284. [Google Scholar] [CrossRef] [Green Version]
- Mishra, S.; Rath, C.C.; Das, A.P. Marine microfiber pollution: A review on present status and future challenges. Mar. Pollut. Bull. 2019, 140, 188–197. [Google Scholar] [CrossRef]
- Singh, R.P.; Mishra, S.; Das, A.P. Synthetic microfibers: Pollution toxicity and remediation. Chemosphere 2020, 257, 127199. [Google Scholar] [CrossRef]
- Peller, J.; Nevers, M.B.; Byappanahalli, M.; Nelson, C.; Babu, B.G.; Evans, M.A.; Kostelnik, E.; Keller, E.; Keller, M.; Johnston, J.; et al. Sequestration of microfibers and other microplastics by green algae, Cladophora, in the US Great Lakes. Environ. Pollut. 2021, 276, 116695. [Google Scholar] [CrossRef]
- Sol, D.; Laca, A.; Laca, A.; Diaz, M. Approaching the environmental problem of microplastics: Importance of WWTP treatments. Sci. Total Environ. 2020, 740, 140016. [Google Scholar] [CrossRef] [PubMed]
- Liu, J.; Yang, Y.; Ding, J.; Zhu, B.; Gao, W. Microfibers: A preliminary discussion on their definition and sources. Environ. Sci. Pollut. Res. 2019, 26, 29497–29501. [Google Scholar] [CrossRef] [PubMed]
- González-Pleiter, M.; Velázquez, D.; Edo, C.; Carretero, O.; Gago, J.; Barón-Sola, A.; Hernández, L.E.; Yousef, I.; Quesada, A.; Leganés, F.; et al. Fibers spreading worldwide: Microplastics and other anthropogenic litter in an Arctic freshwater lake. Sci. Total Environ. 2020, 722, 137904. [Google Scholar] [CrossRef] [PubMed]
- Mishra, A.K.; Singh, J.; Mishra, P.P. Microplastics in polar regions: An early warning to the world’s pristine ecosystem. Sci. Total Environ. 2021, 784, 147149. [Google Scholar] [CrossRef] [PubMed]
- Sanchez-Vidal, A.; Thompson, R.C.; Canals, M.; de Haan, W.P. The imprint of microfibres in southern European deep seas. PLoS ONE 2018, 13, e0207033. [Google Scholar] [CrossRef] [PubMed]
- Woodall, L.C.; Sanchez-Vidal, A.; Canals, M.; Paterson, G.L.; Coppock, R.; Sleight, V.; Calafat, A.; Rogers, A.D.; Narayanaswamy, B.E.; Thompson, R.C. The deep sea is a major sink for microplastic debris. R. Soc. Open Sci. 2014, 1, 140317. [Google Scholar] [CrossRef] [Green Version]
- Prata, J.C.; Godoy, V.; da Costa, J.P.; Calero, M.; Martín-Lara, M.A.; Duarte, A.C.; Rocha-Santos, T. Microplastics and fibers from three areas under different anthropogenic pressures in Douro river. Sci. Total Environ. 2021, 776, 145999. [Google Scholar] [CrossRef]
- Strady, E.; Kieu-Le, T.C.; Gasperi, J.; Tassin, B. Temporal dynamic of anthropogenic fibers in a tropical river-estuarine system. Environ. Pollut. 2020, 259, 113897. [Google Scholar] [CrossRef]
- Dris, R.; Gasperi, J.; Rocher, V.; Tassin, B. Synthetic and non-synthetic anthropogenic fibers in a river under the impact of Paris Megacity: Sampling methodological aspects and flux estimations. Sci. Total Environ. 2018, 618, 157–164. [Google Scholar] [CrossRef] [PubMed] [Green Version]
- Tong, H.; Jiang, Q.; Hu, X.; Zhong, X. Occurrence and identification of microplastics in tap water from China. Chemosphere 2020, 252, 126493. [Google Scholar] [CrossRef]
- Kosuth, M.; Mason, S.A.; Wattenberg, E.V. Anthropogenic contamination of tap water, beer, and sea salt. PLoS ONE 2018, 13, e0194970. [Google Scholar] [CrossRef] [PubMed]
- Mukotaka, A.; Kataoka, T.; Nihei, Y. Rapid analytical method for characterization and quantification of microplastics ion tap water using a Fourier-transform infrared microscope. Sci. Total Environ. 2021, 790, 148231. [Google Scholar] [CrossRef]
- Picó, Y.; Soursou, V.; Alfarhan, A.H.; El-Sheikh, M.A.; Barceló, D. First evidence of microplastics occurrence in mixed surface and treated wastewater from two major Saudi Arabian cities and assessment of their ecological risk. J. Hazard. Mat. 2021, 416, 125747. [Google Scholar] [CrossRef] [PubMed]
- Argeswara, J.; Hendrawan, I.G.; Dharma, I.G.B.S.; Germanov, E. What’s in the soup? Visual characterization and polymer analysis of microplastics from an Indonesian manta ray feeding ground. Mar. Pollut. Bull. 2021, 168, 112427. [Google Scholar] [CrossRef]
- Yin, L.; Wen, X.; Huang, D.; Zeng, G.; Deng, R.; Liu, R.; Zhou, Z.; Tao, J.; Xiao, R.; Pan, H. Microplastics retention by reeds in freshwater environment. Sci. Total Environ. 2021, 790, 148200. [Google Scholar] [CrossRef] [PubMed]
- Masiá, P.; Ardura, A.; Garcia-Vazquez, E. Microplastics in special protected areas for migratory birds in the Bay of Biscay. Mar. Pollut. Bull. 2019, 146, 993–1001. [Google Scholar] [CrossRef] [PubMed]
- Masiá, P.; Ardura, A.; Gaitán, M.; Gerber, S.; Rayon-Viña, F.; Garcia-Vazquez, E. Maritime ports and beach management as sources of coastal macro-, meso-, and microplastic pollution. Environ. Sci. Pollut. Res. 2021, 28, 30722–30731. [Google Scholar] [CrossRef]
- Bourdages, M.P.T.; Provencher, J.F.; Baak, J.E.; Mallory, M.L.; Vermaire, J.C. Breeding seabirds as vectors of microplastics from sea to land: Evidence from colonies in Arctic Canada. Sci. Total Environ. 2021, 764, 142808. [Google Scholar] [CrossRef]
- Nam, K.B.; Kim, M.; Hong, M.J.; Kwon, Y.S. Plastic debris ingestion by seabirds on the Korean Peninsula. Mar. Pollut. Bull. 2021, 166, 112240. [Google Scholar] [CrossRef]
- Chang, X.; Xue, Y.; Li, J.; Zou, L.; Tang, M. Potential health impact of environmental micro- and nanoplastics pollution. J. Appl. Toxicol. 2020, 40, 4–15. [Google Scholar] [CrossRef]
- Zhang, S.; Wang, J.; Liu, X.; Qu, F.; Wang, X.; Li, Y.; Sun, Y. Microplastics in the environment: A review of analytical methods, distribution, and biological effects. Trends Anal. Chem. 2019, 111, 62–72. [Google Scholar] [CrossRef]
- Cox, K.D.; Covernton, G.A.; Davies, H.L.; Dower, J.F.; Juanes, F.; Dudas, S.E. Human consumption of Microplastics. Environ. Sci. Technol. 2019, 53, 7068–7074. [Google Scholar] [CrossRef] [Green Version]
- Prata, J.C.; da Costa, J.P.; Lopes, I.; Duarte, A.C.; Rocha-Santos, T. Environmental exposure to microplastics: An overview on possible human health effects. Sci. Total Environ. 2020, 702, 134455. [Google Scholar] [CrossRef] [PubMed]
- Revel, M.; Châtel, A.; Mouneyrac, C. Micro(nano)plastics: A threat to human health? Curr. Opin. Environ. Sci. Health 2018, 1, 17–23. [Google Scholar] [CrossRef]
- Rodrigues, M.O.; Abrantes, N.; Gonçalves, F.J.M.; Nogueira, H.; Marques, J.C.; Gonçalves, A.M.M. Impacts of plastic products used in daily life on the environment and human health: What is known? Environ. Toxicol. Pharmacol. 2019, 72, 103239. [Google Scholar] [CrossRef] [PubMed]
- Xu, B.; Liu, F.; Cryder, Z.; Huang, D.; Lu, Z.; He, Y.; Wang, H.; Lu, Z.; Brookes, P.C.; Tang, C.; et al. Microplastics in the soil environment: Occurrence, risks, interactions and fate—A review. Crit. Rev. Environ. Sci. Technol. 2020, 50, 2175–2222. [Google Scholar] [CrossRef]
- Syranidou, E.; Kalogerakis, N. Interactions of microplastics, antibiotics and antibiotic resistant genes within WWTPs. Sci. Total Environ. 2022, 804, 150141. [Google Scholar] [CrossRef] [PubMed]
- Ali, I.; Ding, T.; Peng, C.; Naz, I.; Sun, H.; Li, J.; Liu, J. Micro- and nanoplastics in wastewater treatment plants: Occurrence, removal, fate, impacts and remediation technologies—A critical review. Chem. Eng. J. 2021, 423, 130205. [Google Scholar] [CrossRef]
- Masiá, P.; Sol, D.; Ardura, A.; Laca, A.; Borrell, Y.J.; Dopico, E.; Laca, A.; Machado-Schiaffino, G.; Díaz, M.; Garcia-Vazquez, E. Bioremediation as a promising strategy to microplastics removal in wastewater treatment plants. Mar. Pollut. Bull. 2020, 156, 111252. [Google Scholar] [CrossRef]
- Liu, W.; Zhang, J.; Liu, H.; Guo, X.; Zhang, X.; Yao, X.; Cao, Z.; Zhang, T. A review of the removal of microplastics in global wastewater treatment plants: Characteristics and mechanisms. Environ. Int. 2021, 146, 106277. [Google Scholar] [CrossRef] [PubMed]
- Suaria, G.; Achtypi, A.; Perold, V.; Lee, J.R.; Pierucci, A.; Bornman, T.G.; Aliani, S.; Ryan, P.G. Microfibers in oceanic surface waters: A global characterization. Sci. Adv. 2020, 6, eaay8493. [Google Scholar] [CrossRef]
- Kelly, M.R.; Lant, N.J.; Kurr, M.; Burgess, J.G. Importance of Water-Volume on the Release of Microplastic Fibers from Laundry. Environ. Sci. Technol. 2019, 53, 11735–11744. [Google Scholar] [CrossRef]
- Sillanpää, M.; Sainio, P. Release of polyester and cotton fibers from textiles in machine washings. Environ. Sci. Pollut. Res. 2017, 24, 19313–19321. [Google Scholar] [CrossRef]
- Almroth, B.M.C.; Åström, L.; Roslund, S.; Petersson, H.; Johansson, M.; Persson, K. Quantifying shedding of synthetic fibers from textiles; a source of microplastics released into the environment. Environ. Sci. Pollut. Res. 2018, 25, 1191–1199. [Google Scholar] [CrossRef] [Green Version]
- De Falco, F.; Di Pace, E.; Cocca, M.; Avella, M. The contribution of washing processes of synthetic clothes to microplastic pollution. Sci. Rep. 2019, 9, 6633. [Google Scholar] [CrossRef] [PubMed]
- De Falco, F.; Gullo, M.P.; Gentile, G.; Di Pace, E.; Cocca, M.; Gelabert, L.; Brouta-Agnésa, M.; Rovira, A.; Escudero, R.; Villalba, R.; et al. Evaluation of microplastic release caused by textile washing processes of synthetic fabrics. Environ. Pollut. 2018, 236, 916–925. [Google Scholar] [CrossRef] [PubMed]
- Bayo, J.; Olmos, S.; López-Castellanos, J. Microplastics in an urban wastewater treatment plant: The influence of physicochemical parameters and environmental factors. Chemosphere 2020, 238, 124593. [Google Scholar] [CrossRef]
- Dris, R.; Gasperi, J.; Rocher, V.; Saad, M.; Renault, N.; Tassin, B. Microplastic contamination in an urban area: A case study in Greater Paris. Environ. Chem. 2015, 12, 592–599. [Google Scholar] [CrossRef]
- Dris, R.; Gasperi, J.; Saad, M.; Mirande, C.; Tassin, B. Synthetic fibres in atmospheric fallout: A source of microplastics in the environment? Mar. Pollut. Bull. 2016, 104, 290–293. [Google Scholar] [CrossRef] [PubMed]
- Lares, M.; Ncibi, M.C.; Sillanpää, M. Occurrence, identification and removal of microplastic particles and fibers in conventional activated sludge process and advanced MBR technology. Water Res. 2018, 133, 236–246. [Google Scholar] [CrossRef]
- Murphy, F.; Ewins, C.; Carbonnier, F.; Quinn, B. Wastewater Treatment Works (WwTW) as a Source of Microplastics in the Aquatic Environment. Environ. Sci. Technol. 2016, 50, 5800–5808. [Google Scholar] [CrossRef] [Green Version]
- Sheng, G.P.; Yu, H.Q.; Cui, H. Model-evaluation of the erosion behaviour of activated sludge under shear conditions using a chemical-equilibrium-based model. Chem. Eng. J. 2008, 140, 241–246. [Google Scholar] [CrossRef]
- Buaisha, M.; Balku, S.; Özalp-Yaman, Ş. Heavy Metal Removal Investigation in Conventional Activated Sludge Systems. Civ. Eng. J. 2020, 6, 470–477. [Google Scholar] [CrossRef] [Green Version]
- Mirra, R.; Ribarov, C.; Valchev, D.; Ribarova, I. Towards Energy Efficient Onsite Wastewater Treatment. Civ. Eng. J. 2020, 6, 1218–1226. [Google Scholar] [CrossRef]
- Prata, J.C. Microplastics in wastewater: State of the knowledge on sources, fate and solutions. Mar. Pollut. Bull. 2018, 129, 262–265. [Google Scholar] [CrossRef] [PubMed]
- Liu, X.; Yuan, X.; Di, M.; Li, Z.; Wang, J. Transfer and fate of microplastics during the conventional activated sludge process in one wastewater treatment plant of China. Chem. Eng. J. 2019, 362, 176–182. [Google Scholar] [CrossRef]
- Mahon, A.M.; O’Connell, B.; Healy, M.G.; O’Connor, I.; Officer, R.; Nash, R.; Morrison, L. Microplastics in Sewage Sludge: Effects of Treatment. Environ. Sci. Technol. 2017, 51, 810–818. [Google Scholar] [CrossRef] [PubMed]
- Ouyang, Z.; Yang, Y.; Zhang, C.; Zhu, S.; Qin, L.; Wang, W.; He, D.; Zhou, Y.; Luo, H.; Qin, F. Recent advances in photocatalytic degradation of plastics and plastic-derived chemicals. J. Mater. Chem. A 2021, 9, 13402. [Google Scholar] [CrossRef]
- Scharnberg, A.R.A.; de Loreto, A.C.; Alves, A.K. Optical and Structural Characterization of Bi2FexNbO7 Nanoparticles for Environmental Applications. Emerg. Sci. J. 2020, 4, 11–17. [Google Scholar] [CrossRef]
- Browne, M.A.; Crump, P.; Niven, S.J.; Teuten, E.; Tonkin, A.; Galloway, T.; Thompson, R. Accumulation of Microplastic on Shorelines Woldwide: Sources and Sinks. Environ. Sci. Technol. 2011, 45, 9175–9179. [Google Scholar] [CrossRef]
- Ziajahromi, S.; Neale, P.A.; Rintoul, L.; Leusch, F.D.L. Wastewater treatment plants as a pathway for microplastics: Development of a new approach to sample wastewater-based microplastics. Water Res. 2017, 112, 93–99. [Google Scholar] [CrossRef] [PubMed]
- Ziajahromi, S.; Neale, P.A.; Silveira, I.T.; Chua, A.; Leusch, F.D.L. An audit of microplastic abundance throughout three Australian wastewater treatment plants. Chemosphere 2021, 263, 128294. [Google Scholar] [CrossRef] [PubMed]
- Raju, S.; Carbery, M.; Kuttykattil, A.; Senthirajah, K.; Lundmark, A.; Rogers, Z.; SCB, S.; Evans, G.; Palanisami, T. Improved methodology to determine the fate and transport of microplastics in a secondary wastewater treatment plant. Water Res. 2020, 173, 115549. [Google Scholar] [CrossRef]
- Gies, E.A.; LeNoble, J.L.; Noel, M.; Etemadifar, A.; Bishay, F.; Hall, E.R.; Ross, P.S. Retention of microplastic in a major secondary wastewater treatment plant in Vancouver, Canada. Mar. Pollut. Bull. 2018, 133, 553–561. [Google Scholar] [CrossRef] [PubMed]
- Prajapati, S.; Beal, M.; Maley, J.; Brinkmann, M. Qualitative and quantitative analysis of microplastics and microfiber contamination in effluents of the City of Saskatoon wastewater treatment plant. Environ. Sci. Pollut. Res. 2021, 28, 32545–32553. [Google Scholar] [CrossRef] [PubMed]
- Lv, X.; Dong, Q.; Zuo, Z.; Liu, Y.; Huang, X.; Wu, W.M. Microplastics in a municipal wastewater treatment plant: Fate, dynamic distribution, removal efficiencies, and control strategies. J. Clean. Prod. 2019, 225, 579–586. [Google Scholar] [CrossRef]
- Lin, L.; Zuo, L.Z.; Peng, J.P.; Cai, L.Q.; Fok, L.; Yan, Y.; Li, H.X.; Xu, X.R. Occurrence and distribution of microplastics in an urban river: A case study in the Pearl River along Guangzhou City, China. Sci. Total Environ. 2018, 644, 375–381. [Google Scholar] [CrossRef] [PubMed]
- Long, Z.; Pan, Z.; Wang, W.; Ren, J.; Yu, X.; Lin, L.; Lin, H.; Chen, H.; Jin, X. Microplastic abundance, characteristics, and removal in wastewater treatment plants in a coastal city of China. Water Res. 2019, 155, 255–265. [Google Scholar] [CrossRef] [PubMed]
- Yang, L.; Li, K.; Cui, S.; Kang, Y.; An, L.; Lei, K. Removal of microplastics in municipal sewage from China’s largest water reclamation plant. Water Res. 2019, 155, 175–181. [Google Scholar] [CrossRef] [PubMed]
- Jiang, J.; Wang, X.; Ren, H.; Cao, G.; Xie, G.; Xing, D.; Liu, B. Investigation and fate of microplastics in wastewater and sludge filter cake from a wastewater treatment plant in China. Sci. Total Environ. 2020, 746, 141378. [Google Scholar] [CrossRef] [PubMed]
- Zou, Y.; Ye, C.; Pan, Y. Abundance and characteristics of microplastics in municipal wastewater treatment plan effluent: A case study of Guangzhou, China. Environ. Sci. Pollut. Res. 2020, 28, 11572–11585. [Google Scholar] [CrossRef] [PubMed]
- Yang, Z.; Li, S.; Ma, S.; Liu, P.; Peng, D.; Ouyang, Z.; Guo, X. Characteristics and removal efficiency of microplastics in sewage treatment plant of Xi’an City, northwest China. Sci. Total Environ. 2021, 771, 145377. [Google Scholar] [CrossRef] [PubMed]
- Ren, P.; Dou, M.; Wang, C.; Li, G.; Jia, R. Abundance and removal characteristics of microplastics at a wastewater treatment plant in Zhengzhou. Environ. Sci. Pollut. Res. 2020, 27, 36295–36305. [Google Scholar] [CrossRef] [PubMed]
- Tang, N.; Liu, X.; Xing, W. Microplastics in wastewater treatment plants of Wuhan, Central China: Abundance, removal, and potential source in household wastewater. Sci. Total Environ. 2020, 745, 141026. [Google Scholar] [CrossRef]
- Wang, F.; Wang, B.; Duan, L.; Zhang, Y.; Zhou, Y.; Sui, Q.; Xu, D.; Qu, H.; Yu, G. Occurrence and distribution of microplastics in domestic, industrial, agricultural and aquacultural wastewater sources: A case study in Changzhou, China. Water Res. 2020, 182, 115956. [Google Scholar] [CrossRef] [PubMed]
- Yuan, F.; Zhao, H.; Sun, H.; Zhao, J.; Sun, Y. Abundance, morphology, and removal efficiency of microplastics in two wastewater treatment plants in Nanjing, China. Environ. Sci. Pollut. Res. 2021, 28, 9327–9337. [Google Scholar] [CrossRef] [PubMed]
- Xu, X.; Zhang, L.; Jian, Y.; Xue, Y.; Gao, Y.; Peng, M.; Jiang, S.; Zhang, Q. Influence of wastewater treatment process on pollution characteristics and fate of microplastics. Mar. Pollut. Bull. 2021, 169, 112448. [Google Scholar] [CrossRef]
- Zhang, L.; Liu, J.; Xie, Y.; Zhong, S.; Gao, P. Occurrence and removal of microplastics from wastewater treatment plants in a typical tourist city in China. J. Clean. Prod. 2021, 291, 125968. [Google Scholar] [CrossRef]
- Wei, S.; Luo, H.; Zou, J.; Chen, J.; Pan, X.; Rousseau, D.P.L.; Li, J. Characteristics and removal of microplastics in rural domestic wastewater treatment facilities of China. Sci. Total Environ. 2020, 739, 139935. [Google Scholar] [CrossRef] [PubMed]
- Simon, M.; van Last, N.; Vollertsen, J. Quantification of microplastic mass and removal rates at wastewater treatment plants applying Focal Plane Array (FPA)-based Fourier Transform Infrared (FT-IR) imaging. Water Res. 2018, 142, 1–9. [Google Scholar] [CrossRef]
- Talvitie, J.; Heinonen, M.; Pääkkönen, J.P.; Vahtera, E.; Mikola, A.; Setälä, O.; Vahala, R. Do wastewater treatment plants act as a potential point source of microplastics? Preliminary study in the coastal Gulf of Finland, Baltic Sea. Water Sci. Technol. 2015, 72, 1495–1504. [Google Scholar] [CrossRef] [PubMed]
- Talvitie, J.; Mikola, A.; Koistinen, A.; Setälä, O. Solutions to microplastic pollution—Removal of microplastics from wastewater effluent with advanced wastewater treatment technologies. Water Res. 2017, 123, 401–407. [Google Scholar] [CrossRef] [PubMed] [Green Version]
- Talvitie, J.; Mikola, A.; Setälä, O.; Heinonen, M.; Koistinen, A. How well is microlitter purified from wastewater?—A detailed study on the stepwise removal of microlitter in a tertiary level wastewater treatment plant. Water Res. 2017, 109, 164–172. [Google Scholar] [CrossRef] [PubMed] [Green Version]
- Kazour, M.; Terki, S.; Rabhi, K.; Jemaa, S.; Khalaf, G.; Amara, R. Sources of microplastics pollution in the marine environment: Importance of wastewater treatment plant and coastal landfill. Mar. Pollut. Bull. 2019, 146, 608–618. [Google Scholar] [CrossRef]
- Mintenig, S.M.; Int-Veen, I.; Löder, M.G.J.; Primpke, S.; Gerdts, G. Identification of microplastic in effluents of waste water treatment plants using focal plane array-based micro-Fourier-transform infrared imaging. Water Res. 2017, 108, 365–372. [Google Scholar] [CrossRef] [PubMed]
- Wolff, S.; Kerpen, J.; Prediger, J.; Barkmann, L.; Müller, L. Determination of the microplastics emission in the effluent of a municipal waste water treatment plant using Raman microspectroscopy. Water Res. X 2019, 2, 100014. [Google Scholar] [CrossRef] [PubMed]
- Wolff, S.; Weber, F.; Kerpen, J.; Winklhofer, M.; Engelhart, M.; Barkmann, L. Elimination of Microplastics by Downstream Sand Filters in Wastewater Treatment. Water 2021, 13, 33. [Google Scholar] [CrossRef]
- Ruan, Y.; Zhang, K.; Wu, C.; Wu, R.; Lam, P.K.S. A preliminary screening of HBCD enantiomers transported by microplastics in wastewater treatment plants. Sci. Total Environ. 2019, 674, 171–178. [Google Scholar] [CrossRef] [PubMed]
- Cao, Y.; Wang, Q.; Ruan, Y.; Wu, R.; Chen, L.; Zhang, K.; Lam, P.K.S. Intra-day microplastic variations in wastewater: A case study of a sewage treatment plant in Hong Kong. Mar. Pollut. Bull. 2020, 160, 111535. [Google Scholar] [CrossRef]
- Alavian Petroody, S.S.; Hashemi, S.H.; van Gestel, C.A.M. Factors affecting microplastic retention and emission by a wastewater treatment plant on the southern coast of Caspian Sea. Chemosphere 2020, 261, 128179. [Google Scholar] [CrossRef] [PubMed]
- Naji, A.; Azadkhah, S.; Farahani, H.; Uddin, S.; Khan, F.R. Microplastics in wastewater outlets of Bandar Abbas city (Iran): A potential point source of microplastics into the Persian Gulf. Chemosphere 2021, 262, 128039. [Google Scholar] [CrossRef]
- Takdastan, A.; Niari, M.H.; Babei, A.; Dobaradaran, S.; Jorfi, S.; Ahmadi, M. Occurrence and distribution of microplastic particles and the concentration of Di 2-ethyl hexyl phthalate (DEHP) in microplastics and wastewater in the wastewater treatment plant. J. Environ. Manag. 2021, 280, 111851. [Google Scholar] [CrossRef]
- Ben-David, E.A.; Habibi, M.; Haddad, E.; Hasanin, M.; Angel, D.L.; Broth, A.M.; Sabbah, I. Microplastic distributions in a domestic wastewater treatment plant: Removal efficiency, seasonal variation and influence of sampling technique. Sci. Total Environ. 2021, 752, 141880. [Google Scholar] [CrossRef] [PubMed]
- Magni, S.; Binelli, A.; Pittura, L.; Avio, C.G.; Della Torre, C.; Parenti, C.C.; Gorbi, S.; Regoli, F. The fate of microplastics in an Italian Wastewater Treatment Plant. Sci. Total Environ. 2019, 652, 602–610. [Google Scholar] [CrossRef] [PubMed]
- Pittura, L.; Foglia, A.; Akyol, Ç.; Cipolletta, G.; Benedetti, M.; Regoli, F.; Eusebi, A.L.; Sabbatini, S.; Tseng, L.Y.; Katsou, E.; et al. Microplastics in real wastewater treatment schemes: Comparative assessment and relevant inhibition effects on anaerobic processes. Chemosphere 2021, 262, 128415. [Google Scholar] [CrossRef]
- Lee, H.; Kim, Y. Treatment characteristics of microplastics at biological sewage treatment facilities in Korea. Mar. Pollut. Bull. 2018, 137, 1–8. [Google Scholar] [CrossRef] [PubMed]
- Park, H.J.; Oh, M.J.; Kim, P.G.; Kim, G.; Jeong, D.H.; Ju, B.K.; Lee, W.S.; Chung, H.M.; Kang, H.J.; Kwon, J.H. National Reconnaissance Survey of Microplastics in Municipal Wastewater Treatments Plants in Korea. Environ. Sci. Technol. 2020, 54, 1503–1512. [Google Scholar] [CrossRef] [PubMed]
- Leslie, H.A.; Brandsma, S.H.; van Velzen, M.J.M.; Vethaak, A.D. Microplastics en route: Field measurements in the Dutch river delta and Amsterdam canals, wastewater treatment plants, North Sea sediments and biota. Environ. Int. 2017, 101, 133–142. [Google Scholar] [CrossRef]
- Wiśniowska, E.; Moraczewska-Majkut, K.; Nocoń, W. Efficiency of microplastics removal in selected wastewater treatment plants—Preliminary studies. Desalin. Water Treat. 2018, 134, 316–323. [Google Scholar] [CrossRef]
- Talvitie, J.; Heinonen, M. Preliminary Study on Synthetic Microfibers and Particles at a Municipal Waste Water Treatment Plant. HELCOM BASE Project—Implementation of the Baltic Sea Action Plan in Russia. 2014. Available online: https://helcom.fi/wp-content/uploads/2019/08/Microplastics-at-a-municipal-waste-water-treatment-plant.pdf (accessed on 1 September 2021).
- Blair, R.M.; Waldron, S.; Gauchotte-Lindsay, C. Average daily flow of microplastics through a tertiary wastewater treatment plant over a ten-month period. Water Res. 2019, 163, 114909. [Google Scholar] [CrossRef] [PubMed]
- Nguyen, N.B.; Kim, M.K.; Le, Q.T.; Ngo, D.N.; Zoh, K.D.; Joo, S.W. Spectroscopic analysis of microplastic contaminants in an urban wastewater treatment plant from Seoul, South Korea. Chemosphere 2021, 263, 127812. [Google Scholar] [CrossRef] [PubMed]
- Hidayaturrahman, H.; Lee, T.-G. A study on characteristics of microplastic in wastewater of South Korea: Identification, quantification, and fate of microplastics during treatment process. Mar. Pollut. Bull. 2019, 146, 696–702. [Google Scholar] [CrossRef] [PubMed]
- Alvim, C.B.; Bes-Piá, M.A.; Mendoza-Roca, J.A. Separation and identification of microplastics from primary and secondary effluents and activated sludge from wastewater treatment plants. Chem. Eng. J. 2020, 402, 126293. [Google Scholar] [CrossRef]
- Bayo, J.; López-Castellanos, J.; Olmos, S. Membrane bioreactor and rapid sand filtration for the removal of microplastics in an urban wastewater treatment plant. Mar. Pollut. Bull. 2020, 156, 111211. [Google Scholar] [CrossRef]
- Edo, C.; González-Pleiter, M.; Leganés, F.; Fernández-Piñas, F.; Rosal, R. Fate of microplastics in wastewater treatment plants and their environmental dispersion with effluent and sludge. Environ. Pollut. 2020, 259, 113837. [Google Scholar] [CrossRef]
- Franco, A.A.; Arellano, J.M.; Albendín, G.; Rodríguez-Barroso, R.; Zahedi, S.; Quiroga, J.M.; Coello, M.D. Mapping microplastics in Cadiz (Spain): Occurrence of microplastics in municipal and industrial wastewaters. J. Water Process. Eng. 2020, 38, 101596. [Google Scholar] [CrossRef]
- Franco, A.A.; Arellano, J.M.; Albendín, G.; Rodríguez-Barroso, R.; Coello, M.D. Microplastic pollution in wastewater treatment plants in the city of Cádiz: Abundance, removal efficiency and presence in receiving water body. Sci. Total Environ. 2021, 776, 145795. [Google Scholar] [CrossRef]
- Bayo, J.; Olmos, S.; López-Castellanos, J. Assessment of Microplastics in a Municipal Wastewater Treatment Plant with Tertiary Treatment: Removal Efficiencies and Loading per Day into the Environment. Water 2021, 13, 1339. [Google Scholar] [CrossRef]
- Rasmussen, L.A.; Iordachescu, L.; Tumlin, S.; Vollertsen, J. A complete mass balance for plastics in a wastewater treatment plant—Macroplastics contributes more than microplastics. Water Res. 2021, 201, 117307. [Google Scholar] [CrossRef]
- Magnusson, K.; Norén, F. Screening of Microplastic Particles in and Down-Stream a Wastewater Treatment Plant. C 55, IVL Swedish Environmental Research Institute. 2014. Available online: https://www.diva-portal.org/smash/get/diva2:773505/FULLTEXT01.pdf (accessed on 8 September 2021).
- Hongprasith, N.; Kittimethawong, C.; Lertluksanaporn, R.; Eamchotchawalit, T.; Kittipongvises, S.; Lohwacharin, J. IR microspectroscopic identification of microplastics in municipal wastewater treatment plants. Environ. Sci. Pollut. Res. 2020, 27, 18557–18564. [Google Scholar] [CrossRef]
- Gündoğdu, S.; Çevik, C.; Güzel, E.; Kilercioğlu, S. Microplastics in municipal wastewater treatment plants in Turkey: A comparison of the influent and secondary effluent concentrations. Environ. Monit. Assess. 2018, 190, 626. [Google Scholar] [CrossRef] [PubMed]
- Akarsu, C.; Kumbur, H.; Gökdağ, K.; Kıdeyş, A.E.; Sanchez-Vidal, A. Microplastics composition and load from three wastewater treatment plants discharging into Mersin Bay, north eastern Mediterranean Sea. Mar. Pollut. Bull. 2020, 150, 110776. [Google Scholar] [CrossRef] [PubMed]
- Horton, A.A.; Cross, R.K.; Read, D.S.; Jürgens, M.D.; Ball, H.L.; Svendsen, C.; Vollertsen, J.; Johnson, A.C. Semi-automated analysis of microplastics in complex wastewater samples. Environ. Pollut. 2021, 268, 115841. [Google Scholar] [CrossRef] [PubMed]
- Conley, K.; Clum, A.; Deepe, J.; Lane, H.; Beckingham, B. Wastewater treatment plants as a source of microplastics to an urban estuary: Removal efficiencies and loading per capita over one year. Water Res. X 2019, 3, 100030. [Google Scholar] [CrossRef]
- Sutton, R.; Mason, S.A.; Stanek, S.K.; Willis-Norton, E.; Wren, I.F.; Box, C. Microplastic contamination in the San Francisco Bay, California, USA. Mar. Pollut. Bull. 2016, 109, 230–235. [Google Scholar] [CrossRef] [PubMed]
- Mason, S.A.; Garneau, D.; Sutton, R.; Chu, Y.; Ehmann, K.; Barnes, J.; Fink, P.; Papazissimos, D.; Rogers, D.L. Microplastic pollution is widely detected in US municipal wastewater treatment plant effluent. Environ. Pollut. 2016, 218, 1045–1054. [Google Scholar] [CrossRef]
- Michielssen, M.R.; Michielssen, E.R.; Ni, J.; Duhaime, M.B. Fate of microplastics and other small anthropogenic litter (SAL) in wastewater treatment plants depends on unit processes employed. Environ. Sci. Water Res. Technol. 2016, 2, 1064–1073. [Google Scholar] [CrossRef] [Green Version]
- Dyachenko, A.; Mitchell, J.; Arsem, N. Extraction and identification of microplastic particles from secondary wastewater treatment plant (WWTP) effluent. Anal. Methods 2017, 9, 1412–1418. [Google Scholar] [CrossRef]
- Carr, S.A.; Liu, J.; Tesoro, A.G. Transport and Fate of Microplastic Particles in Wastewater Treatment Plants. Water Res. 2016, 91, 174–182. [Google Scholar] [CrossRef]
- Ngo, P.L.; Pramanik, B.K.; Shah, K.; Roychand, R. Pathway, classification and removal efficiency of microplastics in wastewater treatment plants. Environ. Pollut. 2019, 255, 113326. [Google Scholar] [CrossRef]
- Lusher, A.L.; Hurley, R.; Vogelsang, C.; Nizzetto, L.; Olsen, M. Mapping Microplastics in Sludge; Report No. M907 for the Norwegian Institute for Water Research (NIVA); NIVA: Oslo, Norway, 2018; Available online: http://hdl.handle.net/11250/2493527 (accessed on 9 September 2021).
- Habib, R.Z.; Thiemann, T.; Al Kendi, R. Microplastics and wastewater treatment plants—A review. J. Water Resour. Prot. 2020, 12, 1–35. [Google Scholar] [CrossRef] [Green Version]
- Hamidian, A.H.; Ozumchelouei, E.J.; Feizi, F.; Wu, C.; Zhang, Y.; Yang, M. A review on the characteristics of microplastics in wastewater treatment plants: A source of toxic chemicals. J. Clean. Prod. 2021, 295, 126480. [Google Scholar] [CrossRef]
- Corradini, F.; Meza, P.; Eguiluz, R.; Casado, F.; Huerta-Lwanga, E.; Geissen, V. Evidence of microplastic accumulation in agricultural soils from sewage sludge disposal. Sci. Total Environ. 2019, 671, 411–420. [Google Scholar] [CrossRef]
- European Parliament. Minimum Requirements for Water Reuse. 2019. Available online: https://www.europarl.europa.eu/RegData/seance_pleniere/textes_adoptes/provisoire/2019/02-12/0071/P8_TA-PROV(2019)0071_EN.pdf (accessed on 9 September 2021).
- Guo, W.Q.; Yang, S.S.; Xiang, W.S.; Wang, X.J.; Ren, N.Q. Minimization of excess sludge production by in-situ activated sludge treatment processes—A comprehensive review. Biotechnol. Adv. 2013, 31, 1386–1396. [Google Scholar] [CrossRef] [PubMed]
- Lai, T.M.; Dang, H.V.; Nguyen, D.D.; Yim, S.; Hur, J. Wastewater treatment using a modified A2O process based on fiber polypropylene media. J. Environ. Sci. Health A Tox. Hazard. Subst. Environ. Eng. 2011, 46, 1068–1107. [Google Scholar] [CrossRef] [PubMed]
- Mulkerrins, D.; Jordan, C.; McMahon, S.; Colleran, E. Evaluation of the parameters affecting nitrogen and phosphorus removal in anaerobic/anoxic/oxic (A/A/O) biological nutrient removal systems. J. Chem. Technol. Biotechnol. 2000, 75, 261–268. [Google Scholar] [CrossRef]
- Zhang, B.; Gao, T.Y. An anoxic/anaerobic/aerobic process for the removal of nitrogen and phosphorus from wastewater. J. Environ. Sci. Health 2000, 35, 1797–1801. [Google Scholar] [CrossRef]
- Xu, S.N.; Bernards, M.; Hu, Z.Q. Evaluation of anaerobic/anoxic/oxic (A2/O) and reverse A2/O processes in biological nutrient removal. Water Environ. Res. 2014, 86, 2186–2193. [Google Scholar] [CrossRef]
- Wang, S.P.; Yu, J.J.; Ma, H.J. Parameters to characterize the internal recirculation of an oxidation ditch. Water SA 2021, 47, 272–275. [Google Scholar] [CrossRef]
- Singh, M.; Srivastava, R.K. Sequencing batch reactor technology for biological wastewater treatment: A review. Asia Pac. J. Chem. Eng. 2011, 6, 3–13. [Google Scholar] [CrossRef]
- Shrestha, R.; Ban, S.; Devkota, S.; Sharma, S.; Joshi, R.; Tiwari, A.P.; Kim, H.Y.; Joshi, M.K. Technological trends in heavy metals removal from industrial wastewater: A review. J. Environ. Chem. Eng. 2021, 9, 105688. [Google Scholar] [CrossRef]
- Fu, Q.; Liu, X.; Wu, Y.; Wang, D.; Xu, Q.; Yang, J. The fate and impact of coagulants/flocculants in sludge treatment systems. Environ. Sci. Water Res. Technol. 2021, 7, 1387–1401. [Google Scholar] [CrossRef]
- Poerio, T.; Piacentini, E.; Mazzei, R. Membrane processes for microplastic removal. Molecules 2019, 24, 4148. [Google Scholar] [CrossRef] [PubMed] [Green Version]
- Ersahin, M.E.; Ozgun, H.; Dereli, R.K.; Ozturk, I.; Roest, K.; van Lier, J.B. A review on dynamic membrane filtration: Materials, applications and future perspectives. Bioresour. Technol. 2012, 122, 196–206. [Google Scholar] [CrossRef]
- Ghergel, A.; Teodosiu, C.; De Gisi, S. A review on wastewater sludge valorisation and its challenges in the context of circular economy. J. Clean. Prod. 2019, 228, 244–263. [Google Scholar] [CrossRef]
- Hatinoğlu, M.D.; Sanin, F.D. Sewage sludge as a source of microplastics in the environment: A review of occurrence and fate during sludge treatment. J. Environ. Manag. 2021, 295, 113028. [Google Scholar] [CrossRef]
- Li, X.; Chen, L.; Mei, Q.; Dong, B.; Dai, X.; Diong, G.; Zeng, E.Y. Microplastics in sewage sludge from the wastewater treatment plants in China. Water Res. 2018, 142, 75–85. [Google Scholar] [CrossRef] [PubMed]
- Zaharioiu, A.M.; Bucura, F.; Marin, F.; Ionete, R.E.; Oancea, S.; Constantinescu, M. Sustainable fuels obtained from the pyrolysis process of sewage sludge. Curr. Trends Nat. Sci. 2021, 10, 16–24. [Google Scholar] [CrossRef]
- Christodoulou, A.; Stamatelatou, K. Overview of legislation on sewage sludge management in developed countries worldwide. Water Sci. Technol. 2016, 73, 453–462. [Google Scholar] [CrossRef] [PubMed]
- Carrère, H.; Dumas, C.; Battimelli, A.; Batstone, D.J.; Delgenès, J.P.; Steyer, J.P.; Ferrer, I. Pretreatment methods to improve sludge anaerobic degradability: A review. J. Hazard. Mat. 2010, 183, 1–15. [Google Scholar] [CrossRef]
- Rorat, A.; Courtois, P.; Vandenbulcke, F.; Lemiere, S. Sanitary and environmental aspects of sewage sludge management. In Industrial and Municipal Sludge; Elsevier: Amsterdam, The Netherlands, 2019; pp. 155–180. [Google Scholar] [CrossRef]
- He, D.; Luo, Y.; Lu, S.; Liu, M.; Song, Y.; Lei, L. Microplastics in Soils: Analytical Methods, Pollution Characteristics and Ecological Risks. Trends Anal. Chem. 2018, 109, 163–172. [Google Scholar] [CrossRef]
- Nizzetto, L.; Futter, M.; Langaas, S. Are Agricultural Soils Dumps for Microplastics of Urban Origin? Environ. Sci. Technol. 2016, 50, 10777–10779. [Google Scholar] [CrossRef]
- Hurley, R.R.; Nizzetto, L. Fate and occurrence of micro(nano)plastics in soils: Knowledge gaps and possible risks. Curr. Opin. Environ. Sci. Health 2018, 1, 6–11. [Google Scholar] [CrossRef]
- Shen, M.; Huang, W.; Chen, M.; Song, B.; Zeng, G.; Zhang, Y. (Micro)plastic crisis: Unignorable contribution to global greenhouse gas emissions and climate change. J. Clean. Prod. 2020, 254, 120138. [Google Scholar] [CrossRef]
- Xu, Q.; Gao, Y.; Xu, L.; Shi, W.; Wang, F.; LeBlanc, G.A.; Cui, S.; An, L. Investigation of the microplastics profile in sludge from China’s largest Water reclamation plant using a feasible isolation device. J. Hazard. Mater. 2020, 388, 122067. [Google Scholar] [CrossRef] [PubMed]
- Ren, X.; Sun, Y.; Wang, Z.; Barceló, D.; Wang, Q.; Zhang, Z.; Zhang, Y. Abundance and characteristics of microplastic in sewage sludge: A case study of Yangling, Shaanxi province, China. Case Stud. Chem. Environ. Eng. 2020, 2, 10050. [Google Scholar] [CrossRef]
- Li, Q.; Wu, J.; Zhao, X.; Gu, X.; Ji, R. Separation and identification of microplastics from soil and sewage sludge. Environ. Pollut. 2019, 254, 113076. [Google Scholar] [CrossRef] [PubMed]
- Ni, B.J.; Zhu, Z.R.; Li, W.H.; Yan, X.; Wei, W.; Xu, Q.; Xia, Z.; Dai, X.; Sun, J. Microplastics Mitigation in Sewage Sludge through Pyrolysis: The Role of Pyrolysis Temperature. Environ. Sci. Technol. Lett. 2020, 7, 961–967. [Google Scholar] [CrossRef]
- Zhang, L.; Xie, Y.; Liu, J.; Zhong, S.; Qian, Y.; Gao, P. An Overlooked Entry Pathway of Microplastics into Agricultural Soils from Application of Sludge-Based Fertilizers. Environ. Sci. Technol. 2020, 54, 4248–4255. [Google Scholar] [CrossRef] [PubMed]
- Sujathan, S.; Kniggendorf, A.K.; Kumar, A.; Roth, B.; Rosenwinkel, K.H.; Nogueira, R. Heat and Bleach: A Cost-Efficient Method for Extracting Microplastics from Return Activated Sludge. Arch. Environ. Contam. Toxicol. 2017, 73, 641–648. [Google Scholar] [CrossRef]
- Siegel, H.; Fischer, F.; Lenz, R.; Fischer, D.; Jekel, M.; Labrenz, M. Identification and quantification of microplastic particles in drinking water treatment sludge as an integrative approach to determine microplastic abundance in a freshwater river. Environ. Pollut. 2021, 286, 117524. [Google Scholar] [CrossRef]
- Alavian-Petroody, S.S.; Hashemi, S.H.; van Gestel, C.A.M. Transport and accumulation of microplastics through wastewater treatment sludge processes. Chemosphere 2021, 278, 130471. [Google Scholar] [CrossRef] [PubMed]
- van den Berg, P.; Huerta-Lwanga, E.; Corradini, F.; Geissen, V. Sewage sludge application as a vehicle for microplastics in eastern Spanish agricultural soils. Environ. Pollut. 2020, 261, 114198. [Google Scholar] [CrossRef]
- Betancourt, W.Q.; Rose, J.B. Drinking water treatment processes for removal of Cryptosporidium and Giardia. Vet. Parasitol. 2004, 126, 219–234. [Google Scholar] [CrossRef]
- Shen, M.; Song, B.; Zhu, Y.; Zeng, G.; Zhang, Y.; Yang, Y.; Wen, X.; Chen, M.; Yi, H. Removal of microplastics via drinking water treatment: Current knowledge and future directions. Chemosphere 2020, 251, 126612. [Google Scholar] [CrossRef] [PubMed]
- Warsinger, D.M.; Chakraborty, S.; Tow, E.W.; Plumlee, M.H.; Bellona, C.; Loutatidou, S.; Karimi, L.; Mikelonis, A.M.; Achilli, A.; Ghassemi, A.; et al. A review of polymeric membranes and processes for potable water reuse. Prog. Polym. Sci. 2018, 81, 209–237. [Google Scholar] [CrossRef] [PubMed]
- Rahman, M.F.; Peldszus, S.; Anderson, W.B. Behaviour and fate of perfluoroalkyl and polyfluoroalkyl substances (PFASs) in drinking water treatment: A review. Water Res. 2014, 50, 318–340. [Google Scholar] [CrossRef] [PubMed]
- Eerkes-Medrano, D.; Leslie, H.A.; Quinn, B. Microplastics in drinking water: A review and assessment. Curr. Opin. Environ. Sci. Health 2019, 7, 69–75. [Google Scholar] [CrossRef] [Green Version]
- Novotna, K.; Cermakova, L.; Pivokonska, L.; Cajthaml, T.; Pivokonsky, M. Microplastics in drinking water treatment—Current knowledge and research needs. Sci. Total Environ. 2019, 667, 730–740. [Google Scholar] [CrossRef]
- Vethaak, A.D.; Legler, J. Microplastics and human health. Science 2021, 371, 672–674. [Google Scholar] [CrossRef]
- Wang, Z.; Lin, T.; Chen, W. Occurrence and removal of microplastics in an advanced drinking water treatment plant (ADWTP). Sci. Total Environ. 2020, 700, 134520. [Google Scholar] [CrossRef] [PubMed]
- Shen, M.; Zeng, Z.; Wen, X.; Ren, X.; Zeng, G.; Zhang, Y.; Xiao, R. Presence of microplastics in drinking water from freshwater sources: The investigation in Changsha, China. Environ. Sci. Pollut. Res. 2021, 28, 42313–42324. [Google Scholar] [CrossRef] [PubMed]
- Pivokonsky, M.; Cermakova, L.; Novotna, K.; Peer, P.; Cajthaml, T.; Janda, V. Occurrence of microplastics in raw and treated drinking water. Sci. Total Environ. 2018, 643, 1644–1651. [Google Scholar] [CrossRef]
- Pivokonský, M.; Pivokonská, L.; Novotná, K.; Čermáková, L.; Klimtová, M. Occurrence and fate of microplastics at two different drinking water treatment plants within a river catchment. Sci. Total Environ. 2020, 741, 140236. [Google Scholar] [CrossRef]
- Mintenig, S.M.; Löder, M.G.J.; Primpke, S.; Gerdts, G. Low numbers of microplastics detected in drinking water from ground water sources. Sci. Total Environ. 2019, 648, 631–635. [Google Scholar] [CrossRef]
- Sarkar, D.J.; Sarkar, S.D.; Das, B.K.; Praharaj, J.K.; Mahajan, D.K.; Purokait, B.; Mohanty, T.R.; Mohanty, D.; Gogoi, P.; Kumar, V.S.; et al. Microplastics removal efficiency of drinking water treatment plant with pulse clarifier. J. Hazard. Mat. 2021, 413, 125347. [Google Scholar] [CrossRef]
- Dalmau-Soler, J.; Ballesteros-Cano, R.; Boleda, M.R.; Paraira, M.; Ferrer, N.; Lacorte, S. Microplastics from headwaters to tap water: Occurrence and removal in a drinking water treatment plant in Barcelona Metropolitan area (Catalonia, NE Spain). Environ. Sci. Pollut. Res. 2021, 28, 59462–59472. [Google Scholar] [CrossRef]
- Chanpiwat, P.; Damrongsiri, S. Abundance and characteristics of microplastics in freshwater and treated tap water in Bangkok, Thailand. Environ. Monit. Assess. 2021, 193, 258. [Google Scholar] [CrossRef] [PubMed]
- Favere, J.; Barbosa, R.G.; Sleutels, T.; Verstraete, W.; De Gusseme, B.; Boon, N. Safeguarding the microbial water quality from source to tap. Clean Water 2021, 4, 28. [Google Scholar] [CrossRef]
- Pratesi, C.B.; A. L. Santos Almeida, M.A.; Cutrim Paz, G.S.; Ramos Teotonio, M.H.; Gandolfi, L.; Pratesi, R.; Hecht, M.; Zandonadi, R.P. Presence and Quantification of Microplastic in Urban Tap Water: A Pre-Screening in Brasilia, Brazil. Sustainability 2021, 13, 6404. [Google Scholar] [CrossRef]
- Zhang, M.; Li, J.; Ding, H.; Ding, J.; Jiang, F.; Ding, N.X.; Sun, C. Distribution Characteristics and Influencing Factors of Microplastics in Urban Tap Water and Water Sources in Qingdao, China. Anal. Lett. 2020, 53, 1312–1327. [Google Scholar] [CrossRef]
- Strand, J.; Feld, L.; Murphy, F.; Mackevica, A.; Hartmann, N.B. Analysis of Microplastic Particles in Danish Drinking Water. DCE-Danish Centre for Environment and Energy. 2018, pp. 1–34. Available online: http://dce2.au.dk/pub/SR291.pdf (accessed on 20 September 2021).
- Weber, F.; Kerpen, J.; Wolff, S.; Langer, R.; Eschweiler, V. Investigation of microplastics contamination in drinking water of a German city. Sci. Total Environ. 2021, 755, 143421. [Google Scholar] [CrossRef] [PubMed]
- Uhl, W.; Svendsen, C. Mapping Microplastics in Norwegian Drinking Water. A Summary of Results and Evaluation of Suspected Health Risks. 2018. Available online: https://norskvann.no/files/docs/MP_in_DW_-_excecutive_summary.pdf (accessed on 20 September 2021).
- Almaiman, L.; Aljomah, A.; Bineid, M.; Aljeldah, F.M.; Aldawsari, F.; Liebmann, B.; Lomako, I.; Sexlinger, K.; Alarfaj, R. The occurrence and dietary intake related to the presence of microplastics in drinking water in Saudi Arabia. Environ. Monit. Assess. 2021, 193, 390. [Google Scholar] [CrossRef] [PubMed]
- World Health Organization. Be Smart. Drink Water A Guide for School Principals in Restricting the Sale and Marketing of Sugary Drinks in and Around Schools. 2016. Available online: https://iris.wpro.who.int/bitstream/handle/10665.1/13218/WPR_2016_DNH_008_eng.pdf (accessed on 21 September 2021).
- Leslie, H.A.; Depledge, M.H. Where is the evidence that human exposure to microplastics is safe? Environ. Int. 2020, 142, 105807. [Google Scholar] [CrossRef] [PubMed]
- Li, B.; Ding, Y.; Cheng, X.; Sheng, D.; Xu, Z.; Rong, Q.; Wu, Y.; Zhao, H.; Ji, X.; Zhang, Y. Polyethylene microplastics affect the distribution of gut microbiota and inflammation development in mice. Chemosphere 2020, 244, 125492. [Google Scholar] [CrossRef]
- Park, E.J.; Han, J.S.; Park, E.J.; Seong, E.; Lee, G.H.; Kim, D.W.; Son, H.Y.; Han, H.Y.; Lee, B.S. Repeated-oral dose toxicity of polyethylene microplastics and the possible implications on reproduction and development of the next generation. Toxicol. Lett. 2020, 324, 75–85. [Google Scholar] [CrossRef] [PubMed]
Figure 1.
A possible route of entry of MPFs into living beings via WWTPs and DWTPs.

Publisher’s Note: MDPI stays neutral with regard to jurisdictional claims in published maps and institutional affiliations. |
© 2021 by the authors. Licensee MDPI, Basel, Switzerland. This article is an open access article distributed under the terms and conditions of the Creative Commons Attribution (CC BY) license (https://creativecommons.org/licenses/by/4.0/).
Share and Cite
MDPI and ACS Style
Sol, D.; Laca, A.; Laca, A.; Díaz, M. Microplastics in Wastewater and Drinking Water Treatment Plants: Occurrence and Removal of Microfibres. Appl. Sci. 2021, 11, 10109. https://doi.org/10.3390/app112110109
AMA Style
Sol D, Laca A, Laca A, Díaz M. Microplastics in Wastewater and Drinking Water Treatment Plants: Occurrence and Removal of Microfibres. Applied Sciences. 2021; 11(21):10109. https://doi.org/10.3390/app112110109
Chicago/Turabian StyleSol, Daniel, Amanda Laca, Adriana Laca, and Mario Díaz. 2021. "Microplastics in Wastewater and Drinking Water Treatment Plants: Occurrence and Removal of Microfibres" Applied Sciences 11, no. 21: 10109. https://doi.org/10.3390/app112110109
Note that from the first issue of 2016, this journal uses article numbers instead of page numbers. See further details here.