
From Nearly Zero Energy to Carbon-Neutral: Case Study of a Hospitality Building


Department of Energy, Politecnico di Milano, Via Lambruschini 4, 20156 Milano, Italy
*
Author to whom correspondence should be addressed.
Appl. Sci. 2021, 11(21), 10148; https://doi.org/10.3390/app112110148
Submission received: 27 August 2021
/
Revised: 20 October 2021
/
Accepted: 26 October 2021
/
Published: 29 October 2021
(This article belongs to the Special Issue New Trends in Efficient Buildings)
Abstract
:In recent years, many cities around the world have pledged to upgrade their building stocks to carbon-neutral. However, the literature does not yet provide a shared definition of carbon-neutral building (CNB), and the assessment objectives and methodological approaches are vague and fragmented. Starting from the available standards and scientific literature on life cycle assessment (LCA), this paper advances an operational definition for CNB on the basis of an explicit calculation approach. It then applies the definition to an urban case study, comparing it against a state-of-the-art nearly Zero Energy Building (nZEB) scenario, with the intent of highlighting the major practical limitations connected to the application of a methodologically sound carbon neutrality calculation. The case study shows that carbon neutral objectives can hardly be achieved by single urban buildings because of the lack of spaces that can provide onsite carbon offsetting actions. Carbon neutrality may be better approached at the city, regional, or national scales, where overarching policies may be defined.
1. Introduction
In recent years, efforts to reduce the environmental impacts of the construction sector have led to continuous refinements and upgrades of nearly Zero Energy Building (nZEB) policies towards an even more sustainable building approach: the carbon-neutral building (CNB) or the zero-carbon building (ZCB). Decreasing the carbon footprints of buildings, and increasing the green infrastructures of cities, can be key actions to combat global warming and to meet the Paris Agreement Goal. However, less than 1% of the buildings in the world may currently be labelled as “carbon-neutral” [1,2]. The massive use of resources, and the related environmental impacts, are evident in the construction sector that, in 2018, globally accounted for 36% of final energy use, and 39% of energy and process-related carbon dioxide (CO2) emissions. In particular, 11% of the emissions resulted from manufacturing building materials and products, such as steel, cement, and glass, and 28% resulted from building operations [3,4]. For this reason, a carbon-neutral approach has been adopted in several countries and regions as a governmental climate change strategy [5]. A roadmap for moving to a competitive low-carbon economy by 2050 has been set by the European Commission since 2011 [6], while, in November 2018, the European Commission presented a long-term strategy for the EU to achieve a climate-neutral economy by 2050. In June 2019, EU leaders called on EU countries and the Commission to work to ensure a transition toward a climate-neutral EU, in line with the Paris Agreement [7,8,9]. As part of this broad scenario, many cities in the world (not only in the EU) pledged to become carbon-neutral by 2050, and are developing projects to achieve this objective, as summarized by the document “Paris, an air of change” [10]. Moreover, in 2018, 19 cities all over the world committed to put in place regulations requiring all new buildings to be carbon-neutral by 2030, and existing ones to reach the same goal by 2050 [11]. This pledge from cities is part of the World Green Building Council’s Net Zero Carbon Building Commitment, officially launched at the Global Climate Action Summit in September 2018, that challenges companies, cities, states, and regions to reach net-zero operating emissions in their portfolios by 2030, and to advocate for all buildings to be net-zero in operation by 2050 [12]. As part of this community, 48 businesses and organizations, 28 cities all over the world, and 6 states and regions are showing and sharing their lessons learnt, as well as the knowledge and frameworks to develop globally ambitious, yet locally relevant, flexible, and universally viable solutions for their portfolios in order to both reduce energy demand and achieve net-zero carbon emissions [12].
Nevertheless, the uptake of the CNB approach is low, far from the mainstream practice of building [13]. The first CNB in Hong Kong was commissioned by the Construction Industry Council (CIC) and constructed in 2012 [5,14,15], and the construction of the first carbon-neutral office building in Melbourne started in mid-2009 [16], while, in 2019, Mohawk College’s Joyce Centre for Partnership and Innovation was selected by the Canada Green Building Council (CaGBC) as a national pilot project to demonstrate its new net-zero energy carbon standard and validation process [17].
Other examples of the applied CNB/ZCB approach include guidelines and directives promoted by different countries all over the world, as well as global competitions for innovative carbon-free and resilient urban projects, such as those initiated by the C40 Cities Climate Leadership Group [18]. In 2013, the Australian Government promoted the “Your Home” guidelines that contain environmentally sustainable solutions for designing and building carbon-zero or carbon-positive homes [19]. The Society of Building Science Educators (SBSE), in the framework of the Carbon Neutral Design (CND) Project, provided a guidebook in 2012 to create and disseminate the resources and tools needed to integrate carbon-neutral and zero-energy design into professional architecture programs and practices [20,21]. In 2006, the UK’s Department for Communities and Local Government (DCLG) set a timetable to achieve zero-carbon new homes by 2016 [22,23], and, in 2009, the UK’s Department of Energy and Climate Change (DECC) provided the “Guidance on Carbon Neutrality” to give an overview of the process that should be followed in order to achieve carbon neutrality, as well as pointers to existing recognized standards and guidance [24]. The city of Vancouver, as part of the Greenest City 2020 initiative, established targets involving the achievement of carbon neutrality for all new buildings by 2030, and the same applies to the Canada Green Building Council that, with the 2012 Strategic Plan, set a goal for carbon-neutral buildings and communities by 2030 [25].
Although CNB/ZCB is emerging as an innovative and sustainable building approach [5,22], its understanding is fragmented, and gaps can be identified in the definitions and in policy frameworks. Different aspects of this approach are not globally shared, and the key points of the debate concern: (i) The need for a shared definition for CNB/ZCB (different terms sharing similar, or the same, meanings can be found in the literature, such as carbon-zero building, net-zero carbon building, zero-carbon home, net-zero emissions building, etc.); (ii) The energy use (for specific building services); (iii) The life cycle phases to which carbon emissions are associated; (iv) Whether or not to focus on user-related embodied carbon (e.g., user-transportation-related emissions); (v) The need for recognized solutions to compensate for residual emissions; (vi) How to account for biogenic carbon in bio-based building materials and; (vii) The vagueness about the national and international commitments for moving to a carbon neutral economy by 2050.
This paper tries to bridge some of these gaps: (i) By reporting the available definitions from the literature (Section 2), with the intent to highlight and overcome current misunderstandings; (ii) By proposing a new clear definition for CNB, on the basis of an explicit calculation approach (Section 3); and (iii) By applying it to a representative urban case study with the intent of comparing the CNB performance to the nZEB certification, and of highlighting the major practical limitations connected to the real-world application of a methodologically correct carbon neutrality calculation (Section 3, Section 4 and Section 5). Finally, Section 6 investigates the possible implications of the pledges made by cities to achieve carbon neutrality without a clear and shared definition of carbon neutrality and a corresponding assessment procedure.
2. Zero-Carbon and Carbon-Neutral Building Definitions
Since no official definition for CNB/ZCB is already internationally agreed upon, and since there are no clear requirements to be fulfilled to reach carbon neutrality in buildings, countries and companies are referring to quite different definitions, criteria, and guidelines. Therefore, a series of terms sharing similar meanings can be found in the literature [13,26,27]. As an attempt to review the CNB/ZCB definitions, Table 1 reports those containing the terms “carbon” or “emission”, such as “Zero emissions building”, “Zero carbon home”, etc. The last column on the right indicates which impacts, with respect to the whole-building lifecycle, the definition/approach takes into account in the calculations.
According to the CNB/ZCB definitions reported in Table 1, only two (UKGBC [39] and Selamawit, F. et al. [36]) consider the deconstruction/disposal phase, i.e., the end-of-life (EoL) scenarios, while most of them consider only the operational phase of the whole building’s lifecycle. Therefore, the environmental impacts related to the building’s materials production, their assembly procedures and transportation to the construction site, as well as their replacement and their disposal at the end of their service life, are not accounted in the analysis. Moreover, the definitions do not typically include an explicit calculation reference to be used to verify compliance with the goals, but just overall lists of the possible actions of intervention.
A clearer definition related to an explicit calculation and assessment procedure is, thus, urgently needed to define which impacts should be taken into consideration, and to allow comparisons between buildings, districts, and cities.
3. Methodology
In order to overcome the issue highlighted in Section 2, a new operational definition for CNB is proposed as follows: “A carbon-neutral building is defined as a building able to achieve a net amount of carbon-dioxide-equivalent emissions (CO2-eq) related to the whole-building lifecycle, equal to zero. Its performance should be assessed through the life cycle assessment (LCA) common framework, provided by ISO 14040:2006 and ISO 14044:2006 [43,44]. In particular, the calculation of the building carbon emissions, in terms of the tons or kilograms of carbon dioxide equivalent (tonCO2-eq, kgCO2-eq) emitted into the atmosphere, is based on the EN 15804+A1:2019 and EN 15978:2011, specifically developed for construction products and services [45,46], or on any equivalent or more stringent standard, compliant to EN standards and provided by authorized bodies. The calculation must consider the whole-building lifecycle, from materials production to their disposal and deconstruction, as shown in Figure 1 (the production phase of the construction material (stages A1–A3), the transportation of material to the construction site (stage A4), the installation of the construction materials (stage A5), the replacement and maintenance of materials (stages B4–B5), the energy usage (stage B6), and the disposal and deconstruction of materials (stages C1–C4). No embodied carbon due to user-related activities is (yet) considered in the calculations since they are heavily dependent on the users and their aleatory lifestyle choices, and neither have carbon emissions related to the B1–3 stages that cover the release of greenhouse gases from products and materials (e.g., paints, carpets, etc.) during the normal operation of the building, the carbon emissions of all ordinary maintenance activities (e.g., cleaning), and of the repair of the relevant building components before the end of their service life. Biogenic carbon should not be included in the calculation until scientific literature and standards can provide a shared methodology to assess it. Any residual carbon emissions at the end of the building’s service life should be offset. Offsetting criteria can include the financing of local or delocalized vegetation and renewable energy projects, the purchase of certified green energy and carbon credits, and the local contribution of renewable energy on site. The standard service life for a residential building may be assumed as 50 years, unless properly argued (e.g., offices and retails may report a shorter service life), whereas the service lives of the building components and materials should be as declared by the producer. Operational energy-related emissions must derive from dynamic energy simulations, including all the main building services (heating, cooling, ventilation, hot water, lighting, and appliances), and the nomenclature must be compliant with the ISO 52000-1 standard [47]”.
In the paper, the new definition of CNB is tested via a case study. In order to assess the practical consequences of the definition on the design, a real lot in an urban environment has been selected, choosing a final use that might provide actual, though challenging, conditions to the carbon neutrality objective. If a countryside single family house, with large envelope surfaces and a relatively small volume, may easily offset its emissions through large active surfaces producing renewable energy, and via the planting of a few trees, an urban building, because of urban laws, including front alignment and limitations in the use of active renewable technologies because of low irradiance values, may experience more challenging conditions. The selected case study is, thus, a hostel located on an urban lot in Milan, Italy. The calculations are developed both for the CNB objective and for a reference, or state-of-the-art, scenario, which, according to national and regional legislations [48,49,50], requires reaching the nZEB standard. This will allow for understanding if an nZEB building may also reach carbon neutrality, or how far it might be from it.
According to the new CNB definition, the evaluation of the carbon emissions related to the use stage (B6), the operational energy use in both the nZEB and CNB scenarios, is performed by means of numerical simulations under dynamic conditions, using the calculation suite TRNsys 17 [51], in order to achieve the yearly energy need. The energy use for all of the main building services (heating, cooling, ventilation, hot water, lighting, and appliances) was considered in the calculations. The carbon emissions were assessed via LCA according to ISO 14040:2006, ISO 14044:2006, and to EN 15804+A1:2019 and EN 15978:2011.
A comparison of the results between the CNB and nZEB leads to general considerations about the feasibility of the carbon neutrality objective for urban buildings, either new constructions or renovations, posing important questions to the pledges of cities and businesses.
4. Case Study
The case study is an eight-story hostel building, located in Milan, Italy, with a net average surface per floor above ground equal to about 260 m2, while the whole footprint area of the lot is around 600 m2 (Figure 2). The building comprises 280 beds distributed in different single and multiple bedrooms between the basement and the seventh floor. The basement is also partially occupied by service systems, while the ground floor is partially occupied by the reception and the common areas of the hostel. The eighth floor is occupied by a private penthouse of about 140 m2. Overall, the gross surface is around 2800 m2. The windows and transparent elements constitute around 30% of the whole vertical envelope.
Because of the lack of space for photovoltaic (PV) panels, and the negligible contribution that micro-wind systems may provide in the climate of Milan, the reduction of the overall carbon footprint has to be achieved mainly through a careful choice of materials and construction technologies. Table 2 summarizes the construction technologies and the service systems considered at the end of the design process to achieve, respectively, the nZEB and carbon-neutral targets. It is important to notice that, while for the nZEB, the envelope insulation performance is defined by the Italian legislation, for the CNB, the values reported are the final results of a long design process that took into account not only thermal efficiency, but also architectural and economic constraints. Finally, the geometry of the building was the same for both the nZEB and CNB scenarios.
Since the purpose of the work is to analyze the possibilities and limitations of adopting carbon-neutral buildings at the urban scale, as pledged by many cities and international bodies, in this paper, we do not report the details of the design optimization process or any of the assessments required by the local standards (e.g., structural and fire resistance, etc.) that have been performed to guarantee the feasibility of the building. The building is, therefore, here presented just as a representative case study. In this section, we only report the outcomes of the design process that led to the fulfillment of the nZEB target (according to Italian legislation), and to carbon neutrality, according to EN 15804+A1:2019 and EN 15978:2011, and the newly provided definition of CNB. In the following sections, we will present the energy and carbon emission outcomes of the analysis that informed the design process, and we will discuss the practical consequences of adopting a carbon-neutral approach for all the buildings in a city.
4.1. nZEB Scenario
The nZEB scenario is characterized by typical construction technologies: the whole structure is made of reinforced concrete and the vertical envelope is composed of hollow clay blocks (25 cm) and an external mineral wool insulating layer (12 cm). The external horizontal envelope surfaces are characterized by concrete slabs with cement-based screeds, EPS insulating panels (14 cm), and tile flooring or a gravel drainage layer. Double-glazed windows with aluminum frames (and thermal break) were considered in this scenario.
A PV system with a total peak power of 17.8 kWp was installed on the roof surface to comply with the minimum energy performance requirements defined in the regional legislation, and the heating/cooling and domestic hot water (DHW) demands are covered by an air-to-water heat pump. Finally, fan coils are used as terminal devices in bedrooms, coupled with a dedicated air handling unit (AHU) for mechanical ventilation, whereas the ground floor common areas are conditioned just through an AHU.
4.2. CNB Scenario
Because of the characteristics of the urban lot and regulations, with a bonded orientation and shape, and limited access to solar energy (see Figure 2), the building envelope and systems cannot be conventional ones to achieve the CNB objective, but they must outperform the nZEB approach. Therefore, the CNB scenario is characterized by wooden structures for the floors above ground, and by reinforced concrete structures with a high level of recycled materials for the basement, whereas the limitation of the building’s thermal energy need for space heating and cooling was based on a careful design of the building envelope components, and their integration within the system infrastructure. As far as the opaque vertical envelope is concerned, the breathing wall (BW) technology was adopted [52,53,54,55,56]; the overall layer sequence of this technology consists of an external cladding, a ventilated air gap, a multilayer porous core based on air-permeable materials, a second air gap, and an internal cladding. Through a small indoor–outdoor pressure difference, it is possible to generate a low velocity airflow (around 0.001 m/s) driven across the wall, which is integrated into the mechanical ventilation system [57,58] as a heat recovery component and a filter.
The BW technology operates in two modes, according to the direction of the heat flux and the airflow [58]: pro-flux and contra-flux. In the first configuration, the heat flux and the airflow go in the same direction, while they are opposite in the second one. Through the selection of the working regime and airflow velocity, it is possible to: (i) Affect the temperature distribution across the wall [55,56,58]; (ii) Preheat the ventilation air [53], which reaches the same temperature as the interior ventilated air cavity; (iii) Drop the effective thermal transmittance, as shown in the literature [59], and mitigate heat losses due to transmission in winter; (iv) Maximize the heat dissipation through the envelope in summer and exploit night-free cooling (pro-flux); (v) Modulate the effective wall heat capacity [52] and the indoor–outdoor thermal coupling; (vi) Filtrate the incoming ventilation air. BW technology is considered, in the CNB scenario, as a tool to further reduce the energy need with respect to the nZEB scenario, consequently mitigating the CO2-eq emissions related to the B6 stage of the LCA analysis.
The horizontal structures (roof and terrace) are made, in the CNB scenario, of CLT (cross-laminated timber) slabs, wood-based insulation panels (16 cm), waterproofing and breathable membranes and a gravel drainage layer, and outdoor wood flooring, or a green roof, according to the zone of the building. Table 2 reports the thermal transmittance values (U-values) of the chosen external horizontal and vertical envelope structures. All of the insulating materials of the internal partitions and the external envelope are wood-based, except for the external layer of the BW that, to comply with fire regulations, is made of mineral wool. High-performance low-emissivity double-glazed windows with wooden frames were considered for the transparent envelope.
The high envelope performance is complemented by the local production of renewable electric energy by means of 72 PV panels, of 300 Wp each, installed on the roof, for a total peak power of 21.6 kWp, overcoming the minimum nZEB requirements. The size of the PV plant, as declared previously, is, nevertheless, limited by the small roof area available and by the urban context (i.e., shadows projected by adjacent buildings). To further increase the local production, electric energy, as well as thermal energy, are also generated by 9 micro-combined heat and power (CHP) systems, based on fuel-cell technology, able to produce 0.9 kWTH, used for DHW, and 1.5 kWEL each, with an hourly natural gas consumption of 0.25 m3/h. The micro-CHP systems are coupled with a geothermal water-to-water heat pump (GWHP) of 300 kWTH to cover the heating/cooling loads. The DHW is managed by two thermal storage boilers of 5000 L each, supplied by the CHP systems. Fan coils are used as terminal devices in the bedrooms, while the ground floor common areas are conditioned through an AHU. In each bedroom, to effectively exploit the BW function of filter and air pretreatment, a localized mechanical ventilation system was designed to be installed over the windows in order to modulate the airflow according to the number of people inside the rooms, and to reduce the thermal loads.
4.3. Energy Model
The energy use is calculated in both scenarios through dynamic simulations over one year, performed using the calculation suite TRNsys 17 [51], and considering Milan’s typical meteorological year (i.e., MI_Linate_1951-1970 weather file [60,61]).
4.3.1. Thermal Zones and Occupancy Profiles
Thermal zones have been set as clusters of rooms located at the same story and provided with the same features (e.g., type of facilities, activity, orientation, etc.): in the basement, there is a thermal zone for the bar and another for the bedrooms; at the ground floor, there is a zone for the reception and another zone for the bedrooms; from floors 1 to 7, a total of 14 thermal zones are defined for bedrooms; and finally, the penthouse is divided into two zones (one for the kitchen and another for the rest of the flat). Every floor is also provided with a thermal zone dedicated to stairs and corridors. Table A1 lists all the thermal zones, along with their gross dimensions, the internal load sources, the ventilation systems, and the heating/cooling supply devices.
Taking into consideration the receptive function of the building (Figure 3), a yearly occupation profile was established, then a daily occupancy profile (Figure 4), and a heating/cooling plant schedule (Figure 5) was defined for each zone, according to the suggestions provided by the hostel manager who took part in the design process. As far as the heating and cooling plant activation was concerned, it is important to notice that the temperature control switches from a full set-point (20 °C in winter and 26 °C in summer) to a reduced one (18 °C in winter and 28 °C in summer). The effective occupation percentage of each zone at any given timestamp is obtained by multiplying the overall yearly occupation factor from Figure 3 by the thermal zone daily occupation factor from Figure 4.
4.3.2. Heat Transfer Calculation
TRNsys 17 uses the transfer function approach to manage the heat transfer problem across capacitive opaque structures. The inner and outer surface heat flux densities at any given time are related to their values in the past timestamps, along with the corresponding past and present surface temperature values. Every structure is treated as a black box, i.e., the model is able to provide a reliable depiction of the superficial temperature and heat flux density conditions for a given set of boundary conditions, but it is not able to calculate the temperature distribution across the considered structure. Moreover, the coefficients for the heat transfer function of each structure are calculated in a preprocessing phase, according to the geometry and the thermophysical properties of the layers. Even though this approach is adequate to simulate the standard envelope foreseen by the nZEB scenario, it is not able to manage the dynamic changes in thermal behavior typical of the BW technology chosen for the CNB scenario. In this scenario, the functions of TRNsys 17 are integrated through the development of a dedicated finite difference algorithm [54,62]. This numerical method, although more computationally expensive, allows for the simulation of the evolution over time of the temperature distribution within a multilayer structure, taking into account unsteady boundary conditions (indoor and outdoor air temperatures, solar radiation), and airflows crossing the layers with variable velocity.
At the same time, airflow velocity is treated as an input, calculated according to a dedicated control strategy. The algorithm is then coupled with the building module inside TRNsys 17 (namely TRNbuild), which is able to simulate the overall BW component performance, both in terms of conduction heat transfer, and heat recovery on the ventilation component.
4.3.3. Ventilation
Ventilation air-change rates are set according to the technology implemented, as shown in Table A1. For each thermal zone provided by a daily occupancy profile, its hourly value was used to modulate the air-change rate between a null value (the system is shut down if there are no occupants), and a maximum value corresponding to the maximum occupation defined (Table A1). This approach simulates the feedback of a presence or CO2 sensor. Moreover, traditional heat recovery units were used in the models of both buildings, with an average recovery efficiency of 0.7.
The ventilation provided by the BW was defined proportionally to the number of people in the thermal zone at any given time, as for the AHU. Moreover, the ability of this technology to recover heat was considered. If the air was supplied into the thermal zone after crossing the wall, the fluid temperature was calculated by the finite difference algorithm, while it was set equal to the outdoor temperature if the wall worked as exhaust and the air was supplied by a dedicated vent. At this stage, a simple control algorithm was implemented: under heating conditions, air intake happens through the BW when the outdoor air temperature is below the indoor set-point, and it is exhausted through the wall the rest of the time, while the opposite logic is active in the cooling season.
4.3.4. Internal Gains
The occupancy profile for each thermal zone was defined in agreement with the intended use, also taking into account the corresponding level of activity, along with the number of occupants. The resulting maximum value was modulated during every timestamp according to the yearly and daily occupancy profiles.
A similar approach was used in dealing with the loads because of artificial lighting to simulate the action of presence sensors. Additional profiles were also introduced to simulate the loads coming from other appliances. More details about all the internal gains are reported in Appendix A.
Because of the high level of innovation introduced in the envelope, and the lack of previous experience in the application of the BW technology to full-scale buildings, internal gains have been augmented during the cooling season and reduced during the heating season, as a safety factor.
4.3.5. Heating and Cooling Plants
Once the energy need profiles for the CNB and the nZEB scenarios were obtained, as ideal thermal loads through the numerical simulations performed in TRNsys 17, all the subsystems of the heating and cooling plants were taken into consideration, i.e., emission, regulation, distribution, and generation. For the first three subsystems, suitable efficiencies were applied in compliance with the national technical standards [63,64] (Table A2), since the design process at the stage considered in this work is not advanced enough to allow the detailed simulation of every component of the plant. The result is the energy delivered by the generation system, further adapted to obtain the corresponding absorbed electrical energy profile by dividing all the hourly values, by either the heat pump seasonal coefficient of performance (SCOP—heating season), or the chiller seasonal energy efficiency ratio (SEER—cooling season), which are defined according to the technology implemented in each building scenario. For the nZEB scenario, a SCOP of 2.8 and a SEER of 2.8 were adopted, whereas for the CNB scenario, a SCOP of 4.3 and a SEER of 4.7 were assumed. At the same time, the profiles of energy delivered by the generation system were used to estimate the hourly electrical energy use due to the heating and cooling plant auxiliaries (pumps, motorized valves, fan-coils, etc.). It was assumed that the energy consumption due to auxiliaries is, at any given timestamp, proportional to the ratio between the instantaneous value of the energy delivered by the generation system and its maximum annual value.
4.3.6. DHW Consumption and Electric Appliances
The energy consumption related to DHW production was based on the definition of a daily requirement profile for the overall building: a load curve that provides the percentage of the overall water daily need was defined (Figure 6). The corresponding hourly energy consumption was calculated according to the generation system implemented (electrical heat pump in the nZEB scenario, micro-CHP and GWHP in the CNB scenario).
In this work, lights and appliances were considered too, taking into account small devices (e.g., smartphones, laptops) for rooms, vacuum cleaners for all spaces, and electric equipment related to the bar and the penthouse for both scenarios (Table A3). For each component, an annual time schedule was defined to achieve a total electricity consumption, used in both scenarios. These energy uses were included in the analyses since they prove to be relevant in the overall energy balance of a carbon-neutral building in an urban context.
4.3.7. Electric Production
The overall energy production for both scenarios was computed. For the nZEB only, PVs were considered, while for the CNB, energy came from both the micro-CHP and PV panels. The overall energy production profile was, in both cases, subtracted from the corresponding energy use profile to finally get the total CO2-eq annual emissions.
4.4. Assessment of the Whole-Building Life Cycle Carbon Emissions
The building carbon emission assessment was based on the EN 15804+A1:2019 and EN 15978:2011. The EN 15978 provides a framework for calculating and assessing environmental performance at the building level, for both new and existing buildings, whereas the EN 15804 provides the structure to develop the environmental product declarations (EPDs) for all construction products and construction services. As mentioned in Section 3, and as shown in Figure 1, the approach adopted in this study considers the whole-building life cycle, from material production to the disposal and deconstruction, and it is based on data gathered from EPDs and the ecoinvent database [65].
The calculation of the CO2-eq emissions under the two scenarios was carried out considering a building service life of 50 years, since the final use may be assimilated to the residential one, and was performed using a combination of commercial software, trying to exploit their best characteristics. In particular, for phases A1–A5, B4–B5, and C1–C4, One Click LCA software [66], specifically developed for the LCA analysis of buildings, was used, while the B6 stage’s CO2-eq emissions were assessed through SimaPro 8.5.2.0 software [67] in order to better model the micro-CHP systems. The boundaries of the system were expanded to consider the CO2-eq emissions of specific energy end-uses of the building (e.g., HVAC, DHW, appliances, and lighting energy uses) and specific EoL scenarios (e.g., demolition/deconstruction, waste processing, and disposal).
4.4.1. Product Stage A1–3 (Construction Materials Production)
The product stage includes carbon emissions derived from the production of building materials, including the extraction of their raw components (A1), the transportation of raw materials to the production site (A2), and the manufacturing process (A3). In this study, the CNB scenario is characterized by more sustainable wood-based materials for the main technological unit classes (load-bearing structure, vertical and horizontal envelope, and internal partitions), while the nZEB scenario has more traditional construction technologies, typically used in the Italian construction sector. Table A4 and Table A5, in the Annex, report the environmental impacts of each technological unit and the material considered in the analysis for the nZEB and CNB scenarios. The quantity of construction materials was estimated through project analysis and investigations.
4.4.2. Construction Stage A4–5 (Construction Materials Transportation and Installation)
The construction stage refers to the emissions related to the transportation of materials from the manufacturer to the construction site (A4), and those related to the installation of construction materials (A5). Factors that affect the emissions of this stage are the location of the construction site, the building size, and the type of energy used in the construction site [68].
Materials produced as close as possible to the construction site were selected for the A4 phases of both scenarios, and the distances from the manufacturer construction site to the building site were inserted in One Click LCA software. The CO2-eq emissions of stage A5 (construction materials installation) were, instead, calculated using the hypothesis included in One Click LCA software that considers a waste production of 5 kg/m2, an energy use equal to 25 kWh/m2, and a total use of diesel fuel equal to 3.5 L/m2, corresponding to 22.07 kgCO2-eq/m2 of the gross surface area of the building. Therefore, considering the same building with the same surfaces and footprint areas, the same environmental impacts were estimated between the two analyzed scenarios.
4.4.3. Use Stage B4–6 (Construction Materials Replacement and Energy Use)
The use phase accounts for most of the CO2-eq emissions in the lifecycle of buildings and generally reflects the building energy performance. The building location, occupation type, and energy source directly affect the energy consumption [68]. Associated to this stage, the replacement and the refurbishment works (B4–5) were considered in both the scenarios, according to the service life of each construction material, as declared in each EPD, and the impacts were calculated through One Click LCA software.
As far as the energy-use stage of the building (B6) is concerned, as already mentioned, the calculation of the environmental impacts was carried out through SimaPro 8.5.2.0 to better define the CO2-eq emissions due to the 9 micro-CHP fuel-cell systems (considered in the CNB scenario), able to produce 0.9 kWTH and 1.5 kWEL (thermal and electric) each, with an hourly natural gas consumption of 0.25 m3/h. To assess the environmental impacts due to the thermal and electric energy production by the CHP systems, a 2 kW CHP system process present within the SimaPro 8.5.2.0 software was considered and adapted to the case study. The process was modeled according to two different scenarios for the allocation of environmental impacts, based on the products and coproducts generated by the CHP system. The scenarios considered were based, in one case, on the exergetic allocation of impacts, which considers the two CHP products (electricity and thermal energy), and, in the other, on the allocation of impacts considering only the electricity as a product of the CHP [65].
The exergetic allocation produces 0.354 kgCO2-eq per each generated electric kWhEL, and 0.275 kgCO2-eq per each generated thermal kWhTH, while the second scenario (electricity allocation) produces 0.47 kgCO2-eq per each generated electric kWhEL, and null emissions to produce thermal energy. To assess the environmental impacts related to the electric energy supplied by the national grid and used on site, an emission factor equal to 0.414 kgCO2-eq/kWhEL [67,69] was used. Therefore, the CO2-eq emissions assessment of the B6 stage for the CNB scenario considered the emissions related to the natural gas consumption, i.e., the emissions related to the production of electric and thermal energy by CHP systems, and the emissions related to the remaining electric energy demand supplied by the national grid, used on site, and not compensated for through onsite RES. The nZEB scenario considers only the electric energy supplied by the national grid and not compensated through onsite RES.
4.4.4. End-of-Life Stage C1–C4 (Materials Disposal/Deconstruction)
The environmental impacts of stages C1–C4 (the disposal and deconstruction of the construction materials used in the building), were considered in both scenarios, as defined in the One Click LCA software, and as reported in Table 3.
4.4.5. Evaluation of Benefits and Loads beyond the System Boundary (Stage D)
Consistently, with a cradle-to-cradle approach, in the construction sector, the benefits and burdens of disposal after demolition can be considered with stage D, which is aimed at exploring the potential of reusing, recovering, and recycling the building and its components. The EN 15804+A1:2019 and EN 15978:2011 standards contain minimum indications on how to consider the stage D, related to construction materials after their disposal. This stage is to be considered optional [70] and, therefore, we decided not to include it in the calculation, waiting for advancement and agreement in the research.
4.4.6. Biogenic CO2
Products with a natural origin, such as wood, contain within them the so-called biogenic CO2, which is the quantity of CO2 transformed into biomass by the trees, up to the moment of their cutting and transformation into building products. This CO2 remains incorporated within the construction elements until their EoL, when it is finally partly, or totally, emitted into the atmosphere, according to the expected scenario (e.g., incineration with or without heat recovery, landfill disposal, reuse or recycling). There is, therefore, a considerable time difference between the biogenic CO2 sequestration and its release into the atmosphere. Whether, and how, to evaluate this emission lag is a topic strongly debated in the scientific literature [70,71,72,73], and three main approaches are used for the assessment of biogenic carbon (i.e., the −1/+1 approach, the 0/0 approach, and the dynamic approach of biogenic carbon calculation) [73]. The updated version of the EN 15804+A1:2019 reports this as an optional phase but, nevertheless, it suggests the −1/+1 approach whenever biogenic CO2 is considered. This implies that the uptake of biogenic CO2 during the forest growth is transferred to the building elements and reported as a negative emission in module A (−1 kgCO2-eq/kg CO2 of biogenic origin) and, subsequently, released in the EoL scenario of the building or, in case of recycling, transferred to another product system (+1 kgCO2eq/kg CO2 of biogenic origin) [45,73]. The dynamic approach for biogenic carbon calculation is reported in scientific papers only, while EPDs mainly follow the 0/0 approach [73]. Given the as-of-yet blurred and non-agreed-upon approach to the topic, we preferred to adopt a conservative attitude, not including biogenic CO2 in the A1–A3 stage.
5. Results
5.1. Energy Simulation Results
The first outcome of the described simulation process was the thermal energy need profile for heating and cooling, for both scenarios. These data have been used to calculate the overall electrical energy use, along with the natural gas one.
5.1.1. Heating and Cooling Energy Needs
Figure 7 shows the daily thermal energy needs calculated for the two scenarios, according to Section 4.3. It is possible to observe that the heating performance of the CNB is much better than the one of the nZEB, whereas the cooling performance is comparable. The adoption of the design strategies previously described leads to an annual thermal energy need reduction of approximately 31% from the nZEB to the CNB scenario.
The energy delivered by the generation system was obtained, adding to the thermal energy needs all the losses related to the distribution, control, and emission systems, through the efficiencies reported in Table A2. Finally, the outcome of this process led to the monthly electrical energy uses reported in Figure 8. Concerning the annual values, a total electrical energy use of 161.60 MWhEL and 89.52 MWhEL was calculated for the nZEB and the CNB, respectively, corresponding to a 44.6% reduction.
5.1.2. DHW Energy Use
The electrical energy use related to the production of DHW was calculated starting from the load curve reported in Figure 6. The hourly coefficients were then multiplied by the overall daily water need corresponding to the considered scenario. As far as the nZEB was concerned, a baseline of 33,228 L/day was set, corresponding to a hot water need of 130 L/day for each bed, with a contemporaneity factor of 0.9. This value was also used to calculate the corresponding quantity for the CNB; nevertheless, in order to reduce the water consumption and the corresponding energy use, in the CNB scenario, water mist nozzles were considered as water taps and showers in every room, allowing a reduction in the water requirement. Even though commercial products declare a reduction between 65% and 98%, a more conservative value of 30% was assumed in this work, leading to a daily overall water need of 23,260 L/day for the CNB. Once the DHW daily load profile was obtained for both scenarios, the corresponding annual curve was achieved considering the yearly occupancy profile for the whole building and, finally, the corresponding thermal energy need, with the assumption of a cold-water supply temperature of 10 °C, and a set-point temperature of 42 °C. For each scenario, the corresponding generation system was then considered to achieve the overall electrical energy and natural gas use, according to the technology involved. Moreover, the energy consumption related to circulation pumps was considered, with the weighting factor calculated as the ratio between the instantaneous and the daily maximum water need.
In the nZEB scenario, the electrical energy use related to hot water production comes from the electric heat pump (SCOP 2.8) and the circulation pump to the users (0.9 kW). In the CNB scenario, the base heat source to produce hot water consists of the 9 micro-CHP, with a total nominal thermal output of 8.1 kW, while the rest of the energy is provided by the GWHP (SCOP 4.3). Moreover, the circulation pumps were considered both for the CHPs and the users’ sides (0.6 kW and 0.9 kW, respectively). According to these data, the overall electrical energy needed to produce DHW in the nZEB was 196.12 MWhEL, whereas in the CNB, there was a combined consumption of electric energy and thermal energy (to run the CHPs), with annual total values of 80.46 MWhEL and 265.77 MWhTH (corresponding to an annual natural gas consumption of 19,710 m3).
5.1.3. Lights and Appliances
The electric energy use related to lights and appliances was based on the data reported in Table A3. These values lead to a total electric energy use of 28.66 MWhEL, which was considered for both scenarios.
5.1.4. Onsite Energy Production
Both scenarios rely on a PV plant to locally produce electric energy from renewable sources. For the nZEB, the regulation limit peak power of 17.8 kWp has been met, providing a useful production of 18.46 MWhEL/year. For the CNB, the PV consists of a grid of 72 horizontal panels able to produce 0.3 kWp each, corresponding to a total of 21.6 kWp, with a yearly useful production of 22.34 MWhEL/year, overcoming the minimum requirements of the nZEB. Because of the small geometrical footprint of the building, and the urban density determining the constant shading from other buildings, it is not economically feasible to increase the PV system dimensions above this limit.
For this reason, in order to increase the local energy production in the CNB scenario, the 9 CHPs previously presented were implemented. Each of them can produce 0.9 kWTH, used for domestic hot water production, as discussed above, and 1.5 kWEL each, with an hourly natural gas consumption of 0.25 m3/h. Therefore, the overall 19,710 m3 natural gas consumption previously mentioned allows for the production of 118.26 MWhEL/year.
5.1.5. Overall Energy Balance
All of the calculations previously discussed led to the overall electric energy use for both scenarios. In Figure 9, each electric energy and natural gas use considered is depicted, along with the local energy production (represented with negative values), and the overall nonrenewable primary energy need.
The annual electric energy use for all the services of the building is 386.4 MWhEL/year and 198.6 MWhEL/year for the nZEB and the CNB, respectively, while the natural gas consumption for the operation of the CHPs in the CNB scenario is equal to 210.7 MWh/year. The local energy production is 18.5 MWhEL/year and 140.6 MWhEL/year, corresponding to 4.8% and 70.8% of the total use. It is important to notice that, in both scenarios, the electrical energy uses related to lights and appliances are comparable to the local production through PV, due to the limited roof area available and the projected shadows typical of a congested urban context. This demonstrates that it is important to take this element of the energy balance into consideration when dealing with the operational phase of a building in urban environment. Moreover, in terms of primary energy, considering that the national average conversion factors are equal to 2.42 and 1.05 for electricity and natural gas, respectively [49], along with a conversion rate of 10.6 kWh/m3 for the latter, the overall nonrenewable primary energy for the nZEB is 890.4 MWhPR/year, while for the CNB, it is 361.7 MWhPR/year (140.5 MWhPR/year from electricity use and 221.2 MWhPR/year from gas). This means that the design process that led to the CNB scenario allowed for a reduction in the primary energy of about 59%, compared to the nZEB scenario (Table 4).
5.2. Environmental Impacts Results
The environmental impacts were calculated according to the approach and hypothesis described in Section 4.4, through One Click LCA and SimaPro software, and according to the standardized methodology developed for construction products and defined by EN 15978.
5.2.1. Operational Energy Use Stage B6 Environmental Impacts
As shown in Table 4, in the CNB scenario, the electric energy supplied by the power grid is equal to 58.05 MWhEL/year, or 2902.5 MWhEL during the entire life of the building (50 years). In terms of the CO2-eq emissions, a factor equal to 0.414 tonCO2-eq/MWhEL [67,69] was used. Therefore, the environmental impacts due to the electric energy use are equal to 1201.6 tonCO2-eq. In this scenario, in addition to the emissions related to the electricity supplied by the national grid, CO2-eq emissions due to the natural gas consumption for the operation of the micro-CHP systems should be considered. Adopting the value reported in Table 4 for electricity and natural gas, and the two allocation scenarios described in Section 4.4.3, the total tonCO2-eq emitted during the entire life of the building were calculated and are presented in Table 5. To assess the CHP impacts on the production of electric and thermal energy, the emission factors presented in Section 4.4 were used according to the exergetic (1), and electricity allocation (2), scenarios. The latter is the worst and the more conservative scenario; for this reason, a total environmental impact of the use phase (B6), equal to 3980.7 tonCO2-eq 50 years, was considered for the CNB scenario.
Concerning the nZEB scenario, as shown in Table 4, the onsite production of electric energy is equal to 18.5 MWh/year, and the electric energy use is 367.9 MWh/year. Therefore, considering the same emission factor for electric energy supplied as in the CNB scenario (0.414 tonCO2-eq/MWhEL), and a service life of the building of 50 years, the environmental impact of the use phase in the nZEB scenario is equal to 7615.9 tonCO2-eq 50 years.
5.2.2. Whole-Building Lifecycle Environmental Impacts
According to the hypotheses and the calculations described so far, the environmental impacts of both scenarios are presented in Table 6. The CNB demonstrates its capability to reduce overall CO2-eq emissions by 55%, compared to the nZEB scenario. The use phase of the building (B6) has the highest impact in terms of emissions in both scenarios, accounting for 79% of the total emissions in the CNB scenario, and for 68% of the total emissions in the nZEB scenario. The second most impactful phase is the one related to the production of construction materials (A1–A3), which accounts for 14% of the total emissions in the CNB scenario, and for 26% of the total emissions in the nZEB scenario. Details about this phase are reported in Table 7. The remaining life cycle phases, i.e., transportation, construction and installation, replacement, and disposal of material, have an overall impact of 7% in the CNB scenario, and 6% in the nZEB scenario.
5.2.3. Carbon Offset
Although extremely performing, the CNB still reports emissions equal to 5016.2 tonCO2-eq along its service life. Since the building performance may not be further improved to pursue the carbon-neutral target, a carbon offset strategy needs to be established. An effective way to compensate for emissions is via local actions, visible to the citizenship and producing local advantages [74]. To this purpose, an area of 9850 m2 adjacent to the building has been identified, and a project of requalification has been proposed. The area is currently a boulevard made of two roadways for cars and a central parking lot. The new project considers a redesign of the local mobility, reducing the section of the roadways, imposing low-velocity limits, installing pervious paving, and limiting the parking area. The intervention includes a green area of about 2400 m2, with about 90 new trees selected among indigenous species, with limited need for watering, and a high-carbon capture capability. Calculations, run with i-Tree Eco v6 software [75], report that, in 30 years of development, the 90 trees will be able to locally capture about 300.4 tonCO2-eq and, moreover, they will provide collateral benefits, such as outdoor air quality and thermal comfort improvement, and other ecosystem services.
Because of the limited space, a whole local carbon offset is not feasible (to do so, about 1400 additional trees would be required). Thus, the remaining 4715.8 tonCO2-eq emissions may only be offset via the acquisition of voluntary carbon founds on the carbon market, and the provision of energy supply contracts with guaranteed renewable origins.
6. Discussions and Conclusions
The case study reported in this paper showed that, in order to deliver a carbon-neutral building compliant with a methodologically sound definition, as the one proposed in Section 3, a massive performance improvement is necessary when typical urban conditions are considered, both in terms of operational and embodied emissions. The nZEB objective, as defined in recent years in Italy, and in a large part of the EU [76,77], is far from what is required to deliver a CNB (the case study shows a reduction of 59% in terms of primary energy, compared to the nZEB threshold). Moreover, a reduction in the operational energy is not sufficient to reach carbon neutrality, but a parallel effort should be made in the selection of materials that feature the best performance in the overall life cycle, including, therefore, construction, installation, and disposal (the case study is characterized by a reduction of 75% in terms of emissions related to construction, of 46% in terms of transport, of 64% in terms of replacement, and of 30% in terms of disposal/deconstruction). This means not only substantially changing the normal practice for design offices (architecture and engineering firms), but also for the construction industry, that appears to be unprepared for this change, since it is still often struggling with the requirements of the nZEB wave [78].
The final performance of real buildings depends, further, on: (i) Occupant behavior and systems management and; (ii) Construction site management (the quality of the construction phase). Both of these aspects are not under the control of the designer and cannot be easily modeled; thus, carbon neutrality might require even more effort than so far reported. All of this may have direct economic consequences, i.e., a CNB may require, at least in the initial market phase, more capital investments than an nZEB. The major costs may include: (i) The design; (ii) The materials; (iii) The construction site. Economic savings might be reached in the operational phase if the building is properly operated, monitored, and maintained. Thus, in order to enable a market uptake of CNBs, it is necessary to include (and make mandatory) the environmental costs in the overall economic evaluation of a project. This requires a new methodology and a brand-new vision for the construction market.
The case study also shows that carbon neutrality can be a difficult goal to achieve by a building, depending on its characteristics (i.e., geometry, destination, location), and, in some cases (typically urban buildings), it can only be reached through a careful carbon offset plan, which either requires additional economic commitments (i.e., the acquisition of voluntary carbon founds on the carbon market, and the provision of energy supply contracts with guaranteed renewable origins), or space (and money) to deliver a vegetation project. Moreover, in many cases, such as the one investigated in this work, urban lots might be too small to provide space for vegetation to completely offset the building’s emissions, or a large enough exposed area to install renewable energy generation systems to cover the overall building energy use [1]. A possible solution could see the involvement of municipalities (or regions) to find the spaces dedicated to carbon offset, through the definition of a vegetation plan as part of the city land use and development plan, along with actions to coordinate the private funding to enable it. The Municipality of Milan opened, indeed, a found of investments to support the forestation project of the city [79], and this is a promising approach to challenge carbon neutrality at the city level while achieving other goals at the same time (e.g., heat island mitigation, particulate pollution mitigation, etc.).
Buildings could more easily reach the carbon-neutral objective when large lots at the city boundaries are used, where a lot of vegetation may be planted. However, this approach may be risky. Dislocating office and retail buildings, as well as homes (i.e., promoting the urban sprawling), may indeed increase emissions due to transport, whereas a major benefit might be obtained by having buildings close to each other, so that people’s movements in the city may be limited, preferably along pedestrian and cycling paths or with the use of public mobility. A real carbon neutrality approach cannot be limited to buildings, but it should also include the city transportation plan.
This paper also highlights some major methodological gaps existing in the calculation procedure for CNB. The most relevant flaw is the lack of a shared definition of what a CNB is, and what emissions should be considered (referring only to the operational phase may be misleading). If a common carbon-neutral objective is to be achieved, cities and nations should agree on what this objective is, and how to assess it. Otherwise, each one will reach its own carbon neutrality. This paper provides a possible operative definition for carbon neutrality associated with a clear methodological approach.
Standards do exist, and they are continuously being upgraded; however, a lot of work is still required to assess the emissions from products and materials (e.g., paints, carpets, etc.) during the normal operation of the building, the emissions of all ordinary maintenance activities (e.g., cleaning), and of the repair of the relevant building components, before the end of their service life. Biogenic CO2, and the ways to account for it, should also be further studied in order to reach a consensus on the methodology (0/0 approach, −1/+1 approach, dynamic approach) to be used for its assessment and integration within a whole-building LCA.
Author Contributions
Conceptualization, F.C.; methodology, F.C.; software, F.C., A.T. and A.A.; formal analysis, F.C., A.T. and A.A.; resources, F.C.; writing—original draft preparation, F.C., A.T. and A.A.; writing—review and editing, F.C., A.T. and A.A.; project administration, F.C.; funding acquisition, F.C. All authors have read and agreed to the published version of the manuscript.
Funding
This research was funded by Rete fra Imprese B.Smart.
Acknowledgments
We wish to acknowledge Eng. Stefano Rondo of TECNEAS Integrated Building Design, Arch. Ambrogio Risari, Arch. Emanuela Cidri, Arch. Giulia Pannella, Arch. Lapo Soldano for the design process, and Eng. Jacopo Famiglietti for the support on CHP analysis.
Conflicts of Interest
The authors declare no conflict of interest.
Appendix A
The simulations aimed at calculating the operational energy used were performed on a building numerical model divided into 23 thermal zones. Their sizes and features are summarized in Table A1. The resulting thermal energy needs were then manipulated in order to take into account the energy losses due to distribution, control and, emissions, according to the national technical standards [63,64], through the efficiencies reported in Table A2. Finally, the electrical energy needs related to lights and appliances were calculated on the basis of the assumptions described in Table A3.

Table A1.
Characterization of the thermal zones in the numerical model of the project and the BAU scenario, in terms of gross floor surface (Sgross), gross internal volume (Vgross), overall internal gain contributions, ventilation technology, and emission system.
Table A1.
Characterization of the thermal zones in the numerical model of the project and the BAU scenario, in terms of gross floor surface (Sgross), gross internal volume (Vgross), overall internal gain contributions, ventilation technology, and emission system.
| Storey | Thermal Zone | Sgross [m2] | Vgross [m3] | Internal Gains/Loads | Ventilation | Heating/Cooling Supply |
|---|---|---|---|---|---|---|
| Basement | Bar | 211 | 611 | 120+ people, lights, appliances | AHU | supply air |
| Stairs/Corridors | 76 | 222 | lights | AHU | supply air | |
| Sleeping Rooms | 125 | 363 | 24+ people | AHU 1/BW 2 | fan coil | |
| Ground floor | Reception | 178 | 515 | 120+ people, lights, PCs | AHU | supply air |
| Stairs/Corridors | 93 | 270 | lights | AHU | supply air | |
| Sleeping Rooms | 93 | 271 | 18+ people, lights | AHU 1/BW 2 | fan coil | |
| First | Stairs/Corridors | 59 | 171 | lights | AHU | supply air |
| Sleeping Rooms | 203 | 588 | 34+ people, lights | AHU 1/BW 2 | fan coil | |
| Second | Stairs/Corridors | 59 | 171 | lights | AHU | supply air |
| Sleeping Rooms | 203 | 588 | 34+ people, lights | AHU 1/BW 2 | fan coil | |
| Third | Stairs/Corridors | 59 | 171 | lights | AHU | supply air |
| Sleeping Rooms | 203 | 588 | 34+ people, lights | AHU 1/BW 2 | fan coil | |
| Fourth | Stairs/Corridors | 59 | 171 | lights | AHU | supply air |
| Sleeping Rooms | 203 | 588 | 34+ people, lights | AHU 1/BW 2 | fan coil | |
| Fifth | Stairs/Corridors | 59 | 171 | lights | AHU | supply air |
| Sleeping Rooms | 203 | 588 | 34+ people, lights | AHU 1/BW 2 | fan coil | |
| Sixth | Stairs/Corridors | 59 | 171 | lights | AHU | supply air |
| Sleeping Rooms | 203 | 588 | 34+ people, lights | AHU 1/BW 2 | fan coil | |
| Seventh | Stairs/Corridors | 59 | 171 | lights | AHU | supply air |
| Sleeping Rooms | 203 | 588 | 34+ people, lights | AHU 1/BW 2 | fan coil | |
| Penthouse | Stairs/Corridors | 33 | 95 | lights | AHU | supply air |
| Flat | 118 | 343 | 4+ people, lights | AHU 1/BW 2 | rad. pan. | |
| Kitchen | 17 | 48 | appliances, lights | BW 2/hood | rad. pan. | |
| Total | 2778 | 8051 |
1 only in the nZEB scenario, 2 only in the CNB scenario.
Table A2.
Efficiencies of the distribution, control, and emission subsystems used for both scenarios investigated.
Table A2.
Efficiencies of the distribution, control, and emission subsystems used for both scenarios investigated.
| nZEB | CNB | |||||
|---|---|---|---|---|---|---|
| Common Spaces | Bedrooms | Penthouse | Common Spaces | Bedrooms | Penthouse | |
| HEATING SEASON | ||||||
| distribution | 0.993 | 0.993 | 0.995 | 0.993 | 0.993 | 0.995 |
| control | 0.960 | 0.950 | 0.950 | 0.995 | 0.995 | 0.990 |
| emission | 0.950 | 0.980 | 0.980 | 0.970 | 0.960 | 0.990 |
| COOLING SEASON | ||||||
| distribution | 0.980 | 0.990 | 0.990 | 0.980 | 0.990 | 0.990 |
| control | 0.950 | 0.950 | 0.950 | 0.995 | 0.995 | 0.990 |
| emission | 0.970 | 0.970 | 0.970 | 0.970 | 0.980 | 0.970 |
Table A3.
Data and parameters for electrical appliances energy needs.
| Use | Specific Absorption | Daily Working Time | Total per Year |
|---|---|---|---|
| sleeping rooms | |||
| lighting (3 lights per room) | 50 W | 3 h/day | 55 kWhEL/room |
| small devices (smartphones, PCs, etc.) | 125 W | 2 h/day | 91 kWhEL/room |
| vacuum cleaner | 1800 W | 0.2 h/day | 131 kWhEL/room |
| total per room | 277 kWhEL/room | ||
| total (73% occupancy rate) | 14.43 MWhEL | ||
| common spaces | |||
| lighting (corridors—5 lights per floor) | 14 W | 2.52 h/day | 450 kWhEL |
| lighting (ground floor entrance—60 lights) | 14 W | 8 h/day | 2453 kWhEL |
| lighting (underground floor entrance—60 lights) | 14 W | 8 h/day | 2453 kWhEL |
| lighting (various rooms—40 lights) | 14 W | 8 h/day | 1635 kWhEL |
| lights (stairs—2 lights per floor) | 36 W | 2.52 h/day | 463 kWhEL |
| vacuum cleaner (common spaces) | 1800 W | 2.5 h/day (working days) 3 h/day (weekends) 3 h/day (vacations) | 1762 kWhEL |
| vacuum cleaner (corridors) | 1800 W | 2.5 h/day (working days) 3 h/day (weekends) 3 h/day (vacations) | 1762 kWhEL |
| elevators | 4000 W | 2 h/day (working days) 2.5 h/day (weekends) 3 h/day (vacations) | 3262 kWhEL |
| total | 14.24 MWhEL | ||
With regard to the environmental impacts analysis, the following tables report details on the environmental impacts of each technological unit and the material considered in the analysis for the nZEB and CNB scenarios.
Table A4.
Material construction phase impacts (A1–A3) for the nZEB scenario.
| Technological Unit Classes | Technological Unit | Technical Element Details/Materials | Quantity [ton] | Stage A1–A3 [tonCO2-eq] |
|---|---|---|---|---|
| Load-bearing structure | Foundations, beams, pillars | Cement, sand, and aggregates | 294.0 | 45.4 |
| Steel reinforcements | 12.6 | 17.9 | ||
| Slabs and walls | Cement, sand, and aggregates | 9430.0 | 1640.0 | |
| Steel reinforcements | 467.0 | 665.0 | ||
| Steel beams | Steel | 52.6 | 61.1 | |
| Vertical envelope | Vertical façade | Interior/exterior finishes (painting and plaster) | 84.3 | 15.4 |
| Rock wool/EPS insulation and vapor barrier | 16.3 | 18.2 | ||
| Brick blocks | 106.0 | 39.1 | ||
| Plasterboard sheets and metal substructure | 15.6 | 3.9 | ||
| Transparent façade | Double glazed façade windows/doors and aluminum frames | 8.4 | 25.8 | |
| Horizontal envelope | Attic terrace, top floor roof | Exterior finishes (outdoor tile paving, gravel, waterproofing membranes, and vapor barrier) | 16.6 | 5.0 |
| EPS Insulation | 1.0 | 9.0 | ||
| Plasterboard sheets | 3.8 | 0.5 | ||
| Screeds | 5.7 | 0.9 | ||
| Interior finishes (painting) | 0.1 | 0.0 | ||
| Ground floor slab and external paving | Finishes (internal and external paving, membranes) | 23.9 | 35.8 | |
| Screeds | 28.0 | 3.5 | ||
| EPS Insulation | 1.4 | 8.1 | ||
| Internal partitions | Vertical internal partitions | Interior finishes (painting, tiles) | 22.1 | 13.9 |
| Plasterboard sheets and metal substructure | 45.9 | 12.2 | ||
| Insulation (rock wool) | 14.3 | 7.9 | ||
| Interior doors | Interior doors and fire-resistant doors | 6.3 | 26.7 | |
| Horizontal internal partitions | Interior finishes (painting, plaster, paving) | 81.2 | 161.0 | |
| Screeds | 125.0 | 2.0 | ||
| Insulation | 8.7 | 1.5 | ||
| Systems | Lifts | Lifts | 1.0 | 4.3 |
| Heat and energy generators and circulators | Heat pumps, photovoltaic panels, pipes, circulators, thermal storage thank | 23.2 | 86.3 |
Table A5.
Material construction phase impacts (A1–A3) for the CNB scenario.
| Technological Unit Classes | Technological Unit | Technical Element Details/Materials | Quantity [ton] | Stage A1–A3 [tonCO2-eq] |
|---|---|---|---|---|
| Load-bearing structure | Foundations, beams, pillars | Cement, sand, and aggregates | 202.0 | 15.7 |
| Steel reinforcements | 3.7 | 2.6 | ||
| Slabs and walls | Cement, sand, and aggregates | 2.4 | 321.0 | |
| Steel reinforcements | 163.0 | 111.0 | ||
| Steel beams | Steel | 32.2 | 47.1 | |
| Wooden elements | CLT and structural wood materials | 341.0 | 63.9 | |
| Vertical envelope | Breathing wall and vertical façade | Interior and exterior finishes (painting) | 0.3 | 0.3 |
| Façade panel in wood fibres | 2.9 | 0.4 | ||
| OSB panels and plasterboard slabs | 40.5 | 3.3 | ||
| Insulation (rock wool and wood-based) | 13.9 | 6.3 | ||
| Other (wooden substructure, vapor barrier, bedding mortar, etc.) | 35.1 | 11.6 | ||
| Transparent vertical façade | Double-glazed façade windows/doors and wooden frames | 14.1 | 20.6 | |
| Horizontal envelope | Green roof, attic terrace, top-floor roof | Exterior finishes (wood paving, green roof, gravel, waterproofing membranes and vapor barrier) | 5.4 | 2.7 |
| Insulation (wood-based) | 2.9 | 0.5 | ||
| Plasterboard slabs | 5.9 | 0.4 | ||
| Dry screeds | 1.8 | 0.4 | ||
| Interior finishes (paint and paving) | 2.3 | 1.3 | ||
| Ground-floor slab and external paving | Finishes (internal and external paving) | 0.2 | 0.5 | |
| Dry screeds | 9.6 | 1.9 | ||
| Insulation (wood-based) | 2.8 | 0.1 | ||
| Internal partitions | Vertical internal partitions | Interior finishes (painting, tiles) | 17.5 | 9.8 |
| Interior-treated wooden slabs + wooden substructure | 42.2 | 5.9 | ||
| Insulation (wood-based) | 9.2 | 1.6 | ||
| Interior doors | Interior doors and fire-resistant doors | 4.4 | 4.6 | |
| Horizontal internal partitions | Interior finishes (painting) | 10.3 | 6.0 | |
| Dry screeds | 38.5 | 7.8 | ||
| Insulation (wood-based) | 11.3 | 2.0 | ||
| Plasterboard slabs | 28.4 | 1.9 | ||
| Systems/plants | Lifts | Lifts | 1.4 | 4.3 |
| Heat and energy generators and circulators | Heat pumps, CHP system, circulator pumps, pipes, photovoltaic panels, thermal storage tank | 16.5 | 71.4 |
References
- Becqué, R.; Weyl, D.; Stewart, E.; Mackres, E.; Jin, L.; Shen, X. Working Paper Accelerating Building Decarbonization: Eight Attainable Policy Pathways to Net Zero Carbon Buildings for All; World Resources Institute: Washington, DC, USA, 2019. [Google Scholar]
- WRI Ross Center RELEASE: Zero Carbon Buildings for All Initiative Launched at UN Climate Action Summit. Available online: http://wrirosscities.org/news/release-zero-carbon-buildings-all-initiative-launched-un-climate-action-summit (accessed on 16 January 2019).
- Global Alliance for Buildings and Construction; International Energy Agency (IEA). United Nations Environment Programme 2019 Global Status Report for Buildings and Construction. Towards a Zero-Emissions, Efficient and Resilient Buildings and Construction Sector; United Nations Environment Programme: Nairobi, Kenya, 2019. [Google Scholar]
- Architecture 2030. Why the Building Sector? Available online: https://architecture2030.org/buildings_problem_why/ (accessed on 10 January 2020).
- Pan, W. Zero Carbon Buildings: Contexts, Challenges and Strategies. Build. J. 2013, 71–73. Available online: http://www.building.hk/forum/2013_0131zcb.pdf (accessed on 1 October 2021).
- European Commission. A Roadmap for Moving to a Competitive Low Carbon Economy in 2050; European Commission: Brussels, Belgium, 2011.
- European Parliamen. What Is Carbon Neutrality and How Can It Be Achieved by 2050? Available online: https://www.europarl.europa.eu/news/en/headlines/society/20190926STO62270/what-is-carbon-neutrality-and-how-can-it-be-achieved-by-2050 (accessed on 14 January 2019).
- United Nations. The Paris Agreement; United Nations: New York, NY, USA, 2015. [Google Scholar]
- European Commission. Going climate-neutral by 2050. In A Strategic Long-Term Vision for a Prosperous, Modern, Competitive and Climate-Neutral EU Economy; European Commission: Brussels, Belgium, 2019. [Google Scholar]
- Elioth Consortium; Egis Conseil; Quattrolibri; Mana. Paris, an Air of Change; Elioth Consortium: Paris, France, 2017. [Google Scholar]
- C40 Networks. 19 Global Cities Commit to Make New Buildings “Net-Zero Carbon” by 2030. Available online: https://www.c40.org/press_releases/global-cities-commit-to-make-new-buildings-net-zero-carbon-by-2030 (accessed on 10 April 2020).
- WorldGBC. The Net Zero Carbon Buildings Commitment. Available online: https://www.worldgbc.org/thecommitment (accessed on 10 April 2020).
- Zhao, X.; Pan, W. Delivering Zero Carbon Buildings: The Role of Innovative Business Models. Procedia Eng. 2015, 118, 404–411. [Google Scholar] [CrossRef] [Green Version]
- Hong Kong Construction Industry Council. The first zero carbon building opens in Hong Kong. Build. J. 2012, 1, 30–47. [Google Scholar]
- Hong Kong Construction Industry Council. The making of the ZCB. Zero Carbon Build. J. 2014, 1, 74. [Google Scholar]
- Zuo, J.; Read, B.; Pullen, S.; Shi, Q. Carbon-neutral commercial building development. J. Manag. Eng. 2013, 29, 95–102. [Google Scholar] [CrossRef]
- EllisDon Corporation. The Journey to Net Zero Energy. A Lessons Learned Report; The Joyce Centre for Partnership & Innovation: Hamilton, ON, Canada, 2018. [Google Scholar]
- C40 Cities. Climate Leadership Group Reinventing Cities. Available online: https://www.c40reinventingcities.org/ (accessed on 19 January 2020).
- Reardon, C. Australian Department of the Environment and Energy Carbon zero, carbon positive. In Your Home: Australia’s Guide to Environmentally Sustainable Homes; Your home: Technical manual; Commonwealth of Australia (Department of Industry): Canberra, ACT, Australia, 2013; pp. 448–454. [Google Scholar]
- SBSE. The Carbon Neutral Design Project: What is Carbon Neutral Design? Available online: http://www.tboake.com/carbon-aia/carbon_definition.html (accessed on 15 January 2020).
- The Society of Building Science Educators (SBSE); American Institute of Architects (AIA). Carbon Neutral Affordable Housing: A Guidebook for Providers, Designers and Students of Affordable Housing. 2012. Available online: https://www.tboake.com/carbon-aia/pdf/CND%20Affordable%20Housing%20Guide-sm.pdf (accessed on 1 October 2021).
- Pan, W.; Ning, Y. Delivering zero carbon buildings: The status quo and way forward. Zero Carbon Build. J. 2014, 1, 7–14. [Google Scholar]
- DCLG. Building a Greener Future: Policy Statement; Department for Communities and Local Government: London, UK, 2007.
- DECC. Guidance on Carbon Neutrality; Department of Energy and Climate Change: London, UK, 2009.
- Carruthers, H.; Casavant, T. What is a “Carbon Neutral” Building? Sustain. Build. Cent. 2013, 1–6. Available online: http://www3.cec.org/islandora-gb/islandora/object/islandora:1112/datastream/OBJ-EN/view (accessed on 1 October 2021).
- Satola, D.; Balouktsi, M.; Lützkendorf, T.; Wiberg, A.H.; Gustavsen, A. How to define (net) zero greenhouse gas emissions buildings: The results of an international survey as part of IEA EBC annex 72. Build. Environ. 2021, 192, 107619. [Google Scholar] [CrossRef]
- Lützkendorf, T.; Frischknecht, R. (Net-) zero-emission buildings: A typology of terms and definitions. Build. Cities 2020, 1, 662–675. [Google Scholar] [CrossRef]
- Crawley, D.; Pless, S.; Torcellini, P. Getting to Net Zero. ASHRAE J. 2009, 51, 18–25. [Google Scholar]
- Department for Communities and Local Government (DCLG). Definition of Zero Carbon Homes and Non Domestic Buildings; Department for Communities and Local Government: London, UK, 2008.
- Zero Carbon Hub. Zero Carbon Homes and Nearly Zero Energy Buildings. UK Building Regulations and EU Directives; Zero Carbon Hub: London, UK, 2014. [Google Scholar]
- Riedy, C.; Lederwasch, A.; Ison, N. Defining Zero Emission Buildings—Review and Recommendations: Final Report; The Australian Sustainable Built Environment Council (ASBEC): Sydney, Australia, 2011. [Google Scholar]
- Light House Sustainable Building Centre Society; Intep; The BTY Group. Towards Carbon Neutral Buildings in BC. Framework for High-Rise Multi-Unit Residential Buildings; Light House Sustainable Building Centre Society: Vancouver, BC, Canada, 2012; pp. 1–62. [Google Scholar]
- Reardon, C. Department of Industry Your Home: Australia’s Guide to Environmentally Sustainable Homes, 5th ed.; Your Home: Technical Manual; Commonwealth of Australia (Department of Industry): Canberra, ACT, Australia, 2013; ISBN1 9781925006148. ISBN2 192500614X. [Google Scholar]
- Pipkorn, J.; Reardon, C. Carbon Zero, Carbon Positive. Available online: https://www.yourhome.gov.au/housing/carbon-zero-carbon-positive (accessed on 12 December 2019).
- Architecture 2030. Roadmap to Zero Emissions; Architecture 2030: Santa Fe, NM, USA, 2014. [Google Scholar]
- Selamawit, F.; Schlanbudch, R.; Sørnes, K.; Inman, M.; Andresen, I. A Norwegian ZEB Definition Guideline; The Zero Emission Building Research Centre: Trondheim, Norway, 2016. [Google Scholar]
- Green Building Council South Africa (GBCSA). Net Zero/Net Positive Certification Scheme—Technical Manual v1.0; GBCSA: Cape Town, South Africa, 2019. [Google Scholar]
- Architecture 2030. ZERO Code; Architecture 2030: Santa Fe, NM, USA, 2018. [Google Scholar]
- UKGBC. Net Zero Carbon Buildings: A Framework Definition; UK Green Building Council: London, UK, 2019. [Google Scholar]
- Climate Active. The Climate Active Carbon Neutral Standard for Buildings; The Climate Active Carbon Neutral Standard for Organisations: Commonwealth of Australia; 2020. Available online: https://www.industry.gov.au/sites/default/files/2020-07/climate-active-carbon-neutral-standard-buildings.pdf (accessed on 1 October 2021).
- U.S. Green Building Council (USGBC). LEED Zero Program Guide; USGBC: Washington, DC, USA, 2020. [Google Scholar]
- Canada Green Building Council (CaGBC). Zero Carbon Building—Design Standard Version 2; CaGBC: Ottawa, ON, Canada, 2021. [Google Scholar]
- International Organization for Standardization ISO 14040:2006. Environmental Management—Life Cycle Assessment—Principles and Framework; ISO: Geneva, Switzerland, 2006. [Google Scholar]
- International Organization for Standardization ISO 14044:2006. Environmental Management—Life Cycle Assessment—Requirements and Guidelines; ISO: Geneva, Switzerland, 2006. [Google Scholar]
- European Committee for Standardization (CEN) EN 15804+A1:2019. Sustainability of Construction Works—Environmental Product Declarations—Core Rules for the Product Category of Construction Products; European Committee for Standardization: Brussels, Belgium, 2019.
- European Committee for Standardization (CEN) EN 15978:2011. Sustainability of Construction Works—Assessment of Environmental Performance of Buildings—Calculation Method; European Committee for Standardization: Brussels, Belgium, 2011.
- ISO (International Organization for Standardization) ISO 52000-1:2017. Energy Performance of Buildings—Overarching EPB Assessment—Part 1: General Framework and Procedures; ISO: Geneva, Switzerland, 2017. [Google Scholar]
- Ministero dello Sviluppo Economico (MISE). Legge n. 90 del 03/08/2013. Disposizioni Urgenti per il Recepimento della Direttiva 2010/31/UE del Parlamento Europeo e del Consiglio del 19 Maggio 2010, Sulla Prestazione Energetica Nell’edilizia per la Definizione delle Procedure D’infrazione. Gazzetta Ufficiale n. 181 del 3 agosto 2013. 2013. Available online: https://www.gazzettaufficiale.it/eli/id/2013/08/03/13G00133/sg (accessed on 16 March 2021).
- Ministero dello Sviluppo Economico (MISE). Decreto interministeriale 26 Giugno 2015—Applicazione delle Metodologie di Calcolo delle Prestazioni Energetiche e Definizione delle Prescrizioni e dei Requisiti Minimi Degli Edifici; MISE: Rome, Italy, 2015. Available online: https://www.mise.gov.it/images/stories/normativa/DM_requisiti_minimi.pdf (accessed on 19 March 2021).
- Direzione Generale Ambiente Energia e Sviluppo Sostenibile. Decreto n. 2456 del 8 Marzo 2017—Integrazione delle Disposizioni per L’efficienza Energetica degli Edifici Approvate con Decreto n. 176 del 12 Gennaio 2017 e Riapprovazione Complessiva delle Disposizioni Relative All’efficienza Energetica Degli Edifici. Regione Lombardia. 2017. Available online: https://geometri.mi.it/wp-content/uploads/2020/09/decreto_regione_lombardia176_2017-ape.pdf (accessed on 25 January 2021).
- Klein, S.A.; Beckman, W.A.; Mitchell, J.W.; Duffie, J.A.; Freeman, T.A. TRNSYS 17—A TRaNsient SYstem Simulation Program—Documentation; Solar Energy Laboratory: Madison, WI, USA, 2014. [Google Scholar]
- Alongi, A.; Angelotti, A.; Mazzarella, L. Experimental validation of a steady periodic analytical model for Breathing Walls. Build. Environ. 2020, 168, 106509. [Google Scholar] [CrossRef] [Green Version]
- Alongi, A.; Angelotti, A.; Mazzarella, L. Measuring a Breathing Wall’s effectiveness and dynamic behaviour. Indoor Built Environ. 2020, 29, 783–792. [Google Scholar] [CrossRef]
- Alongi, A.; Angelotti, A.; Mazzarella, L. Experimental validation of a finite difference algorithm to simulate Breathing Wall components. In Proceedings of the Building Simulation 2019, Rome, Italy, 2–4 September 2019. in press. [Google Scholar]
- Alongi, A.; Angelotti, A.; Mazzarella, L. Experimental investigation of the steady state behaviour of Breathing Walls by means of a novel laboratory apparatus. Build. Environ. 2017, 123, 415–426. [Google Scholar] [CrossRef] [Green Version]
- Alongi, A.; Angelotti, A.; Mazzarella, L. Analytical modelling of Breathing Walls: Experimental verification by means of the Dual Air Vented Thermal Box lab facility. Energy Procedia 2017, 140, 36–47. [Google Scholar] [CrossRef] [Green Version]
- Smith, P.; Imbabi, M. A Clean Technology to Combat Climate Change—Dynamic Breathing Building. In Proceedings of the Cleantech Forum XVII, The Cleantech Network, Brussels, Belgium, 28 April 2008. [Google Scholar]
- Taylor, B.J.; Cawthorne, D.A.; Imbabi, M.S. Analytical investigation of the steady-state behaviour of dynamic and diffusive building envelopes. Build. Environ. 1996, 31, 519–525. [Google Scholar] [CrossRef]
- Imbabi, M.S.-E. Modular breathing panels for energy efficient, healthy building construction. Renew. Energy 2006, 31, 729–738. [Google Scholar] [CrossRef]
- Erba, S.; Causone, F.; Armani, R. The effect of weather datasets on building energy simulation outputs. Energy Procedia 2017, 134, 545–554. [Google Scholar] [CrossRef]
- U.S. Department of Energy’s (DOE); Building Technologies Office (BTO); National Renewable Energy Laboratory (NREL); EnergyPlus. Weather Data by Location. Available online: https://energyplus.net/weather-location/europe_wmo_region_6/ITA//ITA_Milano-Linate.160800_IGDG (accessed on 23 July 2021).
- Alongi, A.; Angelotti, A.; Mazzarella, L. A numerical model to simulate the dynamic performance of Breathing Walls. J. Build. Perform. Simul. 2021, 14, 155–180. [Google Scholar] [CrossRef]
- Ente Italiano di Unificazione UNI/TS 11300-2. Energy Performance of Buildings. Part 2: Evaluation of Primary Energy Need and of System Efficiencies for Space Heating, Domestic Hot Water Production, Ventilation and Lighting for Non-Residential Buildings; UNI: Milan, Italy, 2014. [Google Scholar]
- Ente Italiano di Unificazione UNI/TS 11300-3. Energy Performance of Buildings. Part 3: Evaluation of Primary Energy and System Efficiencies for Space Cooling; UNI: Milan, Italy, 2010. [Google Scholar]
- Wernet, G.; Bauer, C.; Steubing, B.; Reinhard, J.; Moreno-Ruiz, E.; Weidema, B. The ecoinvent database version 3 (part I): Overview and methodology. Int. J. Life Cycle Assess. 2016, 21, 1218–1230. [Google Scholar] [CrossRef]
- Bionova Ltd. OneClick LCA Website. Available online: https://www.oneclicklca.com/ (accessed on 28 July 2021).
- PRé Sustainability B.V., SimaPro 8.5.2.0. 2018. Available online: https://simapro.com/about/ (accessed on 28 July 2021).
- Fenner, A.E.; Kibert, C.J.; Woo, J.; Morque, S.; Razkenari, M.; Hakim, H.; Lu, X. The carbon footprint of buildings: A review of methodologies and applications. Renew. Sustain. Energy Rev. 2018, 94, 1142–1152. [Google Scholar] [CrossRef]
- IPCC (Intergovernmental Panel on Climate Change). 2006 IPCC Guidelines for National Greenhouse Gas Inventories; Global Environmental Strategies (IGES): Hayama, Japan, 2006. [Google Scholar]
- Miller, T.R.; Gregory, J.; Kirchain, R. Critical Issues When Comparing Whole Building & Building Product Environmental Performance; Concrete Sustainability Hub: Cambridge, MA, USA, 2016. [Google Scholar]
- Wiloso, E.I.; Heijungs, R.; Huppes, G.; Fang, K. Effect of biogenic carbon inventory on the life cycle assessment of bioenergy: Challenges to the neutrality assumption. J. Clean. Prod. 2016, 125, 78–85. [Google Scholar] [CrossRef]
- Breton, C.; Blanchet, P.; Amor, B.; Beauregard, R.; Chang, W.S. Assessing the climate change impacts of biogenic carbon in buildings: A critical review of two main dynamic approaches. Sustainability 2018, 10, 2020. [Google Scholar] [CrossRef] [Green Version]
- Hoxha, E.; Passer, A.; Saade, M.R.M.; Trigaux, D.; Shuttleworth, A.; Pittau, F.; Allacker, K.; Habert, G. Biogenic carbon in buildings: A critical overview of LCA methods. Build. Cities 2020, 1, 504–524. [Google Scholar] [CrossRef]
- Balouktsi, M. Carbon metrics for cities: Production and consumption implications for policies. Build. Cities 2020, 1, 233–259. [Google Scholar] [CrossRef]
- USDA Forest Service, Davey Tree Expert Company, The Arbor Day Foundation, Society of Municipal Arborists, International Society of Arboriculture, Casey Trees, and SUNY College of Environmental Science and Forestry. i-Tree Eco Tool. Available online: https://www.itreetools.org/tools (accessed on 2 March 2021).
- European Commission. nZEB. Available online: https://ec.europa.eu/energy/content/nzeb-24_it (accessed on 3 November 2020).
- Pascual, R.; Giulia Paoletti, F.A. ZEBRA2020: Nearly Zero-Energy Building Strategy 2020. Deliverable 5.1: Nearly Zero-Energy Building (nZEB) Technology Solutions, Cost Assessment and PerformanceZEBRA2020—Project Deliverable 5.1. 2016. Available online: https://www.zebra2020.eu/website/wp-content/uploads/2014/08/Zebra2020_Deliverable-5.1_Report.pdf (accessed on 1 October 2021).
- Attia, S.; Eleftheriou, P.; Xeni, F.; Morlot, R.; Ménézo, C.; Kostopoulos, V.; Betsi, M.; Kalaitzoglou, I.; Pagliano, L.; Cellura, M.; et al. Overview and future challenges of nearly zero energy buildings (nZEB) design in Southern Europe. Energy Build. 2017, 155, 439–458. [Google Scholar] [CrossRef]
- Fondazione di Comunità Milano Fondo Forestami. Available online: https://www.fondazionecomunitamilano.org/fondi/fondo-forestami/ (accessed on 12 March 2021).
Figure 1.
The overall approach to carbon neutrality considered in the study.

Figure 2.
Plan (a) and section (b) views of the building area.
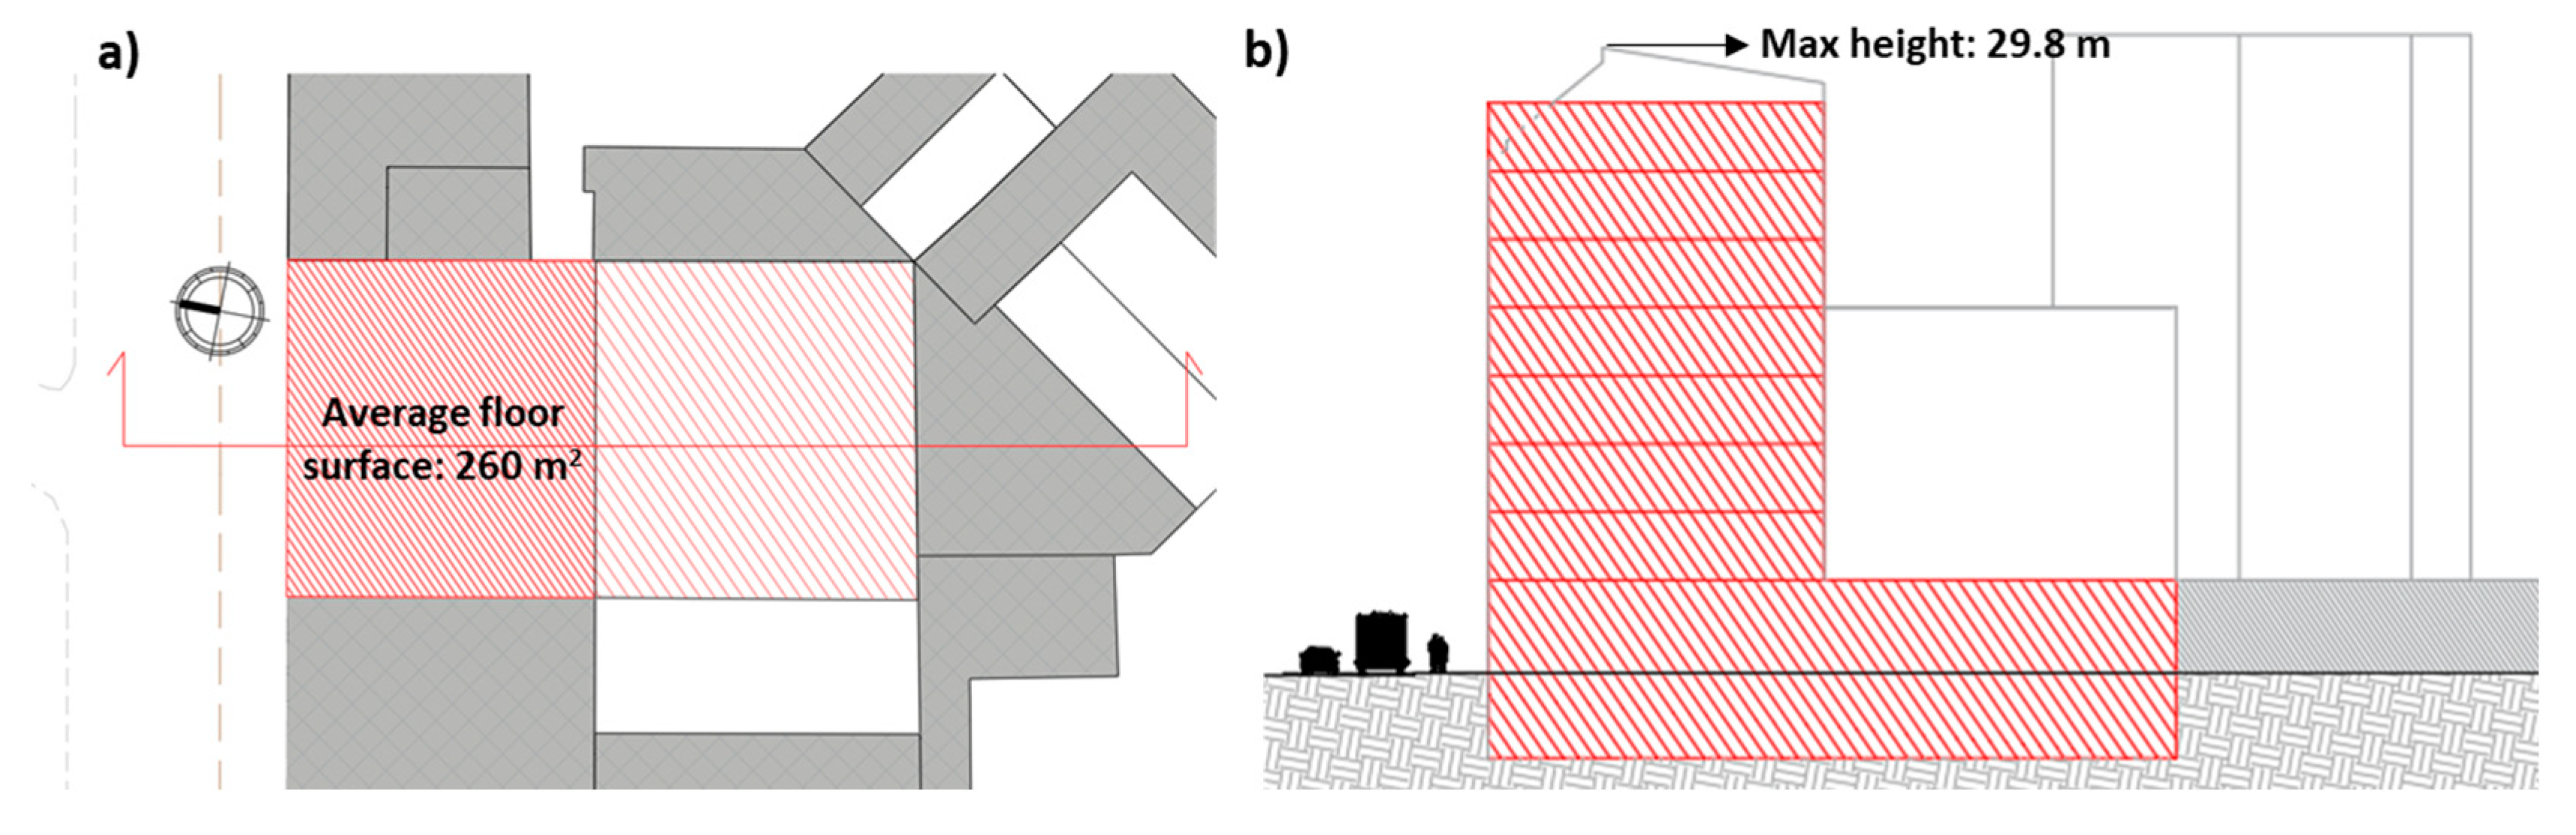
Figure 3.
Annual occupancy profile of the overall building.
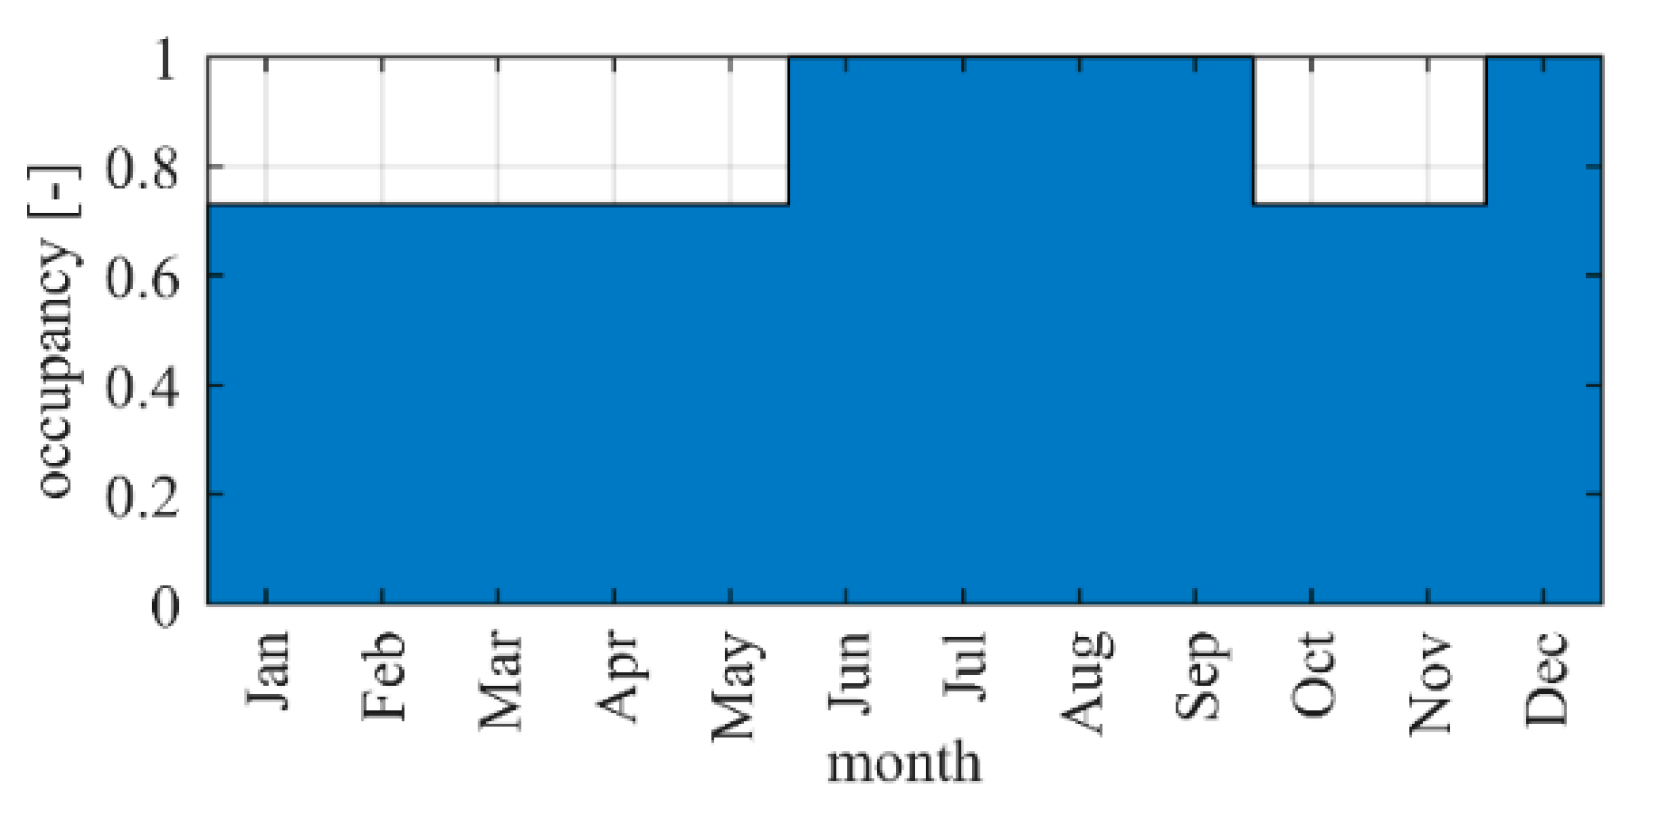
Figure 4.
Daily occupancy profile of the thermal zone in the building.

Figure 5.
Heating and cooling plant daily schedule.

Figure 6.
Daily load curves for the hot water need.

Figure 7.
Net and gross daily thermal energy need profiles for the nZEB and CNB building models.

Figure 8.
Overall monthly electric energy uses for heating and cooling, for nZEB (left) and CNB (right) buildings.
Figure 8.
Overall monthly electric energy uses for heating and cooling, for nZEB (left) and CNB (right) buildings.

Figure 9.
Overall consumption and production.

Table 1.
Summary of CNB/ZCB definitions, core requirements of the definition, and accounted emissions. Please note that the abbreviation “RES” stands for renewable energy sources.
Table 1.
Summary of CNB/ZCB definitions, core requirements of the definition, and accounted emissions. Please note that the abbreviation “RES” stands for renewable energy sources.
| Reference/s | Terminology | Core Requirements of the Definition | Lifecycle Stage Impacts Accounted |
|---|---|---|---|
| Torcellini et al., 2006 Crawley et al., 2009 [28] | Net-zero emissions building | Net-zero energy building, production/purchase of emissions-free renewable energy to offset emissions from all energy used in the building annually | Use stage—operation (yearly) |
| UK DCLG, 2007 [23], UK DCLG, 2008 [29], Zero Carbon Hub, 2014 [30] | Zero-Carbon Home (or Non-Domestic Building) | High level of energy efficiency, onsite RES exploitation, offset solutions for tackling the remaining emissions. Energy use for space heating, ventilation, hot water, fixed lighting, and appliances taken into account. | Use stage—operation (yearly) |
| Riedy et al., 2011 [31] | Carbon-zero building | Energy efficiency strategies, onsite energy generation, no net annual emissions from the operation of building incorporated services (heating, cooling, water heater, built-in cooking appliances, fixed lighting, renewable energy generation) | Use stage—operation |
| SBSE, 2012 [20], SBSE et AIA, 2012 [21] | Carbon-Neutral—Operating Energy (OE) | Sustainable design strategies, onsite RES exploitation, purchase (20% maximum) renewable energy and/or certified renewable energy credits. No fossil fuel greenhouse gas emitting energy to heat and cool the building, and for lighting | Use stage—operation |
| Carbon-Neutral—OE + Embodied Energy | Previous definition + offset of the embodied energy associated with the materials used to construct the building | Materials and use stages | |
| Carbon-Neutral—OE + Site Energy + Occupant Travel | OE definition + offset of the personal carbon emissions associated with the means and distance of travel of all employees and visitors of the building | Use stage + users transportation-related emissions | |
| Light House Sustainable Building Centre Society, 2012 [32] | Carbon-neutral building | Significantly reduced energy consumption, RES exploitation, and use of low-carbon energy sources to meet the remaining demand, carbon offsets | Use stage—operation |
| Reardon et al., 2013 [33], Pipkorn and Reardon, 2013 [34] | Carbon-zero/carbon-neutral/zero-energy/zero-emission building | Energy efficiency strategies, onsite RES exploitation, net amount of energy generated on site equal to the net amount of energy required by the building over a year | Use stage—operation (yearly) |
| Architecture 2030, 2014 [35] | Carbon-neutral building | Energy efficiency strategies, satisfaction of energy needs from sources that do not produce CO2 emissions resulting in zero-net CO2 emissions | Use stage—operation |
| Selamawit, F. et al., 2016 [36] | ZEB-O÷EQ | CO2 or carbon dioxide equivalent (CO2-eq) emissions related to all energy use for operation “O”, except that for equipment and appliances (EQ), compensated through RES generation | Use stage—operation except EQ |
| ZEB-O | CO2-eq emissions related to all energy use for operation compensated through RES generation | Use stage—operation | |
| ZEB-OM | ZEB-O definition considering embodied emissions from materials, “M”, phase | Materials and use stages | |
| ZEB-COM | ZEB-OM definition considering emissions related to the construction, “C”, phase | Materials, construction, and use stages | |
| ZEB-COME | ZEB-COM definition considering emissions related to part of the end-of-life, “E”, phase | Materials, construction, use, deconstruction stages | |
| ZEB-COMPLETE | CO2-eq emissions related to the whole-building lifecycle | Materials, construction, use, deconstruction, disposal stages | |
| EllisDon Corporation, 2018 [17] | Carbon-neutral building | CO2-eq emissions from the construction and operation equal to zero, or balanced by the actions taken to reduce and offset these emissions | Construction and use stages |
| GBCSA, 2019 [37] | Net Zero/Net Positive Carbon building | Highly energy-efficient building, onsite production and, if necessary, offsite renewables to offset the remaining emissions associated with annual energy use | Use stage—operation (yearly) |
| Architecture 2030, 2018 [38], Becqué et al., 2019 [1] | (Net)-zero carbon building | High energy efficient building, onsite production or provision of enough carbon-free energy (onsite, offsite renewables, and/or credible offsets) to meet yearly building energy consumption in operation. Balance achieved at building or at the district level | Use stage—operation (yearly) |
| Becqué et al., 2019 [1] | (Net)-zero carbon building + embodied carbon | definition [17] + offset of the carbon embodied in the building’s construction | Materials and use (yearly operation) stages |
| UKGBC, 2019 [39] | Net-zero carbon—construction | Zero or negative carbon emissions associated with building’s product and construction through emissions offset or export of onsite renewable energy | Materials production and construction stages |
| Net-zero carbon—operational energy | High energy efficient building powered from onsite and/or offsite RES, zero or negative carbon emissions associated with building’s operational energy on an annual basis, offset of remaining carbon emissions | Use stage—operation (yearly) | |
| Net-zero carbon—whole life | Zero or negative carbon emissions associated with building’s embodied and operational impacts over the life of the building (including its disposal) through energy efficient measures, onsite RES exploitation, emissions offset | Materials production, construction, use, and end-of-life stages | |
| Climate Active, 2020 [40] | Carbon-neutral base building operations | Emissions from the building’s core services (air conditioning, common area, and external lighting, hot water, lifts, car parking, or similar) to be measured and offset | Use stage—operation |
| Carbon-neutral—whole building operations | Building’s total emissions (from base building services operation and from equipment and appliances) to be measured and offset | Use stage—operation | |
| USGBC, 2020 [41] | (LEED) Zero-Carbon building | Emissions from delivered energy and occupant transportation to be measured and offset. Carbon offset includes onsite RES generated and exported to the grid, offsite RES procurement, and the purchase of carbon offsets | Use stage—operation and occupants transportation |
| CaGBC, 2021 [42] | Zero-Carbon Building | Highly energy-efficient building, production/procurement of carbon-free renewable energy, or high-quality carbon offsets, to compensate for the annual emissions from building materials and operations. | Materials and use (yearly operation) stages |
Table 2.
Material and service system technologies considered in the nZEB and CNB scenarios.
| nZEB Scenario | CNB Scenario |
|---|---|
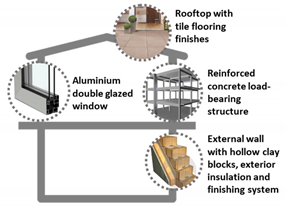 | 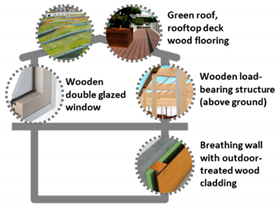 |
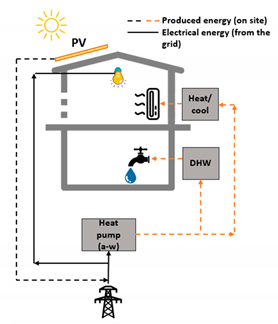 | 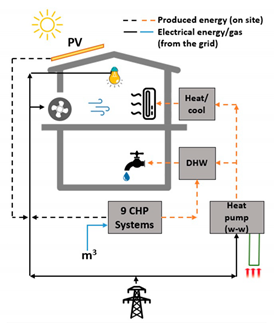 |
| Reinforced concrete structures for the whole building | Wooden structures (above ground) and reinforced concrete structures for the basement |
| Envelope with hollow clay blocks and mineral wool insulating layer, U = 0.208 W/m2K | Breathing wall with outdoor-treated wood cladding, UBW = 0.137 W/m2K |
| Double-glazed façade and windows with aluminum frames (Uglass = 1.4 W/m2K, Uframe = 1.84 W/m2K) | Double-glazed façade and windows with low-E glass and wooden frames (Uglass = 1.0 W/m2K, Uframe = 1.51 W/m2K) |
| Internal horizontal floor slab with cement-based screeds and tile finishes | Internal horizontal floor slab with dry screed and wood finishes |
| External horizontal envelope with gravel (U = 0.219 W/m2K) or tile flooring finishes (U = 0.209 W/m2K) | External horizontal envelope with green roof (U = 0.146 W/m2K), gravel (U = 0.150 W/m2K) or wood flooring (U = 0.145 W/m2K) |
| PV (minimum standard requirements) coupled with an air-to-water heat pump | PV and combined heat and power (CHP) systems coupled with a geothermal water-to-water heat pump (GWHP) |
Table 3.
Phase C1–C4: waste treatment processes considered in the calculation.
| Material | Waste Treatment and Landfill |
|---|---|
| Mineral materials (cement, stone, ceramic, etc.) | Preparation for recycling |
| Metals | Preparation for recycling |
| Natural matrix materials | Incineration of construction waste for energy recovery |
| Other materials (synthetic materials, glass, etc.) | Disposal of inert construction waste in landfills |
Table 4.
nZEB and CNB energy performance per year.
| End-Uses Electric Energy Use per Year | ||||
|---|---|---|---|---|
| End-Use | nZEB Scenario | CNB Scenario | Unit | Difference CNB vs. nZEB % |
| Bedrooms | 14.4 | 14.4 | MWhEL/year | 0% |
| Common areas lighting | 7.5 | 7.5 | MWhEL/year | |
| Common areas (appliances, etc.) | 6.8 | 6.8 | MWhEL/year | |
| DHW | 196.1 | 80.5 | MWhEL/year | −59% |
| Heating/cooling | 161.6 | 89.5 | MWhEL/year | −45% |
| Total electric energy use per year | 386.4 | 198.6 | MWhEL/year | −49% |
| Natural gas consumption per year (not available for the nZEB scenario) | ||||
| CHP | n.a. | 19,710.0 | m3/year | n.a. |
| CHP | 210.7 | MWh/year | ||
| Electric energy produced on site per year | ||||
| Photovoltaic production | 18.5 | 22.3 | MWhEL/year | +21% |
| CHP production | 0.0 | 118.3 | MWhEL/year | n.a. |
| Total electrical energy produced on site | 18.5 | 140.6 | MWhEL/year | +662% |
| Thermal energy produced by CHP | ||||
| Thermal energy produced by CHP | n.a. | 47.3 | MWhTH/year | n.a. |
| Electrical energy supplied by the electricity grid per year | ||||
| 367.9 | 58.0 | MWhEL/year | −84% | |
| Nonrenewable primary energy demand per year | ||||
| 890.4 | 361.7 | MWhPR/year | −59% | |
Table 5.
Total impact during the project building use phase (B6) for the CNB scenario.
| Impacts Due to the Electric Energy Supplied by the Electricity Grid | ||
|---|---|---|
| Annual electric energy supplied by the electricity grid | 58.05 | MWh/year |
| Electricity emission factor from the national grid | 0.414 | tonCO2-eq/MWh |
| Impact of electric energy from the national grid (50 years) | 1201.6 | tonCO2-eq50 years |
| CHP Impacts | ||
| Annual electricity produced | 118.3 | MWh/year |
| Annual thermal energy produced | 47.3 | MWh/year |
| CHP emission impact Scenario 1 (50 years) | 2743.6 | tonCO2-eq50 years |
| CHP emission impact Scenario 2 (50 years) | 2779.1 | tonCO2-eq50 years |
| Total Environmental Impacts of the Building Use Phase (B6) | ||
| Impacts of CHP (Scenario 1) + impacts due to the electric energy supplied by the electricity grid (50 years) | 3945.3 | tonCO2-eq50 years |
| Impacts of CHP (Scenario 2) + impacts due to the electric energy supplied by the electricity grid (50 years) | 3980.7 | tonCO2-eq50 years |
Table 6.
Building carbon footprint for the analyzed scenarios (CNB vs. nZEB) in the whole lifecycle.
Table 6.
Building carbon footprint for the analyzed scenarios (CNB vs. nZEB) in the whole lifecycle.
| Life Cycle Phase | nZEB | CNB | Difference CNB vs. nZEB [%] | |||
|---|---|---|---|---|---|---|
| [tonCO2-eq] | [%] | [tonCO2-eq] | [%] | |||
| A1–A3 | Construction materials | 2910.0 | 26% | 727.4 | 14% | −75% |
| A4 | Transport | 57.1 | 1% | 31.1 | 1% | −46% |
| A5 | Construction/installation | 52.1 | 1% | 52.1 | 1% | 0% |
| B4–B5 | Materials replacement | 361.8 | 3% | 130.4 | 3% | −64% |
| B6 | Energy use | 7615.9 | 68% | 3980.7 | 79% | −48% |
| C1–C4 | Disposal/deconstruction | 135.3 | 1% | 94.5 | 2% | −30% |
| Total (A1–C4) | 11,132.1 | 100% | 5016.2 | 100% | −55% | |
Table 7.
Material construction phase analysis and impact comparison (A1–A3) for the CNB and the nZEB scenarios (see Table A4 and Table A5, in the Annex, for further details).
| Technological Unit Classes | nZEB | CNB | Difference CNB vs. nZEB [%] |
|---|---|---|---|
| [tonCO2-eq] | [tonCO2-eq] | ||
| Load-bearing structure | 2430 | 562 | −77% |
| Vertical envelope | 102 | 42.4 | −59% |
| Horizontal envelope | 62.9 | 7.84 | −88% |
| Internal partitions | 225 | 39.7 | −82% |
| Systems/Plants | 90.6 | 75.7 | −16% |
| Total | 2910 | 727 | −75% |
Publisher’s Note: MDPI stays neutral with regard to jurisdictional claims in published maps and institutional affiliations. |
© 2021 by the authors. Licensee MDPI, Basel, Switzerland. This article is an open access article distributed under the terms and conditions of the Creative Commons Attribution (CC BY) license (https://creativecommons.org/licenses/by/4.0/).
Share and Cite
MDPI and ACS Style
Causone, F.; Tatti, A.; Alongi, A. From Nearly Zero Energy to Carbon-Neutral: Case Study of a Hospitality Building. Appl. Sci. 2021, 11, 10148. https://doi.org/10.3390/app112110148
AMA Style
Causone F, Tatti A, Alongi A. From Nearly Zero Energy to Carbon-Neutral: Case Study of a Hospitality Building. Applied Sciences. 2021; 11(21):10148. https://doi.org/10.3390/app112110148
Chicago/Turabian StyleCausone, Francesco, Anita Tatti, and Andrea Alongi. 2021. "From Nearly Zero Energy to Carbon-Neutral: Case Study of a Hospitality Building" Applied Sciences 11, no. 21: 10148. https://doi.org/10.3390/app112110148
Note that from the first issue of 2016, this journal uses article numbers instead of page numbers. See further details here.