
The Future Impact of Carbon Tax on Electricity Flow between Great Britain and Its Neighbors until 2030


1
Chemical Engineering Department, Ferdowsi University of Mashhad, Mashhad 9177948974, Iran
2
Department of Science and Industry Systems, University of South-Eastern Norway (USN), 3616 Kongsberg, Norway
3
Industrial Engineering Department, Payame Noor University, Tehran 469719395, Iran
*
Author to whom correspondence should be addressed.
Appl. Sci. 2021, 11(21), 10460; https://doi.org/10.3390/app112110460
Submission received: 28 September 2021
/
Revised: 29 October 2021
/
Accepted: 2 November 2021
/
Published: 7 November 2021
(This article belongs to the Special Issue 5th Anniversary of Energy Section—Recent Advances in Energy)
Abstract
:This paper investigates the future role of cross-border electricity flow between Great Britain (GB) and its neighbors until 2030, considering high deployment of renewable energy sources (e.g., wind, solar, and biomass), enhanced interconnection capacity, and a partly electrified heating sector. It was assumed that two cross-border interconnectors links will connect GB’s power system to its neighbors: (1) a one-way interconnector (IC1) that imports electricity to GB, and (2) a two-way one (IC2) between France and GB. The IC2 was allowed to transfer electricity from a cheaper power system to a more expensive one. The results show that at a fixed CO2 price, a change in power imported via IC1 will affect the power dispatch of the CO2 emitting power plants and biomass-fired power plants, and electricity trade via IC1 and IC2. At IC1 importing of £60/MWh, by raising the CO2 price from 60 to £70/ton, the share of CCGT power plants will reduce by 75%, and the power imported via IC1 link will face 19-times growth. With a constant IC1 import price, raising the CO2 tax will reduce the total quantity of electricity being exported to France via IC2. Moreover, increasing the CO2 tax will increase the emissions cost of gas and coal-fired generators, and the power required to meet the demand will be imported via IC1. With the IC1 electricity price set to £20/MWh and the CO2 tax set to £50/ton, there may be 595 periods out of 17,520 in which GB will be used as an electricity trade corridor. GB’s total CO2 emissions should drop as the CO2 tax increases.
1. Introduction
Power trading through cross-border links eases entry to inexpensive energy sources, lessens consumers’ electricity bills, enhances renewable integration, and results in improved security of supply. Brinkerink et al. [1] reviewed the current regional and global improvisations for a sustainable future. The challenges and benefits of intercontinental interconnector links were addressed. Although the opportunities and challenges have been qualified, the actual quantification of associated advantages, costs, and environmental consequences is in its early stages. The feasibility of electricity imports/exports between South Korea and the far east federal district of Russia was assessed in [2]. The authors claimed that financing of the project is the greatest challenge. The impact of electricity import and export to/from Japan and South Korea was studied in [3]. The results showed significant cost-effectiveness of the power flow under severe conditions, such as CO2 emission targets in both countries and phaseout of nuclear generators in Japan. Doorman and Frøystad analyzed the profitability of several interconnectors GB and Norway for the present and future scenarios [4]. Two interconnection cases were studied: (1) a link between Southern Norway and the southern UK, and (2) a mutual interconnector between Southern Norway and Scotland. The latter case tends to increase social welfare. However, from a merchant point of view, none of the interconnection links are profitable.
The costs, benefits, and effects of integrating interconnectors with North Sea offshore wind farms were examined by Konstantelos and co-workers [5]. The authors considered three case studies for the UK, Norway, Denmark, Belgium, Germany, and the Netherlands. In addition, CAPEX and OPEX (capital and operational costs) of the system, together with the potential benefits of the integrated projects, were quantified. For each of the three case studies, the conventional designs and the integrated networks were developed and analyzed. The authors claimed that the integrated systems are more advantageous than the conventional power systems. In [6], Voumvoulakis et al. studied the Greek electricity generation expansion within 2009 and 2020 to reach the planned 40% share of renewables. The renewable installed capacity in 2009 was 1.18 GW. The authors examined the impacts of increasing the capacity of the Greek interconnectors, in addition to increasing storage capabilities, on the expansion of the power system and the system’s reserve requirements. The results showed that nearly 8.8–9.3 GW of renewable energy sources, including wind farms, small hydropower, solar PVs, and biomass-fired generators, would have had to be installed to meet the 40% renewables target in 2020. Nepal and Jamasb assessed the potential roles of interconnectors and enhanced market integration between the Irish market and the electricity markets of other European countries [7]. No integration benefit was reported for integration between the Irish electricity market and those of GB and Elspot. The integration of GB’s and SEM’s electricity markets was found to be nearly 17%.
Lynch et al. developed a mixed-integer linear programming (MILP) model to determine the capacities and locations of new electricity interconnectors for GB, Germany, the Netherlands, Belgium, France, Ireland, and the East and West regions of Denmark [8]. The results revealed that cross-border electricity interconnectors tend to reduce the total system costs when there is a renewable electricity generation target. The environmental effects and benefits of regional electricity trade among China, Russia, and other countries in the northeast of Asia were examined by Zhu et al. [9]. Electricity importing tends to improve air quality in the north, northeast, and northwest regions of China.
In a recent study [10], Adeoye and Spataru assessed the influences of increased integration of hydropower and solar energy by West African electricity pool countries. They minimized the total electricity generation costs (costs of fuel + fixed and variable operation and maintenance). The results showed that electricity interconnections will considerably reduce the unserved power demand in the target region. In addition, most of the planned electricity interconnections will be under-utilized in 2030. Chen et al. investigated the future impacts of interconnectors for Northwestern European countries [11]. Increased interconnection of electric systems tends to decrease costs and total CO2 emissions. Clegg and Mancarella developed an integrated power–heat–gas network model for future energy scenarios in GB [12]. Electrifying the heating sector and decarbonizing the electricity generation may eliminate 75% of carbon emissions in the heat and power sectors. Li and co-workers analyzed the profit models for electricity interconnector projects [13]. The authors presented the measures of cost-effectiveness and sustainable expansion of electricity interconnectors. Chen and co-workers presented an evaluation model to recognize and assess the impact factors incorporated with cross-border interconnector links [14]. They considered 14 important factors affecting a specific cross-border interconnection project. A methodology was proposed in [15] for optimal planning of cross-border interconnectors connecting countries with abundant hydropower resources. The methodology was based on a cost-benefit assessment (CBA). A case study was conducted to connect the Brazilian power system to Argentina, where there exist abundant and complementary hydropower resources. Barrie addressed the advantages of developing interconnector projects to facilitate the development and trade of renewables [16].
GB’s 2030 energy system is characterized by large portions of solar, wind, and biomass energy generation, enhanced cross-border interconnection capacity, and an electrified heating sector. This work is the continuation of recently published papers where the function of power-trade links between GB and the neighboring states, considering upscaling of renewables and a partly electrified heating sector by 2030, was investigated [17]. Two interconnectors were considered: (1) import-only link (IC1), and (2) a two-way trade one between France and GB (IC2). In this study, the impacts of carbon tax and the IC1 import price on power dispatch, power flow between GB and the neighbors, and GB’s total CO2 emissions are investigated, as the CO2 tax affects a power plant’s marginal cost.
The Climate Change Act 2008 is the basis for the UK’s strategy to challenging and replying to climate change [18]. It needs the government to set legally-binding “carbon budgets” to act as stepping stones towards the 2050 target, while considering trading schemes, impacts and adaptations for climate change, etc. The UK’s ideal approach to carbon pricing is an emissions trading system connected to the EU ETS, where a carbon emission tax (the Tax) is being considered as an alternative, along with a standalone UK ETS [19]. Carbon taxes and greenhouse gas emissions trading systems have been investigated by many researchers in different sectors and for diverse areas/countries [20]. For example, in reference [21], an estimation of the impact of a carbon tax on manufacturing plants in the UK was studied.
Changes in CO2 tax and IC1 import prices will also affect the level of integration of GB’s power system with those of its neighbors, as will fossil fuel consumption for power generation. Power trade via interconnectors is a source of income when one exports electricity at low demand times. In addition, electricity importing could provide low-cost energy from neighboring countries in high CO2 tax scenarios, leading to reduced electricity generation costs. Electricity trade via interconnectors reduces the renewable curtailment at various levels of import price and in various CO2 tax scenarios. Furthermore, electricity interconnectors can eliminate CO2-emitting power plants and expensive power production technologies. Pure CO2 can be used to react with the hydrogen originated from water electrolysis to produce green methane. The required power for the electrolyzers can be imported from the neighboring countries at low demand times.
The rest of this paper is organized as follows. Section 2 presents a linear optimization model that can find the minimum daily power dispatch until 2030. In this study, five electricity price alternatives for IC1 and five scenarios for the CO2 tax were defined to investigate the impacts of electricity import and/or export prices and CO2 tax on the optimal power dispatch, GB’s power system’s CO2 emissions, and the power flow to/from GB. The optimization results—including optimal power dispatch. total CO2 emissions. and the breakdown of power flow in and out of GB versus the import price of IC1 and the CO2 tax—in addition to capacity factors, are discussed in Section 3. Section 4 presents the conclusions of this study.
2. Formulation of the 2030 Optimization Model
The optimization model finds the lowest-cost power dispatching of generating units by minimizing a linear programming (LP) problem. The optimization problem consists of (1) a cost minimization objective function including costs of fuel (gas, coal, oil, uranium, and biomass), variable operation and maintenance (O&M), and carbon emissions; and (2) a set of inequality and equality constraints.
GB’s 2030 energy system will include heavy usage of renewables for power production, no power production from unabated coal-fired plants, increased gas-fired power production (with and without carbon capturing and storage, CCS) to improve the energy system’s flexibility, the use of electricity for heating, and enhanced power trading (imports/exports) to/from GB. The heat rate (efficiency), summer and winter availabilities, and ramping (up and down) rates of the electricity generation technologies were taken from [17,22].
2.1. Objective Function
For each day of 2030, the linear objective function is obtained by adding the product of the amounts of power dispatched at () and the generators’ marginal costs. The emission costs in Table 1 (ton CO2/(MWth × h)) were calculated based on emission factors of CO2 emitting generation technologies: 0.1836 for combined cycle gas turbines (CCGT), 0.01836 for CCGT + CCS, and 0.03252 for abated coal-fired power plants. A shedding price of £1000 /MWh was used in the objective function to avoid shedding.
where : objective function in £; : generation technology, [17]; : time step (0.5 h); : electricity generation cost of power plant (£/MWh); : power production of technology at time (MW); and : shedding at time (MW).
Emission cost depends on the CO2 tax. For each technology, the lowest emission cost corresponds to the CO2 tax of £50/ton of CO2, and the highest one cost stands for the CO2 tax of £90/ton of CO2 released [24]. It is assumed that the total electricity interconnector capacity between GB and its neighbors will reach 17.7 GW, of which the capacity of the interconnector with France is 5 GW. The France–GB interconnector was considered in a way to allow electricity to flow in and out of GB until 2030, and the interconnectors between GB and other states were assumed to import electricity to GB at 20, 40, 80, and £100/MWh [22]. Therefore, the latter will transmit electricity to GB when the half-hourly demand cannot be met by GB’s available generators and electricity imports from France. The emission costs of generation technologies were calculated by varying the CO2 tax from 50 to £90 per ton of CO2 to study the impact carbon price on GB’s energy system.
2.2. Constraints
(1) The heating technologies considered were combined heat and power (CHP) installations, gas and boiler, direct electric heaters, ground source heat pumps (GSHP), and air source heat pumps (ASHP). The contributions of heating technologies in heat supply were taken from [17,22] and correlated with the daily heat demand by Equation (2). It is expected that nearly 42% of GB’s total heat demand by 2030 shall be provided via electricity.
In Equation (2), : total half-hourly heat demand (MW); : type of heating device (CHP, gas boilers, electric heaters, GSHPs, ASHPs, and oil boilers); and : heat from heating device at time (MW).
The CHP units’ power output at each half-hour of a certain day can be obtained from Equation (3). In Equation (3), was used to implicitly take into account the thermal energy storage units, and therefore levels out the intra-day heat demand variations. is the CHP units’ heat output at time . In Equation (3), is the power output (MW) of CHPs, is the heat output (MW) of CHPs, stands for the electricity demand (MW) at of the day and the 45/30 multiplier represents the ratio of thermal efficiency to electrical efficiency. Note that the calculated of a certain day can be different from other days, because the daily electricity demand profiles are not the same.
The electricity consumption by direct electric heaters, ASHP, and GSHP at each half-hour of the day is a function of their heat output based on Equation (4). , the seasonal performance factors of electric heater, GSHP, and ASHP, were taken from [17,19]. Equation (4) states that intra-day high electricity demands are captured by direct electric heaters, ASHPs, and GSHPs.
The historical solar and wind power generation data over 2010 are available in [25]. These historical data were upscaled to calculate the available electricity from wind farms () and solar PVs () for each half-hour of 2030.
(2) At each half-hour of a certain day, , the power injection to the electricity grid from solar () and wind () sites should be less than or equal to the available power ( and ); see Equation (5). These inequality constraints state that wind and solar curtailment may occur at any time.
(3) Equation (6) states that the change in the power outturn of technology at and of a certain day should be less than or equal to its ramp rate ().
(4) The power output from each technology is lower than or equal to its winter/summer availability multiplied by nominal capacity (); see Equation (7). For the nuclear power plants (technology 4 in Table 1), it was assumed that they operate with at least 60% of their total capacity.
(5) The electric vehicles’ (EVs) annual electricity consumption over 2030 was fixed at 21.28 TWh, [26]. Equation (8) states that the non-heating demand at time —i.e., ()—of a certain day is the sum of the EVs’ power demand (2429 MW), and the real half-hourly electricity demand in 2010 () minus the 10% contribution of electrical heaters in 2010 [24].
(6) At time of a certain day, the power output of all generators () and CHP units must be equal to (obtained from Equation (8)), and the power consumption for heating purposes (Elec4Heatt):
The power flow between GB and France (,GW) can take positive and negative values. At each half-hour, if the price in GB () is greater than that of France () then electricity is transmitted to GB and vice versa. In addition, the electricity flow to GB via IC1 has a fixed price of (£/MWh).
The LP problem consisting of the objective function—Equation (1)—and constraints Equations (2)–(10) was solved for each day of 2030 by MATLAB linear programming solver (linprog) for various CO2 taxes (50, 60, 70, 80, and £90/ton CO2) and IC1 electricity import prices (= 20, 40, 60, 80, £100/MWh).
3. Results and Discussion
Figure 1 demonstrates the contributions of various generators against the IC1 import price and CO2 tax in 2030. In the case of a CO2 tax being £50/ton, the share of the generators in power production would be CHPs 21.7%, that of wind farms would be 21.7%, that of solar PVs would be 7.7%, that of hydropower plants would be 1.4%, that of nuclear plants would be 18.1%, and that of CCS-equipped coal power plants would be 2.9%. Increasing the IC1 import price would not affect the power outputs of the above-mentioned technologies. The contribution of CCS-equipped CCGT power plants would be 1.1% if the IC1 price is lower than £40/MWh, or 2.5% for higher IC1 prices. The biomass-fired power plants will produce about 0.5% of the power at IC1 prices greater than £60/MWh. IC2 would provide 3.4–5% of electricity, and the electricity importing via the IC1 would drop from about 17.3% to 0.2% as the IC1 price increases.
Raising the CO2 tax from 50 to £60/ton had a negligible effect on the contributions of CHPs, wind farms, solar power, hydropower, nuclear power plants, biomass-fired power plants (when the IC1 price < £60/MWh), and the IC1 (when the IC1 import price > £40/MWh).
As the CO2 tax increases from 60 to £70/ton, the power delivered by CCGT power plants will face a 75% reduction. Moreover, increasing the CO2 tax from 60 to £70/ton will result in 19-times growth of power import via IC1.
CHP units, wind farms, and nuclear plants will produce nearly 61% of the power in 2030, because the contribution of generators in power production will depend on their marginal cost, seasonal availability, and the installed capacity.
In all scenarios, the total amount of wind curtailment was nearly 4.3 TWh. The over-demand wind generation can be stored for a long time in different forms [27,28,29,30]. Energy storage in large volumes can be achieved by the conversion of renewable energy to hydrogen and then CO2 hydrogenation to synthesize gas and/or chemicals [31,32,33,34,35,36,37,38,39].
Figure 2 illustrates the capacity factor of the generators versus CO2 tax and IC1 import price in 2030. The capacity factor is the averaged generated power divided by the installed generator capacity. Nuclear power plants have the highest capacity factor (ca. 74%). This is due to the fact that this technology is the base-load technology with a low marginal cost. For the case that of the CO2 tax being £50/ton, the capacity factors of solar PVs, wind farms, and CCS-equipped coal plants will be nearly 15.28%, 21%, and about 66%, respectively. The variations in capacity factors of biomass-fired and nuclear plants are ca. 0.04–2.52% and 74.20–74.25%. The capacity factor of hydropower plants is 64.45%, and for CCGT plants it fluctuates between 8% and 30.96%. The capacity factor of abated CCGT power plants goes from 26.67% to 60.83% as the IC1 importing increases (theoretically). For IC1, the capacity factor tends to decline as the IC1 import price rises. Furthermore, the fluctuations of the IC2 capacity factor lie within 59.56% and ca. 70%.
If the CO2 tax changes from 50 to £60/ton, the capacity factor of unabated CCGTs and CCS-equipped coal power plants will drop. This owes to the fact that increasing CO2 tax increases the marginal costs of these technologies. The IC2 capacity factor tends to decline when the IC1 price is below £40/MWh.
For the cases with CO2 tax of £70/ton, the reduction in the capacity factor of CCGTs at IC1 price of £60/MWh was 74.76%, whereas at other IC1 import prices, the capacity factor reduction was less than 1%. Moreover, the IC1 capacity factor at the IC1 price of £60/MWh was more than 19-fold that in the case with a CO2 tax of £60/ton. For other import prices, the growth of capacity factor was less than 0.08%, since the CCGTs capacity factor depends on both the IC1 import price and CO2 tax.
Figure 3 represents the impact of the CO2 tax on the total electricity flow in and out of GB over 2030. As is evident from Figure 3a, at a constant IC1 price, increasing the CO2 tax will cause a reduction in the total amount of electricity exports to France. This is because of the fact that part of the electricity exported to France comes from CO2 emitting power plants, and increasing the CO2 tax will affect the power outputs of such plants.
In our experiments, when the IC1 price was below , the cross-border link IC1 imported power to GB and then exported it to France by means of the IC2. At low values of IC1 prices, there were big differences among the total electricity exports from GB to France compared to the change of the CO2 tax. For example, the difference between the quantity of electricity exports to France was 0.4 TWh as the CO2 tax increased from 50 to £90/ton. At high IC1 import prices, there was no surplus power to be exported to France, since the electricity price in France was below the IC1 import price. At a constant CO2 tax price, increasing the IC1 price tended to decrease the electricity exported to France, because a fraction of the electricity exported to France is provided via IC1.
Figure 3b depicts the amount of power flow to GB by means of the IC2 line. At fixed IC1 import prices, increasing the CO2 tax tends to improve the import to GB by means of the cross-border interconnector IC2. The reason is that increasing the CO2 tax increases the emission costs of gas and coal-fired power plants, and the power required to meet the demand is import via IC1. At a fixed CO2 tax, raising the IC1 import price causes more imports to GB via IC1. At a constant CO2 price, increasing the IC1 price diminishes the importance by means of the cross-border link IC1. Except for the IC1 price of £60/MWh, the profiles of the IC1 electricity flow to GB are very close to each other.
Figure 4 shows the frequency of the half-hours during which the IC2 is fully loaded versus the IC1 price and CO2 tax in 2030. For each IC1 price, the percentage of times (half-hours) that the IC2 power link is fully loaded is not changed much by the variation of CO2 tax. At a fixed CO2 tax, increasing the IC1 price increases the percentage of times (half-hours) that the IC2 is on full load.
Figure 5 illustrates the minimum and maximum amounts of shedding (in GW) and the maximum IC1 load (in GW) when IC1 was fully loaded at various CO2 taxes and IC1 import prices for 2030. As is evident from this figure, for all values of the IC1 prices, the minimum and maximum shedding were 0.7 and 1.07 GW, respectively. In addition, the maximum IC1 load tends to decline as the IC1 price increases. It is worthy to mention that shedding phenomena occur during 10 half-hours irrespective of the IC1 import price and the CO2 tax. During shedding times, is greater than and according to the Equation (10), the flow through the IC2 becomes zero.
At a constant value of CO2 tax, increasing the IC1 price reduces the number of occasions (half-hours) in 2030 in which IC1 is loaded due to the increased marginal cost of power supply via IC1. Alternatively, when the IC1 price is constant, the higher the CO2 tax, the higher the number of half-hours within 2030 that IC1 is used (loaded). This is because increasing the CO2 tax results in a high marginal cost of CO2 emitting power plants.
At a constant CO2 price, as the IC1 price increases from £20/MWh to £40/MWh, the number of cases that IC1 is fully loaded and IC1 is unloaded declines. As the IC1 price rises from 60 to £100/MWh, the number of half-hours in which the IC2 is fully loaded and IC1 is unloaded increases. This is because the demand is not high and the IC1 is not used for power import. IC1 will import and/or export electricity.
The number of cases in which IC1 and IC2 power links import and export electricity in and out of GB compared to IC1 price and CO2 tax were determined. The direction of power flow between France and GB depends upon the relative electricity prices of these states. If is higher than that of the neighbors, and GB’s power plants cannot meet the demand, the interconnectors will be used for electricity importing to GB. In addition, on the occasions with the IC1 price of £20/MWh and the CO2 tax of £50/ton, there are 474 half-hours in which is higher than , IC2 imports electricity from France, and IC1 = 0. According to Equation (10), IC2 will not import electricity when is higher than . When is higher than , there are two cases where both IC1 and IC2 links are inactive. Interestingly, power is imported to GB via IC1 at £20/MWh and then is transmitted to France during 595 periods (out of 17520 half-hours) with an electricity price of over £20/MWh. At a constant IC1 price, when the IC1 price is below £60/MWh, increasing the CO2 tax tends to increase the number of cases such that IC1 > 0 and IC2 > 0. This signifies the role of interconnectors in power import at high CO2 tax scenarios.
Figure 6 displays GB’s power system CO2 emissions in 2030 as a function of the IC1 import price (£/MWh) and CO2 price (£/ton). As is evident in this figure, the amount of emitted CO2 from the gas and coal-fired power plants at the low IC1 price of £20/MWh declines as the CO2 tax increases. For example, the CO2 emissions reach 7.72 million tons at a carbon tax of £50/ton, and 7.48 million tons when the CO2 tax is £90/ton. In these cases, the CCGT plants emit over 83.5% of the total emissions. The CCGT plants emit ca. 83.05–83.30% of the total emissions. When the IC1 price is set to £60/MWh, the total power system emissions are 26.47 million tons at the carbon tax of £50/ton (the contribution of CCGT plants is over 94% of the total power system CO2 emissions). The reason for having high emission quantities is that IC1 is not importing power, and CCGT plants without CCS supply the required power at a total marginal cost lower than the IC1 price. Further increase of the CO2 tax to £70/ton results in a total emission of 7.82 million tons. On such occasions, the required power is supplied by means of the IC1 with a cost below the marginal generation cost of unabated CCGTs. The CO2 emissions of GB’s system at CO2 tax of 80 and £90/ton are respectively 7.56 and 7.73 million tons. At IC1 import prices higher than £60/MWh, the CCGTs with high marginal costs provide the required electricity to GB. At any carbon tax and IC1 price of 80 or £100/MWh, the unabated CCGTs emit ca. 94.4% of the total CO2 emissions.
4. Conclusions
In this work, the power trade in and out of GB within 2030 was considered. The total planned line capacity was assumed to reach 17.7 GW for IC1 and IC2 links. The effects of various CO2 tax scenarios and IC1 import prices were determined by minimizing a linear programming (LP) merit order power dispatch model. The results including share of generators in power production, capacity factor, the usage time of the two power lines within 2030, total CO2 emissions, and the breakdown of the power trade (import and/or export) between GB and the neighbors versus the IC1 price and CO2 tax were presented.
The results show that at a fixed CO2 tax, raising the IC1 price affects the power production of the CO2 emitting power plants, biomass-fired power plants, and electricity trade via the IC1 and IC2 lines. As the CO2 tax increased from 60 to £70/ton, the IC1 power imported through IC1 at £60/MWh showed nearly 19-times growth. For the cases with the CO2 tax of £70/ton, the IC1 capacity factor at the IC1 price of £60/MWh was more than 19-fold that of the case with the CO2 tax of £60/ton. At a fixed IC1 price, increasing the CO2 tax reduces the total electricity export from GB to France via IC1. At low IC1 prices, the variation of the total electricity export from GB to France may change a lot compared to the change in the CO2 tax. For instance, as the CO2 tax increased from 50 to £90/ton, the fluctuation in the power export to France was 0.4 TWh. For all values of the IC1 price, the minimum amount of shedding was 0.7 GW, and the max shedding was 1.07 GW. For IC1 prices below or equal to £60/MWh, increasing the CO2 tax from 50 to £90/ton tended to reduce the number of cases that GB transmitted electricity from the neighboring states on the other side of the IC1 (IC1 > 0) to France (IC2 < 0). The total CO2 emissions dropped as the CO2 tax increased. For instance, the total CO2 emissions over 2030 was theoretically 94.84 million tons at a CO2 tax of £50/ton, 94.61 million tons at a CO2 tax of £60/ton, 75.82 million tons with a CO2 tax of £70/ton, and 75.55 million tons at a CO2 tax of £100/ton.
Author Contributions
Conceptualization, A.R., M.K., A.S.; methodology, A.R., M.K., A.S.; software, A.R.; formal analysis, A.R., M.K., A.S.; visualization, A.R.; project administration, A.S.; writing—original draft preparation, A.R., M.K., A.S., F.A.T.; writing—review and editing, A.R., M.K., A.S., F.A.T. All authors have read and agreed to the published version of the manuscript.
Funding
This research received no external funding.
Institutional Review Board Statement
Not applicable.
Informed Consent Statement
Not applicable.
Conflicts of Interest
The authors declare no conflict of interest.
References
- Brinkerink, M.; Gallachóir, B.Ó.; Deane, P. A comprehensive review on the benefits and challenges of global power grids and intercontinental interconnectors. Renew. Sustain. Energy Rev. 2019, 107, 274–287. [Google Scholar] [CrossRef]
- Yun, W.-C.; Zhang, Z.X. Electric power grid interconnection in Northeast Asia. Energy Policy 2006, 34, 2298–2309. [Google Scholar] [CrossRef] [Green Version]
- Kanagawa, M.; Nakata, T. Analysis of the impact of electricity grid interconnection between Korea and Japan—Feasibility study for energy network in Northeast Asia. Energy Policy 2006, 34, 1015–1025. [Google Scholar] [CrossRef]
- Doorman, G.L.; Frøystad, D.M. The economic impacts of a submarine HVDC interconnection between Norway and Great Britain. Energy Policy 2013, 60, 334–344. [Google Scholar] [CrossRef]
- Konstantelos, I.; Pudjianto, D.; Strbac, G.; De Decker, J.; Joseph, P.; Flament, A.; Kreutzkamp, P.; Genoese, F.; Rehfeldt, L.; Wallasch, A.-K.; et al. Integrated North Sea grids: The costs, the benefits and their distribution between countries. Energy Policy 2016, 101, 28–41. [Google Scholar] [CrossRef]
- Voumvoulakis, E.; Asimakopoulou, G.; Danchev, S.; Maniatis, G.; Tsakanikas, A. Large scale integration of intermittent renewable energy sources in the Greek power sector. Energy Policy 2012, 50, 161–173. [Google Scholar] [CrossRef]
- Nepal, R.; Jamasb, T. Interconnections and market integration in the Irish Single Electricity Market. Energy Policy 2012, 51, 425–434. [Google Scholar] [CrossRef]
- Lynch, M.Á.; Tol, R.S.J.; O’Malley, M.J. Optimal interconnection and renewable targets for north-west Europe. Energy Policy 2012, 51, 605–617. [Google Scholar] [CrossRef] [Green Version]
- Zhu, F.; Zheng, Y.; Guo, X.; Wang, S. Environmental impacts and benefits of regional power grid interconnections for China. Energy Policy 2005, 33, 1797–1805. [Google Scholar] [CrossRef]
- Adeoye, O.; Spataru, C. Quantifying the integration of renewable energy sources in West Africa’s interconnected electricity network. Renew. Sustain. Energy Rev. 2020, 120, 109647. [Google Scholar] [CrossRef]
- Chen, Y.-K.; Koduvere, H.; Gunkel, P.A.; Kirkerud, J.G.; Skytte, K.; Ravn, H.; Bolkesjø, T.F. The role of cross-border power transmission in a renewable-rich power system—A model analysis for Northwestern Europe. J. Environ. Manag. 2020, 261, 110194. [Google Scholar] [CrossRef]
- Clegg, S.; Mancarella, P. Integrated electricity-heat-gas modelling and assessment, with applications to the Great Britain system. Part II: Transmission network analysis and low carbon technology and resilience case studies. Energy 2019, 184, 191–203. [Google Scholar] [CrossRef] [Green Version]
- Li, J.; Gao, G.; Ma, L.; Zhao, T.; Qu, H.; Chen, F. Analysis of profit models for cross-border power interconnection projects. Glob. Energy Interconnect. 2019, 2, 457–464. [Google Scholar] [CrossRef]
- Chen, C.; Liang, C.; Zhou, Y.; Wang, C.; Lu, J.; Xu, F. A multi-level evaluation model for the recognition and assessment of impact factors associated with intercontinental power interconnection projects. Glob. Energy Interconnect. 2020, 3, 30–42. [Google Scholar] [CrossRef]
- Liang, C.; Meng, J.; Chen, C.; Zhou, Y. A production-cost-simulation-based method for optimal planning of the grid interconnection between countries with rich hydro energy. Glob. Energy Interconnect. 2020, 3, 23–29. [Google Scholar] [CrossRef]
- Barrie, B.M. The Development of cross border interconnection and trading. Glob. Energy Interconnect. 2019, 2, 254–263. [Google Scholar] [CrossRef]
- Rafiee, A.; Qadrdan, M.; Jenkins, N. A data-driven approach to study the role of interconnectors in a future low-carbon electricity supply system. Int. J. Energy Res. 2020, 45, 379–395. [Google Scholar] [CrossRef]
- Available online: https://www.legislation.gov.uk/ukpga/2008/27/contents (accessed on 25 April 2021).
- Available online: https://www.gov.uk/government/consultations/the-future-of-uk-carbon-pricing (accessed on 15 March 2021).
- Haites, E. Carbon taxes and greenhouse gas emissions trading systems: What have we learned? Clim. Policy 2018, 18, 955–966. [Google Scholar] [CrossRef] [Green Version]
- Martin, R.; de Preux, L.B.; Wagner, U. The impact of a carbon tax on manufacturing: Evidence from microdata. J. Public Econ. 2014, 117, 1–14. [Google Scholar] [CrossRef] [Green Version]
- Rafiee, A. Assessing the impact of electricity interconnectors on the Great Britain’s power supply in 2030. J. Clean. Prod. 2020, 273, 122699. [Google Scholar] [CrossRef]
- Electricity Generation Costs. Available online: https://assets.publishing.service.gov.uk/government/uploads/system/uploads/attachment_data/file/911817/electricity-generation-cost-report-2020.pdf (accessed on 30 August 2020).
- NationalGrid. Future Energy Scenarios. Available online: https://www.nationalgrid.com/uk/electricity/market-operations-and-data/data-explorer (accessed on 11 February 2021).
- Elexon. Interconnectors. Available online: https://www.elexonportal.co.uk/news/latest?cachebust=796kys4ow3 (accessed on 30 August 2021).
- NationalGrid. Future Energy Scenarios. Available online: http://fes.nationalgrid.com/media/1363/fes-interactive-version-final.pdf (accessed on 21 September 2021).
- Abdin, Z.; Zafaranloo, A.; Rafiee, A.; Mérida, W.; Lipiński, W.; Khalilpour, K.R. Hydrogen as an energy vector. Renew. Sustain. Energy Rev. 2020, 120, 109620. [Google Scholar] [CrossRef]
- Akinyele, D.; Rayudu, R. Review of energy storage technologies for sustainable power networks. Sustain. Energy Technol. Assess. 2014, 8, 74–91. [Google Scholar] [CrossRef]
- Khan, N.; Dilshad, S.; Khalid, R.; Kalair, A.R.; Abas, N. Review of energy storage and transportation of energy. Energy Storage 2019, 1, e49. [Google Scholar] [CrossRef]
- Ziaei, M.; Panahi, M.; Fanaei, M.A.; Rafiee, A.; Khalilpour, R. Maximizing the profitability of integrated Fischer-Tropsch GTL process with ammonia and urea synthesis using response surface methodology. J. CO2 Util. 2019, 35, 14–27. [Google Scholar] [CrossRef]
- Ye, R.-P.; Ding, J.; Gong, W.; Argyle, M.; Zhong, Q.; Wang, Y.; Russell, C.K.; Xu, Z.; Russell, A.G.; Li, Q.; et al. CO2 hydrogenation to high-value products via heterogeneous catalysis. Nat. Commun. 2019, 10, 5698. [Google Scholar] [CrossRef] [Green Version]
- Saeidi, S.; Amin, N.A.S.; Rahimpour, M.R. Hydrogenation of CO2 to value-added products—A review and potential future developments. J. CO2 Util. 2014, 5, 66–81. [Google Scholar] [CrossRef]
- Borisut, P.; Nuchitprasittichai, A. Methanol Production via CO2 Hydrogenation: Sensitivity Analysis and Simulation—Based Optimization. Front. Energy Res. 2019, 7. [Google Scholar] [CrossRef] [Green Version]
- Chiang, C.-L.; Lin, K.-S.; Chuang, H.-W. Direct synthesis of formic acid via CO2 hydrogenation over Cu/ZnO/Al2O3 catalyst. J. Clean. Prod. 2018, 172, 1957–1977. [Google Scholar] [CrossRef]
- Rafiee, A.; Khalilpour, K.R.; Milani, D. Chapter 8—CO2 Conversion and Utilization Pathways. In Polygeneration with Polystorage for Chemical and Energy Hubs; Khalilpour, K.R., Ed.; Academic Press: Cambridge, MA, USA, 2019; pp. 213–245. [Google Scholar]
- Rafiee, A.; Khalilpour, K.R.; Milani, D.; Panahi, M. Trends in CO2 conversion and utilization: A review from process systems perspective. J. Environ. Chem. Eng. 2018, 6, 5771–5794. [Google Scholar] [CrossRef]
- Rafiee, A.; Hillestad, M. Optimal design and operation of a gas-to-liquid process. Chem. Eng. Trans. 2010, 21, 1393–1398. [Google Scholar]
- Rafiee, A.; Khalilpour, K.R. Chapter 11—Renewable Hybridization of Oil and Gas Supply Chains. In Polygeneration with Polystorage for Chemical and Energy Hubs; Khalilpour, K.R., Ed.; Academic Press: Cambridge, MA, USA, 2019; pp. 331–372. [Google Scholar]
- Miguel, C.V.; Soria, M.A.; Mendes, A.; Madeira, L.M. Direct CO2 hydrogenation to methane or methanol from post-combustion exhaust streams—A thermodynamic study. J. Nat. Gas Sci. Eng. 2015, 22, 1–8. [Google Scholar] [CrossRef] [Green Version]
Figure 1.
Contribution of generation technologies in power supply (%) vs. CO2 tax and the IC1 import price over 2030.
Figure 1.
Contribution of generation technologies in power supply (%) vs. CO2 tax and the IC1 import price over 2030.

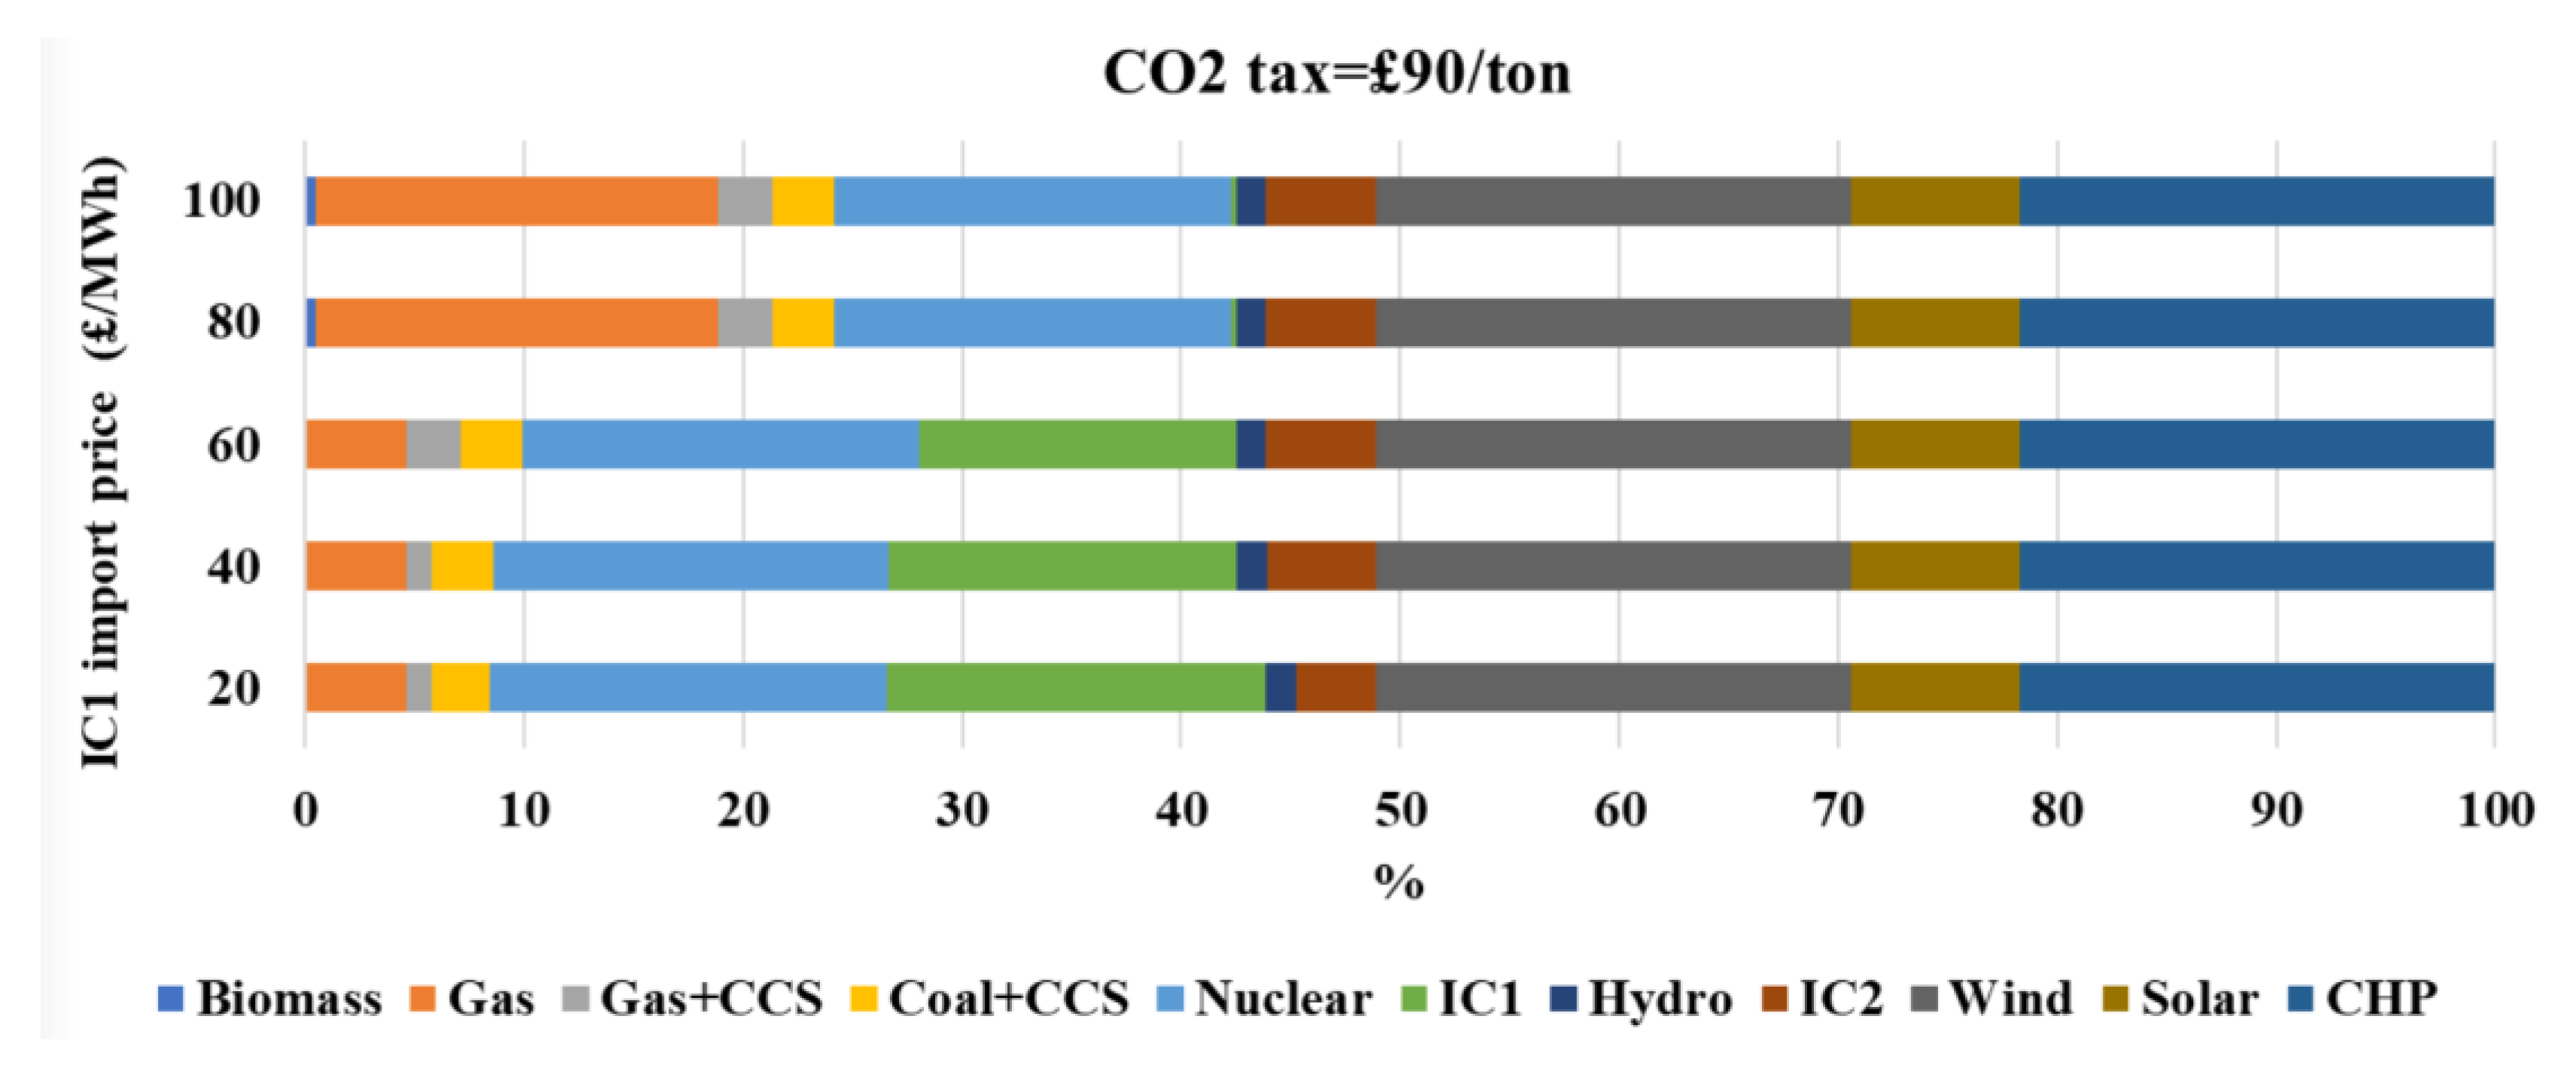
Figure 2.
Capacity factor of GB’s power generators vs. IC1 import price and CO2 tax.

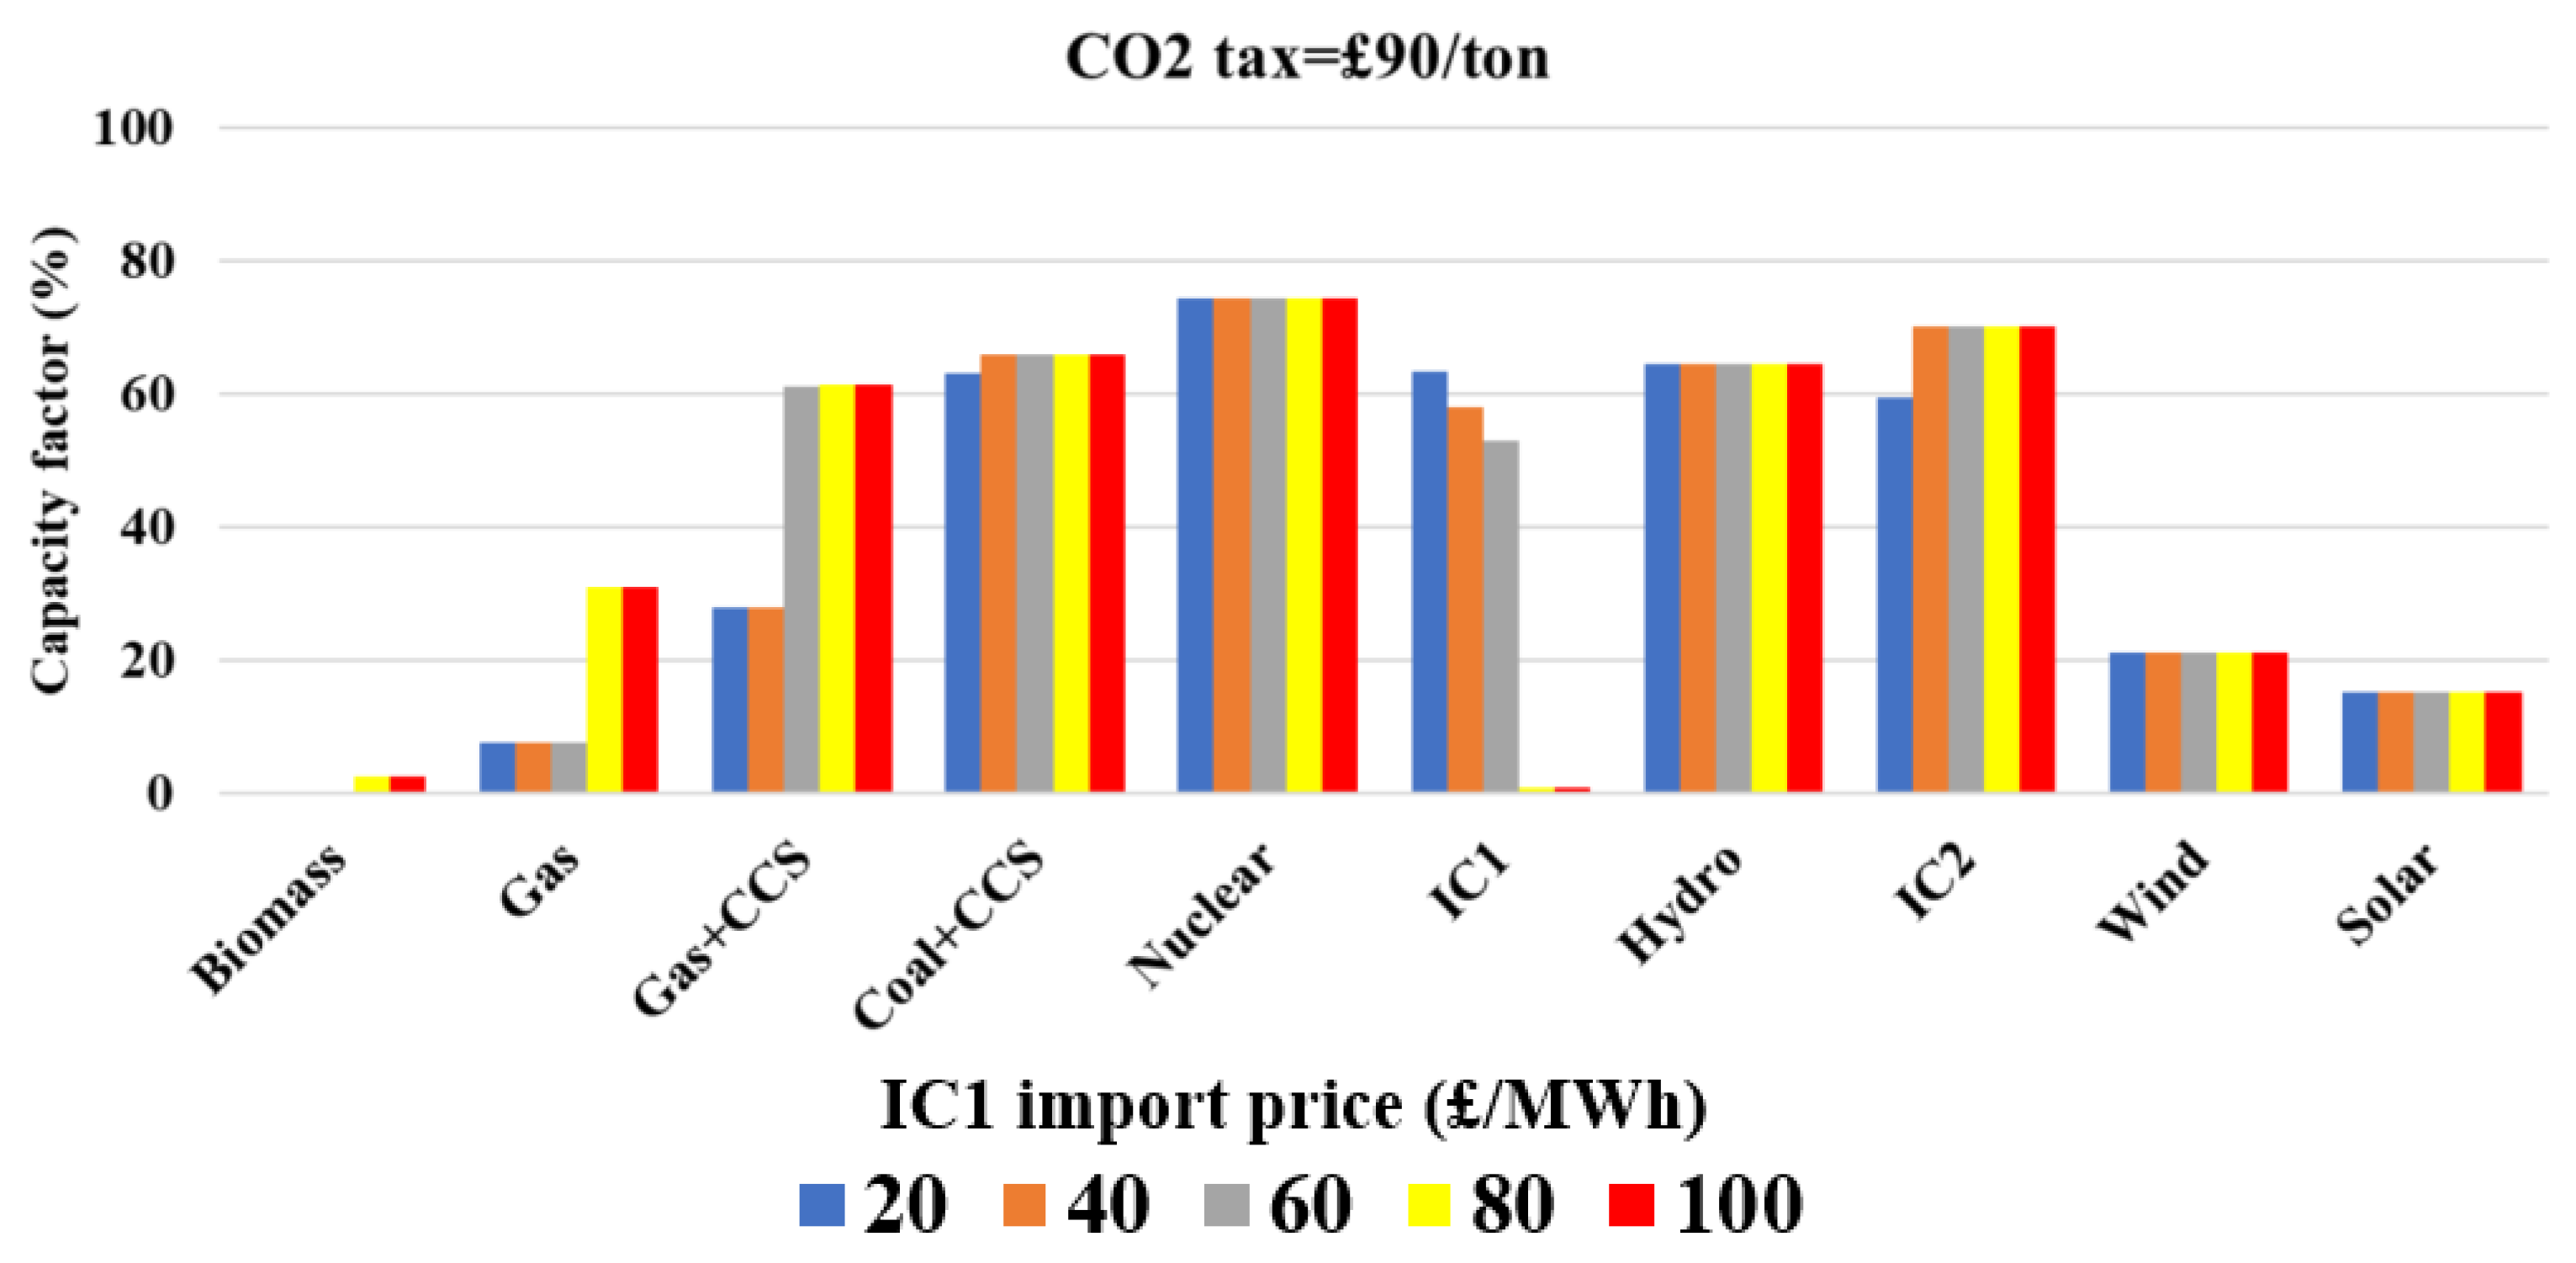
Figure 3.
Impact of CO2 tax on the total electricity flow from/to GB within 2030: (a) electricity flow from GB to France via IC2 link, (b) power import from France via IC2 link.
Figure 3.
Impact of CO2 tax on the total electricity flow from/to GB within 2030: (a) electricity flow from GB to France via IC2 link, (b) power import from France via IC2 link.

Figure 4.
Percentage of times that the IC2 power link is fully loaded during 2030.
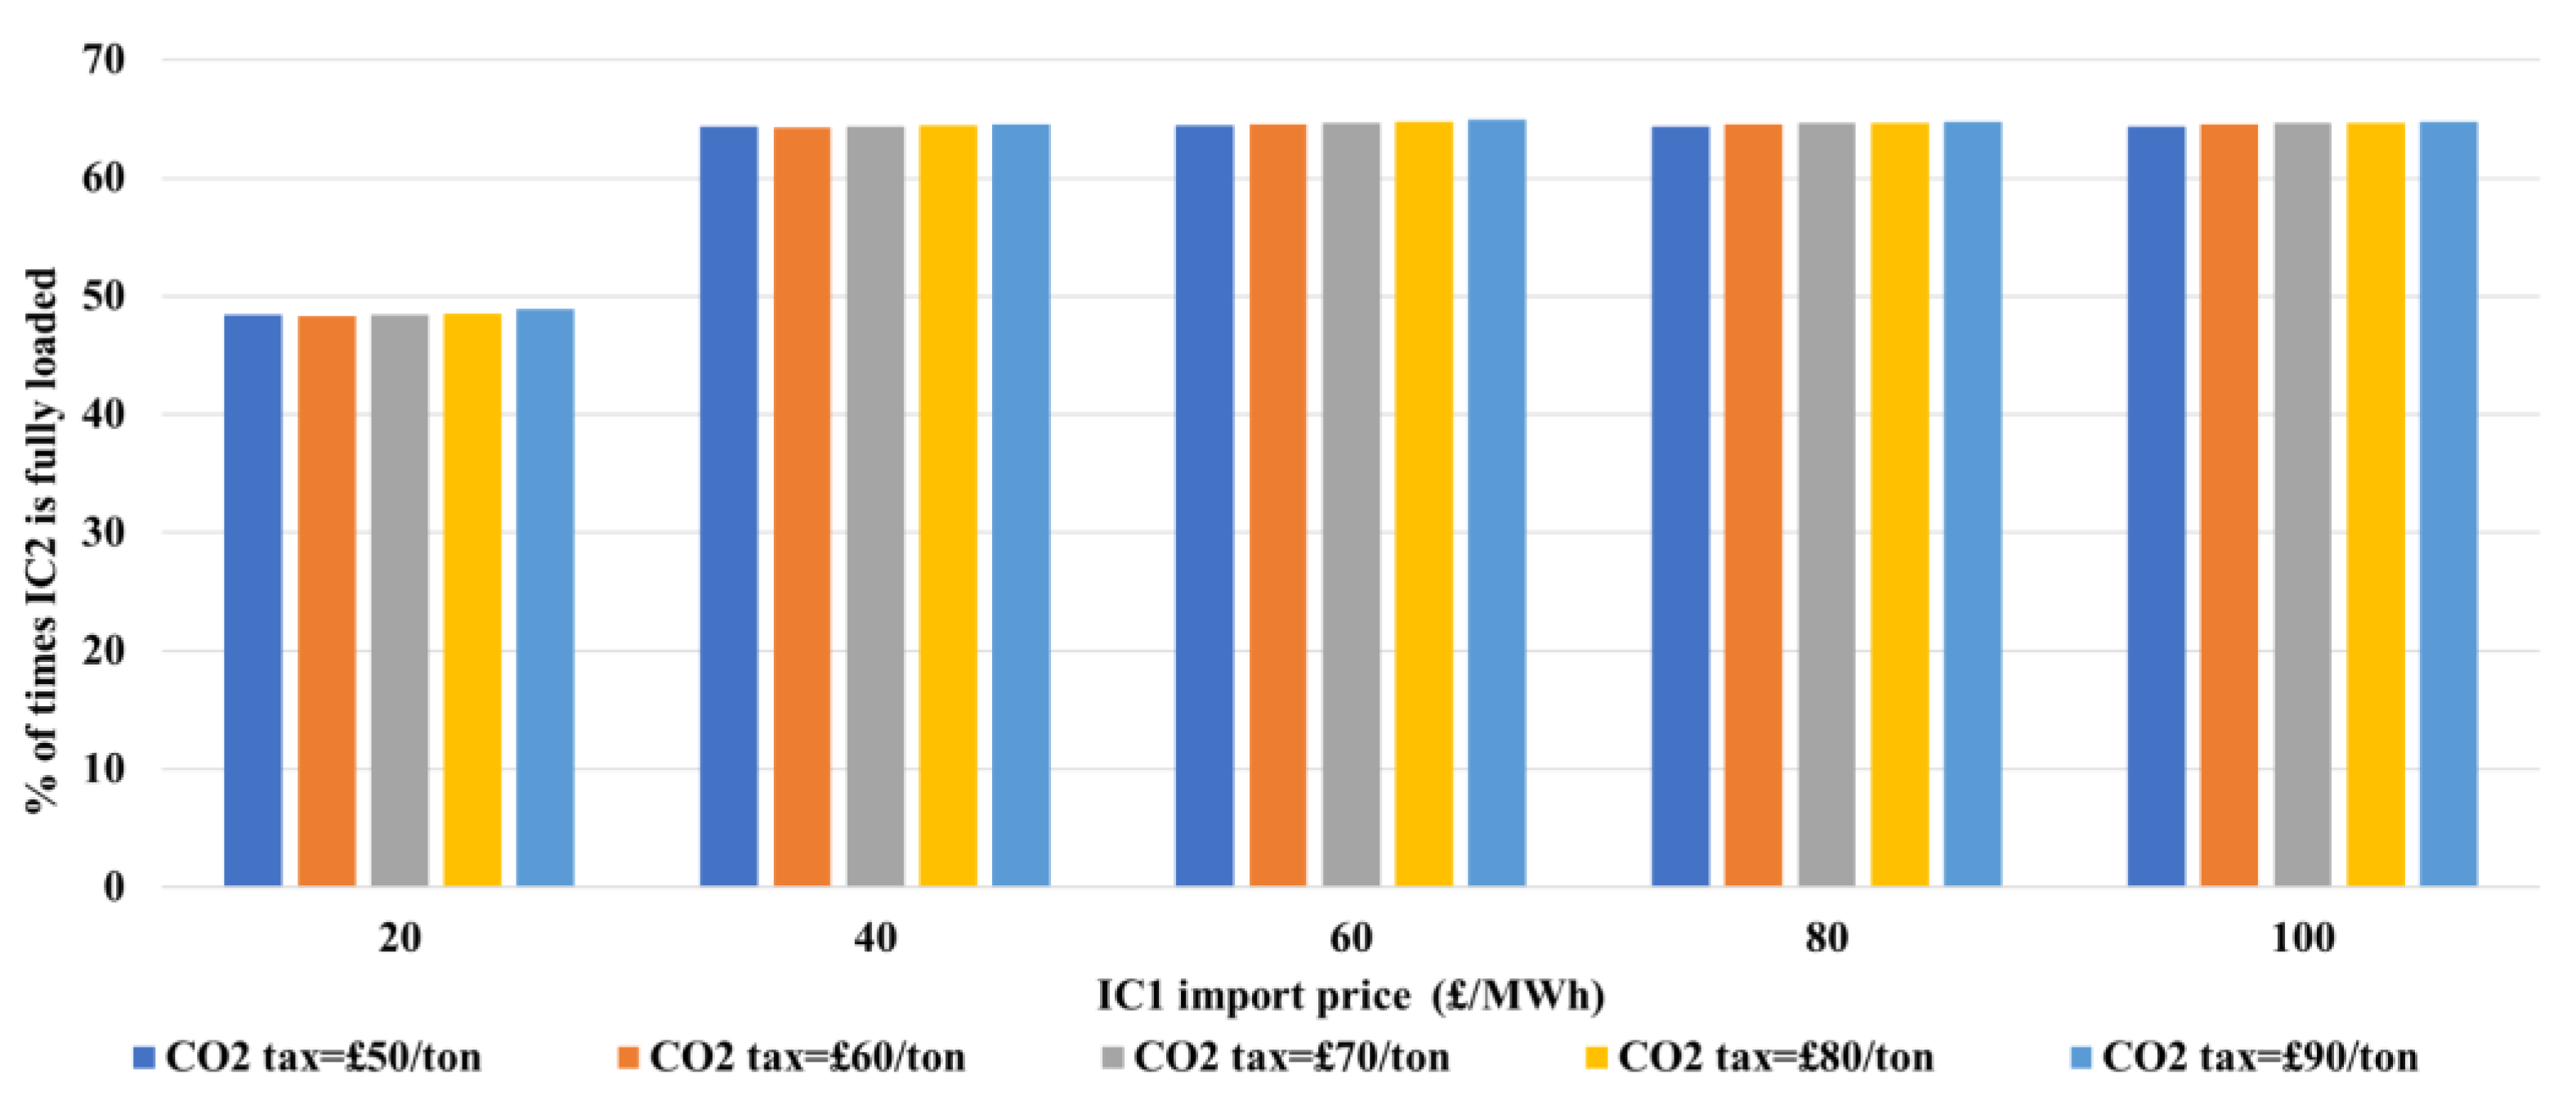
Figure 5.
Minimum and maximum shedding and maximum IC1 load when the IC2 is receiving a full load.

Figure 6.
CO2 emission of GB’s power system in 2030 versus the CO2 tax and IC1 import price.


Table 1.
Paraments of generators [17].
Table 1.
Paraments of generators [17].
| Power Production Technology | Marginal Generation Cost (£/MWh) | |
|---|---|---|
| Fuel + O&M, [23] | Emission 1 | |
| (1) Combined cycle gas turbine without CCS | 39 | 16.7–30.0 |
| (2) Combined cycle gas turbine with CCS | 39 | 1.8–3.3 |
| (3) CCS equipped coal-fired plants | 10 | 4.8–8.6 |
| (4) Nuclear plants | 10 | 0 |
| (5) Hydropower | 0 | 0 |
| (6) Cross-border interconnector 1 (IC1) | 20–100 | 0 |
| (7) biomass -fired | 73 | 0 |
| (8) GB-France interconnector (IC2) | 0 | |
| (9) Solar photovoltaics (PVs) | 0 | 0 |
| (10) Wind farms | 0 | 0 |
Publisher’s Note: MDPI stays neutral with regard to jurisdictional claims in published maps and institutional affiliations. |
© 2021 by the authors. Licensee MDPI, Basel, Switzerland. This article is an open access article distributed under the terms and conditions of the Creative Commons Attribution (CC BY) license (https://creativecommons.org/licenses/by/4.0/).
Share and Cite
MDPI and ACS Style
Rafiee, A.; Karimi, M.; Safari, A.; Abbasi Talabari, F. The Future Impact of Carbon Tax on Electricity Flow between Great Britain and Its Neighbors until 2030. Appl. Sci. 2021, 11, 10460. https://doi.org/10.3390/app112110460
AMA Style
Rafiee A, Karimi M, Safari A, Abbasi Talabari F. The Future Impact of Carbon Tax on Electricity Flow between Great Britain and Its Neighbors until 2030. Applied Sciences. 2021; 11(21):10460. https://doi.org/10.3390/app112110460
Chicago/Turabian StyleRafiee, Ahmad, Mehdi Karimi, Amir Safari, and Fahimeh Abbasi Talabari. 2021. "The Future Impact of Carbon Tax on Electricity Flow between Great Britain and Its Neighbors until 2030" Applied Sciences 11, no. 21: 10460. https://doi.org/10.3390/app112110460
Note that from the first issue of 2016, this journal uses article numbers instead of page numbers. See further details here.