Article

Research Concerning the Bending Properties of Reconstituted Spruce Lumber Boards, Obtained by Edge-Cutting at 45° and Gluing

Faculty of Furniture Design and Wood Engineering, Transilvania University of Brasov, B-dul Eroilor nr. 29, 500036 Brasov, Romania
*
Author to whom correspondence should be addressed.
Appl. Sci. 2021, 11(21), 9937; https://doi.org/10.3390/app11219937
Submission received: 28 September 2021 / Revised: 19 October 2021 / Accepted: 21 October 2021 / Published: 25 October 2021

Abstract

:
The best-possible valorization of each cut log is a priority. The aim of this research was to evaluate the potential of a solution for increasing the conversion efficiency of tapered logs, by edge-cutting the narrowest sideboards at 45° and joining them by gluing, in order to obtain usable lumber boards. The modality of obtaining the glued elements was described and the values of the density and bending properties (MOE and MOR) of these elements compared to solid wood elements taken from the same logs and the same position within each log was determined. The envisaged outcome was to determine if the bonded products are suited to be used as cores within laminated products for construction.

1. Introduction

The conversion efficiency of sawlogs into lumber is one of the most important business and production indicators for the wood industry. Resource saving production is becoming a more and more important issue, not only for environmental reasons but also for financial reasons, considering that the costs of raw materials significantly affect the costs of lumber production.
The log conversion efficiency strongly depends on the log diameter and its length, the eventual shape deviations (e.g., taper and curvature), the log quality (cracks, discolorations, fungal and/or beetle attack), the kerf width, the condition and maintenance of the grading and cutting equipment, the sawing pattern and the required product mix, the sawing method, etc. [1].
The target for sawmills is to obtain the highest percentage of lumber from each cut log, at the best possible quality, so as to ensure a high profit. Cutting tools and machinery must be up-to-date to achieve maximum yield and to supply the further processing chain with the best raw materials. Next to optimal tools and tool geometry (e.g., optimal sawblade thickness), perfectly configurated production lines are needed. Three-dimensional-infrared scanners and X-ray computed tomography [2] are used to find the maximum information about the raw material and to determine the optimal position for the logs before entering the cutting line. In this way, it is possible to identify wood defects (e.g., cracks, resin pockets, knots, and shape deviations) before the cutting processes and to establish the log position that would eliminate them but still reach the highest possible yield and targeted product quality.
The visual appearance of the final wood surface is also important and requires the best quality logs and a suitable cutting pattern. The problem is that these logs are not always available in large quantities. Foresters must manage to harvest all logs damaged by beetles, wind, and snow, while fresh and healthy logs are becoming increasingly rare. Thus, solutions for increasing log conversion efficiency represent a topic of great interest.
At present, big size sawmills do not take into account the taper value when presorting the logs. With strongly tapered logs this leads to significant volume loss. Experimental tests previously performed [3] showed that the conversion efficiency of processing fir roundwood into debarked sawlogs ranged between 67% and 85%, the lowest values being recorded for the most tapered pieces of roundwood (1.6 cm/m). At present, sawmills do not account for the taper value of the logs. This means that the logs are sorted into a box depending only on their quality, length, species, and top diameter, leading to an incomplete valorization of the wood volume of tapered logs when the tapered part falls into the “firewood” box.
Considering the above-mentioned factors, the main objective of the present paper was to evaluate the effects of edge-gluing together, under an angle around 45°, the mirrored sideboards from tapered logs (having variable width along their length), after a double rotation, in order to valorize this wood as well. The target is for structural uses within laminated products for construction (e.g., CLT or Glulam).
Structural wood elements, such as the ones used in construction or mines, are frequently subjected to static bending stresses that may be concentrated or distributed. An increasing load leads, first, to the bend of the element and, when a certain critical value is exceeded, the element breaks. Therefore, with structural elements, it is essential to know the limits of the material in terms of the modulus of rupture in bending (MOR) and the modulus of elasticity in bending (MOE), which are closely correlated with the material density (ρ), one of the most quality indicators of the wooden material.
These three properties were chosen to be determined within the present research for this reason.
The variability of the mechanical properties of wood is usually estimated by the correlation between wood density and strength. This approach is perfectly justified as it practically comes from the correlation between the strength of wood and its anatomical structure. In this regard, there are studies that focused on monitoring the variability of density and mechanical properties of softwood in cross-section [4]. For most species, the wood strength increases with increasing wood density, regardless of the type of stress [5]
Reference [6] indicates the density, MOR, and MOE values for solid spruce wood as given in Table 1. More detailed information concerning the distribution of density over the tree height and over its cross-section is provided, e.g., by [7,8,9,10]. It is revealed that with spruce, the density varies only very little over the tree height [7] and that it decreases from bark to pith. This is due to the increasing width of the annual rings from the outer zone toward the core zone, which also involves a decrease in the proportion of latewood, and of the tracheids with thick walls, respectively [9].
Joining two pieces of wood by means of gluing affects the strength of the element. Both the type of the joint (angle and shape under which the cutting is performed) and the glue type influence the material density, elasticity, and strength. Testing wood joints in bending was previously done and reported in literature, e.g., [11,12,13], but no reference regarding the bending behavior of edge-joints at 45° was found in the literature.
An interesting study investigated the dimensional stability and delamination strength of lumber boards reconstituted from star-sawn and glued elements [14]. However, the cutting pattern (radial cutting of the whole log) is completely different in this case, and it involves a quite complicated technology. Additionally, the products obtained after gluing have no orthogonal edges, so they must undergo several operations until the prismatic shape is achieved.
This emphasizes the novelty and advantages of the solution proposed by the authors of the present research, which:
-
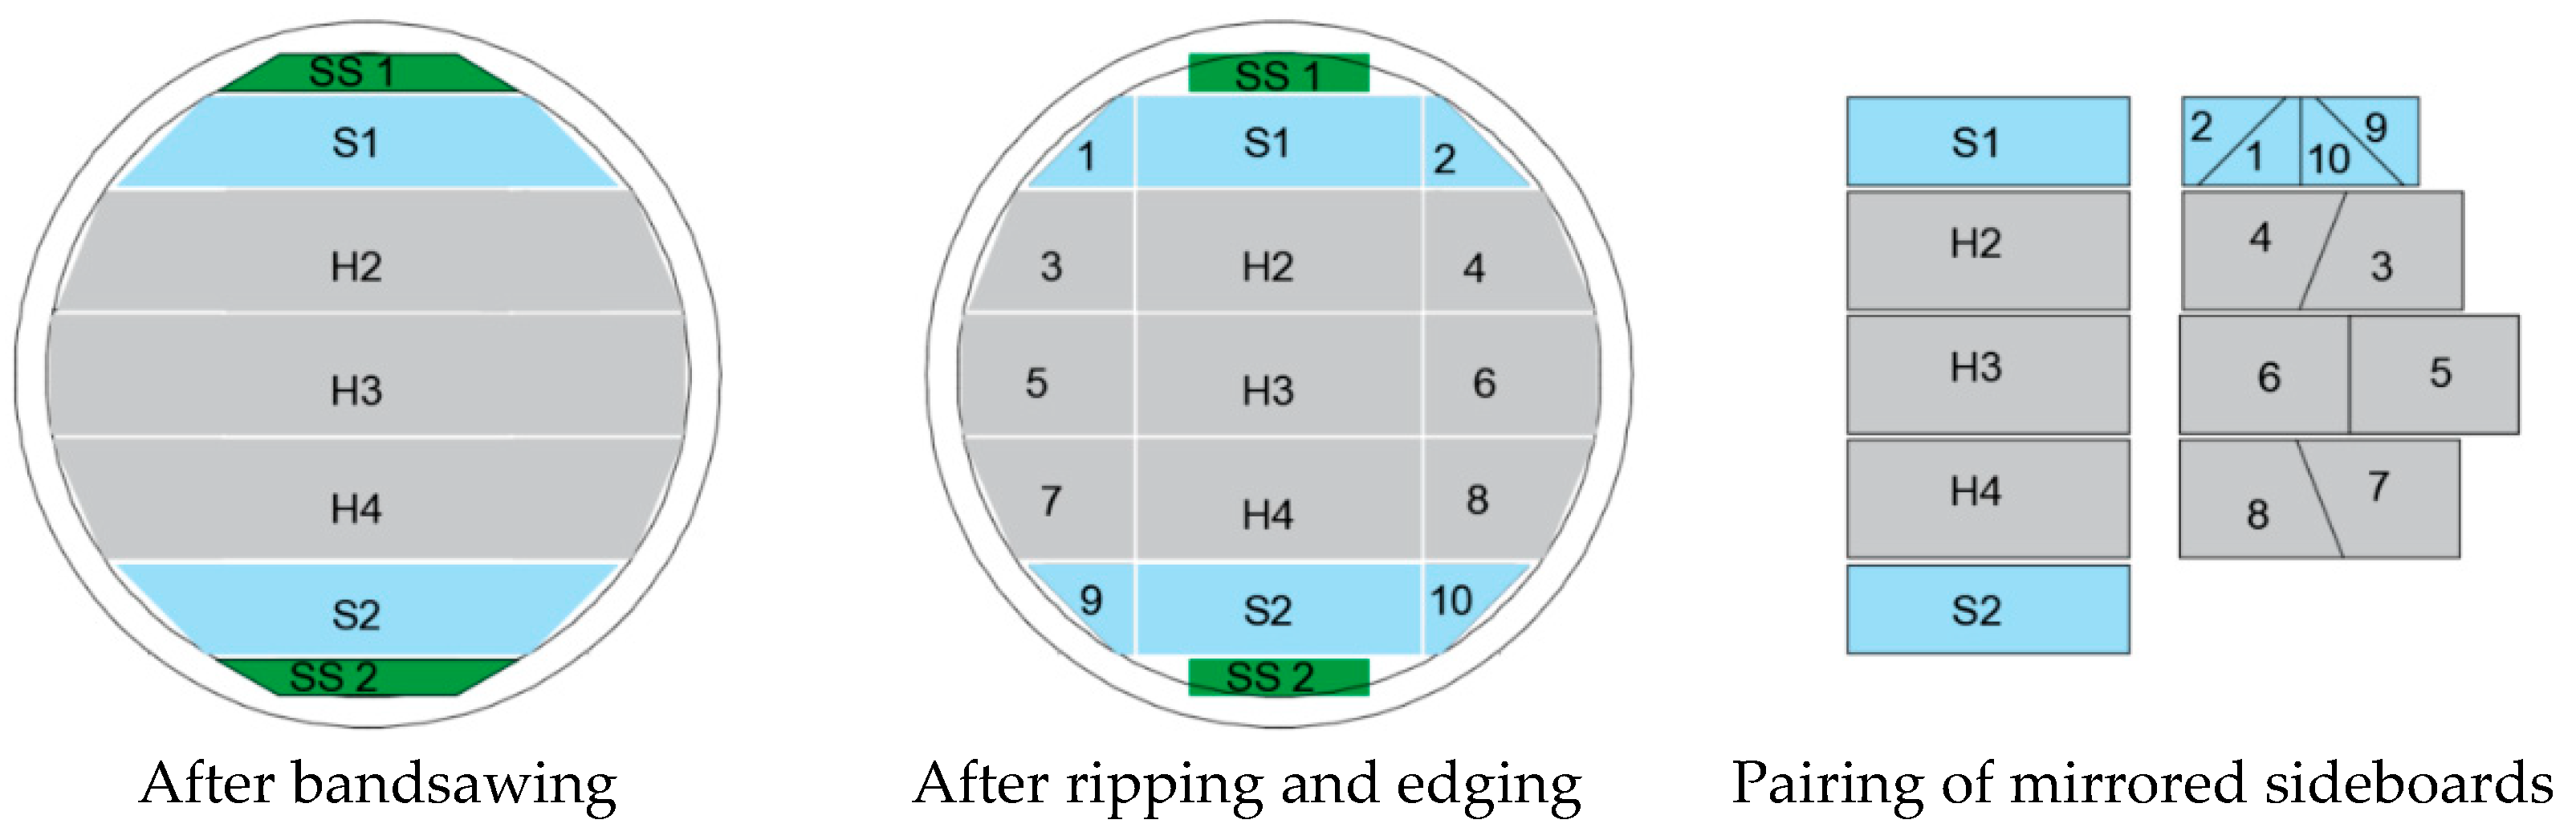
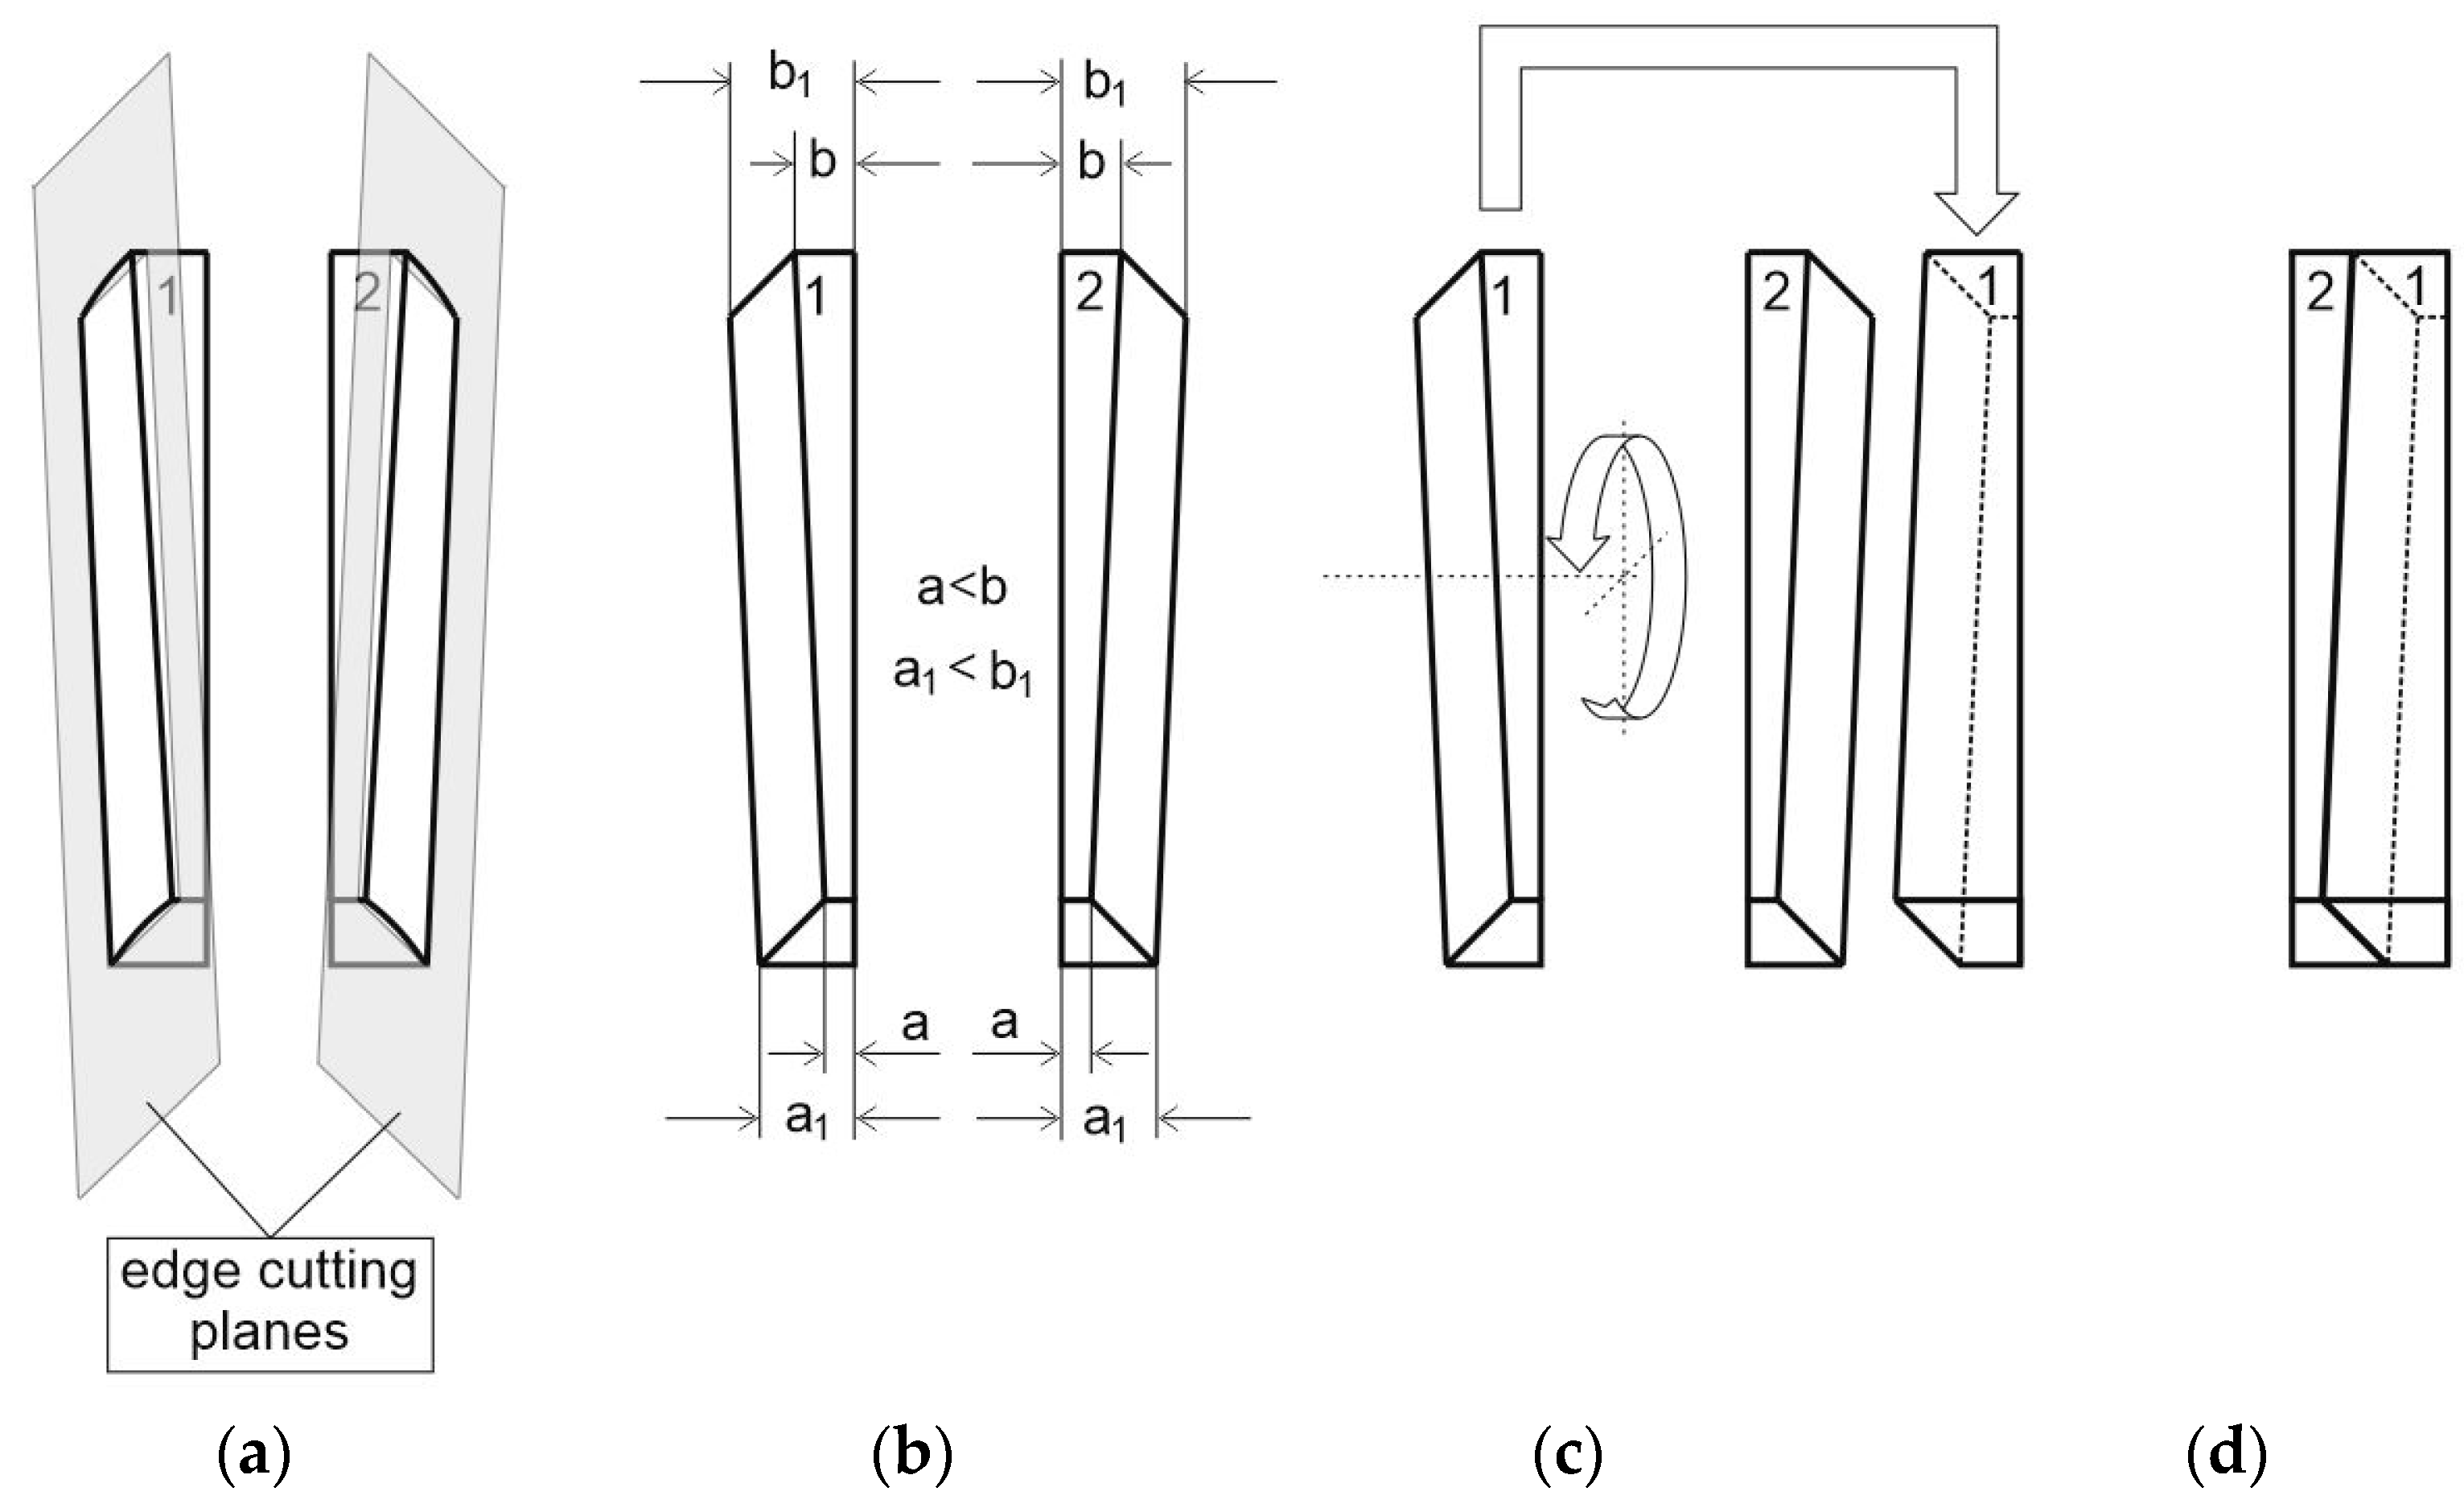
Uses the existing technology while requiring only a supplementary circular saw with inclinable blade (to perform the cutting at 45°);
-
Allows valorizing sideboards with variable width (which is not possible in any other way);
-
Allows for obtaining directly prismatic products from these sideboards; and
-
Ensures good dimensional stability of the reconstituted boards due to the mirrored position of the sideboards.

2. Materials and Methods

2.1. Materials

2.1.1. Material Preparation

Two spruce logs (Picea abies L.) having the dimensions given in Table 2 were turned into lumber boards by means of a bandsaw and then sectioned at half length (Figure 1), in order to assess eventual differences of MOR and MOE depending on the position within the tree (lower log vs. upper log).
Then, the unedged boards were converted by means of a circular saw into main boards (H2, H3, H4) having a thickness of 40 mm, and sideboards (S1, S2, 1, 2,…9, 10) with a thickness of 30 mm (Figure 2).
The boards were kiln-dried down to a target moisture content of 12% in a conventional drying kiln type ZLSM4160 (year 2016) by Mühlböck (Austria). After drying, their moisture content was checked by means of a capacitive moisture-meter type DM4A by Doser (Germany) to ensure that all boards had a moisture content of 12 ± 3% before being glued.
The mirrored sideboards (e.g., 2 and 1, 4 and 3, 8 and 7, 9 and 10 in Figure 2) were edge-cut at an angle of 45°, then rotated at 180° (Figure 3) and glued (Figure 4), by means of a polyurethane-type adhesive type Loctite HB S049 by Henkel & Cie. AG (Pratteln, Switzerland). The boards had a surface temperature of about 22 ± 2 °C, and the ambient temperature in the workshop was 24 °C. The adhesive application rate was 180 g/m2, pressing pressure was 0.6 N/mm2 and curing time 10 min.
All boards were then shipped to the testing laboratory, where they were conditioned for 2 weeks in an environment with 20 ± 2 °C and 65 ± 5% relative air humidity, according to ISO 3129:2012 [15], in order to prepare them for sample cutting. Before cutting the test samples, the moisture content of the test boards was checked once again by means of a MERLIN HM-WS capacitive moisturemeter. The measurement revealed values of 9.4–12.4% for the main (core and middle) solid wood boards, 12.6–13.9% for the solid wood sideboards, and 11.2–12.6% for the glued boards.

2.1.2. Sampling

After being conditioned, the test samples for static bending (20 × 20 × 340 mm) were cut out according to standard requirements [16,17], both from the glued and from the solid wood boards. The test samples were noted so as to recognize from exactly which log and from which part of the log (in length and cross section) each sample originated.
In order to enable a fair comparison between samples originating from different parts of the tree, some being bonded and some being solid, the density (ρ12) of each sample was determined as the ratio between the mass and the volume, with an accuracy of 0.001 kg/m3.

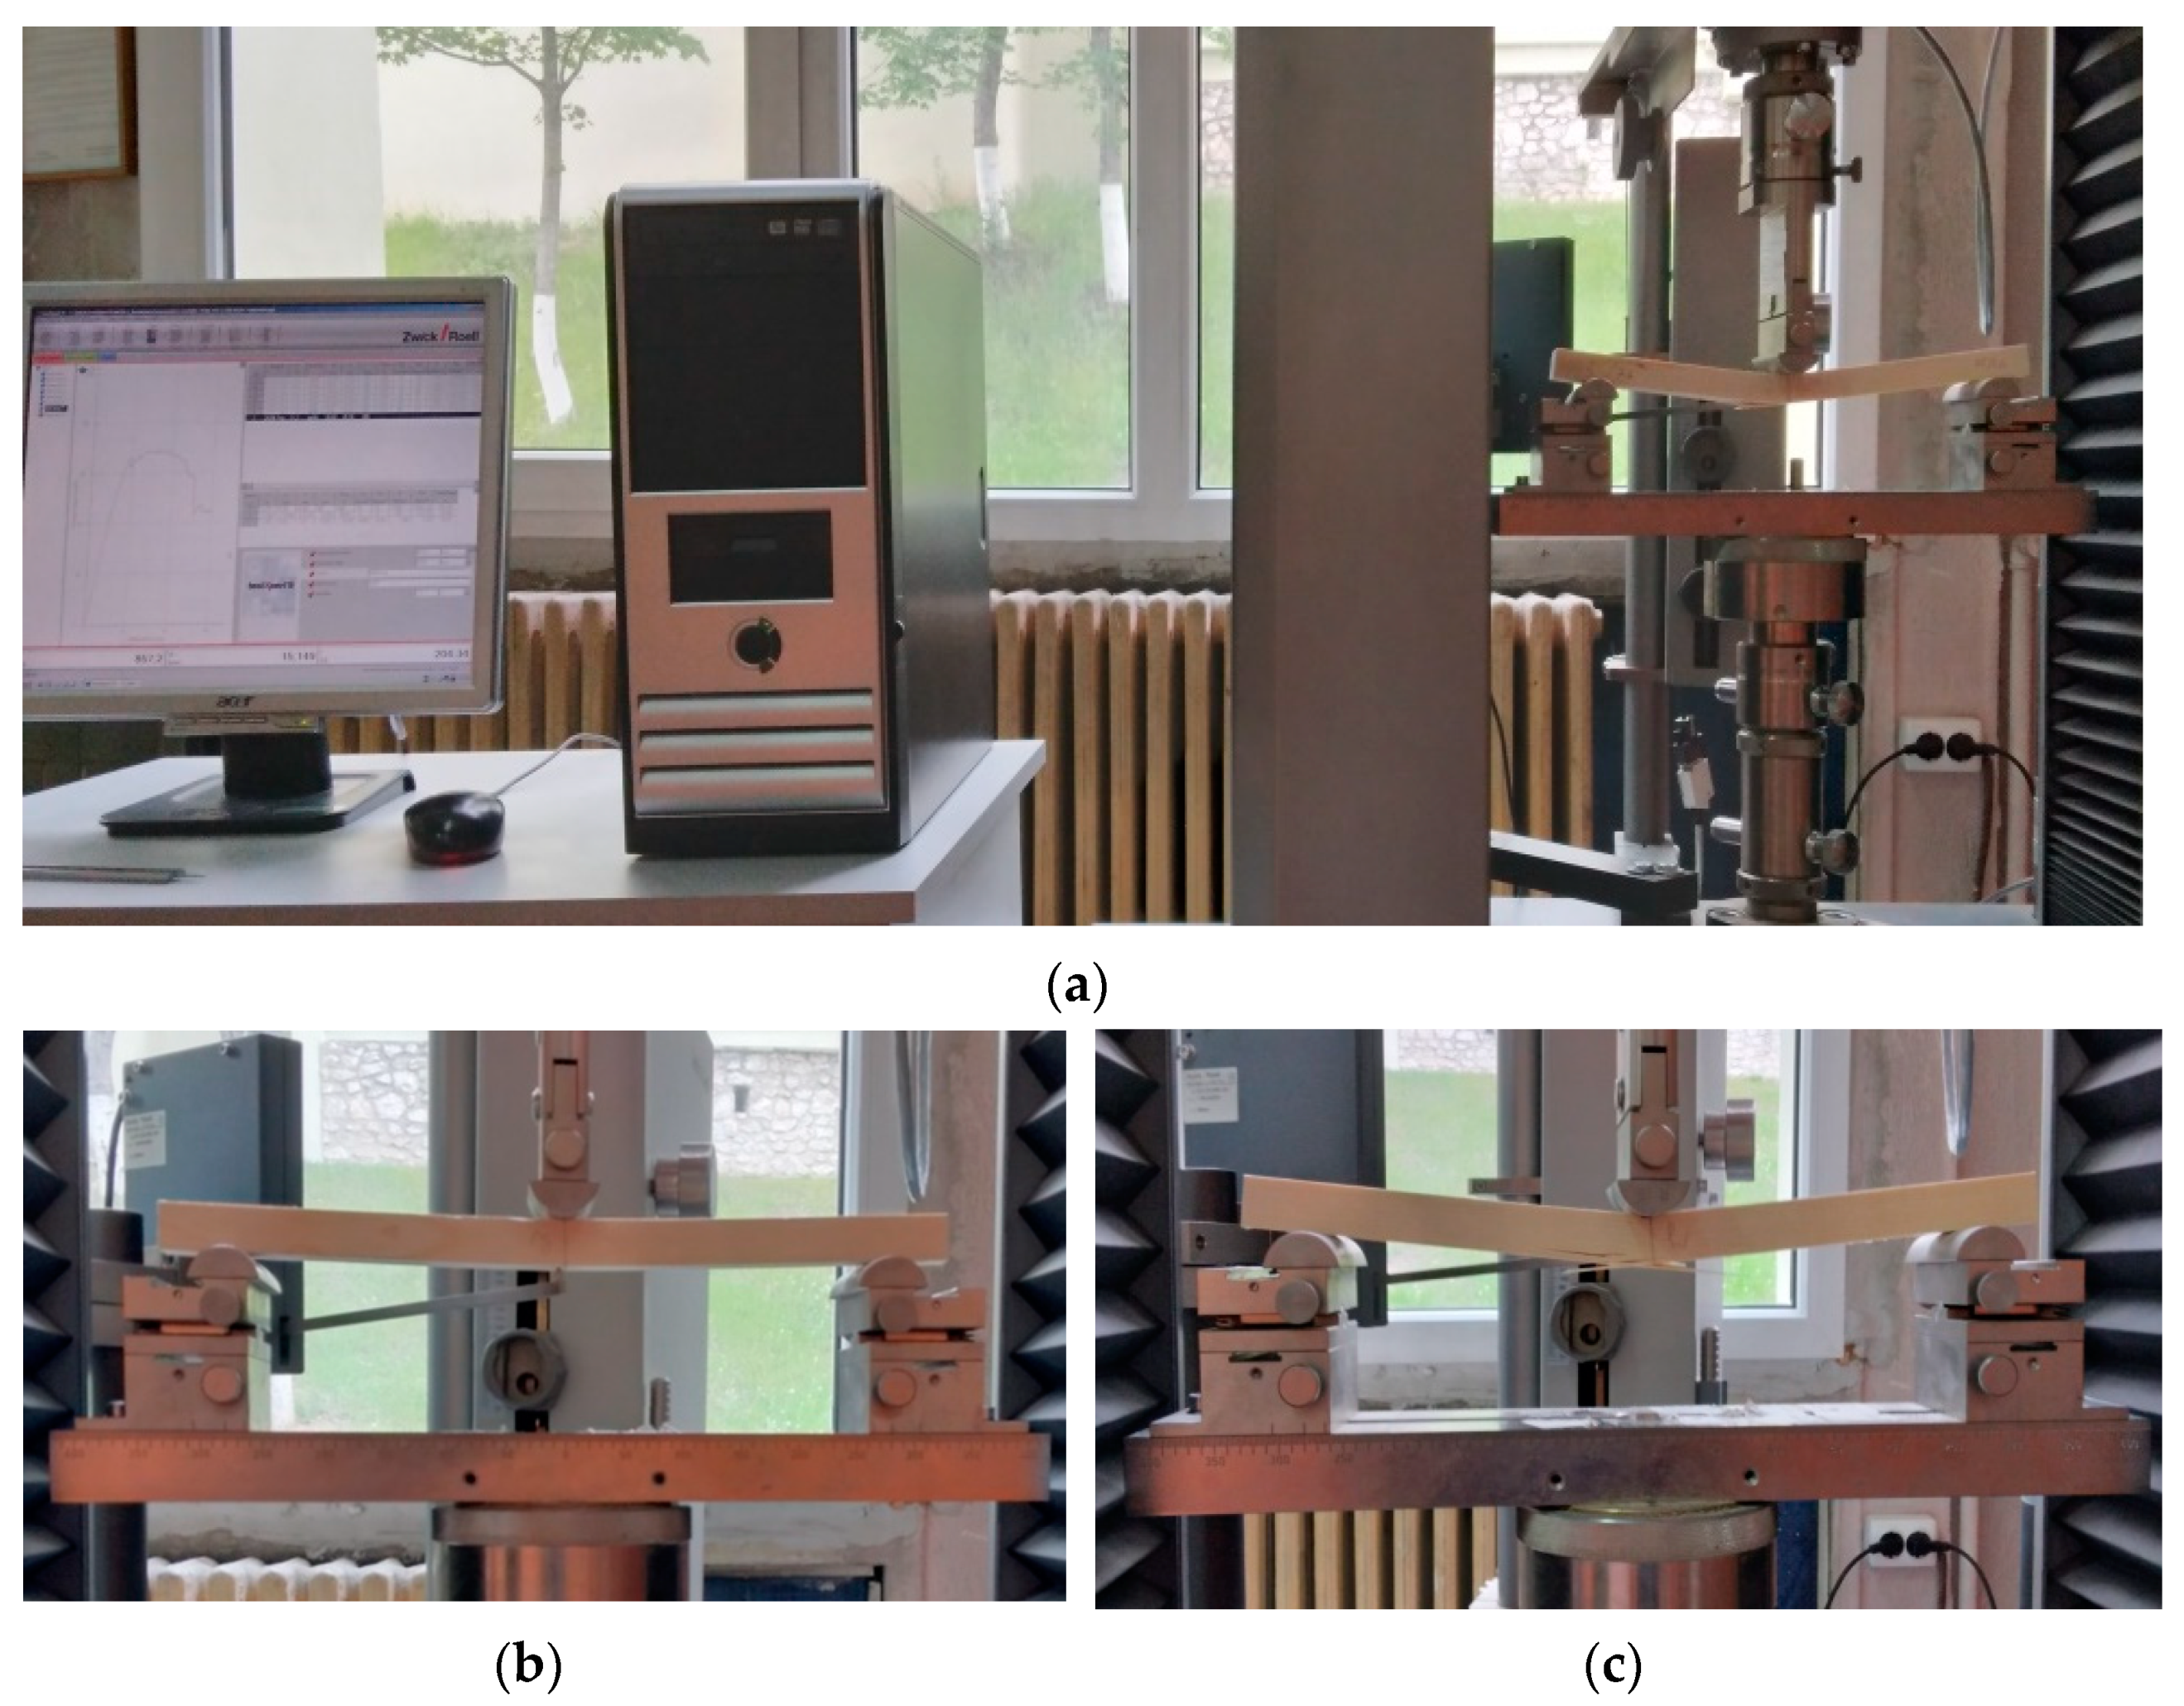
2.2. The Bending Test

The bending strength (MOR) and modulus of elasticity in bending (MOE) were determined according to ISO 13061-3 [16] and ISO 13061-4 [17]. The test was performed by means of a ZWICK/ROELL equipment type BT1FB050TN.D30/2007 (Figure 5a), endowed with a device (support) for positioning the specimen (the two bearings being situated at a distance of 280 mm), a device for applying the load, and a deflection-measuring device. The MOE determination (Figure 5b) consists of measuring the deformation of the specimen at mid-length during the application of progressively increasing force within the region of proportionality between the load and the deflection, while the MOR determination (Figure 5c) consists of measuring the maximum load required to break the specimen under a static load applied transversely in the middle of the simply supported specimen. The MOE and MOR measurements used the same samples.
The force was applied radially on half of the samples originating from the solid wood boards (Figure 6a) and tangentially (Figure 6b) on the other half, with a view to compare the values obtained for the bonded boards with both cases, considering that in the case of the glued boards, the force direction relative to the annual rings could be neither radial nor tangential (Figure 6c). A total of 48 glued samples (12 from each half log) and a total of 120 solid wood samples (15 radially + 15 tangentially loaded, from each half log) were used in the experiment.
The machine software records and displays all measured data automatically. A data correction depending on the real moisture content was performed in order to assess ρ12, MOE12, and MOR12.
Then, the collected data were statistically analyzed by means of one-way ANOVA. The statistical test was performed by means of the Microsoft Excel and Data Analysis Tool Pack. First, a characterization of the three properties, variation in log length, and cross-section was undertaken. Then, for each log, the mean MOE and MOR values obtained for the bonded samples were compared to the mean values obtained for the solid wood samples from the same log, and then from both logs all together. In order to have a fair comparison, only the values for the outer zone were taken into account for the solid wood samples (considering that the bonded boards were all achieved from material originating from the outer area of the logs). The final outcome was to evaluate if there are significant differences between the bonded elements and the solid wood elements in terms of MOE and MOR.

3. Results and Discussion

Table 3 presents the results regarding the density of the samples taken both from the solid boards and from the glued boards. For the solid wood samples, the values are given separately for the tangentially and radially loaded samples in order to facilitate the upcoming correlation to the bending test results presented in Table 4 (MOE12) and in Table 5 (MOR12).
By analyzing the results presented in Table 3, Table 4 and Table 5, the following were observed:
  • The values obtained within this research for the solid wood samples are in good accordance with the values from reference literature (given in Table 1); the density of solid wood increases from core to outer zone due to the fact that the annual rings become narrower, and the proportion of earlywood decreases;
  • The comparative results concerning the influence of the load direction relative to the annual rings (tangential load vs. radial load—see Table 4 and Table 5) for the solid wood samples shows that the tangential load leads to 10% higher values of MOE and MOR compared to the radial loading; this can be explained by the much lower number of pits in the tangential than in the radial walls of the tracheids, which makes resinous wood more resistant to tangential loads;
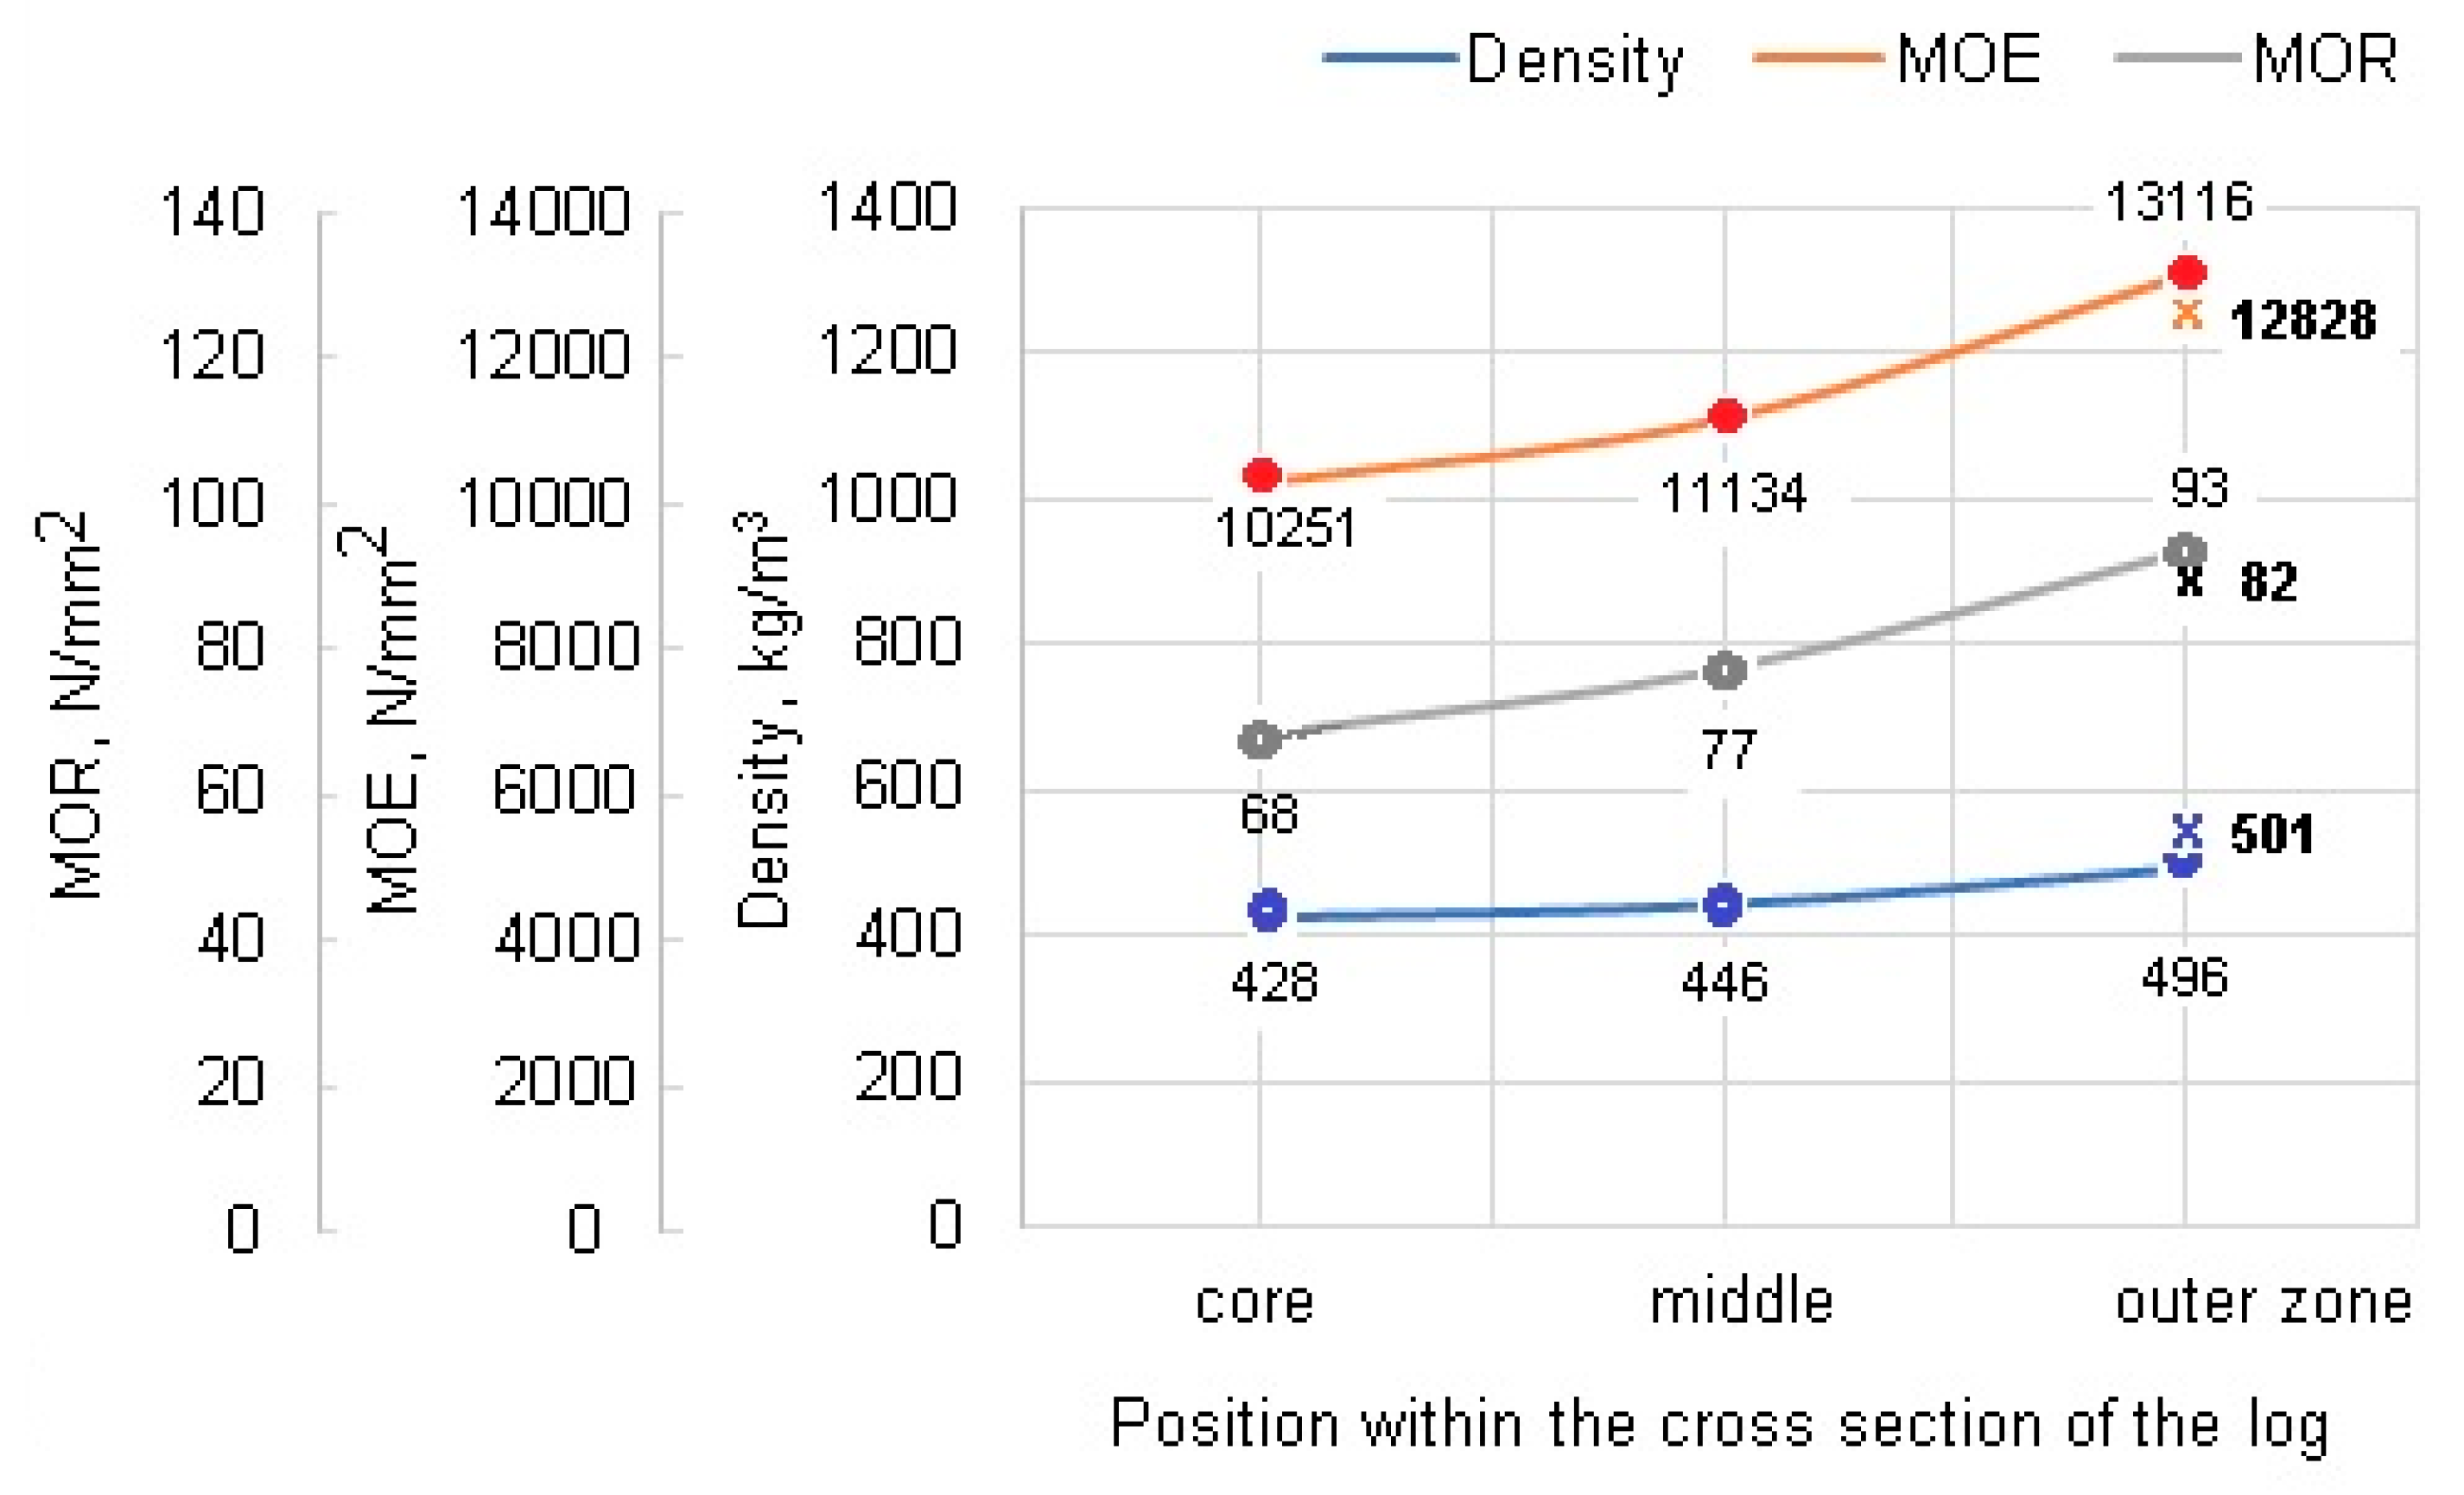
  • A good correlation between the density and the bending properties of the solid wood samples was noticed, as mentioned in reference [7]: the bending properties increased with increasing density from the central part of the log towards the outer area, as illustrated in the example given in Figure 7, based on the data obtained from Log N°1 samples, tangentially loaded; dissimilarly, the glued samples (represented with “x” and bold values in Figure 7) had lower bending properties despite having higher density (due to the presence of the adhesive);
  • As far as the influence of the position within the tree height is concerned, no major difference was noticed between the values obtained from the butt logs compared to the top logs for the density of the solid wood samples, which is also in good accordance with data from reference [7]; the MOR and MOE values for solid wood are less uniform; there is a clear decreasing tendency of both parameters from butt to top, as illustrated in the example given in Figure 8, based on the data obtained from Log N°1 samples, radially loaded; the glued samples obtained from the same log (represented with “x” in Figure 8) showed very close density, lower MOR and MOE at the butt, and visibly higher MOR and MOE at the top, compared to the solid wood samples.
Referring to the glued samples, the breaking always occurred in wood. The glue line was not affected.
The comparison between the density, MOR and MOE values obtained for the glued samples (all made from outer area wood) to the values obtained for the solid wood samples from the same (outer) area was statistically investigated by ANOVA. The results are presented in Table 6 and Table 7.
By analyzing Table 6 and Table 7 one can notice that:
  • There is a reasonable accordance between the values obtained from the two different logs;
  • The density of the glued elements is higher than the density of the solid wood elements from the same (outer area) of the logs;
  • There is no significant difference in the MOE values of the bonded boards compared to the solid wood boards from the same area, with only one exception (for Log N° 1 when the load was radially applied);
  • There is no significant difference in the MOR values of the bonded boards compared to the solid wood boards from the same area, with only one exception (for Log N° 1 when the load was tangentially applied).

4. Conclusions

The conclusions of the performed research can be summarized as follows:
  • The density, MOR, and MOE of the bonded elements are comparable to the values obtained for the solid wood samples from the outer area;
  • Generally, the MOR and MOE values obtained for the glued samples were smaller than for the tangentially loaded solid wood samples, but slightly higher (or comparable) to the radially loaded ones;
  • With average values MOR = 82 N/mm2 and MOE = 12,300…12,800 N/mm2, the bonded elements can be considered as suitable for CLT products, where usually the minimum required MOR is 24 N/mm2 and the average MOE is 11,000 N/mm2 (according to CEN EN 338) [19].
The proposed solution enables increasing the lumber yield from tapered logs with minimum changes to the existing technology.

Author Contributions

Conceptualization, M.B. and M.C.; methodology, M.C., M.P. and M.I.; software, B.B.; formal analysis, M.P. and M.B.; investigation, M.P.; writing—original draft preparation, M.B.; writing—review and editing, M.C.; visualization, M.I.; supervision, M.P. All authors have read and agreed to the published version of the manuscript.

Funding

This research received no external funding.

Institutional Review Board Statement

Not applicable.

Informed Consent Statement

Not applicable.

Data Availability Statement

Not applicable.

Conflicts of Interest

The authors declare no conflict of interest.

References

  1. Steele, P.H. Factors Determining Lumber Recovery in Sawmilling; USDA Forest Service: Madison, WI, USA, 1984. [Google Scholar]
  2. Stangle, S.M.; Bruchert, F.; Heikkila, A.; Usenius, T.; Sauter, U. Potentially Increased Sawmill Yield from Hardwoods Using X-Ray Computed Tomography for Knot Detection. Ann. For. Sci. 2015, 72, 57–65. [Google Scholar] [CrossRef] [Green Version]
  3. Brandstetter, M.; Zeleniuc, O.; Pei, G.; Campean, M. Conversion Efficiency of Fir Roundwood into Sawlogs. BioResources 2020, 15, 5653–5665. [Google Scholar] [CrossRef]
  4. Panshin, A.J.; de Zeeuw, C. Textbook of Wood Technology; McGraw-Hill, Inc.: New York, NY, USA, 1980. [Google Scholar]
  5. Tsoumis, G. Science and Technology of Wood: Structure, Properties, Utilization. Structure, Properties, Utilization; Chapman & Hall: New York, NY, USA, 1991. [Google Scholar]
  6. Holzatlas. In Fachbuchverlag Leipzig; Wagenführ, R. (Ed.) Carl Hanser Verlag Munchen-Wien: Munich, Germany, 2008. [Google Scholar]
  7. Kollmann, F. Technologie des Holzes und der Holzwerkstoffe; 2 Auflage; Springer: Berlin/Heidelberg, Germany; Göttingen, Germany, 1951. [Google Scholar]
  8. Olesen, P.O. The Variation of the Basic Density Level and Tracheid Width within the Juvenile and Mature Wood of Norway spruce. For. Tree Improv. 1977, 12, 1–21. [Google Scholar]
  9. Petty, J.A.; Macmillan, D.C.; Steward, C.M. Variation of Density and Growth Ring Width in Stems of Sitka and Norway spruce. Forestry 1990, 63, 39–49. [Google Scholar] [CrossRef]
  10. Saranpää, P. Wood Density and Growth. In Wood Quality and Its Biological Basis; Barnett, J.R., Jeronimidis, G., Eds.; Biological Sciences Series; Blackwell Publishing: Bodmin, UK; CRC Press: Bodmin, UK, 2009. [Google Scholar]
  11. Bardak, T.; Tankut, A.N.; Tankut, N.; Aydemir, D.; Szoen, E. The Bending and Tension Strength of Furniture Joints Bonded with Polyvinyl Acetate Nanocomposites. Maderas. Cienc. Tecnol. 2017, 19, 51–62. [Google Scholar] [CrossRef]
  12. Kumar, V.S.; Sharma, C.M.; Gupta, S. Compression and Flexural Properties of Finger Jointed Mango Wood Sections. Maderas. Cienc. Tecnol. 2015, 17, 151–160. [Google Scholar] [CrossRef] [Green Version]
  13. Watson, P.; Clauss, S.; Ammann, S.; Niemz, P. Fracture Properties of Adhesive Joints Under Mechanical Stress. Wood Res. 2013, 58, 43–56. [Google Scholar]
  14. Cao, G.; Shmulsky, R.; Liu, M.; Entsminger, E.D.; Via, B.K.; Wan, H. Characterizing Star-sawn Pattern Produced and Orthogonally Glued Specimens of Southern Pine. For. Prod. J. 2019, 69, 53–60. [Google Scholar]
  15. ISO 3129. Wood—Sampling Methods and General Requirements for Physical and Mechanical Testing of Small Clear Wood Specimens; ISO: Genève, Switzerland, 2012. [Google Scholar]
  16. ISO 13061-3. Determination of Ultimate Strength in Static Bending; ISO: Genève, Switzerland, 2016. [Google Scholar]
  17. ISO 13061-4. Determination of Modulus of Elasticity in Static Bending; ISO: Genève, Switzerland, 2016. [Google Scholar]
  18. Hu, W.; Zhang, J. Bolt-Bearing Yield Strength of Three-Layered Cross-Laminated Timber Treated with Phenol Formaldehyde Resin. Forests 2020, 11, 551. [Google Scholar] [CrossRef]
  19. CEN EN 338. Structural Timber—Strength Classes; European Committee for Standardization (CEN): Brussels, Belgium, 2016. [Google Scholar]
Figure 1. Experimental pieces of lumber obtained after bandsawing and sectioning.
Applsci 11 09937 g001
Figure 2. Valorization of tapered sideboards by edge-cutting at 45° and gluing.
Applsci 11 09937 g002
Figure 3. Reconstituted board obtained by edge-cutting at 45°, double (anti-parallel) rotation and gluing of mirrored tapered sideboards from the same log: (a)—45° edging of timber pieces 1 and 2; (b)—timber pieces 1 and 2 after 45° edging; (c)—rotation at 180° of piece 1, upside-down and front to back; (d)—joining pieces 1 and 2 in “anti-parallel” position by gluing and pressing.
Applsci 11 09937 g003
Figure 4. Reconstituted board after edge-cutting at 45°, anti-parallel rotation at 180°, and gluing of two tapered mirrored sideboards.
Applsci 11 09937 g004
Figure 5. ZWICK/ROELL equipment type BT1FB050TN.D30/2007 (a) used for the determination of MOE (b) and MOR (c).
Applsci 11 09937 g005
Figure 6. Direction of the bending force relative to the annual rings: (a)—solid board, radially loaded; (b)—solid board, tangentially loaded; (c)—bonded board.
Applsci 11 09937 g006
Figure 7. Variation tendency of density, MOE and MOR, over the cross section of the log, for the solid wood samples (represented with circles), compared to glued samples (represented with “x”).
Applsci 11 09937 g007
Figure 8. Variation tendency of density, MOE and MOR, over the log height for the solid wood samples (represented with the colored columns), compared to glued samples (represented with “x”).
Applsci 11 09937 g008
Table 1. Reference values (min-mean-max) for the density, MOE, and MOR of spruce wood [6].
Density (ρ12–15%), kg/m3MOE, N/mm2MOR, N/mm2
330–470–6807300–11,000–21,40049–78–136
Table 2. Log dimensions (without bark).
Top Diameter, mmDiameter at Mid Length, mmButt Diameter, mmLength,
m
Wood Volume, m3
Log Nr. 1237240258.53.10.14
Log Nr. 2227.5230247.53.10.13
Table 3. Density ρ12 (in kg/m3) of solid and glued spruce samples.
Log/Type of SamplesPosition within Cross Section *Position over Tree LengthCummulated Mean and STDEV
Lower PartUpper Part
Log N° 1
Solid wood (tangentially loaded)Core zone420.33 ± 1.15436.67 ± 22.01428.50 ± 11.58
Middle zone449.67 ± 19.83442.67 ± 22.78446.17 ± 22.64
Outer zone495.55 ± 20.55495.53 ± 43.39495.54 ± 32.35
Mean and STDEV462.50 ± 34.79462.57 ± 41.37462.53 ± 38.08
Solid wood (radially loaded)Core zone416.85 ± 6.80400.67 ± 7.43408.76 ± 7.12
Middle zone428.39 ± 16.18464.27 ± 15.09446.33 ± 15.64
Outer zone501.24 ± 18.58488.95 ± 27.72495.09 ± 23.40
Mean and STDEV455.22 ± 41.89461.42 ± 38.50458.32 ± 40.19
Edge-bonded boards (at 45°)Outer zone504.14 ± 18.94496.85 ± 13.76500.50 ± 16.49
Log N° 2
Solid wood (tangentially loaded)Core zone411.33 ± 13.01407.33 ± 33.50409.33 ± 23.26
Middle zone433.83 ± 12.32427.00 ± 35.22430.42 ± 23.77
Outer zone517.02 ± 25.73469.20 ± 9.86493.11 ± 17.80
Mean and STDEV462.62 ± 50.01439.85 ± 36.13451.24 ± 43.07
Solid wood (radially loaded)Core zone407.20 ± 10.14396.36 ± 17.37401.78 ± 13.76
Middle zone423.33 ± 12.33438.19 ± 25.16430.76 ± 18.75
Outer zone492.31 ± 41.10472.58 ± 12.02482.45 ± 26.56
Mean and STDEV447.70 ± 46.16443.58 ± 34.22445.64 ± 40.19
Edge-bonded boards (at 45°)Outer zone518.12 ± 22.40508.38 ± 24.91513.75 ± 23.55
Table 4. Modulus of elasticity in static bending MOE12 (in N/mm2) of solid and glued spruce samples.
Log/Type of SamplesPosition within Cross Section *Position over Tree LengthCummulated Mean and STDEV
Lower PartUpper Part
Log N° 1
Solid wood
(tangentially loaded)
Core zone9490.00 ± 933.9211,011.33 ± 721.6910,250.67 ± 827.81
Middle zone11,480.83 ± 922.2610,787.67 ± 1056.9011,134.25 ± 989.58
Outer zone13,211.55 ± 1167.0913,021.41 ± 1136.2713,116.48 ± 1151.68
Mean and STDEV11,774.99 ± 1719.0611,725.93 ± 1463.0111,750.46 ± 1591.04
Solid wood
(radially loaded)
Core zone8612.17 ± 728.338732.53 ± 363.558672.35 ± 518.98
Middle zone9534.50 ± 3721.9110,629.95 ± 527.3010,082.23 ± 953.13
Outer zone12,414.60 ± 974.5312,165.43 ± 773.2412,290.02 ± 848.76
Mean and STDEV10,502.07 ± 1872.5610,864.66 ± 1433.3910,683.37 ± 1648.84
Edge-bonded boards (at 45°)Outer zone12,773.58 ± 757.4912,881.45 ± 513.7512,827.52 ± 635.36
Log N° 2
Solid wood
(tangentially loaded)
Core zone8521.33 ± 656.188343.33 ± 269.528432.33 ± 462.85
Middle zone9738.50 ± 726.3210,337.00 ± 1459.9810,037.75 ± 1093.15
Outer zone13,947.61 ± 726.3411,554.44 ± 916.2012,751.03 ± 1477.61
Mean and STDEV11,178.71 ± 2425.1110,425.20 ± 1596.8610,801.96 ± 2010.99
Solid wood
(radially loaded)
Core zone8211.22 ± 462.328897.74 ± 640.048554.48 ± 551.18
Middle zone9722.33 ± 931.8910,130.42 ± 488.509926.38 ± 710.20
Outer zone12,620.16 ± 1395.8911,424.44 ± 812.0612,022.30 ± 1103.96
Mean and STDEV10,579.24 ± 2082.7910,401.49 ± 1159.2110,490.37 ± 1621.00
Edge-bonded boards (at 45°)Outer zone12,258.38 ± 844.7612,374.44 ± 1232.6212,306.41 ± 1004.02
Table 5. Bending strength MOR12 (in N/mm2) of solid and glued spruce samples.
Log/Type of SamplesPosition within Cross Section *Position over Tree LengthCummulated Mean and STDEV
Lower PartUpper Part
Log N° 1
Solid wood (tangentially loaded)Core zone65.27 ± 3.0070.47 ± 9.2267.87 ± 6.11
Middle zone80.82 ± 4.5672.73 ± 6.6776.78 ± 5.62
Outer zone94.34 ± 3.5591.72 ± 10.9793.03 ± 7.26
Mean and STDEV83.1 ± 11.7381.21 ± 12.2582.16 ± 11.99
Solid wood (radially loaded)Core zone61.09 ± 3.6558.68 ± 6.3959.89 ± 5.02
Middle zone65.52 ± 4.4470.46 ± 5.6367.99 ± 5.04
Outer zone88.49 ± 6.7879.82 ± 4.6284.16 ± 5.70
Mean and STDEV73.82 ± 13.4871.83 ± 9.4772.83 ± 11.48
Edge-bonded boards (at 45°)Outer zone82.98 ± 5.6381.12 ± 4.8282.05 ± 5.23
Log N° 2
Solid wood (tangentially loaded)Core zone61.28 ± 2.6761.14 ± 0.7361.21 ± 1.70
Middle zone65.34 ± 6.8971.14 ± 8.8768.24 ± 7.88
Outer zone94.89 ± 3.9481.34 ± 6.3588.12 ± 5.15
Mean and STDEV76.35 ± 16.4473.27 ± 10.1274.81 ± 13.28
Solid wood (radially loaded)Core zone61.01 ± 0.9661.94 ± 3.6861.48 ± 2.32
Middle zone66.63 ± 4.0169.38 ± 5.6760.97 ± 4.84
Outer zone85.04 ± 4.3375.45 ± 7.2280.24 ± 5.78
Mean and STDEV72.87 ± 11.0870.32 ± 7.6671.59 ± 18.74
Edge-bonded boards (at 45°)Outer zone85.85 ± 9.2277.76 ± 4.6881.81 ± 6.95
* The position within the cross section referred to in Table 3, Table 4 and Table 5 has the following meaning: core zone = H3, middle zone = H2 and H4, outer zone = all other pieces of lumber (S1 and S2 for solid wood, and 1–10 for bonded parts) (see Figure 2).
Table 6. Summary of mean values of modulus of rupture in bending (MOR).
Log NumberLoading DirectionMOR (N/mm2)
Solid WoodGlued
#1Tangential93 (12) (7.93) A *82 (24) (5.21) B
Radial84 (12) (7.16) A82 (24) (5.21) A
#2Tangential88 (12) (8.60) A82 (29) (8.58) A
Radial80 (12) (7.57) A82 (29) (8.58) A
#1 + #2Tangential91 (24) (8.45) A82 (53) (7.19) B
Radial82.19 (24) (7.47) A82 (53) (7.19) A
Table 7. Summary of mean values of modulus of elasticity (MOE).
Log NumberLoading DirectionMOE (N/mm2)
Solid WoodGlued
#1Tangential13,116 (12) (1102.66) A *12,828 (24) (635.36) A
Radial12,290 (12) (848.76) A12,828 (24) (635.36) B
#2Tangential12,751 (12) (1477.61) A12,306 (29) (1004.02) A
Radial12,022 (12) (1255.13) A12,306 (29) (1004.02) A
#1 + #2Tangential12,934 (24) (1288.62) A12,542 (53) (888.78) A
Radial12,156 (24) (1056.72) A12,542 (53) (888.78) A
* The values in the first and second parentheses in Table 6 and Table 7 are number of replications and standard deviation, respectively. Two means in each row not followed by a common letter are significantly different from one another at the 5% significance level [18].
Publisher’s Note: MDPI stays neutral with regard to jurisdictional claims in published maps and institutional affiliations.

