
Investigations on Interface Shear Fatigue of Semi-Precast Slabs with Lattice Girders


Institute of Structural Concrete, RWTH Aachen University, 52074 Aachen, Germany
*
Author to whom correspondence should be addressed.
Appl. Sci. 2021, 11(23), 11196; https://doi.org/10.3390/app112311196
Submission received: 13 October 2021
/
Revised: 16 November 2021
/
Accepted: 22 November 2021
/
Published: 25 November 2021
(This article belongs to the Special Issue Reinforced Concrete Structures: Testing, Modelling and Assessment)
Abstract
:Featured Application
The presented research supports the application of semi-precast slabs with lattice girders in industrial buildings and bridge structures exposed to cyclic loading.
Abstract
Due to their high cost efficiency and flexibility, semi-precast concrete slabs with lattice girders are widely used in constructions all over the world. Prefabricated concrete slabs, combined with in situ concrete topping, exhibit a quasi-monolithic structural behavior in which lattice girders serve as vertical shear reinforcement and ensure the transfer of longitudinal shear within the interface, acting in combination with concrete-to-concrete bonding mechanisms. To be applicable in industrial and bridge construction, semi-precast slabs need to have sufficient resistance against fatigue failure. To improve and expand the limits of application, theoretical and experimental investigations are conducted at the Institute of Structural Concrete (IMB), RWTH Aachen University. To investigate the fatigue behavior of lattice girders, small size tests with lattice girder diagonals were carried out. These test results have been used to derive an S–N curve (S: stress, N: number of load cycles) for lattice girders for a more refined fatigue design. Subsequently, the fatigue behavior of semi-precast slabs with lattice girders was investigated by fatigue tests on single-span slab segments. The fatigue design regulations of lattice girders according to technical approvals can generally be confirmed by this test program; however, they tend to be conservative. The use of the derived S–N curve leads to significantly improved agreement of fatigue behavior observed in tests and design expressions.
1. Introduction
Lattice girders are prefabricated reinforcement systems to be installed in semi-precast concrete elements, e.g., in semi-precast slabs (also known as precast half slabs, filigree slabs, or precast Omnia floor slabs) or in semi-precast walls (also known as double layered reinforced concrete slabs or precast concrete double/twin walls). On site, semi-precast elements are combined with in situ concrete. Due to the high economic advantages and flexibility, around 70% of all floor slabs in building and industrial engineering in Germany are made of semi-precast slabs with lattice girders [1]. Prefabrication reduces construction time in the building process and minimizes the risk of flaws in the construction while assembling. Precast elements can be used as permanent formwork, and the lattice girders combined with in situ concrete ensure a quasi-monolithic structural behavior. In the ultimate limit state, lattice girders serve as interface reinforcement and can also fulfill the function of shear reinforcement to ensure adequate resistance against vertical shear depending on type and disposition [1]. In addition, they play an important role during the construction stage (e.g., during transportation, lifting, and assembling). In buildings, semi-precast slabs are generally subjected to monotonic loading. However, in industrial constructions due to, e.g., fork-lift trucks or oscillating machinery, as well as in bridge construction, semi-precast slabs may be subjected to cyclic loading conditions due to traffic loads. After shear under cyclic loading was studied for a long time almost exclusively on structural elements such as reinforced and prestressed concrete girders, e.g., [2,3,4,5,6,7,8,9,10], fatigue research is increasingly focusing on slabs as well [11,12,13,14].
Because of their advantages, in the state of construction, semi-precast slabs with lattice girders are used in many countries [15,16,17,18,19,20]. However, the advantages in the ultimate limit state are almost not applied at all, even though international research has been performed [21,22,23,24]. Much of the research for the ultimate limit state was conducted in Germany (e.g., [1,25,26,27]), where the design of semi-precast slabs with lattice girders follows technical approvals, which are based on Eurocode 2 [28] in combination with the National Annex of Germany [29]. In the ultimate limit state, lattice girders are used as shear, interface shear, and punching shear reinforcement. Since the first semi-precast slabs with lattice girders were built in the 1960s, this construction method has been continuously developed and researched. In recent years, punching and fatigue design have been the main areas of research for the use of lattice girders [30,31,32,33,34,35,36,37]. The S–N curves (S: stress, N: number of load cycles) defined in [29] for profiled bars, which are either bent or welded, are not applicable for the fatigue design of lattice girders. Due to the geometric condition with a combination of bent and point-welded bars with a smooth surface, the design in the technical approvals was limited to a simplified fatigue verification, e.g., [38,39]. The design regulations in the general technical approvals were derived based on fatigue tests in literature, e.g., [40]. To improve and expand the limits of application, theoretical and experimental investigations are conducted at the Institute of Structural Concrete (IMB), RWTH Aachen University. Some of the results have already been incorporated into the latest technical approvals [41,42], e.g., an S–N curve for lattice girders for a more refined fatigue design.
The investigations described in this paper are conducted during research programs initiated by the Research Association of the German Concrete and Precast Industry e.V. and funded by the German Federation of Industrial Research Association (AiF, IGF numbers 18407 N/1 and 20580 N). A detailed description of the results so far can be found in [43].
2. Lattice Girders for Use in Cyclically Loaded Structures
2.1. General
Whereas many types of lattice girders exist for monotonic loading, only four types of lattice girders are approved for fatigue loading in Germany (Figure 1). These types are covered by technical approvals and offered by a small number of manufacturers [41,42,44,45,46,47,48,49].
The type of lattice girder shown in Figure 1a is approved to resist interface shear and vertical shear in semi-precast slabs and element walls. Due to the 90° inclination of every second bar (vertical) and the other bar being inclined (diagonal) towards the support (45° ≤ α ≤ 90°, Figure 2), all bars can be utilized for interface shear design. Additionally, in cases where such a lattice girder complies with the construction rules of shear reinforcement and has sufficient depth for adequate anchorage of all vertical and inclined bars within the compression zone, these bars can be considered for vertical shear design.
Due to its wide range of applications, Type (a) has been chosen for the following theoretical and experimental investigations. In addition, the small mandrel diameter of this lattice girder type allowed easily triggering and observing a fatigue failure within the experimental study.
2.2. Fatigue Tests from Literature
The fatigue behavior of semi-precast slabs with lattice girders has been investigated to derive design specifications for technical approvals. In this context, 29 fatigue tests have been conducted and described in literature. For semi-precast slabs with lattice girders KTS [50], EQ [40], and KT100 [51], the specimens were tested with simply supported slabs with two point loads. For element walls with KTW [52], the specimens were tested as simply supported slabs with cantilevers. Table 1 gives an overview of all tests that have been documented in the literature regarding the type of lattice girder, number of tests, and test setups.
All fatigue tests were conducted under cyclic loading with a frequency of f = 2.0–2.5 Hz and a constant load range up to N = 2.0 million load cycles. The upper load limit for the cyclic loading was determined to generate a tensile stress in the diagonals of 70% of the yield strength, which results in a load exceeding the approved frequent load by 25%. The applied stress range in the diagonals varied between ΔσDia = 180–230 N/mm2. After reaching the N = 2.0 million load cycles, the specimens were loaded monotonically until failure. Comprehensively for all test series, the shear span to effective depth ratio was kept between a/d = 3.4–3.8, and the concrete compressive strength varied between fcm,cyl = 16.1–39.3 N/mm2 for the precast slab and fcm,cyl = 13.9–32.5 N/mm2 for the in situ concrete. The lattice girders in the slab’s cross section were placed in one, two, or three rows to determine the effect of the amount of interface reinforcement. The interface quality was left as cast, with an additional bond breaker or intentionally roughened by raking (according to [29]). Figure 3 shows an exemplary test specimen from the test series conducted for lattice girder KTS [50].
Most tests were stopped before fatigue failure after reaching the reference number of load cycles, and a static test was conducted to assess residual strength. Another group of tests showed fatigue bending failure. Interface shear failure only occurred for four specimens during cyclic loading and for two specimens during static testing of residual strength. These specimens had a smooth surface including a bond breaker. Vertical shear failure did not occur at all.
To specifically determine the fatigue resistance of the critical section of the lattice girders at the bent and welded node between diagonal and chord, additional small size tests have been conducted with lattice girders KTW and EQ (see Table 1). Therefore, the diagonals were cast in concrete cubes with a concrete strength of about fcm,cyl = 20 N/mm2 and with an interruption of bond by a cladding tube installed above the welded node (Figure 4a). The cyclic loading was applied to the diagonal with a constant stress range and a frequency of f = 100 Hz.
If a failure occurred in the small size tests, it was detected in the welded node between diagonal and chord (Figure 4b). In Figure 4c, the applied stress ranges are shown with the corresponding number of load cycles. With these test results, a characteristic approved stress range of ΔσRsk = 92 N/mm2 could be determined for N = 2.0 million load cycles, which was adopted to the fatigue verification of lattice girders (see Section 2.3).
2.3. Fatigue Design of Semi-Precast Slabs with Lattice Girders in Germany
In Germany, the design of semi-precast slabs with lattice girders follows the general technical approvals of lattice girders, which are based on the regulations of [28,29]. The current design concept for monotonic loading, its differences compared to Eurocode 2, and the models that are the basis of the design concept are summarized in [53].
For fatigue, the stress range in the diagonals of the lattice girders needs to comply with a certain limit value. Due to absence of S–N curves, for many years, the verification was limited to a simplified verification with an approved characteristic stress range of ΔσRsk = 92 N/mm2 for N = 2.0 million load cycles. Based on the research in Section 3, more detailed verifications using an S–N curve have recently been proposed. The S–N curve and its derivation can be found in Section 3.5.
For interface shear design, the fatigue resistance of the lattice girders is derived by using an interface shear equation of [29] (Equation (1)).
with
vRdi = c·fctd + μ·σn + ρ·fyd·(1.2·μ·sinα + cosα) ≤ 0.5·ν·fcd
- vRdi design (d) shear resistance (R) of interface (i)
- c coefficient of adhesion
- fctd design value of concrete (c) tensile (t) strength of the weaker concrete layer
- μ coefficient of friction
- σn external normal (n) stress perpendicular to the interface acting simultaneously with the shear stress
- compressive stress: 0 ≤ σn ≤ 0.6·fcd
- tensile stress: σn < 0 with c·fctd = 0
- ρ interface reinforcement ratio ρ = Asi/Ai
- with
- Asi the area (A) of steel (s) reinforcement crossing the interface including shear reinforcement from shear design with sufficient anchorage at both sides of the interface
- Ai the area of the interface
- fyd design yield (y) strength of the interface reinforcement
- α inclination of interface reinforcement 45° ≤ α ≤ 90°
- ν strength reduction factor for concrete cracked in shear
- fcd design concrete cylinder compressive strength.
For semi-precast slabs with lattice girders under cyclic loading, the interface shall have at least a rough surface [41,42]. The roughness can be determined using the sand-patch-test or equivalent methods [29]. Thus, the formulation is modified by considering the coefficients for rough interfaces (µ = 0.7 [28]), neglecting the term of adhesion for fatigue (c = 0) [29] and the term for friction (µ·σn = 0). Furthermore, the stress range is increased by the term 1/0.6. The factor 0.6 is based on regulations in DIN 1045 [54], which includes the conservative estimation of a flat angle of compression strut by a reduction factor of 0.85 and a correction factor 0.7 for the increased fatigue failure potential of the bent bars [55]. Substituting the yield strength of the reinforcement by the approved stress range and the partial fatigue safety factor for steel, as well as considering the inclination of every second angle of the diagonals with α1 = 90°, the verification of the stress range at an interface with lattice girders KTS or EQ follows Equation (2) [41,42].
with
- ΔvRdi,fat,LG range of fatigue (fat) design (d) shear resistance (R) of interface (i) using lattice girders (LG)
- ΔσRsk approved characteristic stress range with ΔσRsk = 92 N/mm2 for N = 2.0 million load cycles
- γs,fat partial safety factor of reinforcement under fatigue γs,fat = 1.15
- α2 inclination of inclined diagonal in accordance to Figure 2.
The design value of the applied shear stress may not exceed the limitation of Equation (3) [41,42] with the static maximum shear resistance according to Table 2.
with
vRdi,max,fat = 0.5·vRdi,max
- vRdi,max,fat maximum fatigue shear resistance
- vRdi,max maximum static shear resistance according to Table 2.
Additionally, certain detailing rules have to be satisfied for fatigue. As mentioned before, the interface shall at least have a rough surface with a height of the precast (pre) slab with a minimum depth of hpre ≥ 6 cm. The lattice girders (LG) shall have a minimum height of hLG ≥ 10 cm with an inclination of the diagonals of α2 ≥ 45° and the horizontal bars at the bottom side of the lattice girder may not be considered as longitudinal reinforcement. The diameter of the longitudinal reinforcement (sl) in the precast slab is limited to a maximum (max) value of Øsl,max = 16 mm and shall be sufficiently anchored at the supports. Furthermore, a staggering of the longitudinal reinforcement is not permitted.

3. Small Size Fatigue Tests to Determine S–N Curves for Lattice Girders
3.1. Introduction
Due to absence of fatigue–strength curves (S–N curves, Figure 5a) for lattice girders, the fatigue design of semi-precast slabs with lattice girders was limited to a simplified verification by limiting the stress range in the diagonals to ΔσRsk = 92 N/mm2 for N = 2.0 million load cycles. In order to extend the range of application by deriving S–N curves for lattice girders, small-size fatigue tests with lattice girder diagonals cast in concrete cubes have been conducted at the Institute of Structural Concrete (IMB), RWTH Aachen [43,56], using the procedure of the interactive method [57,58] (Figure 5b). This procedure had also been adapted to derive S–N curves for other lattice girder systems, e.g., in [36].
3.2. Description of Test Specimens and Test Setup
For the experimental investigations [43,56], lattice girder type Filigran EQ [42] with a maximum height of 300 mm has been chosen. This lattice girder is equivalent to KTS from Baustahlgewebe GmbH [41]. Due to its small mandrel diameter between the diagonal and vertical bar and point-welded node between the lower and upper chord, this geometry is very likely to induce a fatigue failure. To minimize the scatter of test results, all girder diagonals in the experimental investigations came from one production batch.
To evaluate the fatigue strength of the welded nodes, the sections between the diagonal and lower chord as well as between the diagonal and upper chord have been investigated. Whereas two diagonals are welded to the upper chord, only one diagonal is welded to the lower chord (Figure 2). For the test specimens, the critical areas were cut out of the girder and casted in a formwork cube with dimension of b = 15 cm and a concrete class of C20/25 (Figure 6a,b). To ensure a direct load application at the critical node, a cladding tube was used to break bond between concrete and reinforcing bar, as described in Section 2.2 for experiments from literature. The top and bottom chords have a diameter of Øchord = 5 mm and were cast up to the edges of the cube to prevent restraints at the ends of the chords. The diagonal (dia) bar had a length of 300 mm and a diameter of Ødia = 7 mm, which satisfies the required test length of 140 mm or 14·Ø = 98 mm according to [59].
3.3. Test Procedure
According to the test procedure of the interactive Method, three to five monotonic tests as well as 20–25 fatigue tests are necessary to determine the S–N curve of a material. For the monotonic tests, three concrete cubes for each chord, lower and upper, have been conducted. The specimens have been tested upside down in a test rig by clamping the diagonal bar with wedges. The load was applied and displacement-controlled by a test cylinder until steel failure.
For the fatigue tests, the concrete cubes were clamped between two steel plates, and the cyclic loading from the test cylinder was introduced by wedge anchorage to the diagonal bar (Figure 6a,c). The load was applied with a frequency of f = 20 Hz up to N = 5.0 million load cycles.
The stress ranges were defined following the test procedure depicted in Figure 5b. In accordance with [57], the minimum stress was determined to σmin = 125 N/mm2, and the stress ranges were applied by adjusting the maximum load σmax. Even though constant minimum stress contradicts the general determination of a constant maximum stress for establishing the fatigue resistance of reinforcement with of σmax = 300 N/mm2 [59,60], the interactive method recommends a constant minimum stress to cover stress ranges Δσ ≥ 300 N/mm2 and to ensure a more realistic evaluation that considers the constant permanent loads of the structure. The fatigue tests started with a maximum stress in the range of the yield strength. For the following four tests, the stress range was decreased stepwise until reaching the estimated fatigue limit. Due to the parallel statistic evaluation of the test results, the path of applied stress ranges could be subsequently adjusted (Figure 5b). Tests exceeding the limit of load cycles (5.0 million load cycles) without fatigue failure were stopped and subsequently cyclically tested with a higher stress range. To achieve a reasonable path of the S–N curve after statistic evaluation, 33 tests with lower chords and 25 tests with upper chords were conducted.
3.4. Results of Small-Size Fatigue Tests
The lattice girder diagonals subjected to monotonic tensile stress failed with the fracture being located between load application and the welded node (Figure 7a). Failure in the immediate region between the load application and welded node with a distance ≤ 4·Ødia did not occur. The yield strength of the static test was determined as fy = 564–573 N/mm2 for the specimens with diagonals and lower chords and between fy = 558–567 N/mm2 for diagonals and upper chords.
Failure of the diagonal in the fatigue tests for both the lower and upper chord nodes occurred at the welding point. In this context, Figure 7b shows the fractured diagonal of a lower chord node that was subjected to a stress range of Δσ = 375 N/mm2 and resisted N = 162,177 load cycles. Figure 7c gives a detailed view of the fatigue fracture.
The test results of the static and fatigue tests of lower and upper chords are shown in Figure 8. For comparison, the test results from fatigue tests from literature [40,52] (Section 2.2) were added to the diagram. The comparison of the applied stress range Δσ and reached number of load cycles N for the lower chords (black points) and upper chords (grey points) shows a similar distribution of test results. For most cases, the upper chord tests bore fewer load cycles for high stress ranges but with less scatter compared to the lower chords. The required stress range according to the technical approval of the lattice girders with ΔσRsk = 92 N/mm2 for N = 2.0 million load cycles was satisfied for all tests.
The comparison of the test results from literature shows the extended range of the fatigue–strength relation, especially for high stress ranges and low number of load cycles. In most cases, the own investigations resisted a higher number of load cycles within the range of small stress amplitudes, which can be explained by improved welding processes, since the tests from the literature date back more than 25 years.
3.5. Evaluation of S–N curves for Lattice Girders
The small-size fatigue tests were evaluated based on the interactive method, separately for the lower and upper chords as well as for the overall test data. The first analysis only included test data of the own investigations and excluded test results from literature. The yield strength was determined by performing a static test (N = 1). Figure 9a shows the mean functions of the individual evaluations as well as the overall evaluation in double logarithmic illustration.
By considering standard deviation and quantile factors, the mean function could be transferred to the quantile function with an arbitrary confidence level. In this context, Figure 9b depicts the 5% quantile functions for the individual and the overall evaluations. For a confidence level of 90%, the quantile factors kn result in 1.69 for the lower chord, 1.71 for the upper chord, and 1.64 for the overall evaluation.
The analysis confirms that tests with lower chords (black points and black dotted curve) resisted a higher number of load cycles compared to tests with upper chords (grey points and grey dotted curve), but with higher scatter. This influences the 5% quantile function, especially in the range of fatigue strength. The 5% quantile curve of the overall evaluation (black curve) only exceeds the curves of the individual evaluation in the range of short time fatigue strength for the upper chords and in the range of fatigue strength for the lower chords. However, the stress ranges of all test data are located above the overall evaluation.
For applying the S–N curves in design practice, the overall evaluation was used in order to derive consistent design S–N curves (Figure 5a) based on the design format of [28,29], where the trilinear design curves are defined by Equation (4).
with
- ΔσRsk expected stress range
- ΔσRsk(N*) stress range at N* load cycles
- N* number of load cycles at break of slope
- N expected number of load cycles
- k stress exponents
- with
- k = k1 stress exponent for N < N*
- k = k2 stress exponent for N > N* with k2 = 2·k1—1
- fyk characteristic yield strength.
In this context, different strategies of analysis to define a trilinear S–N curve were followed [43]. At least, for the revision of the technical approvals [41,42], the tests from [40,52] were also taken into account. In analogy to the trilinear S–N curves in [28,29] (Figure 5a), the second point of the trilinear curve was adopted to N* = 1.0 million load cycles with the corresponding stress range of ΔσRsk = 92 N/mm2, which was already used for the simplified verification (see Section 2.3). The shape of the design curve was fitted to test data. It adopts the coefficients k1 = 5 and k2 = 9 from the design curve in [29] for stirrups as shear reinforcement (Figure 10).
4. Fatigue Tests on Semi-Precast Slabs with Lattice Girders
4.1. Introduction
To extend the limited data basis and to verify the investigations from literature, 14 test specimens with two sub-tests have been conducted with semi-precast slab sections under cyclic loading [43,61,62]. The specimens were designed as single-span slabs and were tested in four-point bending tests (Sub-Test I) and three-point bending tests (Sub-Test II), respectively (Figure 11).
In three test series with lattice girders KTS [38] and EQ [39], the test parameters were varied in the range of the technical approvals. The parameters were slab thickness (16–36 cm), amount of lattice girders (two rows for low interface reinforcement, three rows for medium interface reinforcement, and four rows for high interface reinforcement ratios) and concrete strength (C25/30 and C50/60). Additionally, the influence of the interface roughness has been investigated (very smooth to rough). An overview of the test program is given in Figure 12.
The realization of the required rough interfaces is difficult to implement in the pre-fabrication plants, especially for large interface reinforcement ratios. Thus, in order to investigate the effect of untreated interfaces, concrete surfaces were tested without mechanical post-treatment to be very smooth and oiled or left as cast with a roughness depth of Rt = 0.4 mm. Achieving the minimum roughness depth of a rough interface according to the regulations in [29] with Rt ≥ 1.5 mm without mechanical post-treatment is difficult to implement. Therefore, a smaller limit of a rough surface in accordance with [63] with Rt = 0.9 mm (‘rough’) without mechanical post-treatment has been investigated. For comparison, also a rough interface with slightly roughening after concrete casting was provided.
To verify the surface quality of the precast slabs, the roughness of the interface was measured by the sand-patch method according to Kaufmann [64] and in most cases by laser triangulation with a laser system [65]. The determined mean values of roughness depth according to both methods are listed in Section 4.3. More details are published in [66]. Since the applied lattice girders KTS and EQ may also be accounted as shear reinforcement, the shear capacity has been investigated during the research program. The test results considering the shear resistance can be found in [43].
4.2. Description of Test Specimens
For the test specimens, the precast slabs were manufactured with a slab thickness of hpre = 7 cm and a width of b = 85 cm. To extend the application of the limited diameter of the longitudinal (l) reinforcement in the technical approvals of Øl ≤ 16 mm and to exclude flexural failure, longitudinal reinforcement bars with Øl = 20 mm and a yield strength of fy = 900 N/mm2 with a longitudinal reinforcement ratio of ρl = 2.0% were applied. The lower chords of the lattice girders have not been considered for determination of longitudinal reinforcement ratio.
The investigated shear lattice girders were KTS and EQ with a girder height of 10 cm for the 16 cm slabs and 30 cm for the 36 cm slabs. Both girders, KTS and EQ, have identical structural properties. For Specimen EG14, the concrete cover in the compression zone was reduced and thus the slab thickness was decreased to 33 cm. The span of the slabs for the four-point bending tests was defined to 3·a, with a being the distance between load application and support, to achieve a shear slenderness of a/d = 4.0. The geometrical parameters of the test series are summarized in Table 3.
4.3. Fabrication of Test Specimens
The precast slabs for the initial specimens of Series 0 with two rows of lattice girders were manufactured in the prefabrication plant Elskes in Kamp-Lintfort, Germany. The reinforcement in the precast slab was in accordance with Figure 13, but with a support overlay of 20 cm and additional stirrups along the slab’s ends. The slabs were cast with a concrete C25/30 and a surface left as cast. After concrete hardening, the precast slabs were transported to the laboratory of IMB. Before applying the in situ concrete with a design concrete strength of C25/30, the interface of EG02 was additionally weakened by a bond breaker to prevent an adhesive bond and to achieve a very smooth surface quality.
The specimens of the following Test Series 1 and 2 were manufactured at IMB. The precast slabs of Test Series 1 generally followed Series 0, but with a smaller support overlay of 15 cm and without edge stirrups to test a more adverse case for interface shear failure (Figure 13). The roughness of the interface was aspired to be Rt = 0.9 mm for Specimens EG03–EG08 without mechanical post-treatment. Specimen EG09 had a rough surface by slightly roughening after concrete casting. In Test Series 1, two, three, and four rows of lattice girders were applied, and the concrete strength for both precast slab and in situ concrete varied between C25/30 and C50/60. For the specimens of Test Series 2 with a precast slab of 7 cm, the interface roughness was about Rt = 0.9 mm, in accordance with Series 1. The in situ concrete layer for EG10–EG13 was 29 cm. To determine the effect of the height of the concrete cover in the compression zone, the in situ concrete layer of Specimen EG14 was reduced to 26 cm. The interface reinforcement varied between two and four rows of lattice girders and the concrete strength was C25/30 and C50/60.
Figure 13 exemplarily shows the dimensions and reinforcement detail of the Series 1 specimens with two rows of lattice girders (EG03, EG06, and EG09). The parameters and material properties of the test specimens are summarized in Table 4. The reinforcement details of the other specimens as well as the material properties of concrete and reinforcement are illustrated in [43].
According to the technical approvals of the lattice girders, the longitudinal reinforcement must be fully anchored at the support. Since extending the support overlay and applying additional stirrups along the support would have a positive effect on the interface shear resistance, the anchorage of the longitudinal bars was enhanced by screw-nuts. The transverse (t) reinforcement was determined to be 20% of the longitudinal reinforcement with Øt = 10 mm bars and yield strength of fy = 500 N/mm2. To ensure a crack formation of flexural cracks in the area of the welded sections of the lattice girders, triangular crack inducers were placed at the bottom side of the concrete slab at the position of the welds to produce comparable conditions of flexural crack initiation and shear crack propagation. To prevent shear failure of the slab at the midspan between the load application point and support in the second sub-tests (Figure 11), additional stirrups were applied, since the diagonals of the lattice girders declining towards the support cannot fully participate in the shear resistance (Figure 13).
For documentation of the tests, continuous measurements were made using electronical documentation. The arrangement of the measurement devices is depicted exemplarily for Specimen EG10 in Figure 14. To record the strain development in the reinforcement, strain gauges (SG) were applied to the diagonals, welded points, and bottom chords of the lattice girders in the range of the expected interface and shear cracks, as well as on the longitudinal reinforcement in the range of maximum moments (Figure 14a). The measurement of horizontal and vertical relative displacements within the interface of the crack opening of the shear crack and deflection of the specimen was implemented by displacement transducers (W) (Figure 14b).
4.4. Test Setup and Test Execution
For the first sub-tests, the single span slabs were tested in four-point bending. The load from the test cylinder was transferred by a steel girder so that the shear spans (regions between load application and support) were one-third of the total span. A schematic depiction is given in Figure 11a. Figure 15a,b show the experiments within the IMB laboratory. In such test setup, shear is constant along both shear spans, while it is zero at the midspan between both points of load application, where the distribution of the bending moment is constant and has maximum.
After fatigue failure within the shear span of the weaker slab end in the first sub-tests, a second sub-test was performed in which the setup was rearranged to three-point bending by moving the support from the fractured side to the previous load application and strengthening the fractured end of the specimens by external steel profiles. This testing procedure allowed the continuance of the cyclic testing of the shear span at the stronger slab end with identical loading conditions (with regard to shear and bending moment distribution) until fatigue failure (Figure 11b and Figure 15c,d).
The fatigue tests in Series 0 were started by deformation-controlled monotonic loading with 0.5 mm/min until flexural cracks reached the interface. This load level was defined as maximum load for the cyclic loading. For Test Series 1 and 2, the maximum loads were previously defined to be 60% to 80% of the calculated static interface resistance according to [29]. For specimens with an interface roughness of Rt ≈ 0.9 mm, the interface resistance of a rough interface was considered. The reference value for specimens with high interface reinforcement ratios was the calculated static shear resistance.
After applying the initial maximum load, the load range was defined to be between 30% to 75% of the maximum load. Thereby, the calculated stress ranges in the lattice girders were designed to be about Δσs = 200 N/mm2. The fatigue load was applied in a force-controlled manner, starting with a frequency of f = 0.1 Hz with continuous measurements of strain gauges and displacement transducers. After 100 load cycles, the frequency was increased to f = 2.8–5.8 Hz, depending on the deflection of the specimens. The displacement and strain measurements were monitored in periods after 1000 or 2000 load cycles. Depending on the reached number of load cycles, crack distribution, and displacement and strain measurements, the load range was increased in the first instance followed by increasing the maximum load.
After failure at one side of the specimen in the first sub-test, the other side (shear span without failure) was subjected to the ultimate load levels of the first sub-test. If the state of fracture did not allow proceeding with the fatigue test, the second side was monotonically loaded until failure.
4.5. Test Results
4.5.1. General
The fatigue loading caused a progressing crack formation with increasing deformation, crack widths, and steel strains in the reinforcement. As expected, the fatigue tests with several million load cycles showed a higher scatter compared to static tests. The scatter involves the failure mode, interface displacement, the stress of lattice girders, and the reached number of load cycle. The failure mode and the reached number of load cycles are listed in Table 5.
Specimens with low interface reinforcement ratios realized by two rows of lattice girders (EG01–EG03, EG06, EG09, EG10, and EG12), except for Specimen EG09, resisted a minimum of N = 2.0 million load cycles. Independent of concrete strength and interface roughness, a combination of interface and shear failure occurred. Slabs with medium interface reinforcement ratios and three rows of lattice girders (EG04 and EG07) failed predominately through vertical shear failure with only small crack development along the interface. For tests with high interface reinforcement ratios (EG05, EG08, EG11, EG13, and EG14), only EG08 showed a clear shear crack after N > 2.0 million load cycles. For the other highly reinforced and highly loaded specimens, failure occurred generally due to anchorage failure of the lattice girder in the compression zone of the slab or failure of the anchorage of the longitudinal reinforcement at the support. In the following, the influence of interface roughness, interface reinforcement ratio, and steel strains are presented. An influence of the concrete strength could not be determined.
4.5.2. Influence of Interface Roughness
During the test program, the interface roughness was varied by specimens in Series 0 and 1 with concrete strength of C25/30 and two rows of lattice girder. Therefore, the following interface conditions were investigated:
- left as cast with bond breaker (very smooth, EG02)
- left as cast with a roughness depth of Rt = 0.24 mm determined by the sand-patch method (smooth, EG01)
- left as cast with an aspired roughness depth of Rt ≈ 0.9 mm (‘rough’, EG03)
- left as cast with slightly roughening to Rt ≈ 2.0 mm after casting (rough, EG09)
The crack patterns and achieved number of load cycles of the four specimens are shown in Figure 16. For all investigated interface roughness, delamination of the interface could be determined. For Specimen EG02 with a very smooth surface, delamination already occurred during initial static loading. The crack formation along the interface for EG01 with a smooth surface appeared during the cyclic loading (N > 1.5 million load cycles). Both specimens failed due to shear in the interface. Since the specimens EG01 and EG02 were designed with a longer support overlay and additional stirrups along the ends of the slab, the unimpeded shear of the in situ concrete layer was additionally counteracted. For EG03 with an interface with a low roughness, the failure occurred due to delamination of the in situ concrete layer with considerable horizontal slip after a shear crack developed towards the support. Specimen EG09 with a rough interface failed in a combination of interface and shear but without complete delamination of the in situ concrete.
Except for Specimen EG09 with a slightly roughened surface, all specimens exceeded N > 2.0 million load cycles. Although the applied fatigue load and the concrete properties of Specimen EG09 were similar to EG03, fatigue failure occurred after N = 9000 and N = 1,090,000 load cycles, respectively. After monotonic loading, no crack could be observed at the interface. The horizontal and vertical displacement of the interface occurred after N = 2000 load cycles and gradually increased until failure. Thus, the early failure of the rough interface can be evaluated as an aberration and needs further investigations. After exposure, the lattice girders showed fractures of the welded nodes in the area of the failure crack. By the strain measurements of the lattice girders, stress ranges of Δσ = 175 N/mm2 could be determined at the welded nodes. Since the strain gauges were not placed in the immediate area of the failure crack, the stress ranges in the fractured girder nodes might have been considerably higher.
To compare the flexural behavior of the composite specimens, Figure 17a shows the load deflection curves of Specimens EG01–EG03 for the static initial loading and the first load cycle. Despite similar concrete properties, Specimen EG02 with a very smooth surface showed a lower stiffness with a deflection of 7 mm. Thus, separate load-bearing behavior of the precast slab and in situ concrete layer can be assumed. With increasing interface roughness, the inclination of the load–deflection curves increases for Specimens EG01 and EG03, which confirms an improvement of composite action.
A comparison of the development of horizontal interface displacement of Specimens EG02 and EG03 is shown in Figure 17b. The measured horizontal slip at the side of fatigue failure (black curve) shows interface slip after the static initial loading of 1.5 mm for EG02 and 0.7 mm for EG03. During the fatigue loading, the interface slip remained mainly constant for EG02 and increased gradually after increasing the load range. For EG03, a constant increase of interface slip could be determined during the fatigue test with a stepwise increase after about N = 500,000 load cycles. This might be induced by failure of the lattice girder diagonal located in the area of the slip measurement. For this diagonal, stress ranges of Δσ = 230 N/mm2 and fracture after exposure of the specimen could be determined. The horizontal slip of the unimpaired side only showed small displacements with a slight increase during the first fatigue sub-test. A failure, however, did not occur for another N > 1.5 million load cycles.
4.5.3. Influence of Interface Reinforcement Ratio
Figure 18 shows the influence of the interface reinforcement ratio realized by two, three, and four rows of lattice girders by crack patterns of the failure crack in the first sub-test. The compared specimens of Series 1 had a concrete strength of C25/30 and an interface roughness of about Rt = 0.9 mm.
Test Specimen EG03 with small interface reinforcement ratio shows a clear interface failure with considerable interface slip of 1.5 cm. Specimen EG04 with a medium interface reinforcement ratio failed by a shear crack without horizontal interface displacement and only a small interface opening. Specimen EG08 with a high interface reinforcement ratio also failed by a shear crack. A delamination of the interface could not be identified.
4.5.4. Influence of Steel Strains
Figure 19 exemplarily shows the measured steel strains of the diagonals εdia and the welded node εwel of the lattice girders for Specimen EG12 to evaluate the influence of the stress ranges in the lattice girders. The stress range in the diagonals of the lattice girders calculated from the measured steel strain range was about Δσdia = 167 N/mm2 for a period of N > 2.0 million load cycles. This exceeds the approved stress range by 76% according to the technical approvals of the lattice girders of ΔσRsk = 92 N/mm2. The measured stress ranges of the welded nodes were determined to be only Δσwel = 42 N/mm2. After the exposure of the lattice girders, fractures could only be determined in the diagonal and vertical bars of the lattice girders (Figure 19) but not in the welded nodes.
Table 5 compares the largest measured stress ranges in the lattice girders Δσmax,test to the calculated stress ranges Δσcalc,1, determined by the initially applied shear range ΔV1 according to the interface fatigue regulations of the technical approvals [38,39]. The measured stress ranges in the diagonals of the lattice girders, as well as the calculated stress ranges were generally larger than the stress range limit of the technical approvals with ΔσRsk = 92 N/mm2. Despite these high stress ranges, the slabs usually resist more load cycles than expected. Structural failure of the slabs induced by fatigue failure of the lattice girders (in Table 5, tests with fractured lattice girders are labeled by * in the column of Δσmax,test) could generally not be determined after the initially applied load level ΔV1 but only after increasing the top load or the amplitude. Despite Specimen EG09, which can be assessed as aberration, structural failure with fractured lattice girders could only be determined for specimens with large numbers of load cycles and high stress ranges. The failure of individual bars does not generally lead to structural failure, which has already been shown in other fatigue tests on shear reinforcement [9,10].
A more accurate design model considering the number of load cycles applied can better represent the measured stress ranges. However, due to the different crack patterns of the tests and the resulting range of measured steel stresses, a clear influence could not yet be determined. Further investigations are necessary and will be performed in the future.
4.6. Test Evaluation and Comparison to Design Regulations
To assess the interface shear concepts of the general technical approval of the lattice girders for fatigue, the conducted fatigue tests and the fatigue tests from literature (see Section 2.2) were evaluated by the calculated stress ranges in the lattice girders. For the 47 fatigue tests, the calculated characteristic stress ranges Δσtest,Rki were related to the approved stress range according to the technical approvals ΔσRsk = 92 N/mm2 and plotted over the achieved number of load cycles (Figure 20a–c). Even though the design is limited to N = 2.0 million load cycles, all tests were related to the approved stress range of ΔσRsk = 92 N/mm2. Specimens with divergent failure modes, e.g., anchorage failure of lattice girders or longitudinal reinforcement, were excluded. To determine the calculated stress range, the applied shear stress ranges Δv = β ∙ ΔV/(bi ∙ z) were calculated in accordance with [28] (Equation (6.24), Chapter 6.2.5) with β = 1.0 and the applied shear ranges ΔV. The applied shear stress range was then implemented in the interface shear design expression according to [28] (Equation (6.25), Chapter 6.2.5), Equation (1) taken from [29] (Equation (6.25), Chapter 6.2.5) and Equation (2) taken from the technical approvals (TA) of the lattice girders ([41,42], Equation (1), Chapter 3.2.3.5), without partial safety factors.
Relating to the simplified verification with ΔσRsk = 92 N/mm2, the expression of the TA (Figure 20c) gives the best accordance to the test data. The expression according to [28] (Figure 20a), which allows a 50% consideration of the adhesive term for fatigue, and the expression according to [29] (Figure 20b), which neglects the term of adhesion for fatigue and increases the resistance of the interface reinforcement by the factor 1.2, show a similar trend level. The [28] approach, however, gives a larger range of scatter, especially for large numbers of load cycles, whereas [29] shows a small decrease of scatter for large numbers of load cycles.
The verification of the S–N curve for lattice girders, which has been included in the latest revision of the technical approvals (see Section 3.5), is illustrated in Figure 20d. Therefore, the approved characteristic stress ranges were calculated depending on the reached number of load cycles for each test. Figure 20d shows the calculated stress ranges in the lattice girders according to the regulations in the TA related to the approved stress ranges. Compared to the evaluation with an approved stress range of ΔσRsk = 92 N/mm2 (Figure 20c), the evaluation with the S–N curve gives a better agreement, especially for N ≤ 2.0 million load cycles. For N > 2.0 million load cycles, the S–N curve gives smaller allowable stress ranges, which lead to slightly higher related stress ranges in the lattice girders. However, with the S–N curve, the range of application for fatigue design of lattice girders can be extended to a reliable verification allowing N > 2.0 million load cycles.
5. Tests on Continuous Semi-Precast Slabs with Lattice Girders
The design and construction rules for semi-precast slabs with lattice girders for shear and interface shear were derived mainly from tests on single-span beams, representing slab stripes. However, many slabs in building and bridge construction are built as continuous slabs. For continuous slabs and beams, the shear capacity in some member segments is significantly higher than for single-span systems due to the lower shear slenderness, as shown by tests on monolithic structural members [67,68]. Due to the horizontal deformation restraint at the intermediate supports of continuous members, higher load-bearing capacities of the interface around the intermediate supports can also be expected for semi-precast slabs. The influence of a continuous member on the composite joint and shear bearing capacity of semi-precast slabs has not yet been clarified for both static and cyclic loading.
The shear capacity of beams and slabs is significantly influenced by the shear slenderness [68,69,70,71,72,73,74,75,76]. In the relevant area for the shear design, the shear capacity increases for small shear slenderness and decreases for large shear slenderness. The shear slenderness corresponds to the ratio of the distance between the point of contraflexure and the maximum moment to the effective depth and is generally described by λ = M/(V·d). For statically determinate single-span beams under concentrated loads, the shear slenderness can be described in a simplified way as a function of the load distance to the support a with λ = a/d. This simplified calculation is not possible for statically indeterminate continuous beams. For the same load distance to the support related to the static effective depth a/d, significantly smaller shear slenderness λ results for intermediate supports of continuous beams than for single-span beams and end supports (Figure 21a) and thus also larger shear-bearing capacities.
Current investigations on slab stripes without shear reinforcement [77,78] confirm these relationships (Figure 21b). For continuous beams, smaller shear slendernesses and thus larger load capacities result for the same load distances. Investigations on continuous beams with shear reinforcement [79,80,81,82,83,84,85] also confirm the increase in load-carrying capacity, which is partially lost with increasing shear reinforcement ratio. The positive influence of shear slenderness is not taken into account according to the current design concepts for semi-precast slabs [41,42], which usually have small and medium shear reinforcement ratios.
For this reason, tests on single-span slabs with a loaded cantilever have been included in the current Series 3 (h = 16 cm) and 4 (h = 34 cm). The single-span slab with a cantilever as a static determined system is representative for a test on a continuous slab and can provide knowledge about the bearing capacities in the area of the intermediate support. Static and cyclic tests are carried out (Figure 22). To extend the data from Series 0, 1, and 2 and to better classify the tests on intermediate supports, static and cyclic tests on single span slabs are also performed for the same combination of parameters as for slabs with cantilevers. In order to characterize the development of shear cracks and cracks along the horizontal interface, the method of digital image correlation is employed [86]. A publication on Test Series 3 and 4 will appear after the experiments have been executed and evaluated.
6. Summary and Conclusions
To investigate the fatigue behavior of semi-precast slabs with lattice girders, small size tests with lattice girder diagonals cast in concrete cubes were carried out. For all cyclic tests, failure of the lattice girder diagonals occurred in the region of the weld point, with static tests failing in the free diagonal between welding points and load application. For these small-body tests, S–N curves in accordance with EC2+NA(D) were derived using the interactive method. The results were already included in the revision of the technical approvals.
Subsequently, the fatigue behavior of slab specimens was investigated by 14 fatigue tests with two sub-tests. The test parameters were interface roughness, slab thickness, interface reinforcement ratio, and concrete strength. The following findings can be drawn from the investigations:
- For the fatigue tests, higher scatter occurred compared to static tests. The scatter concerns the failure mode, interface delamination, strain of lattice girders, and achieved number of load cycles.
- The failure of specimens with low degrees of interface reinforcement was generally induced by interface failure after high numbers of load cycles with N > 2.0 million. Therefore, the bearable fatigue load level generally increases with increasing roughness. Only one specimen with a rough interface had an unexpected premature failure, which needs further investigation.
- Specimens with medium interface reinforcement ratios failed predominantly by vertical shear with only small interface delamination.
- The failure of specimens with high interface reinforcement ratios was generally introduced by anchorage failure of the lattice girder in the compression zone or by anchorage failure of the longitudinal reinforcement.
- The stress ranges in the lattice girders determined by test results were considerably higher compared to the approved stress range according to the technical approvals.
So far, a direct comparison between static and fatigue resistance is not possible due to missing tests. Tests currently in progress will close this gap.
The fatigue design for lattice girders according to the technical approvals can generally be confirmed by the own tests; however, they are conservative. By applying the derived S–N curve, the evaluation leads to a better agreement of design expression and test data for N ≤ 2.0 million load cycles. Furthermore, the range of fatigue application for lattice girders could be extended to N > 2.0 million load cycles.
Since many slabs in building and bridge constructions are built as continuous slabs, for which higher load-bearing capacities of shear and shear interface around the intermediate supports can also be expected, this hypothesis is currently under investigation for semi-precast slabs.
Author Contributions
Conceptualization, M.H., J.H. and K.W.; methodology, M.H., K.W., M.C. and J.H.; validation, M.H., K.W., M.S. and M.C.; formal analysis, M.H. and K.W.; investigation, K.W.; data curation, M.H. and K.W.; writing—original draft preparation, M.H. and K.W.; writing—review and editing, M.H., M.S., M.C. and J.H.; visualization, M.H. and K.W.; supervision, M.C. and J.H.; project administration, J.H.; funding acquisition, J.H. All authors have read and agreed to the published version of the manuscript.
Funding
The investigations described in this paper are conducted during research programs initiated by the Research Association of the German Concrete and Precast Industry e.V. and funded by the German Federation of Industrial Research Association (AiF, IGF grant numbers 18407 N/1 and 20580 N) and the Federal Ministry for Economic Affairs and Energy based on a resolution of the German Bundestag.
Data Availability Statement
The data presented in this study are available on request from the corresponding author.
Acknowledgments
The authors express their thanks to the sponsors and the members of the project committee for the constructive discussions.
Conflicts of Interest
The authors declare no conflict of interest. The funders had no role in the design of the study; in the collection, analyses, or interpretation of data; in the writing of the manuscript; or in the decision to publish the results.
References
- Furche, J.; Bauermeister, U. Flachdecken in Elementbauweise mit Gitterträgern. Beton-Stahlbetonbau 2014, 109, 783–792. [Google Scholar] [CrossRef]
- Chang, T.S.; Kesler, C.E. Fatigue Behavior of Reinforced Concrete Beams. J. Am. Concr. Inst. 1958, 55, 245–254. [Google Scholar]
- Price, K.M.; Edwards, A.D. Fatigue Strength in Shear of Prestressed Concrete I-Beams. ACI J. 1971, 68, 282–292. [Google Scholar]
- Frey, R.P. Fatigue design concept considering the indefinite state of stress in the reinforcement of RC-beams. IABSE Rep. 1982, 37, 409–414. [Google Scholar]
- Ueda, T.; Okamura, H. Behavior in shear of reinforced concrete beams under fatigue loading. Concr. Libr. JSCE 1983, 37, 37–69. [Google Scholar]
- Kwak, K.-H.; Park, J.-G. Shear-fatigue behavior of high-strength reinforced concrete beams under repeated loading. Struct. Eng. Mech. 2001, 11, 301–314. [Google Scholar] [CrossRef]
- Gallego, J.M.; Zanuy, C.; Albajar, L. Shear fatigue behaviour of reinforced concrete elements without shear reinforcement. Eng. Struct. 2014, 79, 45–57. [Google Scholar] [CrossRef]
- Rombach, G.A.; Kohl, M. Fatigue Strength of Reinforced Concrete Beams without Links under Shear Loads. ACI Struct. J. 2016, 113, 941–950. [Google Scholar] [CrossRef]
- Hillebrand, M.; Teworte, F.; Hegger, J. Shear fatigue of prestressed I-beams with shear reinforcement. Struct. Concr. 2021, 22, 1085–1099. [Google Scholar] [CrossRef]
- Hillebrand, M.; Hegger, J. Fatigue testing of shear reinforcement in prestressed concrete T-beams of bridges. Appl. Sci. 2020, 10, 5560. [Google Scholar] [CrossRef]
- Schläfli, M.; Brühwiler, E. Fatigue of existing reinforced concrete bridge deck slabs. Eng. Struct. 1998, 20, 991–998. [Google Scholar] [CrossRef]
- Natário, F.; Fernández Ruiz, M.; Muttoni, A. Experimental investigation on fatigue of concrete cantilever bridge deck slabs subjected to concentrated loads. Eng. Struct. 2015, 89, 191–203. [Google Scholar] [CrossRef] [Green Version]
- Lantsoght, E.O.L.; van der Veen, C.; Koekkoek, R.; Sliedrecht, H. Fatigue Testing of Transversely Prestressed Concrete Decks. ACI Struct. J. 2019, 116, 143–154. [Google Scholar] [CrossRef] [Green Version]
- Lantsoght, E.O.L.; Koekkoek, R.; van der Veen, C.; Sliedrecht, H. Fatigue Assessment of Prestressed Concrete Slab-Between-Girder Bridges. Appl. Sci. 2019, 9, 2312. [Google Scholar] [CrossRef] [Green Version]
- Löfgren, I. Lattice Girder Elements_Investigation of structural behaviour and performance enhancements. Nord. Concr. Res. 2003, 29, 85–104. [Google Scholar]
- Figueiredo Filho, J.R.; Shiramizu, A.K.H. Design, manufacture and construction of buildings with precast lattice-reinforced concrete slabs. IBRACON Struct. Mater. J. 2011, 4, 123–146. [Google Scholar] [CrossRef] [Green Version]
- Mahmutovic, A.; Zuna, S. Trends in the improvement of lattice girders production technology in steelwork zenica. In Trends in the Development of Machinery and Associated Technology, Proceedings of the 15th International Research/Expert Conference, Prague, Czech Republic, 12–18 September 2011; Ekinović, S., Calvet, J.V., Tacer, E., Eds.; Faculty of Mechanical Engineering: Zenica, Bosnia and Herzegovina; pp. 185–188.
- Youn, S.-G.; Cho, G.-D. Experimental Study on the Cracking Loads of LB-DECKs with Varied Cross-Section Details. J. Korea Concr. Inst. 2011, 23, 657–665. [Google Scholar] [CrossRef]
- Newell, S.; Goggins, J. Experimental study of hybrid precast concrete lattice girder floor at construction stage. Structures 2019, 20, 866–885. [Google Scholar] [CrossRef]
- Qi, J.; Yang, H.-C. Improvement of a Truss-Reinforced, Half-Concrete Slab Floor System for Construction Sustainability. Sustainability 2021, 13, 3731. [Google Scholar] [CrossRef]
- Eum, K.-Y.; Lee, J.-H.; Park, Y.-K.; Yun, J.; Jeong, S. Analysis of Spiral Lattice Girder Shape in preparation for HSR Speed Increase. Int. J. Railw. 2013, 6, 160–168. [Google Scholar] [CrossRef]
- Newell, S.; Goggins, J.; Hajdukiewicz, M. Real-time monitoring to investigate structural performance of hybrid precast concrete educational buildings. J. Struct. Integr. Maint. 2016, 1, 147–155. [Google Scholar] [CrossRef] [Green Version]
- Zhang, X.; Li, H.; Liang, S.; Zhang, H. Experimental and Numerical Study of Lattice Girder Composite Slabs with Monolithic Joint. Crystals 2021, 11, 219. [Google Scholar] [CrossRef]
- Zhang, X.; Zhu, X.; Xie, Z.; Yang, Y.; Liang, S. On-Site Experimental and Numerical Investigations of Latticed Girder Composite Slabs. Sustainability 2021, 13, 3775. [Google Scholar] [CrossRef]
- Eligehausen, R.; Vocke, H.; Clauss, A.; Furche, J.; Bauermeister, U. Neue Durchstanzbewehrung für Elementdecken. Beton- Stahlbetonbau 2003, 98, 334–344. [Google Scholar] [CrossRef]
- Held, M.; Welsch, T. Besondere Aspekte bei der Verwendung von Gitterträger-Elementdecken zur Herstellung punktgestützter Flachdecken. Bautechnik 2011, 88, 233–236. [Google Scholar] [CrossRef]
- Junker, F.; Holschemacher, K.; Müller, T. Shear-friction behavior of traditional and self-consolidating concrete in reinforced precast elements with in-situ concrete overlay. In Proceedings of the 10th Central European Congress on Concrete Engineering “Concrete Offers for The Period of Economic Recovery”, Liberec, Czech Republic, 1–2 October 2014; pp. 1–7. [Google Scholar] [CrossRef]
- DIN Deutsches Institut für Normung e.V. Eurocode 2: Bemessung und Konstruktion von Stahlbeton- und Spannbetontragwerken—Teil 1-1: Allgemeine Bemessungsregeln und Regeln für den Hochbau: Deutsche Fassung EN 1992-1-1:2004 + AC:2010; ICS 91.010.30, 91.080.40 (DIN EN 1992-1-1:2011-01); Beuth: Berlin, Germany, 2011. [Google Scholar]
- DIN Deutsches Institut für Normung e.V. Nationaler Anhang—National Festgelegte Parameter—Eurocode 2: Bemessung und Konstruktion von Stahlbeton- und Spannbetontragwerken—Teil 1-1: Allgemeine Bemessungsregeln und Regeln für den Hochbau; ICS 91.010.30, 91.080.40 (DIN EN 1992-1-1/NA:2013-04); Beuth: Berlin, Germany, 2013. [Google Scholar]
- Beutel, R.; Hegger, J. The Effect of Anchorage on the Effectiveness of the Shear Reinforcement in the Punching Zone. Cem. Concr. Compos. 2002, 24, 539–549. [Google Scholar] [CrossRef]
- Park, H.-G.; Kim, Y.-N.; Song, J.-G.; Kang, S.-M. Lattice Shear Reinforcement for Enhancement of Slab-Column Connections. J. Struct. Eng. 2012, 138, 425–437. [Google Scholar] [CrossRef]
- Kueres, D.; Siburg, C.; Hegger, J.; Furche, J.; Sippel, T. Zur konstruktiven Durchbildung des Decke-Stütze-Knotens in Flachdecken aus Elementplatten. Bautechnik 2016, 93, 356–365. [Google Scholar] [CrossRef]
- Eom, T.-S.; Song, J.-W.; Song, J.-K.; Kang, G.-S.; Yoon, J.-K.; Kang, S.-M. Punching-shear behavior of slabs with bar truss shear reinforcement on rectangular columns. Eng. Struct. 2017, 134, 390–399. [Google Scholar] [CrossRef]
- Hegger, J.; Sherif, A.G.; Kueres, D.; Siburg, C. Efficiency of Various Punching Shear Reinforcement Systems for Flat Slabs. ACI Struct. J. 2017, 114, 631–642. [Google Scholar] [CrossRef]
- Furche, J.; Schmidt, P. Orthogonal Arrangement of Effective Lattice Punching Shear Reinforcement. In Concrete-Innovations in Materials, Design and Structures, Proceedings of the 2019 fib Symposium, Krakow, Poland, 27–29 May 2019; Derkowski, W., Gwozdziewicz, P., Hojdys, L., Krajewski, P., Pantak, M., Eds.; International Federation for Structural Concrete (fib): Lausanne, Switzerland, 2019; pp. 2209–2217. ISBN 978-2-940643-00-4. [Google Scholar]
- Furche, J.; Bauermeister, U.; Kummerow, A.; Hillebrand, M. Durchstanzen bei Ermüdungsbeanspruchung. Beton-Stahlbetonbau 2019, 87, 216. [Google Scholar] [CrossRef]
- Ferreira, M.P.; Pereira Filho, M.J.M.; Freitas, M.V.P.; Lima Neto, A.F.; Melo, G.S.S.A. Experimental resistance of slab-column connections with prefabricated truss bars as punching shear reinforcement. Eng. Struct. 2021, 233, 1–14. [Google Scholar] [CrossRef]
- Badische Drahtwerke GmbH. Allgemeine Bauaufsichtliche Zulassung Z-15.1-38: Kaiser-Omnia-Träger KTS für Fertigplatten mit Statisch Mitwirkender Ortbetonschicht; DIBt: Berlin, Germany, 2015. [Google Scholar]
- Filigran Trägersysteme GmbH & Co., KG. Allgemeine Bauaufsichtliche Zulassung Z-15.1-93: Filigran-EQ-Gitterträger für Fertigplatten mit Statisch Mitwirkender Ortbetonschicht; DIBt: Berlin, Germany, 2014. [Google Scholar]
- Weber, J.W.; Schmidt, R. Zulassungsversuche für den Filigran EQ-Träger unter Dynamischer Beanspruchung: Prüfbericht A2064; Institut für Bauforschung: Aachen, Germany, 1989. [Google Scholar]
- Baustahlgewebe Gmbh. Allgemeine Bauaufsichtliche Zulassung Z-15.1-38: Gitterträger KTS für Fertigplatten mit Statisch Mitwirkender Ortbetonschicht; DIBt: Berlin, Germany, 2020. [Google Scholar]
- Filigran Trägersysteme GmbH & Co., KG. Allgemeine Bauaufsichtliche Zulassung Z-15.1-93: Filigran-EQ-Gitterträger für Fertigplatten mit Statisch Mitwirkender Ortbetonschicht; DIBt: Berlin, Germany, 2019. [Google Scholar]
- Hegger, J.; Wieneke, K. Ermüdung von Elementdecken mit Gitterträgern: Abschlussbericht zum IGF-Forschungsvorhaben 18407 N/1; Institutsbericht 383/2017 (Test Report); Institut für Massivbau: Aachen, Germany, 2017. [Google Scholar]
- Baustahlgewebe GmbH. Allgemeine Bauaufsichtliche Zulassung Z-15.2-100: Gittertraeger KT 800, KT900 oder KTE und Anwendungsbestimmungen für Wandartige Bauwerksstrukturen bei Verwendung Dieser Bewehrung; DIBt: Berlin, Germany, 2020. [Google Scholar]
- Baustahlgewebe GmbH. Allgemeine Bauaufsichtliche Zulassung Z-15.2-9 Gitterträger KTW 200 oder KTW 300 und Anwendungsbestimmungen für Wandartige Bauwerksstrukturen bei Verwendung Dieser Bewehrung; DIBt: Berlin, Germany, 2020. [Google Scholar]
- Baustahlgewebe GmbH. Allgemeine Bauaufsichtliche Zulassung Z-15.1-136 Gittertraeger KT 100 fuer Fertigplatten mit Statisch Mitwirkender Ortbetonschicht (Montaquick-Fertigplatten); DIBt: Berlin, Germany, 2020. [Google Scholar]
- Filigran Trägersysteme GmbH & Co., KG. European Technical Assessment ETA-13/0521: Filigran FDB: Filigran Lattice Girders as Punching Reinforcement; DIBt: Berlin, Germany, 2018. [Google Scholar]
- Filigran Trägersysteme GmbH & Co., KG. Allgemeine Bauaufsichtliche Zulassung Z-15.2-40: Filigran-D- und/oder Filigran-E- und/oder Filigran-EW- und/oder Filigran-SE/SE2- und/oder Filigran-SWE- und Filigran-EQ-Gitterträger und Anwendungsbestimmungen für Wandartige Bauwerksstrukturen aus Elementwänden bei Verwendung Dieser Bewehrung; DIBt: Berlin, Germany, 2020. [Google Scholar]
- Intersig NV. Allgemeine Bauaufsichtliche Zulassung Z-15.1-143: Intersig-EQ-Gitterträger; DIBt: Berlin, Germany, 2020. [Google Scholar]
- Schießl, P.; Schwarzkopf, M. Kaiser Omnia-Träger KTS für Fertigplatten mit Statisch Mitwirkender Ortbetonschicht bei Dynamischer Beanspruchung; Institut für Betonstahl und Stahlbetonbau: Munich, Germany, 1985. [Google Scholar]
- Schießl, P.; Schwarzkopf, M. Montaquick Teilfertigdecken mit Statischer Ortbetonschicht bei Dynamischer Beanspruchung: Versuchsbericht; Serie 1; Institut für Betonstahl und Stahlbetonbau: Munich, Germany, 1981. [Google Scholar]
- Weber, J.W. Zulassungsversuche für die Kaiser-Omnia-Plattenwand mit Gitterträgern KTW 200 oder KTW 300 bei Dynamischer Belastung, Prüfbericht A 2889; Institut für Bauforschung: Aachen, Germany, 1995. [Google Scholar]
- Wieneke, K.M. Horizontal Shear Design of Concrete Interfaces in Beam and Slab Structures. Ph.D. Thesis, RWTH Aachen University, Aachen, Germany, 2019. [Google Scholar]
- DIN Deutsches Institut für Normung e.V. Beton und Stahlbeton, Bemessung und Ausführung (Zurückgezogen); (DIN 1045:1988-07); Beuth: Berlin, Germany, 1988. [Google Scholar]
- Deutscher Ausschuss für Stahlbeton; Bertram, D.; Bunke, N. Erläuterungen zu DIN 1045, Beton- und Stahlbeton, Ausgabe 07.88—Hinweise für die Verwendung von Zement zu Beton, Grundlagen für die Neuregelung zur Beschränlung der Rißbreite Erläuterungen zur Richtlinie für Beton mit Fließmitteln für Fließbeton; Beuth: Berlin, Germany, 1989; pp. 3–144. ISBN 9783410658009. [Google Scholar]
- Wieneke, K.; van Elten, L.; Claßen, M.; Hegger, J. Ermüdung von Elementdecken mit Gitterträgern. Beton-Stahlbetonbau 2017, 112, 723–733. [Google Scholar] [CrossRef]
- Maurer, R.; Block, K.; Dreier, F. Ermüdungsfestigkeit von Betonstahl-Bestimmung mit dem Interaktiven Verfahren. Bauingenieur 2010, 85, 17–28. [Google Scholar]
- Block, K. The Interactive Method—Reliable and Reproducible S-N-Curves for Materials. In Mechanical Fatigue of Metals; Correia, J.A.F.O., Jesus, A.M.P., de Fernandes, A.A., Calçada, R., Eds.; Springer International Publishing: Cham, Switzerland, 2019; pp. 197–204. ISBN 978-3-030-13979-7. [Google Scholar]
- DIN Deutsches Institut für Normung e.V. Stähle für die Bewehrung und das Vorspannen von Beton–Prüfverfahren–Teil 1: Bewehrungsstäbe, Walzdraht und Draht; ICS 77.140.15 (DIN EN ISO 15630-1:2019-05); Beuth: Berlin, Germany, 2019. [Google Scholar]
- DIN Deutsches Institut für Normung e.V. Betonstahl-Teil 1: Stahlsorten, Eigenschaften, Kennzeichnung; (DIN 488-1:2009-08); Beuth: Berlin, Germany, 2009. [Google Scholar]
- Wieneke, K.; Claßen, M.; Hegger, J. Elementdecken mit Gitterträgern unter zyklischer Belastung. Beton-Stahlbetonbau 2017, 112, 579–588. [Google Scholar] [CrossRef]
- Wieneke, K.; Hegger, J. Fatigue of Semi-precast Slabs with Lattice Girders. In High Tech Concrete: Where Technology and Engineering Meet, Proceedings of the 2017 fib Symposium, Maastricht, The Netherlands, 12–14 June 2017; Hordijk, D.A., Luković, M., Eds.; Springer International Publishing: Cham, Switzerland, 2017; pp. 921–928. ISBN 3319594710. [Google Scholar]
- DIN Deutsches Institut für Normung e.V. Tragwerke aus Beton, Stahlbeton und Spannbeton–Teil 1: Bemessung und Konstruktion; ICS 91.080.40 (DIN 1045-1:2008-08); Beuth: Berlin, Germany, 2008. [Google Scholar]
- Kaufmann, N. Das Sandflächenverfahren. Strassenbau Tech. 1971, 24, 131–135. [Google Scholar]
- Vogler, N.; Gluth, G.; Oppat, K.; Kühne, H.-C. Charakterisierung von Bauteiloberflächen-Rautiefebestimmung mittels konventioneller und laserbasierter Verfahren. Bauingenieur 2017, 92, 97–104. [Google Scholar] [CrossRef]
- Wieneke, K.; Herbrand, M.; Vogler, N.; Schwermann, R.; Blankenbach, J. Messverfahren zur Bestimmung der Rautiefe von Betonoberflächen. Bauingenieur 2018, 93, 365–373. [Google Scholar] [CrossRef]
- Ungermann, J.; Adam, V.; Classen, M. Fictitious Rough Crack Model (FRCM): A Smeared Crack Modelling Approach to Account for Aggregate Interlock and Mixed Mode Fracture of Plain Concrete. Materials 2020, 13, 2774. [Google Scholar] [CrossRef] [PubMed]
- Islam, M.S.; Pam, H.J.; Kwan, A.K.H. Shear capacity of high strength concrete beams with their point of inflection within the shear span. Proc. Inst. Civ. Eng. Struct. Build. 1998, 128, 91–99. [Google Scholar] [CrossRef] [Green Version]
- Tue, N.V.; Ehmann, R.; Tung, N.D. Schubversuche an Stahlbetonbalken unterschiedlicher M/V-Kombinationen. BuSt 2015, 110, 446–457. [Google Scholar] [CrossRef]
- Leonhardt, F.; Walther, R. Schubversuche an Einfeldrigen Stahlbetonbalken Mit und Ohne Schubbewehrung zur Ermittlung der Schubtragfähigkeit und der Oberen Schubspannungsgrenze: DAfStb-Heft 151; Ernst & Sohn: Berlin, Germany, 1962. [Google Scholar]
- Yang, Y.; Walraven, J.C.; Uijl, J.D. Shear Behavior of Reinforced Concrete Beams without Transverse Reinforcement Based on Critical Shear Displacement. J. Struct. Eng. 2017, 143, 1–13. [Google Scholar] [CrossRef]
- Reissen, K.; Classen, M.; Hegger, J. Shear in reinforced concrete slabs—Experimental investigations in the effective shear width of one-way slabs under concentrated loads and with different degrees of rotational restraint. Struct. Concr. 2018, 19, 36–48. [Google Scholar] [CrossRef] [Green Version]
- Bielak, J.; Adam, V.; Hegger, J.; Classen, M. Shear Capacity of Textile-Reinforced Concrete Slabs without Shear Reinforcement. Appl. Sci. 2019, 9, 1382. [Google Scholar] [CrossRef] [Green Version]
- Classen, M. Shear Crack Propagation Theory (SCPT)—The mechanical solution to the riddle of shear in RC members without shear reinforcement. Eng. Struct. 2020, 210, 110207. [Google Scholar] [CrossRef]
- Schmidt, M.; Schmidt, P.; Wanka, S.; Classen, M. Shear Response of Members without Shear Reinforcement—Experiments and Analysis Using Shear Crack Propagation Theory (SCPT). Appl. Sci. 2021, 11, 3078. [Google Scholar] [CrossRef]
- Adam, V. Shear in Reinforced Concrete Structures without Shear Reinforcement—Analysis and Design. Ph.D. Thesis, RWTH Aachen University, Aachen, Germany, 2021. [Google Scholar]
- Adam, V.; Herbrand, M.; Claßen, M. Experimentelle Untersuchungen zum Einfluss der Bauteilbreite und der Schubschlankheit auf die Querkrafttragfähigkeit von Stahlbetonplatten ohne Querkraftbewehrung. Bauingenieur 2018, 93, 37–45. [Google Scholar] [CrossRef]
- Adam, V.; Classen, M.; Hillebrand, M.; Hegger, J. Shear in Continuous Slab Segments without Shear Reinforcement under Distributed Loads. In Concrete-Innovations in Materials, Design and Structures, Proceedings of the 2019 fib Symposium 2019, Krakow, Poland, 27–29 May 2019; Derkowski, W., Gwozdziewicz, P., Hojdys, L., Krajewski, P., Pantak, M., Eds.; International Federation for Structural Concrete (fib): Lausanne, Switzerland, 2019; pp. 1771–1778. ISBN 978-2-940643-00-4. [Google Scholar]
- Leonhardt, F.; Walther, R.; Dilger, W. Schubversuche an Durchlaufträgern (Zweifeldrige Stahlbetonbalken mit und ohne Schubbewehrung): DAfStb-Heft 163; Ernst & Sohn: Berlin, Germany, 1964. [Google Scholar]
- Herbrand, M.; Hegger, J. Experimentelle Untersuchungen zum Einfluss einer externen Vorspannung auf die Querkrafttragfähigkeit vorgespannter Durchlaufträger. Bauingenieur 2013, 88, 428–437. [Google Scholar]
- Maurer, R.; Gleich, P.; Zilch, K.; Dunkelberg, D. Querkraftversuch an einem Durchlaufträger aus Spannbeton. Beton-Stahlbetonbau 2014, 109, 654–665. [Google Scholar] [CrossRef]
- Teworte, F.; Herbrand, M.; Hegger, J. Structural Assessment of Concrete Bridges in Germany—Shear Resistance under Static and Fatigue Loading. Struct. Eng. Int. 2015, 25, 266–274. [Google Scholar] [CrossRef]
- Herbrand, M.; Classen, M. Shear tests on continuous prestressed concrete beams with external prestressing. Struct. Concr. 2015, 16, 428–437. [Google Scholar] [CrossRef]
- Gleich, P.; Kattenstedt, S.; Maurer, R. Erweitertes Druckbogenmodell für die Bestimmung der Querkrafttragfähigkeit von Stahl- und Spannbetonbalken. Beton-Stahlbetonbau 2016, 111, 268–277. [Google Scholar] [CrossRef]
- Herbrand, M.; Classen, M.; Adam, V. Querkraftversuche an Spannbetondurchlaufträgern mit Rechteck-und I-Querschnitt. Bauingenieur 2017, 92, 465–473. [Google Scholar] [CrossRef]
- Hegger, J.; Sherif, A.; Görtz, S. Investigation of Pre- and Postcracking Shear Behavior of Prestressed Concrete Beams Using Innovative Measuring Techniques. ACI Struct. J. 2004, 101, 183–192. [Google Scholar]
Figure 1.
Lattice girder types approved for fatigue in semi-precast slabs (a–c) and element walls (a,d).
Figure 1.
Lattice girder types approved for fatigue in semi-precast slabs (a–c) and element walls (a,d).


Figure 3.
Test specimen and test setup for fatigue tests with lattice girders KTS according to [50].
Figure 3.
Test specimen and test setup for fatigue tests with lattice girders KTS according to [50].
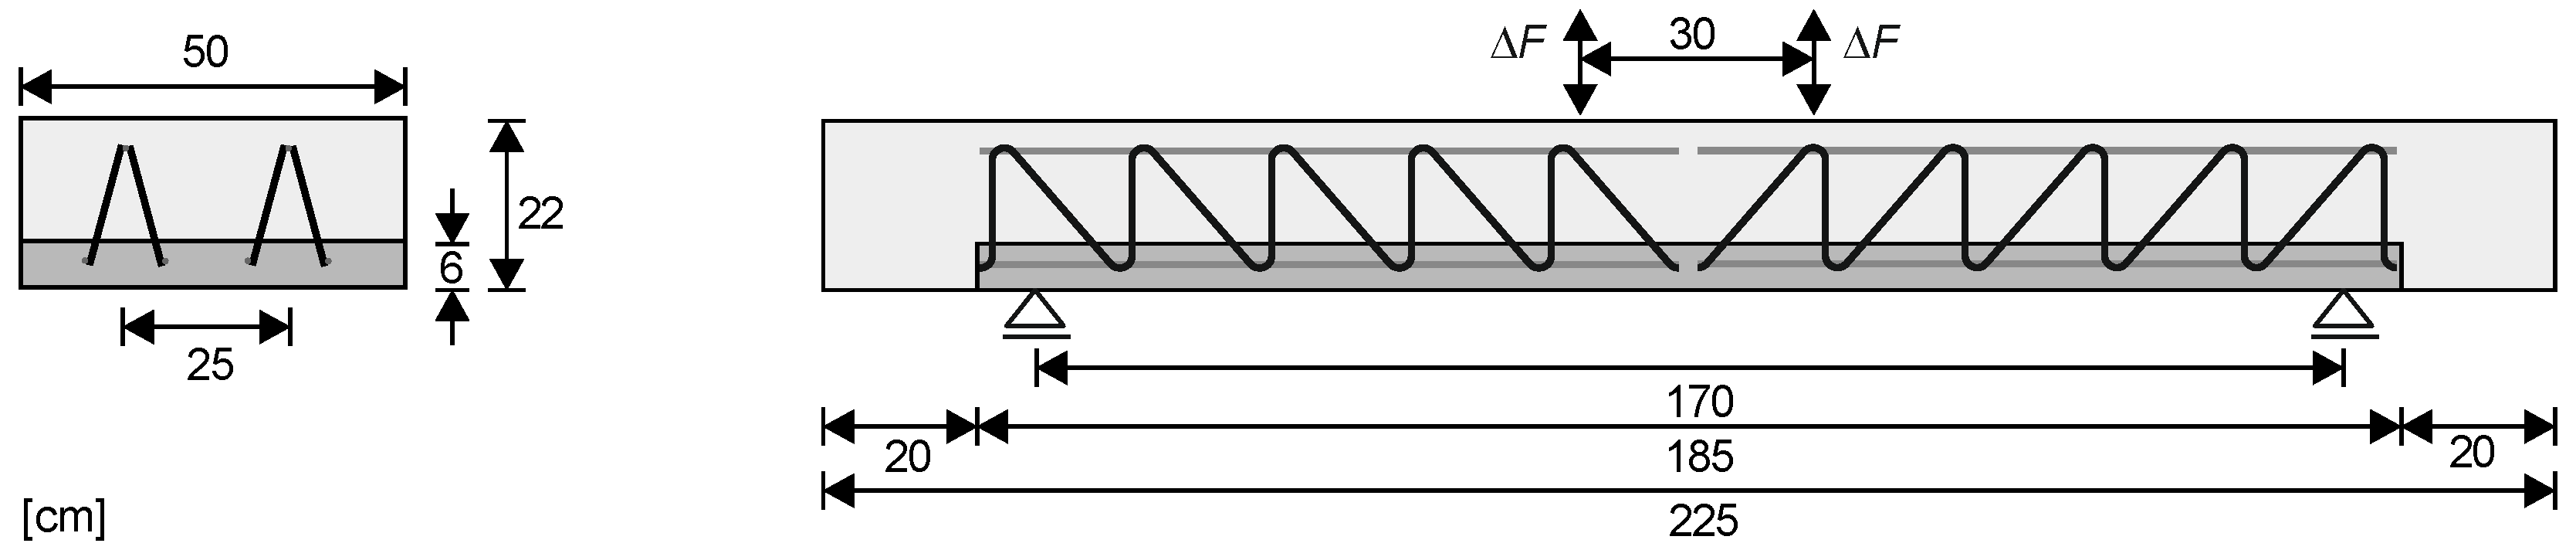
Figure 4.
Investigations to determine the stress range resistance according to [40,52]: test setup (a), fracture of node (b), and test results (c).

Figure 5.
S–N curve (a) and process description of test procedure (b) according to the interactive method [57].
Figure 5.
S–N curve (a) and process description of test procedure (b) according to the interactive method [57].

Figure 6.
Schematic depiction of fatigue test setup (a), node of lattice girder in formwork (b), and test setup for fatigue tests (c) [43].
Figure 6.
Schematic depiction of fatigue test setup (a), node of lattice girder in formwork (b), and test setup for fatigue tests (c) [43].

Figure 7.
Fracture pattern of small size specimen under monotonic loading (a), cyclic loading (b), and fatigue fracture of welded node (red marking) (c) with definition of fatigue zone (orange) and final rupture zone (blue) (d).
Figure 7.
Fracture pattern of small size specimen under monotonic loading (a), cyclic loading (b), and fatigue fracture of welded node (red marking) (c) with definition of fatigue zone (orange) and final rupture zone (blue) (d).

Figure 8.
Test results of small size fatigue tests for lower and upper chords with reference tests from literature.
Figure 8.
Test results of small size fatigue tests for lower and upper chords with reference tests from literature.

Figure 9.
Fatigue test results of lower and upper chords with mean functions (a) and 5% quantile functions (b) [43].
Figure 9.
Fatigue test results of lower and upper chords with mean functions (a) and 5% quantile functions (b) [43].


Figure 11.
Schematic test setup of fatigue tests: Sub-Test I (a) and Sub-Test II (b).

Figure 12.
Overview of test specimens and test parameters [43].
Figure 12.
Overview of test specimens and test parameters [43].
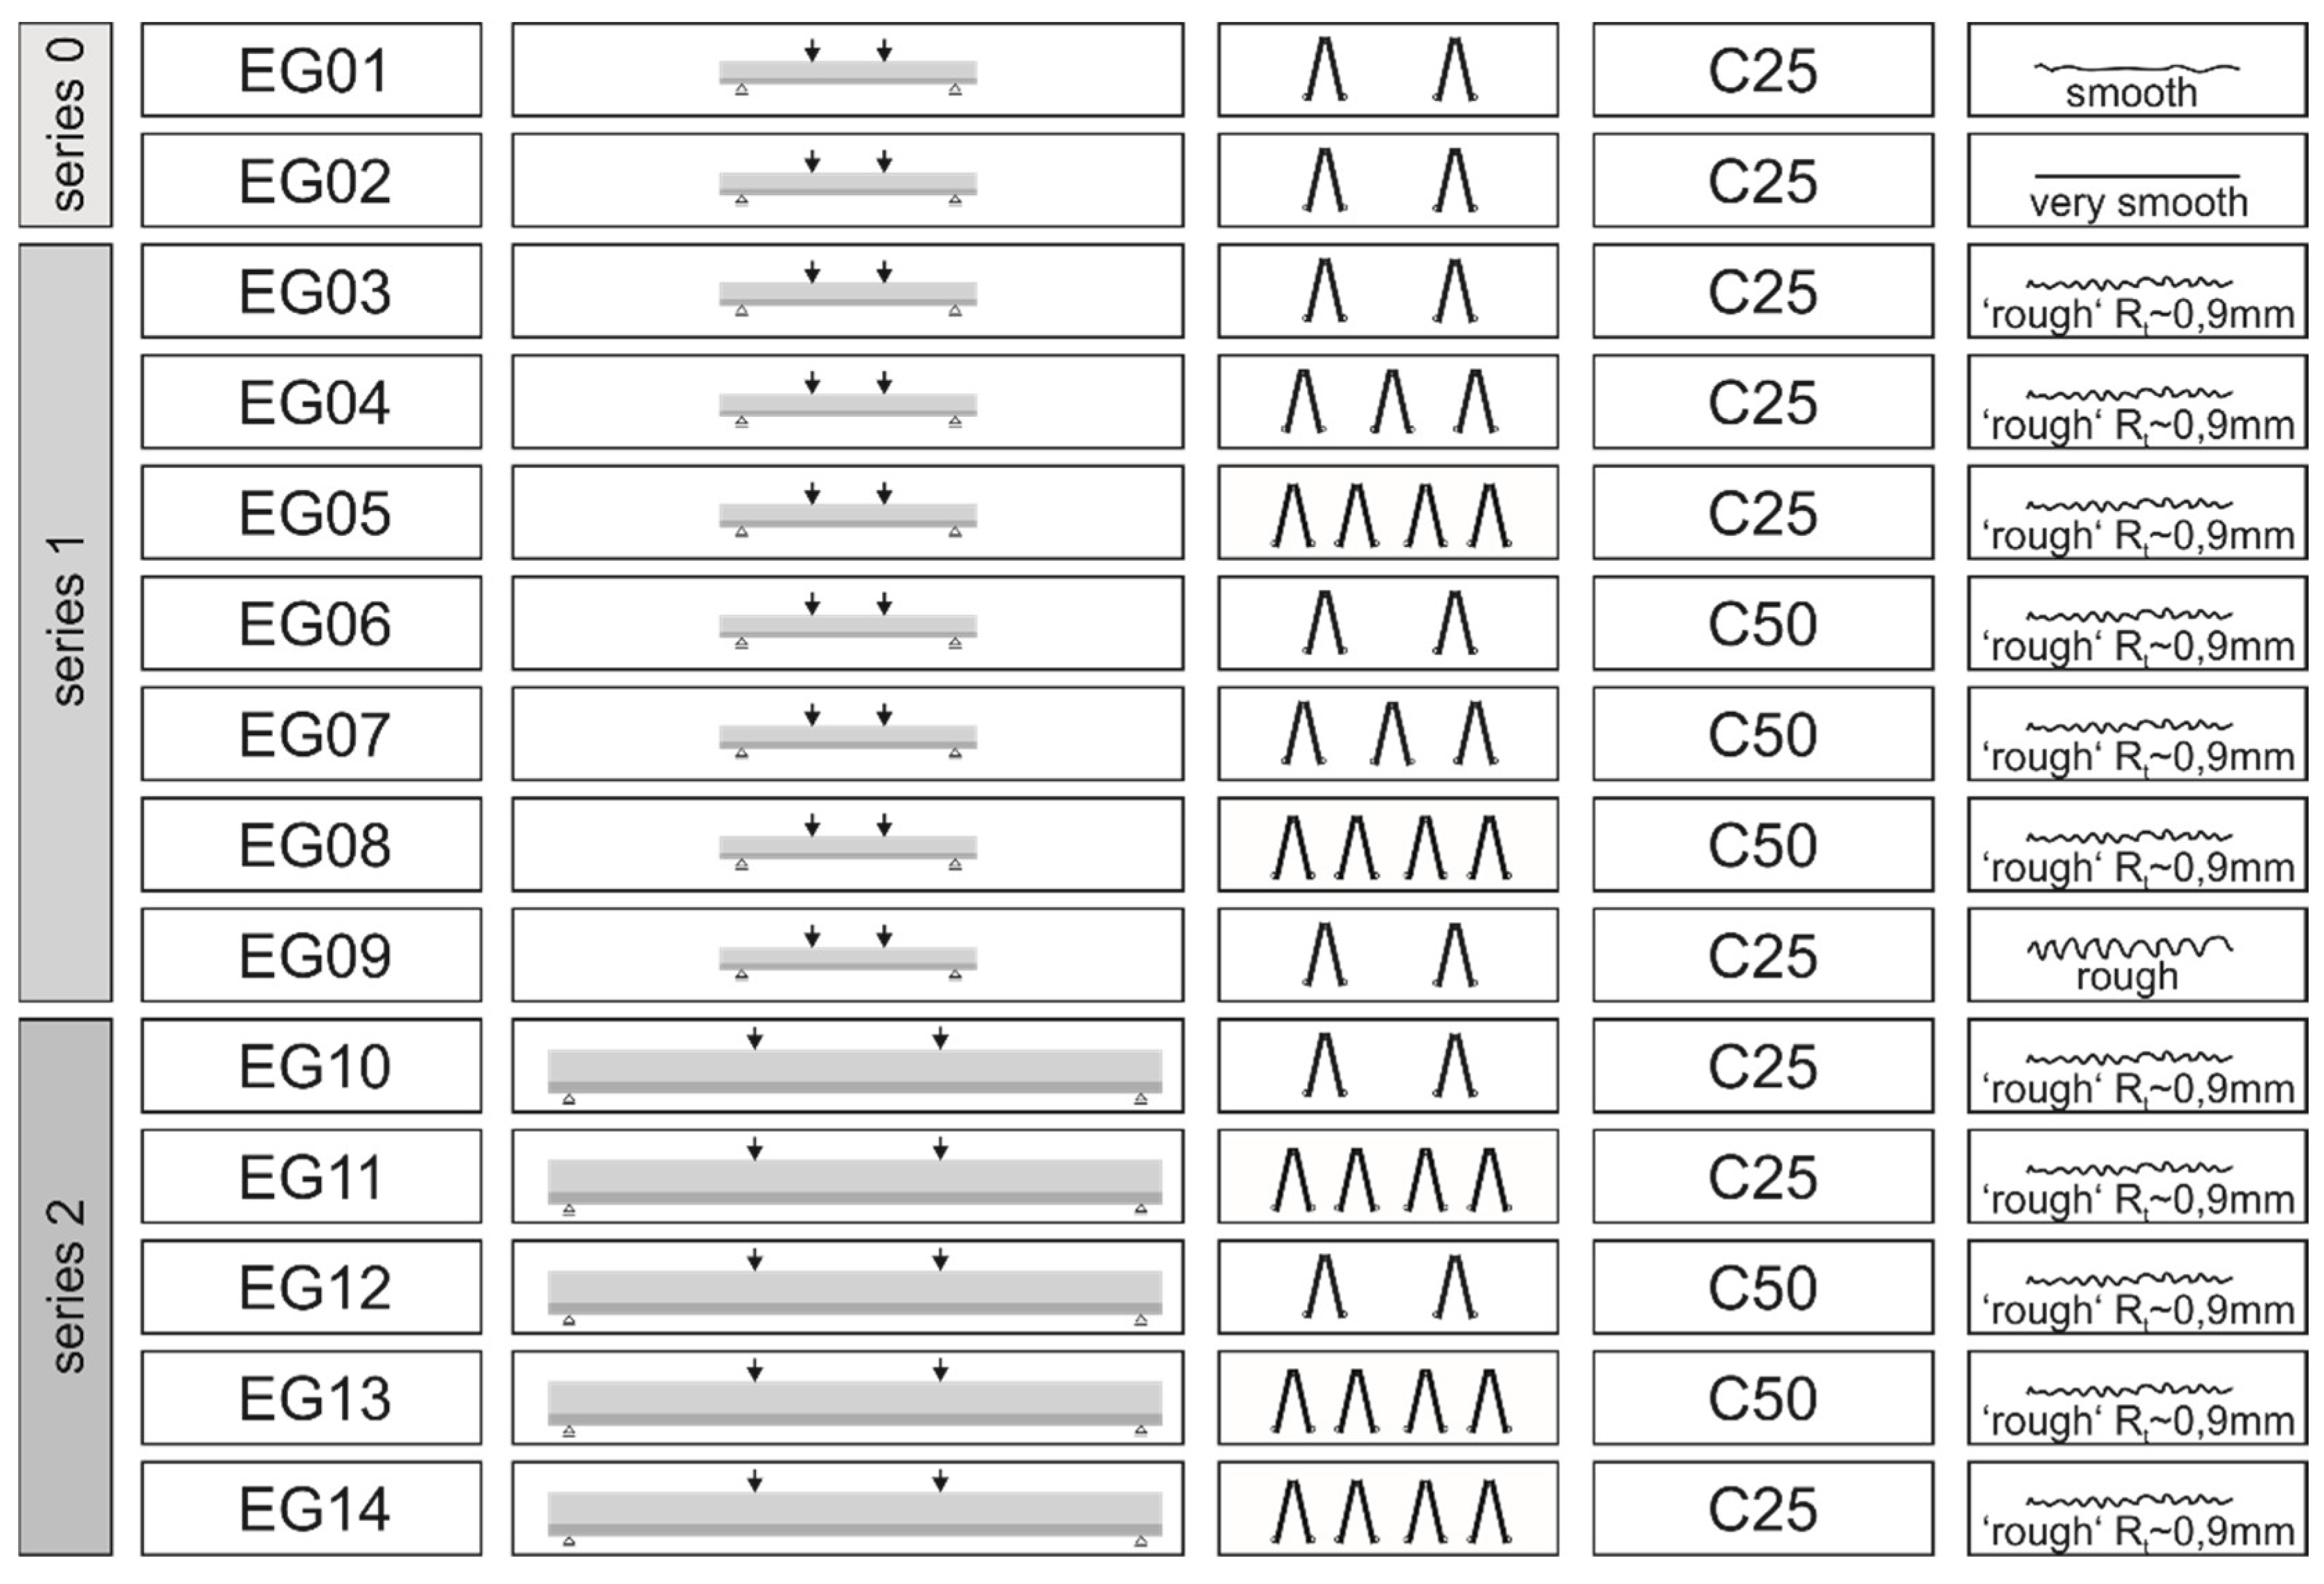
Figure 13.
Reinforcement detail of Specimens EG03, EG06, and EG09.

Figure 14.
Measurement instrumentation for Specimen EG10: strain gauges (SG) at reinforcement and displacement transducers (W).
Figure 14.
Measurement instrumentation for Specimen EG10: strain gauges (SG) at reinforcement and displacement transducers (W).

Figure 15.
Test setup for fatigue tests: Sub-Test I for Test Series 0/1 (a), Sub-Test I for Test Series 2 (b), Sub-Test II for Test Series 0/1 (c), and Sub-Test II for Test Series 2 (d).
Figure 15.
Test setup for fatigue tests: Sub-Test I for Test Series 0/1 (a), Sub-Test I for Test Series 2 (b), Sub-Test II for Test Series 0/1 (c), and Sub-Test II for Test Series 2 (d).
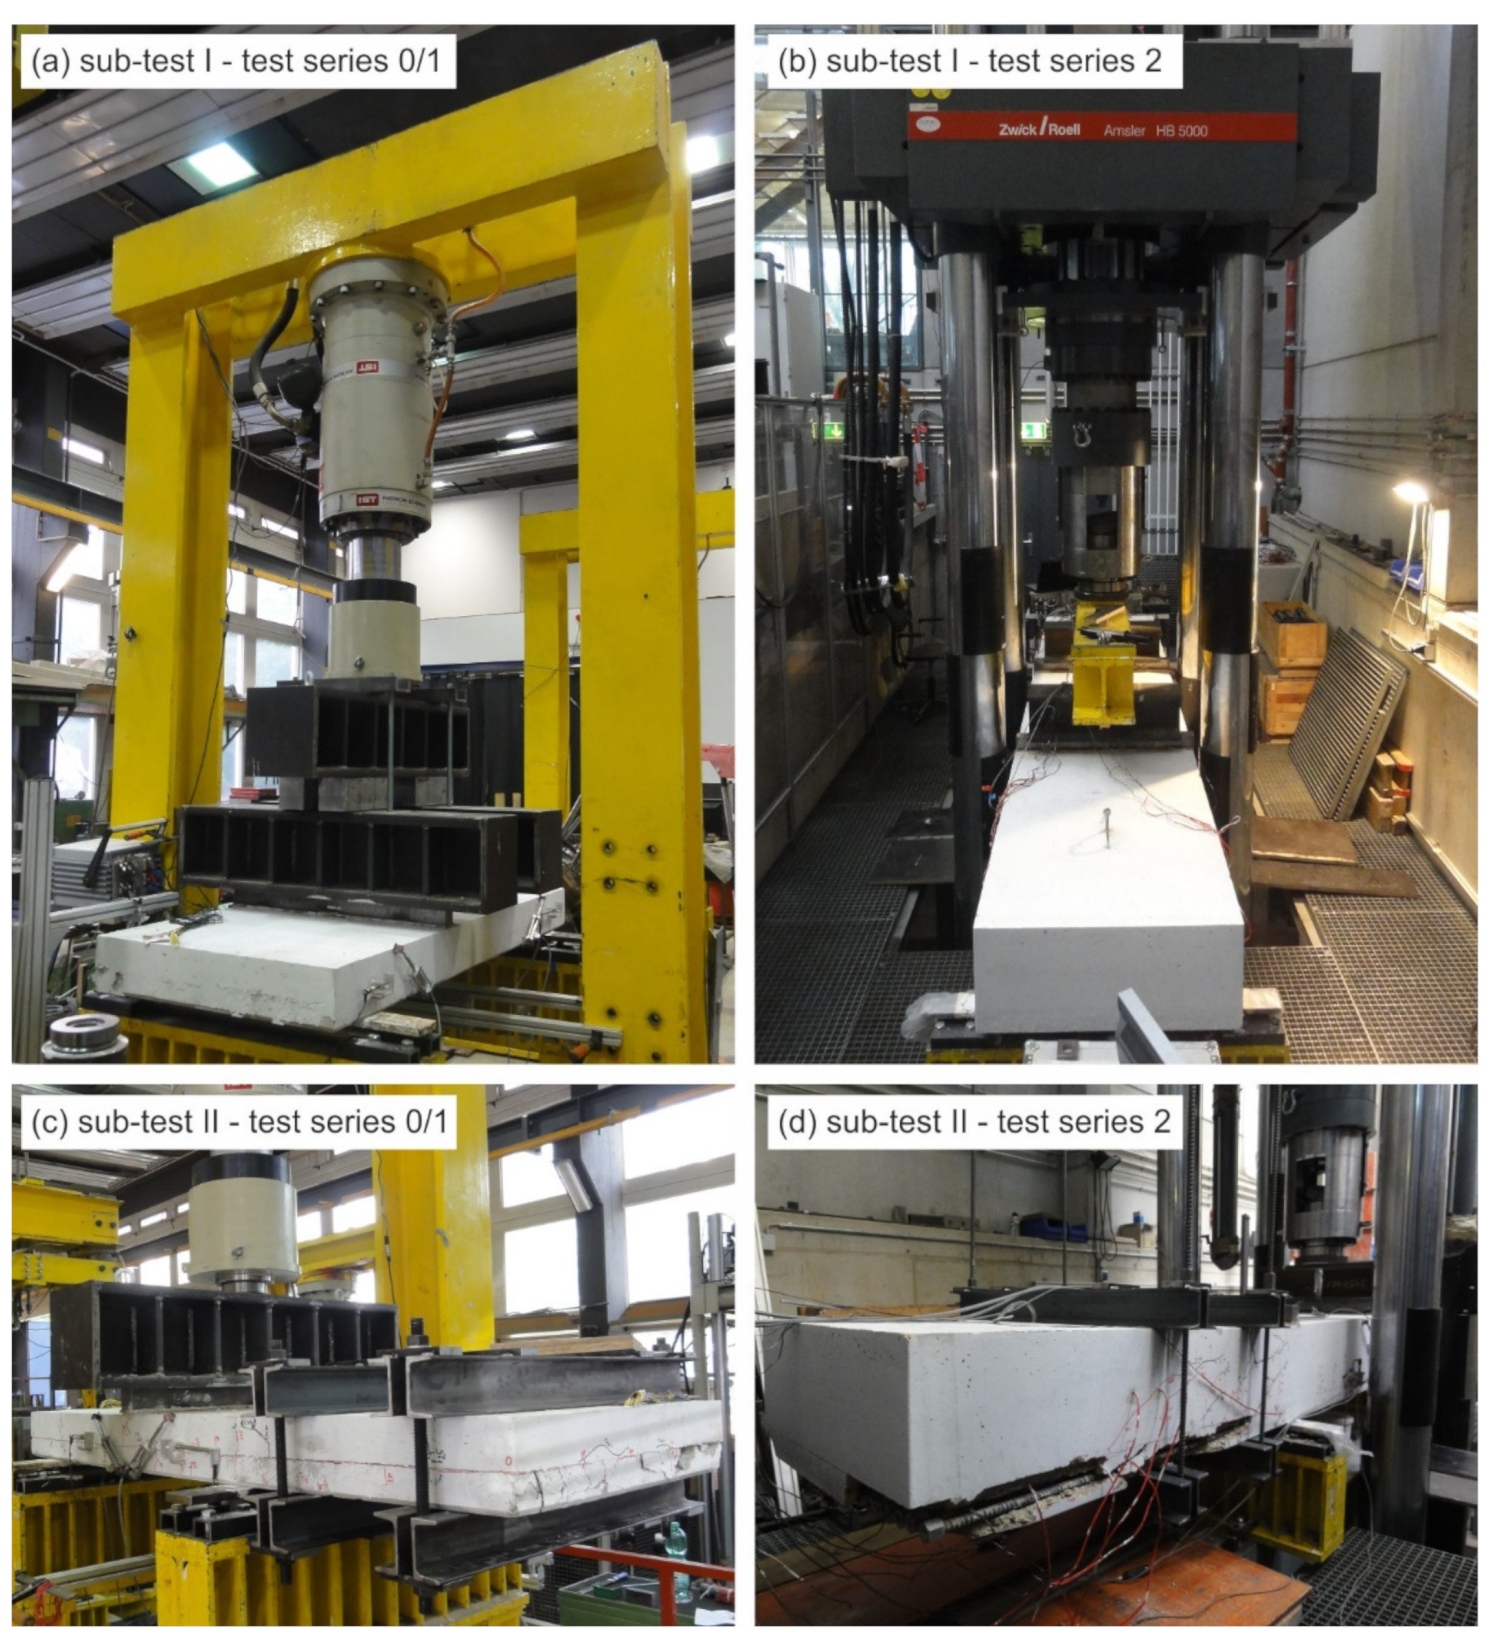
Figure 16.
Influence of interface roughness: crack patterns of Specimens EG01, EG02, EG03, and EG09.
Figure 16.
Influence of interface roughness: crack patterns of Specimens EG01, EG02, EG03, and EG09.

Figure 17.
Influence of interface roughness: load–deflection curve of Specimens EG01—EG03 (a), development of horizontal slip for Specimens EG02 and EG03 (b).
Figure 17.
Influence of interface roughness: load–deflection curve of Specimens EG01—EG03 (a), development of horizontal slip for Specimens EG02 and EG03 (b).

Figure 18.
Comparison of interface reinforcement ratio: Crack patterns of Specimens EG03, EG04, and EG08.
Figure 18.
Comparison of interface reinforcement ratio: Crack patterns of Specimens EG03, EG04, and EG08.

Figure 19.
Influence of steel strains: load history, strain measurements of lattice girder, and fractured lattice girder for Specimen EG12.
Figure 19.
Influence of steel strains: load history, strain measurements of lattice girder, and fractured lattice girder for Specimen EG12.

Figure 20.
Evaluation of calculated stress ranges for the design of lattice girders as interface reinforcement [53]: simplified verification according to EC2:2011 (a), EC2+NA(D) (b) and technical approvals (c) and verification using the S-N curve (d).
Figure 20.
Evaluation of calculated stress ranges for the design of lattice girders as interface reinforcement [53]: simplified verification according to EC2:2011 (a), EC2+NA(D) (b) and technical approvals (c) and verification using the S-N curve (d).

Figure 21.
Relationship between shear slenderness λ and (a) a/d—ratio and (b) shear capacity of single-span and continuous beams (according to [77,78]).

Figure 22.
Test setups for each parameter combination in Series 3 and 4.

Table 1.
Fatigue tests with lattice girders from literature.
| Geometry | Lattice Girder | Test Setup | ||
|---|---|---|---|---|
| Baustahlgewebe | Filigran | |||
| slabs | 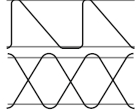 | KTS n = 10 | EQ n = 2 |  |
| KT100 n = 14 | ||||
| walls | 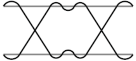 | KTW n = 3 | 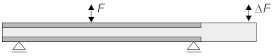 | |
Table 3.
Dimensions and geometrical parameters of test specimens.
| Series 0 | Series 1 | Series 2 | |
|---|---|---|---|
| dimensions (l/b/h) (cm) | 190/85/16 | 180/85/16 | 420/85/36 (EG10–13)390/85/33 (EG14) |
| height precast slab/ in situ concrete (cm) | 7/9 | 7/9 | 7/29 (EG10–13) 7/26 (EG14) |
| effective depth d (cm) | 13 | 13 | 33 (EG10–13) 30 (EG14) |
| distance load-support a (cm) | 50 | 50 | 130 |
| lattice girder type | KTS 100 | KTS 100 | EQ 30 |
| shear slenderness a/d | 4.0 | 4.0 | 4.0 |
| long. reinforcement ρl (%) | 2.0 | 2.0 | 2.0 |
l = total length; b = width; h = total height.
Table 4.
Parameters and material properties of test specimens.
| Test | hges | a | nLG | fym,LG | nl | fym,l | fcm,pre | fcm,in situ | Roughness | Rt,sand | Rt,laser |
|---|---|---|---|---|---|---|---|---|---|---|---|
| (cm) | (cm) | (-) | (N/mm2) | (-) | (N/mm2) | (N/mm2) | (N/mm2) | (-) | (mm) | (mm) | |
| EG01 | 16 | 50 | 2 | 546 | 7 | 954 | 25.3 | 35.6 | smooth | 0.24 | 0.42 |
| EG02 | 16 | 50 | 2 | 546 | 7 | 954 | 25.6 | 33.9 | very smooth 1 | 0.26 | 0.43 |
| EG03 | 16 | 50 | 2 | 546 | 7 | 939 | 27.7 | 33.2 | ‘rough’ (Rt ≈ 0.9mm) | 0.64 | - |
| EG04 | 16 | 50 | 3 | 546 | 7 | 939 | 27.9 | 34.0 | ‘rough’ (Rt ≈ 0.9 mm) | 0.93 | - |
| EG05 | 16 | 50 | 4 | 546 | 7 | 939 | 28.2 | 35.2 | ‘rough’ (Rt ≈ 0.9 mm) | 0.78 | - |
| EG06 | 16 | 50 | 2 | 546 | 7 | 939 | 51.1 | 61.3 | ‘rough’ (Rt ≈ 0.9 mm) | 0.97 | 1.33 |
| EG07 | 16 | 50 | 3 | 546 | 7 | 939 | 51.1 | 61.3 | ‘rough’ (Rt ≈ 0.9 mm) | 1.01 | 1.19 |
| EG08 | 16 | 50 | 4 | 546 | 7 | 939 | 51.4 | 61.3 | ‘rough’ (Rt ≈ 0.9 mm) | 1.07 | 1.04 |
| EG09 | 16 | 50 | 2 | 546 | 7 | 939 | 32.9 | 34.4 | rough (Rt > 1.5 mm) | 2.02 | - |
| EG10 | 36 | 130 | 2 | 554 | 18 | 939 | 36.0 | 32.0 | ‘rough’ (Rt ≈ 0,9 mm) | 0.82 | 1.01 |
| EG11 | 36 | 130 | 4 | 554 | 18 | 939 | 37.2 | 36.0 | ‘rough’ (Rt ≈ 0,9 mm) | 0.78 | 0.85 |
| EG12 | 36 | 130 | 2 | 554 | 18 | 939 | 48.6 | 55.6 | ‘rough’ (Rt ≈ 0.9 mm) | 1.02 | 0.63 |
| EG13 | 36 | 130 | 4 | 554 | 18 | 939 | 49.0 | 56.8 | ‘rough’ (Rt ≈ 0.9 mm) | 1.19 | 1.67 |
| EG14 | 33 | 120 | 4 | 554 | 17 | 939 | 31.5 | 34.8 | ‘rough’ (Rt ≈ 0.9 mm) | 0.96 | - |
hges: overall slab height; a: distance between load application and support; nLG: number of lattice girder rows; fym,LG: mean yield strength of the diagonals of the lattice girders; nl: number of longitudinal reinforcement bars; fym,l: mean yield strength of longitudinal reinforcement; fcm,pre: mean concrete compressive strength of precast slab; fcm,in situ: mean concrete compressive strength of in situ concrete; Rt,sand: mean roughness depth by sand patch method; Rt,laser: mean roughness depth by laser triangulation; 1: additionally weakened by formwork oil.
Table 5.
Overview of applied load, number of load cycles, and stress ranges.
| Series | Test | Vmax,1 | ∆V1 | N1 | Vmax,f | ∆Vf | Nf | Nov | ∆σcalc,1 | ∆σmax,test | Failure |
|---|---|---|---|---|---|---|---|---|---|---|---|
| (kN) | (kN) | (-) | (kN) | (kN) | (-) | (-) | (N/mm2) | (N/mm2) | |||
| Series 0 | EG01a | 116 | 35 | 1.50 × 10⁶ | 162 | 58 | 0.18 × 10⁶ | 4.18 × 10⁶ | 109 | 270 | I/V |
| EG01b | 162 | 58 | 350 | 4.18 × 10⁶ | V | ||||||
| EG02a | 116 | 35 | 1.50 × 10⁶ | 116 | 58 | 1.16 × 10⁶ | 2.66 × 10⁶ | 109 | 215 * | I | |
| EG02b | 116 | 58 | 0.93 × 10⁶ | 3.59 × 10⁶ | I/V | ||||||
| Series 1 | EG03a | 152 | 90 | 2.07 × 10⁶ | 2.07 × 10⁶ | 279 | 230 * | I/V | |||
| EG03b | 152 | 90 | 1.17 × 10⁶ | 3.24 × 10⁶ | V | ||||||
| EG04a | 165 | 83 | 3.00 × 10⁶ | 165 | 112.5 | 1.36 × 10⁶ | 4.36 × 10⁶ | 171 | 215 * | V | |
| EG04b | 260 1 | V | |||||||||
| EG05a | 226 | 133 | 2.70 × 10⁴ | 2.70 × 10⁴ | 176 | 125 | VDZ | ||||
| EG05b | 271 1 | V | |||||||||
| EG06a | 172 | 105 | 2.25 × 10⁶ | 197 | 120 | 0.35 × 10⁶ | 2.60 × 10⁶ | 326 | 195 | I/V | |
| EG06b | 197 | 120 | 1.12 × 10⁴ | 2.62 × 10⁶ | I/V | ||||||
| EG07a | 172 | 88 | 2.00 × 10⁶ | 197 | 120 | 3.32 × 10⁴ | 4.03 × 10⁶ | 121 | 55 | V | |
| EG07b | 197 | 120 | 2.25 × 10⁶ | 6.28 × 10⁶ | V | ||||||
| EG08a | 215 | 110 | 2.0 × 10⁶ | 215 | 152.5 | 1.95 × 10⁶ | 3.95 × 10⁶ | 171 | 115 * | V | |
| EG08b | − 2 | ||||||||||
| EG09a | 155 | 93 | 8677 | 8677 | 187 | 175 * | I/V | ||||
| EG09b | 155 | 61 | 1.09 × 10⁶ | 1.09 × 10⁶ | I/V | ||||||
| Series 2 | EG10a | 282 | 150 | 2.00 × 10⁶ | 372 | 225 | 1000 | 2.00 × 10⁶ | 193 | 100* | I/V |
| EG10b | −2 | ||||||||||
| EG11a | 537 | 195 | 0.31 × 10⁶ | 0.31 × 10⁶ | 125 | 115 | VDZ/VL | ||||
| EG11b | 537 | 195 | 0.90 × 10⁶ | 1.21 × 10⁶ | VL | ||||||
| EG12a | 359 | 135 | 2.00 × 10⁶ | 420 | 233 | 0.74 × 10⁶ | 4.12 × 10⁶ | 173 | 255 * | I/V | |
| EG12b | 420 | 233 | 0.35 × 10⁶ | 4.47 × 10⁶ | V/VL | ||||||
| EG13a | 519 | 165 | 435 | 435 | 105 | 115 | VDZ/VL | ||||
| EG13b | 519 | 165 | 9129 | 9564 | VL | ||||||
| EG14a | 487 | 178 | 1.63 × 10⁶ | 1.63 × 10⁶ | 125 | 175 | VDZ/VL | ||||
| EG14b | 487 | 178 | 2.87 × 10⁴ | 1.66 × 10⁶ | V/VL |
a: Sub-Test I; b: Sub-Test II; Vmax,1: maximum shear at start of test; ∆V1: shear range at start of test; N1: number of load cycles after first loading sequence; Vmax,f: maximum shear at failure; ∆Vf: shear range at failure; Nf: number of load cycles in last loading sequence before failure; Nov overall number of load cycles; ∆σcalc,1: calculated stress range in lattice girders according to technical approval with ∆V1; ∆σmax,test: measured maximum stress range in lattice girders by strain gauges; I: interface failure; V: shear failure; VDZ: anchorage failure of lattice girder in the compression zone; VL: anchorage failure of longitudinal reinforcement; *: fracture of lattice girders; 1: residual load capacity; 2: no Sub-Test II.
Publisher’s Note: MDPI stays neutral with regard to jurisdictional claims in published maps and institutional affiliations. |
© 2021 by the authors. Licensee MDPI, Basel, Switzerland. This article is an open access article distributed under the terms and conditions of the Creative Commons Attribution (CC BY) license (https://creativecommons.org/licenses/by/4.0/).
Share and Cite
MDPI and ACS Style
Hillebrand, M.; Schmidt, M.; Wieneke, K.; Classen, M.; Hegger, J. Investigations on Interface Shear Fatigue of Semi-Precast Slabs with Lattice Girders. Appl. Sci. 2021, 11, 11196. https://doi.org/10.3390/app112311196
AMA Style
Hillebrand M, Schmidt M, Wieneke K, Classen M, Hegger J. Investigations on Interface Shear Fatigue of Semi-Precast Slabs with Lattice Girders. Applied Sciences. 2021; 11(23):11196. https://doi.org/10.3390/app112311196
Chicago/Turabian StyleHillebrand, Matthias, Maximilian Schmidt, Katrin Wieneke, Martin Classen, and Josef Hegger. 2021. "Investigations on Interface Shear Fatigue of Semi-Precast Slabs with Lattice Girders" Applied Sciences 11, no. 23: 11196. https://doi.org/10.3390/app112311196
Note that from the first issue of 2016, this journal uses article numbers instead of page numbers. See further details here.