Article

3D Imaging of CRP and Ultrasonic Tomography to Detect Decay in a Living Adult Holm Oak (Quercus ilex L.) in Sardinia (Italy)

1
Italian Academy of Forest Sciences, 50133 Firenze, Italy
2
Department of Civil and Environmental Engineering and Architecture (DICAAR), University of Cagliari, 09123 Cagliari, Italy
3
Consorzio Interuniversitario Nazionale per l’Ingegneria delle Georisorse, CiniGeo, 00186 Roma, Italy
4
INGV Istituto Nazionale di Geofisica e Vulcanologia, Sezione di Bologna, 40128 Bologna, Italy
*
Author to whom correspondence should be addressed.
Appl. Sci. 2021, 11(3), 1199; https://doi.org/10.3390/app11031199
Submission received: 4 January 2021 / Revised: 22 January 2021 / Accepted: 23 January 2021 / Published: 28 January 2021
(This article belongs to the Special Issue Nondestructive Testing (NDT): Volume II)

Abstract

:
A field-integrated methodology using 3D ultrasonic tomography supported by close range photogrammetry (CRP) has been developed and evaluated as a tool to detect the presence and patterns of decay forms in a living adult holm oak (Quercus ilex L.) in an urban green area of the city of Cagliari, Sardinia, Italy. Close range photogrammetry was used to compute a high resolution 3D model of the studied tree, texturized with natural colors. Moreover, following the implemented workflow process it was possible to evaluate the deformation pattern of the studied tree over time. In a second step of our integrated approach, and in order to diagnose the state of health of the inner part of the studied tree in a non-invasive way, laboratory and in situ non-invasive ultrasonic techniques were applied. The results of the close range photogrammetry analysis supported the optimal design of the 3D ultrasonic tomography of the living adult holm oak. Ultrasonic tomography is one of the most powerful non-destructive testing techniques for the full-volume inspection of a structure. It produced physical information on the inner structure of the stem of the investigated tree. The results of the study show that the integrated application of close range photogrammetry and 3D ultrasonic tomography is a powerful tool for a highly accurate and objective evaluation of the external and internal decay of trees and for monitoring their conservation states. With the fully integrated approach, the diagnostic process aimed to prevent instability and the failure of trees can be greatly improved.

1. Introduction

In the last few decades, 3D modelling of trees has become more and more important in detecting their biometrical and physical parameters in forests as well as for in situ tree reconstruction in places like forest stands, plots, and tree levels [1,2,3,4,5]. Traditional field-based sampling measurement applied to tree analysis can be classified into non-contact methods (with the aid of laser electronic rangefinders, EDMs, levelling, etc.) and contact methods. The latter are more precise but require more time and human resources because of the need for taking measurements on the field with the aid of clinometers, calipers, tapes, and dendrometers.
Conversely, being more accurate and productive, contactless remote and proximal sensing methods can represent a well-functioning solution for the precise modelling of trees. Proximal sensing methods can be essentially classified into three types: terrestrial laser scanner (TLS), with a high productivity of point clouds but very expensive because the instruments are costly and because the availability of specialized personnel to operate them is rather low; the magnetic motion tracker, which is as expensive as the TLS; and close range photogrammetry (CRP), considerably less expensive. Since the latter is one of the most precise surface data methods in use, it is becoming very popular for the 3D modelling of trees [3,4,6]. Moreover, among the techniques available for the modelling of the trees in forests or urban areas, internal body techniques are very effective in detecting physical parameters relating to the state of health of the inner parts of the trees or the quality of the wood. All these internal body methods of investigation are non-invasive and are part of so-called non-destructive testing (NDT). Tests in this category include near-infrared (NIR) spectroscopy, an effective laboratory technique for measuring the physical, chemical and mechanical properties of wood, and acoustic methods, which are suitable for both laboratory and in-field tests [7,8,9,10,11]. Acoustic methods are based mainly on the measurements of the acoustic velocity relating to the elastic and mechanical wood properties. The use of elastic waves propagation to detect wood decay in trees has been analyzed by many researchers [12,13,14,15]. The detection of the low elastic characteristics of the wood due to its decay is based on the observation that wave propagation is very sensitive to the presence of decay, often caused by fungal decomposition, because it worsens the elastic-mechanical properties of the wood [16]. For accurate acoustic analyses, 3D low frequency ultrasonic tomography, which was developed for medical application and geophysical prospecting, was found to be especially effective for its applicability both in laboratory and in standing trees [14,15,17].
The possibility of integration of different non-invasive diagnostic methods for the analysis of the surface and inner parts of a tree is interesting and topical. For instance, CRP can provide 3D high resolution measurable models useful in the application of 3D ultrasonic tomography. The integration of geomatic and acoustic techniques is adopted in many fields of the applied sciences [6,18,19,20,21,22].
The CRP technique is based on the well-known structure from motion (SfM) photogrammetry method and is performed essentially with the application of computer vision and computer graphic algorithms. CRP is a passive method that can also be applied as a stand-alone technique, because a priori information on the position of the cameras is generally not necessary, nor is camera orientation, calibration or the presence on the scene of geo-referred reference points [23,24,25]. The final 3D CRP models made available are useful for comparisons, animation, movies, measurements and conservation of the memory of the shape of trees in time as well as chronological evolution of the displacement of the tree. These models are given in digital form (easily computer manageable), are useful for future evaluations and can be sent all around the world for visual inspection. In addition, the evaluation of the possibility of preventing the instability and failure of standing trees is of great importance in forestry. This target can be achieved by ultrasonic methods, largely employed to detect the elastic characteristics of different materials (e.g., stone, concrete, wood), although the interpretation of the data is very complex because elastic wave propagation strictly depends on the heterogeneity, porosity, density and other material properties [19,20,25,26,27,28,29]. The presence of decay zones, small cavities and cracks or splits within the investigated materials are potential defects characterized by low ultrasonic velocity compared to the velocity in healthy materials. The ultrasonic techniques applied over time on the same trees in forestry or in an urban area can also deliver enhanced information about the possible evolution of tree disease and prevent their instability and failure.
In this study, considering the nature and size of the investigated standing tree and the target of the study, an ultrasonic investigation by the 3D ultrasonic tomography technique was carried out at 24 kHz to obtain a three-dimensional representation of the distribution of the longitudinal wave velocity inside the stem. The 3D ultrasonic tomography was planned in an optimum way based on the CRP 3D model. This model also greatly contributed to the 3D ultrasonic tomography interpretation phase, as often external evidence reflects the presence of internal defects. The integration of the different types of complementary information aids the diagnostic process and adds value to the results.
The integrated CRP and 3D ultrasonic tomography combined procedure was applied to a holm oak (Quercus Ilex L.) living tree growth in a private garden in the town of Cagliari on the island of Sardinia, Italy. This tree was chosen due to the number of trees of this species in Sardinia. In fact, the natural distribution of holm oaks in Sardinia occurs from coastal zones up to an altitude of 1400 m in the upper part of the Gennargentu Mountains. Holm oak is a slow-growing shade-tolerant tree and is able to dominate in late successional stages. Sclerophyllous woods and maquis vegetation, where holm oak dominates, represent the most widespread evergreen woodland in the Mediterranean Region [30,31].
Owing to recent human activity, holm oak trees are widespread in all Mediterranean coastal regions and are also intensively planted in public and private gardens, for example, in the town of Cagliari. At present, owing mainly to air pollution, many of these trees in urban environments suffer decay, especially from pathogenic fungi that can produce tail disease and bark cancer, thus increasing the risk failure [32].
Therefore, the specific objectives of this study were (1) to produce a 3D high resolution photogrammetric model of the investigated tree to store the memory of its shape and to check the chronological displacement evolution of the tree under observation, (2) to assess the tree health status by analyzing the elastic properties of the inner part of the stem using 3D ultrasonic tomography, planned based on the 3D high resolution photogrammetric model, and (3) to help prevent the instability and failure of the investigated tree by integrating the 3D CRP and ultrasonic tomographic models, obtained separately through independent processes.

2. Materials and Methods

2.1. Study Site

The tree under study is located south of the Molentargius pond (Figure 1a) in Southern Sardinia in a substrate characterized by clay soils from fluvio-lacustrine deposits dating back to the upper Pleistocene (Figure 1b).

2.2. Materials—Tree Species

Holm oak (Quercus ilex L.) is a broadleaved evergreen tree that can grow up to 25 m, and exceptionally 30 m, with over 2 m of stem diameter [31,34]. Its lifespan may reach about 1000 years. The crown is broad and domed, with ascending branches and often low stems. The bark is brownish-black and shallowly cracked into small, square, thin plates.
As major macroscopic characteristics, holm oak wood presents distinguished wood rings, diffuse porosity, heartwood darker than sapwood and a density higher than 0.75 g/cm3 [35]. The modulus of rupture (MOR) is 120 N/mm2, while Janka hardness is 798 kgf. Holm oak wood is included among the trade names of hardwood and coniferous woods used in Europe [36]. This wood is employed for parquets, coal, charcoal, wheelwright tools, and railway sleepers.
The twigs and buds are grey-tomentose. Leaves are generally lanceolate to oval, 3–7 cm, thick but not rigid, cuneate or rounded at the base, with 1–2 cm woolly petioles. The margins are waved or sinuate, but in some cases they can be spinose on young trees or sprouts. They unfold silvery-white in spring and then turn pale yellow, covered with dense hairs. Soon the leaves become rough and shiny blackish-green on the upper side, and grey and densely pubescent on the lower side. Leaf lifespan ranges from less than 1 year to 4 years, with turnover rates changing according to the leaf position and environmental factors. This species is monoecious, blossoming in May–June with new leaf growth. After dry summers new leaves can appear in autumn. The male flowers are in 4–7 cm dense pendulous catkins, pale green, then opening in a mass of yellow stamens very visible against the silvery-grey leaves. The female flowers are minute, two to three on short, erect peduncles at the axil on one leaf, green–grey and pubescent. The fruit is an acorn, ripening in the first year, brown in color, sizes of 1.5–2 cm, one-third to one-half enclosed in a light green cupule with appressed scales, and hung on short peduncles. Mature acorns fall in November–January, with high productions every 4–6 years. The holm oak is native to the central western Mediterranean basin, where it represents the dominating species in woodlands and maquis vegetation [31].

2.3. Methods

2.3.1. Visual Inspection

Preliminary visual inspection represents a fundamental phase in tree health diagnostics. Observation of trees is an important management operation, since it makes it possible both to identify those trees in a forest that are most capable of reacting to stress and to distinguish the reversibility or irreversibility of the decay. Thanks to macroscopic visual observation, the main morphological characteristics of a tree can be assessed and shallow anomalies related to any diseases identified, but unfortunately this is not enough. External anomalies need to be defined at high resolution and monitored over time by means of photogrammetric analyses.
In this study, visual investigation provided important findings for the planning of further non-invasive diagnostic investigations. The macroscopic effects of the disease are concentrated in most of the bark of the studied holm oak, especially in the upper part of its stem. Extreme browning, splitting and bark detachment are distinguishable. These decay forms are due to fungal or bacterial cancer that, in the shallowest part of the bark, caused both a sensitive darkening tending to black (Figure 2) and the alteration of the wood starting from splitting planes.
Based on a preliminary analysis of visual inspection, we planned and carried out two proximal sensing diagnostic techniques, photogrammetry and ultrasonics to perform the 3D modeling of the external and internal parts of the studied holm oak, aimed respectively to detect anomalies in the shape of the stem and elastic mechanical characteristics in its inner part. In the following section, the two above methods are described.

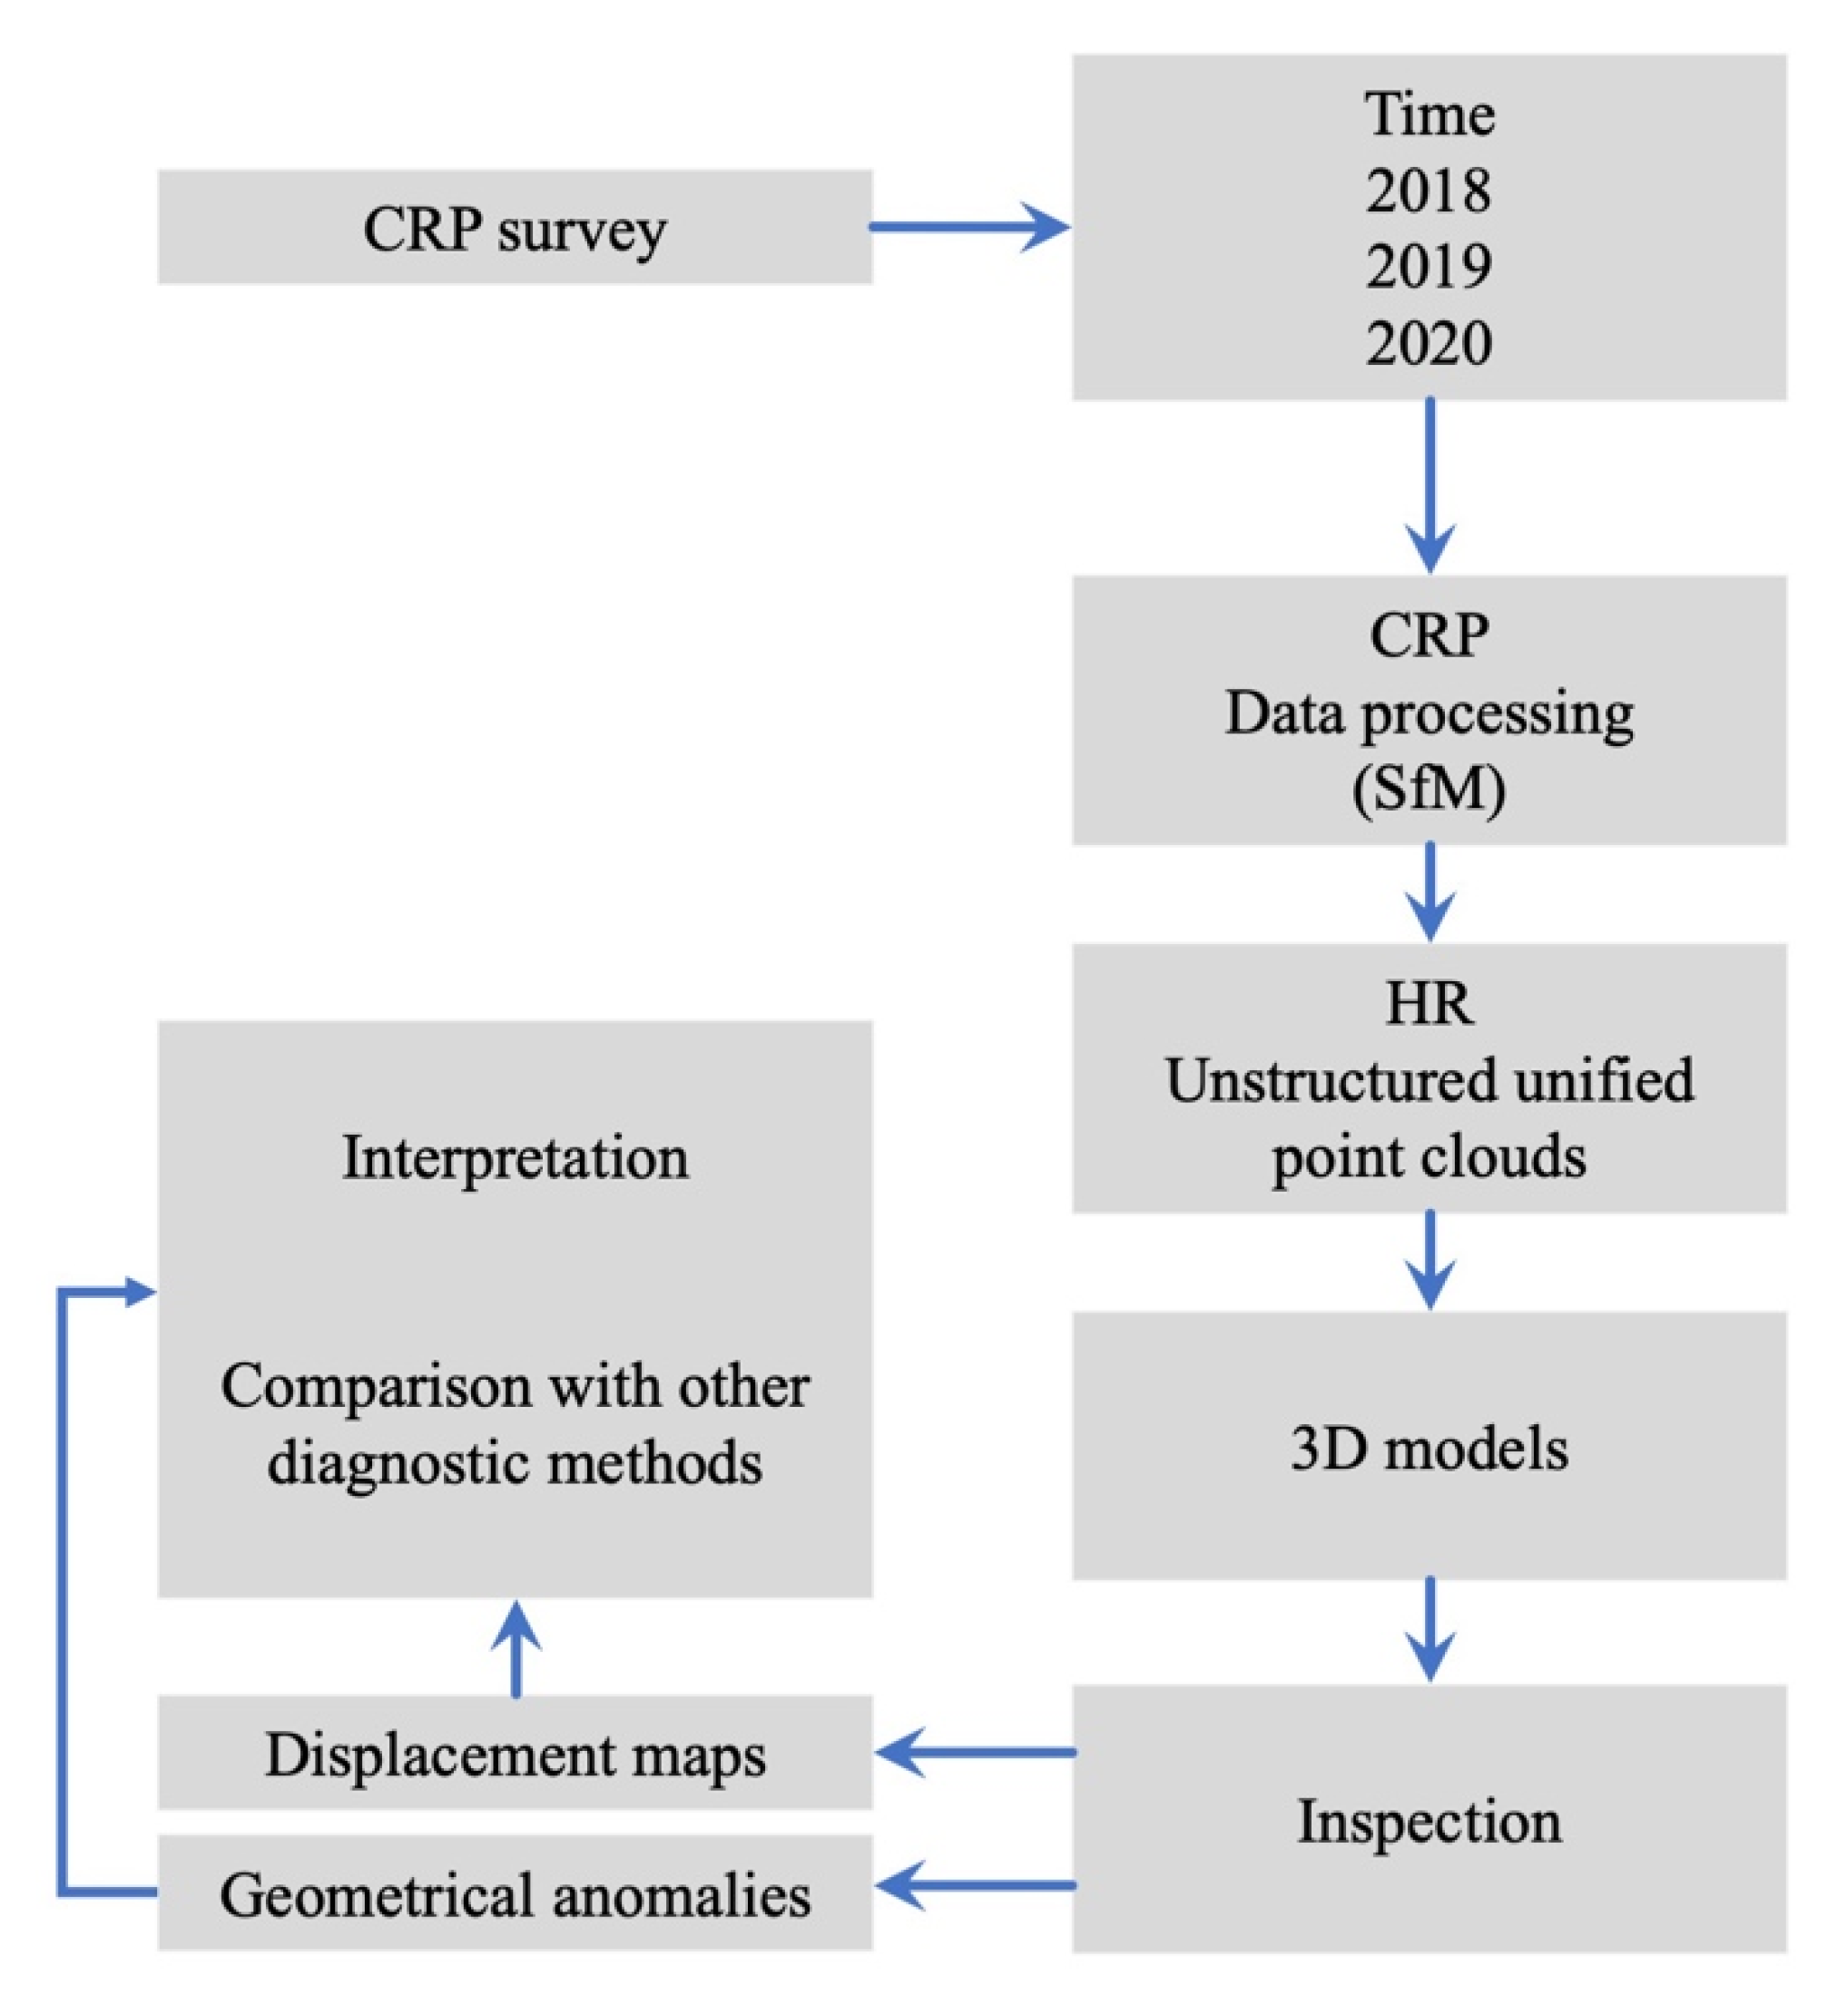
2.3.2. Close Range Photogrammetry

Close range photogrammetry (CRP) is widely used in forestry inventory to compute plant models and to detect interesting biometric and physical parameters, such as stem diameter, bark characteristics and anomalies affecting trees and plants. With this method, a registered filtered unified point cloud representing the studied tree can be computed, starting from some tens of 2D high resolution photos taken in situ all around the studied plants at short distances (1–3 m) and with optimal exposure conditions.
In fact, generally speaking, during a CRP survey, a set of good quality 2D photo images are taken, using consumer-grade cameras, all around a tree or plant under study, at short distances (1–3 m), in different station points, evenly spaced at an average mean distance of 1 m between them, with the camera on a tripod. Single lens commercial digital cameras can be used; images must be aligned in the best way and then used to compute dense point clouds representing the studied tree, texturized with natural colors [3,4,23,24,25]. These clouds can be successively post-processed with the aid of facilities for point cloud processing, derived from terrestrial laser scanner (TLS) methodology, for example. The resulting unified clouds are then converted into mesh models with the aid of 3D reconstruction algorithms in order to be useful as input for CADs® or other professional engineering software.
In this study three photogrammetric campaigns were performed in three different periods––October 2018, December 2019 and January 2020––with the aid of two high-resolution single-lens 3D digital cameras: a Nikon D-300 (12.3 Mpx) (in the 2018 campaign) and a Nikon D5300 (24.2 Mpx) (for the 2019 and 2020 campaigns), suitably operated to detect some tens of high quality images of the studied holm oak (Quercus ilex L.). We took 36 photographs in the first campaign of 2018, 66 during the December 2019 campaign and 99 in the January 2020 campaign. The images were collected with the camera on a tripod equipped with a spherical level all around the target plant at fixed predetermined distances (1–3 m), as far as possible under homogeneous light conditions, and where possible after inserting reference markers in the scene.
The 2D images were carefully selected and preprocessed with release 1.6 of Agisoft Metashape® software (Agisoft LLC, St. Petersburg, Russia) based on Structure from Motion (SfM) methodology to avoid the use of noising data to finely align poses and generate a high dense points cloud textured with natural colors [6,22]. Three high density (each of about 10 million points) unstructured, unified, registered point clouds were restituted after image processing.
The colorized, high density, registered point clouds representing the tree in the different periods were format converted into the e57 format (namely, the file format for 3D laser scanner data exchange) and then processed with the JRC 3D Reconstructor® (Gexcel, Brescia, Italy) [37] and with CloudCompare free software [38]. Clouds were manually edited and then filtered to remove noising data. We used the Poisson surface reconstruction algorithm [39], implemented in the meshing facility of the package Reconstructor to compute high density meshes (1 mm × 1 mm step) starting from 3D registered point clouds relating to the 2018, 2019, and 2020 CRP campaigns [25].
In the final step of our procedure, we begun with the computation of the geometrical anomalies of the 2018, 2019, and 2020 3D models as residuals with respect to best fitted cylindrical high density meshes taken as reference; afterwards, we computed the displacement that occurred in the holm oak stem after one month and then after one year. In particular, the high resolution 3D meshes derived from the point clouds of the 2018 and 2019 campaigns were used as reference models to detect the deformation pattern to compare with the 3D ultrasonic tomography model. We computed the geometrical anomalies (i.e., residuals) of the January 2020 unified high density point cloud with respect to the 2018 and 2019 high density mesh models (see Figure 3).
Finally, starting from the natural light radiometric data and using the algorithm implemented in the Reconstructor® software, it was possible to detect the tree bark reflectivity, i.e., the ratio between the amount of energy reflected and the energy incident on the targeted surface, thus showing the surface defective zones and external evidence of the disease of the investigated tree.

2.3.3. Ultrasonic Measurements

The longitudinal wave velocity (P-wave velocity—Vp) measurements were performed both in laboratory on healthy samples at atmospheric temperature and pressure and in the field on a living holm oak.
A portable ultrasonic non-destructive digital indicating tester (Pundit Lab Plus) device (Proceq, Schwerzenbach, Switzerland) was employed for the tests. The experimental device for the acoustic measurements included a set of ultrasonic transducers with a 54 kHz and 24 kHz central frequency for longitudinal waves that propagate through the materials. Considering that the surface of the stem was quite rough and irregular, special care was used in choosing the best coupling between transducer and material. Silicone snug sheets were used as the coupling agent. This kind of coupling agent is especially advantageous in contributing to a better transmissibility of the ultrasonic signal, filling the irregularities at the interface while avoiding possible penetration into the wood and thus interfering with it. In fact, in biologic materials such as wood, which is affected by different kinds of porosity, the use of visco-liquids such as epoxy or grease should be avoided because they can penetrate into the pores, inducing variations in longitudinal velocity propagation. The transit time of the propagation of the longitudinal ultrasonic signal from the transmitter to the receiver was measured in direct transmission mode [40], both in laboratory and in the field. To improve the signal/noise ratio and thus data quality, a stack of six waveforms was carried out for each measurement, both in laboratory and in the field. The transit times were measured by locating the first break of the received longitudinal stacked signals as a result of the analysis of the waveforms recorded and displayed by the portable oscilloscope Fluke 96b [20,22,25]. The longitudinal velocity (Vp) was computed, considering the ratio between the path length (L) and the transit time of the longitudinal ultrasonic signal (T). The accuracy of the velocity measurements was ± 1%.

2.3.4. Laboratory Measurements

Holm oak wood specimens were collected from pruning residues of healthy holm oak trees for ultrasonic laboratory tests. In addition to the ultrasonic test, a photogrammetric analysis aimed at reproducing a 3D model of the wood samples was carried out. This is useful for a precise evaluation of their geometric and anatomic characteristics (Figure 4). Based on the 3D CRP model, the measuring point locations and the distance between transducers were precisely detected. The growth rings and rays had an interdistance of 2 to 4 mm, while the overall thickness from outer bark to cambium was 7 mm on average.
The presence of orthogonal structures, such as growth rings and rays, made the wood orthotropic with unique and independent elastic and mechanical properties in the direction of three mutually perpendicular axes [41]: longitudinal (parallel to the fiber), radial (normal to the growth rings) and tangential (tangent to the growth rings).
The ultrasonic laboratory analyses were carried out on the basis of the structural characteristics of the wood, assessed preliminarily by macroscopic observation supported by the results of the photogrammetric analysis. On the analyzed samples, the transit times of the longitudinal ultrasonic pulses and their corresponding propagation velocities (Vp) across the different parts of the stem––pith, heartwood and sapwood (Figure 5a)––were detected according to the direct acquisition mode [40,42] using transducers (transmitter and receiver) at a central frequency of 54 kHz, with a measuring range from 0.1 μs to 9999.9 μs and an accuracy of 0.1 μs.
The ultrasonic measurements were carried out in the longitudinal direction (Figure 5b) in order to evaluate separately the elastic-dynamic properties of the single internal structures of the stem. The evaluation of the elastic characteristics of each internal part of the stem is very important to assess the elastic behavior of the different structures and cellular conformation that characterize pith, heartwood and sapwood.

2.3.5. 3D Acoustic Tomography

Based on preliminary visual inspection and especially on the 3D CRP model, a 3D ultrasonic tomography was planned, designing an optimal survey and providing good spatial coverage of the investigated stem.
The 3D ultrasonic tomography volume was obtained by positioning 80 measurement points around the stem. Every point was spaced 10 cm along parallel vertical profiles in such a way as to surround the investigated stem entirely and homogeneously (Figure 6). Each measurement point was alternatively used as a transmitter and a receiver. The ultrasonic measurements were 6320, but only 5200 of these were processed by the inversion technique. In fact, when evaluating the ultrasonic waveforms, only first arrivals with shapes that looked undistorted were taken into consideration. From the 3D CRP model, the locations of the measurement points, their coordinates in a fixed reference system and the transmitter–receiver distance were precisely detected.
The travel time data volume was inverted using the simultaneous iterative reconstruction technique (SIRT) [43,44,45,46,47] to process a very large quantity of data (ultrasonic pulse transit times) acquired on the external surface of the stem in order to obtain a 3D representation of the distribution of the longitudinal velocity inside it.
This representation allowed an evaluation of the elastic mechanical conditions of the wood in the internal parts of the stem. The iterative reconstruction technique involves a series of successive approximations to correct an arbitrary initial parameter distribution (starting velocity model). In order to obtain a realistic non-arbitrary starting velocity model as input for the SIRT in order to invert travel times, a methodology based on the cross-correlation function (CCF) and described in a previous work [48] was used. Therefore, the cross-correlation function was computed by a computer code developed in the Solid Earth Geophysics and Diagnostics laboratory at University of Cagliari (Cagliari, Italy) and used as a constraint to the SIRT tomographic inversion to include prior knowledge of the investigated sections. In brief, omitting the detailed mathematical aspects of the inversion algorithm, the iterative procedure was essentially made up of the following steps: forward computation of the model travel times, computation of the theoretical travel times using the ray-tracing method, comparison of the theoretical and experimental travel times, calculation of the residuals, calculation of the velocity model, and application of velocity corrections to the 3D volume of the voxels within the model. The entire processing cycle was repeated for 15 iterations. This number of iterations was found to produce the best image of the 3D volume of the internal longitudinal velocity distribution and was a good compromise between resolving the power and reliability of the model. With the 3D tomography model, it was possible to scroll through the data (front to back, left to right, top to bottom) and get an intuitive feel of the distribution of the elastic mechanical conditions that characterize the stem. To facilitate the interpretation of the 3D tomography model, looking inside the data volume and considering the target of the study, the volume was sliced to create cross sections along its longitudinal development. In this way the slices were created by slicing the 3D volume horizontally. To understand how the slices relate to each other and how the potential decay of the wood is distributed within the stem, it was effective to display them sequentially through the longitudinal axis of the volume. The 3D rendering of the resulting velocity distribution inside the stem was made using Voxler software v. 4.3.771 by Golden Software.

3. Results and Discussion

3.1. Close Range Photogrammetry

The CRP technique allowed a contactless non-invasive acquisition of morphological and geometric information from the investigated holm oak and faithfully reproduced the distribution of its shallow decay forms, highlighting the critical sectors. The CRP 3D models carried out in time (2018, 2019 and beginning 2020) allowed the high resolution 3D modelling of the stem, the computation of the reflectivity pattern, and the study of the kinematics of the holm oak. For example, Figure 7 shows the 3D model related to the CRP survey made in 2018.
Thanks to the high resolution images, it was possible to create a realistic 3D model from which all the superficial characteristics of the bark as well as the relative forms of decay integrating the visual inspection results could be evaluated. By integrating the two above techniques we could better assess the spatial distribution of decay forms and the sectors most affected by pathologies.
As can be seen in Figure 7, the external decay prevails on the south side of the stem and is concentrated mainly in its middle-apical part and in the branches. The most common decay form is bark darkening combined with other severe flaws such as fractures or splitting and bark detachments.
Subsequently, we were able to detect the displacement of the holm oak. In particular, we performed another two CRP surveys in December 2019 and January 2020 using the same field geometry/strategy of the October 2018 relief. An inter-comparison of the three models calculated from the above surveys was performed in the same volume of the stem investigated by ultrasonic tomography. We used the inspection procedure of the JRC-3D Reconstructor® package by Gexcel, first computing the residuals of the three unified point clouds compared to cylindrical meshes suitably fitted and taken as references, following the methodology described in Section 2.3 in this study and in Fais et al. [25]. See Figure 8.
In a second step, we evaluated the displacement of the whole stem of the studied tree with the inspection procedure to compute the residuals (i.e., geometrical anomalies) of the 2020 relief 3D model, first taking as reference the mesh derived from the 2018 3D model, and then adopting as reference the mesh derived from the 2019 3D model. The results of the latter computation are represented in Figure 9a,b. In particular, the greatest differences were detected in the 2020–2018 time span, when the residuals varied in the ± 0.05 m range. Conversely, the 2020–2019 residuals were negligible and varied in a range of a few mm.
The external decay shown in Figure 7 is confirmed both by the geometrical anomalies represented in Figure 8 and by the deformation pattern represented in Figure 9. In the latter case the positive displacements (red anomalies in Figure 9b) were detected in the southern part of the holm oak. Conversely the negative trend (blue areas) is present in the northern side of the studied tree and varies over the ± 0.05 m range. Moreover, a tilt styled effect directed in the south direction is evident both in the 2018 CRP 3D model (Figure 7) and in the geometrical anomalies and displacement maps represented respectively in Figure 8 and Figure 9b. With the aid of this type of inspection, it was also possible to forecast the kinematics of the studied tree and the direction of its likely future collapse.
Finally, we analyzed the reflectivity map of the tree stem represented in Figure 10. The reflectivity pattern ranged between 0 and 1, with the highest values (closer to 1) represented in red and the lower values in blue (near 0.1). In this particular case, the highest radiometric effect is seen in the northern part of the studied tree, while the lowest is in the southern one, confirming that the areas most prone to disease are in the southern side of the tree.
Generally speaking, the reflectivity is affected by the colors and roughness of the investigated surfaces, as well as the inclination of incident radiation. In the case of the studied holm oak, the reflectivity pattern was strongly affected by the bark darkening detected in the southern part of the tree.

3.2. Ultrasonic Laboratory Measurements

The results of the ultrasonic laboratory tests carried out in the longitudinal direction on a sample of a healthy holm oak of the same age as the investigated one are shown in Table 1.
The data highlight that in the analyzed samples the elastic properties increase from pith to sapwood. The increasing longitudinal velocity values from pith to sapwood were related to the progressive improvement in density and elasticity towards sapwood. Higher density values favored the propagation of the ultrasonic signal, as recognized in previous studies [16,49,50]. The longitudinal velocity (Vp) values in heartwood and sapwood were quite similar because the holm oak is characterized by a diffuse porosity in the wood [51] that similarly affects the passage of the acoustic signal in the two parts. The signal in the pith is attenuated because it is made up of soft and spongy parenchyma cells that make the wood less dense and therefore characterized by poor elastic conditions.

3.3. Ultrasonic Tomography

3D Ultrasonic tomography (Figure 11) shows a high ultrasonic velocity variability between 500 m/s and 3500 m/s. As is known, the greater the propagation velocity of the longitudinal wave, the better the quality of the wood [16]. Considering the tomographic acquisition scheme, the velocity distribution visible on the tomographic images was the result of the influence of the ultrasonic signal propagation mainly along radial and tangential directions within the holm oak stem. The presence of the bark was not evident in the tomographic reconstruction. This was probably due to its small thickness (0.5–1.0 cm) compared to the ultrasonic signal wavelength of λ~8 cm, considering an average velocity of 2000 m/s and the signal frequency. This means that the resolution of the acoustic tomography was not enough to detect very small defects in the stem. However, this study was aimed to detect the internal decay of the stem to prevent potential risk failure rather than small flaws inside it.
A visible decrease in the longitudinal velocity appeared approximately from the middle to the apical part of the stem, where a significant amount of damage was concentrated. In this part, the velocity was slower than 1000 m/s (blue zones in Figure 11). Considering that the longitudinal wave propagation is strictly related to the elastic and mechanical properties of the wood, a decrease in velocity can be related to decayed and diseased zones. For instance, a lower velocity can be caused by fungal degradation of the cell walls, which in normal conditions provide support to the tree [52].
The distribution of the low velocity zones in the middle and upper part of the stem (Figure 11) suggests that the decay affected both heartwood and sapwood. Moreover heartwood decay is one of the most common defects in standing trees [53]. In our case heartwood and sapwood decay could be related to the presence of pathogenic fungi that not only produce tail disease and bark cancer but also internal wood rot. The tomography results showed that the low velocity zone mainly developed in the southern side of the stem, approximately from its middle to its apical part, and could be correlated to widespread decay prevailing in this side. This observation was also corroborated by visual inspection and CRP models. In the southern side of the stem, an extensive bark darkening together with low reflectivity values and serious worsening of its internal elastic characteristics indicated an evolution of the disease from the surface to the inner parts of the stem (Figure 12a–c). This could be related to the exposure of the stem to the most critical microclimate conditions in the part facing south, where an increase in temperature favors fungal growth [54,55,56,57,58,59,60].
The significant volume of the decayed wood suggests that the stem could be at risk of failure. Furthermore, the analysis of the 3D tomographic model highlights a fast transition from high to low velocity zones, where a high contrast of acoustic impedance occurred. This elastic discontinuity could represent a potential wood failure zone (Figure 12c).
To facilitate the diagnostic process and check the development of the zones characterized by low elastic characteristics while also detecting their geometry and size inside the stem, a few tomographic slices corresponding to horizontal sections of the investigated stem are shown in Figure 13.
The location and orientation of the horizontal slices extracted from the 3D ultrasonic tomography data volume were decided interactively for a clearer visualization of the internal distribution of the elastic characteristics of the investigated stem, while also taking into account the visual inspection results (Figure 7) and the 3D CRP models (Figure 8, Figure 9 and Figure 10). From the visualization of the tomographic slices, we could better understand the three dimensional development of the low velocity zones (blue colored in Figure 13) associated with the wood decay distribution. It can easily be observed that the decay begins approximately at an elevation of 80 cm above ground level and increases quite homogeneously towards the apical part of the stem.

4. Conclusions

The multi-methodological approach used in this work has a high potential in the monitoring of the health and stability of trees in an urban or forest environment. CRP methodology represents an important tool in the interpretation and quantitative evaluation of shallow decay forms. High resolution 3D models computed with CRP methodology performed at different times, i.e., October 2018, December 2019 and January 2020, were compared and provided a complete and timely view of the external parts of the holm oak under study. This analysis, combined with a visual inspection, affords a good evaluation of the main characteristics of the bark and its common decay forms, such as bark darkening combined with other severe disorders (e.g., fractures or splitting and bark detachments). The CRP methodology applied in this study allowed us to quantify the kinematics of the tree from October 2018 to January 2020, which is also useful as a reference for future monitoring. From this analysis, it is evident that the holm oak tilts southwards and is affected by subsidence with a maximum displacement of ± 5 cm. The combination of CRP techniques with 3D ultrasonic tomography allowed us to verify the connection between shallow and internal decay of the stem. Using ultrasonic tomography, the volume of material affected by the disease can be precisely reconstructed, and the three-dimensional distribution of the decay quantitatively known. With tomographic reconstruction, it was possible to recognize which sectors of the stem were affected by the disease–– the bark, the sapwood or the heartwood. In addition to providing information useful to verify the dangerous propagation of the decay within the stem, with ultrasonic tomography it was also possible to recognize a potential wood failure zone signaled by a sudden transition from good to poor elastic characteristics. This result is very important because a fast transition between zones with very different elastic characteristics could be interpreted as a precursor of dangerous wood failure. This calls for the use of field monitoring with the processing and visualization technologies used in this work. The proposed methodological sequence can be a useful tool to aid foresters (i.e., forestry technicians) to better understand the three-dimensional aspect of the potential development of decay in a living tree and contribute the necessary knowledge to plan its best management. In the study case, important factors such as the orientation and location of the tree on temperature distribution play an important role in the tree’s performance. Finally, the proposed integrated non-invasive methodology could contribute very advantageously both economically and in terms of execution times to a correct diagnosis of wood decay in large tree communities in urban and forest environments.

Author Contributions

S.F., M.P. and G.C. conceived the diagnostic integrated methodology; M.P. took care of the forest aspect; F.C. and M.P. performed the visual inspection analysis; F.C., G.C. and M.G.B. carried out the CRP campaign; S.F. processed and interpreted the ultrasonic data with the cooperation of F.C.; G.C. and M.G.B. processed and interpreted the CRP data. All the authors analyzed and discussed the results, contributed to the manuscript drafting and revised the manuscript. All authors have read and agreed to the published version of the manuscript.

Funding

This research received no external funding.

Institutional Review Board Statement

Not applicable.

Informed Consent Statement

Not applicable.

Data Availability Statement

Data is available upon request by contacting the corresponding author.

Conflicts of Interest

The authors declare no conflict of interest.

References

  1. Puttonen, E.; Briese, C.; Mandlburger, G.; Wieser, M.; Pfennigbauer, M.; Zlinszky, A.; Pfeifer, N. Quantification of Overnight Movement of Birch (Betula pendula) Branches and Foliage with Short Interval Terrestrial Laser Scanning. Front. Plant Sci. 2016, 7. [Google Scholar] [CrossRef] [PubMed] [Green Version]
  2. Berveglieri, A.; Tommaselli, A.M.; Liang, X.; Honkavaara, E. Vertical optical scanning with panoramic vision for tree trunk reconstruction. Sensors 2017, 17, 2791. [Google Scholar] [CrossRef] [PubMed] [Green Version]
  3. Mokroš, M.; Liang, X.; Surový, P.; Valent, P.; Čerňava, J.; Chudý, F.; Tunák, D.; Saloň, Š.; Merganič, J. Evaluation of close-range photogrammetry image collection methods for estimating tree diameters. ISPRS Int. J. Geo-Inf. 2018, 7, 93. [Google Scholar] [CrossRef] [Green Version]
  4. Iglhaut, J.; Cabo, C.; Puliti, S.; Piermattei, L.; O’Connor, J.; Rosette, J. Structure from Motion Photogrammetry in Forestry: A Review. Curr. For. Rep. 2019, 5, 155–168. [Google Scholar] [CrossRef] [Green Version]
  5. Piermattei, L.; Karel, W.; Wang, D.; Wieser, M.; Mokroš, M.; Surový, P.; Koreň, M.; Tomaštík, J.; Pfeifer, N.; Hollaus, M. Terrestrial Structure from Motion Photogrammetry for Deriving Forest Inventory Data. Remote Sens. 2019, 11, 950. [Google Scholar] [CrossRef] [Green Version]
  6. Zhang, J.; Khoshelham, K. 3D reconstruction of internal wood decay using photogrammetry and sonic tomography. Photogram Rec. 2020, 35, 357–374. [Google Scholar] [CrossRef]
  7. Via, B.K.; Shupe, T.F.; Groom, L.H.; Stine, M.; So, C.-L. Multivariate modelling of density, strength and stiffness from near infrared spectra for mature, juvenile and pith wood of longleaf pine (Pinus palustris). J. Near Infrared Spectrosc. 2003, 11, 365–378. [Google Scholar] [CrossRef]
  8. Meder, R.; Schimleck, L. Has the time finally come for NIR in the forestry sector? J. Near Infrared Spectrosc. 2011, 19, v-v. [Google Scholar] [CrossRef] [Green Version]
  9. Schimleck, L.R.; Matos, J.L.M.; Trianoski, R.; Prata, J.G. Comparison of methods for estimating mechanical properties of wood by NIR spectroscopy. J. Spectrosc. 2018, 2018, 4823285. [Google Scholar] [CrossRef] [Green Version]
  10. Yu, L.; Liang, Y.; Zhang, Y.; Cao, J. Mechanical properties of wood materials using near-infrared spectroscopy based on correlation local embedding and partial least-squares. J. Res. 2020, 31, 1053–1060. [Google Scholar] [CrossRef] [Green Version]
  11. Schimleck, L.; Matos, J.L.; Higa, A.; Trianoski, R.; Prata, J.G.; Dahlen, J. Classifying Wood Properties of Loblolly Pine Grown in Southern Brazil Using NIR-Hyperspectral Imaging. Forests 2020, 11, 686. [Google Scholar] [CrossRef]
  12. Dahlen, J.; Auty, D.; Eberhardt, T.L.; Turnblom, E.; Lowell, E.; Schimleck, L.; Montes, C.; Eberhardt, T.L.; So, C.-L.; Leduc, D.J. Assessing the within-tree variation in stiffness from ultrasonic velocity and specific gravity measurements in Douglas-fir and loblolly pine. Notes 2019, 122–131. [Google Scholar]
  13. Schimleck, L.; Dahlen, J.; Apiolaza, L.A.; Downes, G.; Emms, G.; Evans, R.; Moore, J.; Pâques, L.; Van den Bulcke, J.; Wang, X. Non-Destructive Evaluation Techniques and What They Tell Us about Wood Property Variation. Forests 2019, 10, 728. [Google Scholar] [CrossRef] [Green Version]
  14. Brancheriau, L.; Saadat-Nia, M.A.; Gallet, P.; Lasaygues, P.; Pourtahmas, K.; Kaftandjian, V. Ultrasonic imaging of reaction wood in standing trees. In Proceedings of the 31th International Symposium on Acoustical Imaging (AI31), Warsaw, Poland, 10–13 April 2011. [Google Scholar]
  15. Gilbert, G.S.; Ballesteros, J.O.; Barrios-Rodriguez, C.A.; Bonadies, E.F.; Cedeño-Sánchez, M.L.; Fossatti-Caballero, N.J.; Trejos-Rodríguez, M.M.; Pérez-Suñiga, J.M.; Holub-Young, K.S.; Henn, L.A. Use of sonic tomography to detect and quantify wood decay in living trees. Appl. Plant Sci. 2016, 4, 1600060. [Google Scholar] [CrossRef]
  16. Bucur, V. Acoustics of wood. In Proceedings of the Materials Science Forum; CRC Press Inc.: Boca Raton, FL, USA, 1995; Volume 210, pp. 1–300. [Google Scholar]
  17. Wu, X.; Li, G.; Jiao, Z.; Wang, X. Reliability of acoustic tomography and ground-penetrating radar for tree decay detection. Appl. Plant Sci. 2018, 6, e01187. [Google Scholar] [CrossRef] [PubMed] [Green Version]
  18. Erenoglu, R.C.; Akcay, O.; Erenoglu, O. An UAS-assisted multi-sensor approach for 3D modeling and reconstruction of cultural heritage site. J. Cult. Herit. 2017, 26, 79–90. [Google Scholar] [CrossRef]
  19. Bianchi, M.G.; Casula, G.; Cuccuru, F.; Fais, S.; Ligas, P.; Ferrara, C. Three-dimensional imaging from laser scanner, photogrammetric and acoustic non-destructive techniques in the characterization of stone building materials. Adv. Geosci. 2018, 45, 57–62. [Google Scholar] [CrossRef] [Green Version]
  20. Fais, S.; Casula, G.; Cuccuru, F.; Ligas, P.; Bianchi, M.G. An innovative methodology for the non-destructive diagnosis of architectural elements of ancient historical buildings. Sci. Rep. 2018, 8, 4334. [Google Scholar] [CrossRef] [Green Version]
  21. Adamopoulos, E.; Rinaudo, F. 3D interpretation and fusion of multidisciplinary data for heritage science: A review. In Proceedings of the 27th International CIPA Symposium, Avila, Spain, 1–5 September 2019; Volume 42, pp. 17–24. [Google Scholar]
  22. Casula, G.; Cuccuru, F.; Bianchi, M.G.; Fais, S.; Ligas, P. High resolution 3-D modelling of cylinder shape bodies applied to ancient columns of a church. Adv. Geosci. 2020, 54, 119–127. [Google Scholar] [CrossRef]
  23. Snavely, N.; Seitz, S.M.; Szeliski, R. Modeling the World from Internet Photo Collections. Int. J. Comput. Vis. 2008, 80, 189–210. [Google Scholar] [CrossRef] [Green Version]
  24. Westoby, M.J.; Brasington, J.; Glasser, N.F.; Hambrey, M.J.; Reynolds, J.M. ‘Structure-from-Motion’ photogrammetry: A low-cost, effective tool for geoscience applications. Geomorphology 2012, 179, 300–314. [Google Scholar] [CrossRef] [Green Version]
  25. Fais, S.; Cuccuru, F.; Casula, G.; Bianchi, M.G.; Ligas, P. Characterization of Rock Samples by A High-Resolution Multi-Technique Non-Invasive Approach. Minerals 2019, 9, 664. [Google Scholar] [CrossRef] [Green Version]
  26. Cuccuru, F.; Fais, S.; Ligas, P. Dynamic elastic characterization of carbonate rocks used as building materials in the historical city centre of Cagliari (Italy). Q. J. Eng. Geol. Hydrogeol. 2014, 47, 259–266. [Google Scholar] [CrossRef]
  27. Fais, S.; Ligas, P.; Cuccuru, F.; Maggio, E.; Plaisant, A.; Pettinau, A.; Casula, G.; Bianchi, M.G. Detailed Petrophysical and Geophysical Characterization of Core Samples from the Potential Caprock-reservoir System in the Sulcis Coal Basin (Southwestern Sardinia—Italy). Energy Procedia 2015, 76, 503–511. [Google Scholar] [CrossRef] [Green Version]
  28. Fais, S.; Cuccuru, F.; Ligas, P.; Casula, G.; Bianchi, M.G. Integrated ultrasonic, laser scanning and petrographical characterisation of carbonate building materials on an architectural structure of a historic building. Bull. Eng. Geol. Environ. 2017, 76, 71–84. [Google Scholar] [CrossRef]
  29. Fais, S.; Casula, G.; Cuccuru, F.; Ligas, P.; Bianchi, M.G.; Plaisant, A.; Pettinau, A. A Contribution to the Geological Characterization of a Potential Caprock-Reservoir System in the Sulcis Coal Basin (South-Western Sardinia). Energies 2019, 12, 4524. [Google Scholar] [CrossRef] [Green Version]
  30. Arrigoni, P.V. Fitoclimatologia Della Sardegna; Webbia: Firenze, Italy, 1968; Volume 23, ISBN 0083-7792. [Google Scholar]
  31. Arrigoni, P.V. Flora dell’Isola di Sardegna; Delfino: Sassari, Italy, 2006; ISBN 88-7138-414-8. [Google Scholar]
  32. Smith, W.H. Forest Biotic Agent Stress: Air Pollutants and Disease Caused by Microbial Pathogens. In Air Pollut. Forests: Interactions between Air Contaminants and Forest Ecosystems; Springer: New York, NY, USA, 1990; pp. 366–397. [Google Scholar]
  33. Barrocu, G.; Crespellani, T. Carta Geologico-Tecnica di Cagliari Scala 1:10000, Facoltà di Ingegneria; Dipartimento di Ingegneria Del Territorio, Università di Cagliari: Cagliari, Italy, 1981. [Google Scholar]
  34. De Rigo, D.; Caudullo, G. Quercus ilex in Europe: Distribution, habitat, usage and threats. Eur. Atlas For. Tree Species 2016, 130–131. [Google Scholar]
  35. Ruffinatto, F.; Crivellaro, A. Atlas of Macroscopic Wood Identification: With a Special Focus on Timbers Used in Europe and CITES-listed Species; Springer Nature: Berlin/Heidelberg, Germany, 2019; ISBN 3-030-23566-1. [Google Scholar]
  36. British Standards Institution. UNI EN 13556 Round and Sawn Timber—Nomenclature of Timbers Used in Europe; British Standards Institution: London, UK, 2003. [Google Scholar]
  37. Campanella, M.; Rossi, G.; Ruggiero, G. JRC 3D Reconstructor® User Manual; Gexcel, Geomatics and Excellence: Brescia, Italy, 2014. [Google Scholar]
  38. CloudCompare. CloudCompare (Version 2.11 Beta) [GPL Software]. 2020. Available online: http://www.cloudcompare.org/ (accessed on 4 January 2021).
  39. Kazhdan, M.; Bolitho, M.; Hoppe, H. Poisson surface reconstruction. In Proceedings of the Fourth Eurographics symposium on Geometry Processing, Cagliari, Italy, 26–28 June 2006; Volume 7, pp. 61–70. [Google Scholar]
  40. ISRM. Upgraded ISRM Suggested Method for Determining Sound Velocity by Ultrasonic Pulse Transmission Technique. In The ISRM Suggested Methods for Rock Characterization, Testing and Monitoring: 2007–2014; Ulusay, R., Ed.; Springer International Publishing: Cham, Switzerland, 2014; pp. 95–99. [Google Scholar]
  41. Espinosa, L.; Prieto, F.; Brancheriau, L.; Lasaygues, P. Effect of wood anisotropy in ultrasonic wave propagation: A ray-tracing approach. Ultrasonics 2019, 91, 242–251. [Google Scholar] [CrossRef]
  42. Cuccuru, F. Non-destructive ultrasonic testings on a monumental structure of the historical center of Cagliari (Italy). Iosr-Jagg 2017, 5, 25–30. [Google Scholar]
  43. Gilbert, P. Iterative methods for the three-dimensional reconstruction of an object from projections. J. Theor. Biol. 1972, 36, 105–117. [Google Scholar] [CrossRef]
  44. Roberts, J.D.M.; Belchamber, R.M.; Lilley, T.; Betteridge, D.; Bishop, I.; Styles, P. An evaluation of computerized tomography for near-surface geophysical exploration. Comput. Geosci. 1989, 15, 727–737. [Google Scholar] [CrossRef]
  45. Trampert, J.; Leveque, J.-J. Simultaneous iterative reconstruction technique: Physical interpretation based on the generalized least squares solution. J. Geophys. Res. 1990, 95, 12553–12559. [Google Scholar] [CrossRef]
  46. Phillips, W.S.; Fehler, M.C. Traveltime tomography: A comparison of popular methods. Geophysics 1991, 56, 1639–1649. [Google Scholar] [CrossRef]
  47. Michelena, R.J.; Muir, F.; Harris, J.M. Anisotropic traveltime tomography. Geophys. Prospect. 1993, 41, 381–412. [Google Scholar] [CrossRef]
  48. Fais, S.; Casula, G. Application of acoustic techniques in the evaluation of heterogeneous building materials. NDT E Int. 2010, 43, 62–69. [Google Scholar] [CrossRef] [Green Version]
  49. de Oliveira, F.G.R.; Sales, A. Relationship between density and ultrasonic velocity in Brazilian tropical woods. Bioresour. Technol. 2006, 97, 2443–2446. [Google Scholar] [CrossRef]
  50. Carrasco, E.V.M.; Azevedo, A.P.J. Non destructive evaluation of wood mechanical properties through ultrasonic sound waves-physical foundations and experimental results. Cerne 2003, 16, 27–37. [Google Scholar]
  51. Campelo, F.; Nabais, C.; Gutiérrez, E.; Freitas, H.; García-González, I. Vessel features of Quercus ilex L. growing under Mediterranean climate have a better climatic signal than tree-ring width. Trees 2010, 24, 463–470. [Google Scholar] [CrossRef]
  52. Martínez, Á.T.; Speranza, M.; Ruiz-Dueñas, F.J.; Ferreira, P.; Camarero, S.; Guillén, F.; Martínez, M.J.; Gutiérrez Suárez, A.; del Río Andrade, J.C. Biodegradation of Lignocellulosics: Microbial, Chemical, and Enzymatic Aspects of the Fungal Attack of Lignin. Int. Microbiol. 2005, 8, 195–204. [Google Scholar]
  53. Liang, S.; Wang, X.; Wiedenbeck, J.; Cai, Z.; Fu, F. Evaluation of acoustic tomography for tree decay detection. In Proceedings of the 15th International Symposium on Nondestructive Testing of Wood, 10–12 September 2007; Forest Products Society: Duluth, MN, USA, 2008; pp. 49–54. [Google Scholar]
  54. Talley, S.M.; Coley, P.D.; Kursar, T.A. The effects of weather on fungal abundance and richness among 25 communities in the Intermountain West. BMC Ecol. 2002, 2, 7. [Google Scholar] [CrossRef]
  55. Chakraborty, S. Potential impact of climate change on plant-pathogen interactions. Australas. Plant Pathol. 2005, 34, 443–448. [Google Scholar] [CrossRef]
  56. Weissenberg, K.; Thomsen, I.M.; La Porta, N.; Capretti, P. Impacts of climate fluctuations and climate changes on forest tree pathogens in Europe. Int. For. Rev. 2005, 75, 83. [Google Scholar]
  57. Garrett, K.A.; Dendy, S.P.; Frank, E.E.; Rouse, M.N.; Travers, S.E. Climate change effects on plant disease: Genomes to ecosystems. Annu. Rev. Phytopathol. 2006, 44, 489–509. [Google Scholar] [CrossRef] [PubMed] [Green Version]
  58. La Porta, N.; Capretti, P.; Thomsen, I.M.; Kasanen, R.; Hietala, A.M.; Von Weissenberg, K. Forest pathogens with higher damage potential due to climate change in Europe. Can. J. Plant Pathol. 2008, 30, 177–195. [Google Scholar] [CrossRef]
  59. Eastburn, D.M.; McElrone, A.J.; Bilgin, D.D. Influence of atmospheric and climatic change on plant–pathogen interactions. Plant Pathol. 2011, 60, 54–69. [Google Scholar] [CrossRef]
  60. Elad, Y.; Pertot, I. Climate change impacts on plant pathogens and plant diseases. J. Crop Improv. 2014, 28, 99–139. [Google Scholar] [CrossRef]
Figure 1. (a) Geographical position of the investigated holm oak (39°12′25.5″ N–9°08′28.4″ E, modified from Google Maps, Map data: Google, Maxar Technologies); (b) Geological setting of the study site. Modified from Barrocu et al., 1981 [33].
Applsci 11 01199 g001
Figure 2. Bark darkening, splitting and detachment in the basal part of the different branches: (a) north side; (b) south side; (c) east side.
Applsci 11 01199 g002
Figure 3. Workflow of the CRP data processing; CRP data are processed with Agisoft Metashape®, JRC-3D Reconstructor®, and Danielgm CloudCompare software.
Applsci 11 01199 g003
Figure 4. Three-dimensional photogrammetric model of a healthy holm oak sample.
Applsci 11 01199 g004
Figure 5. (a) Acquisition points for ultrasonic measurements in pith (P), heartwood (H) and sapwood (S); (b) ultrasonic measurements in the longitudinal direction according to the direct acquisition mode.
Applsci 11 01199 g005
Figure 6. Ultrasonic measurement point locations in the 3D CRP model.
Applsci 11 01199 g006
Figure 7. CRP 3D model of the studied living holm oak and shallow decay forms (2018 survey).
Applsci 11 01199 g007
Figure 8. Evolution in time of the geometrical anomalies computed as residuals compared to meshed cylinders fitted to the unified clouds derived respectively from the October 2018, December 2019, and January 2020 CRP reliefs; (a) view from the southwest, (b) view from the northeast.
Applsci 11 01199 g008
Figure 9. (a) Displacement of the holm oak under study as detected by comparing the CRP 3D models of December 2019, taken as reference mesh, and January 2020; residuals are expressed in m.(b) Displacement in m obtained after the comparison of the October 2018 3D model, taken as reference mesh, and the January 2020 photogrammetric campaign 3D model.
Applsci 11 01199 g009
Figure 10. Different view of the reflectivity pattern of the CRP 3D model of the studied holm oak and represented in a 0–1 intensity color scale. The reflectivity is detected by the natural color radiometry of the tree. In this case, the lowest reflectivity is observed in the southern part of the tree (see blue areas in the figure).
Applsci 11 01199 g010
Figure 11. Different views of the 3D tomographic model.
Applsci 11 01199 g011
Figure 12. (a) Visual inspection; (b) CRP 3D model of the stem reflectivity; (c) 3D ultrasonic tomography.
Applsci 11 01199 g012
Figure 13. 3D view of tomographic slices.
Applsci 11 01199 g013
Table 1. Mean velocity values (Vp) of longitudinal ultrasonic signals characterizing the different anatomic parts of a healthy holm oak sample.
Parts of the StemVp (m/s)
Pith3700
Heartwood4550
Sapwood4650
Publisher’s Note: MDPI stays neutral with regard to jurisdictional claims in published maps and institutional affiliations.

