
Terahertz Rotational Spectroscopy of Greenhouse Gases Using Long Interaction Path-Lengths

 ,
,  , , , , , , and
Abstract
:1. Introduction
2. Materials and Methods
2.1. Synchrotron Based FT THz Spectroscopy
2.2. Cw-THz Spectroscopy by Photomixing
2.3. Submm-Wave Spectroscopy with Amplified Multiplier Chains
2.4. Detection Schemes
3. Results and Discussion
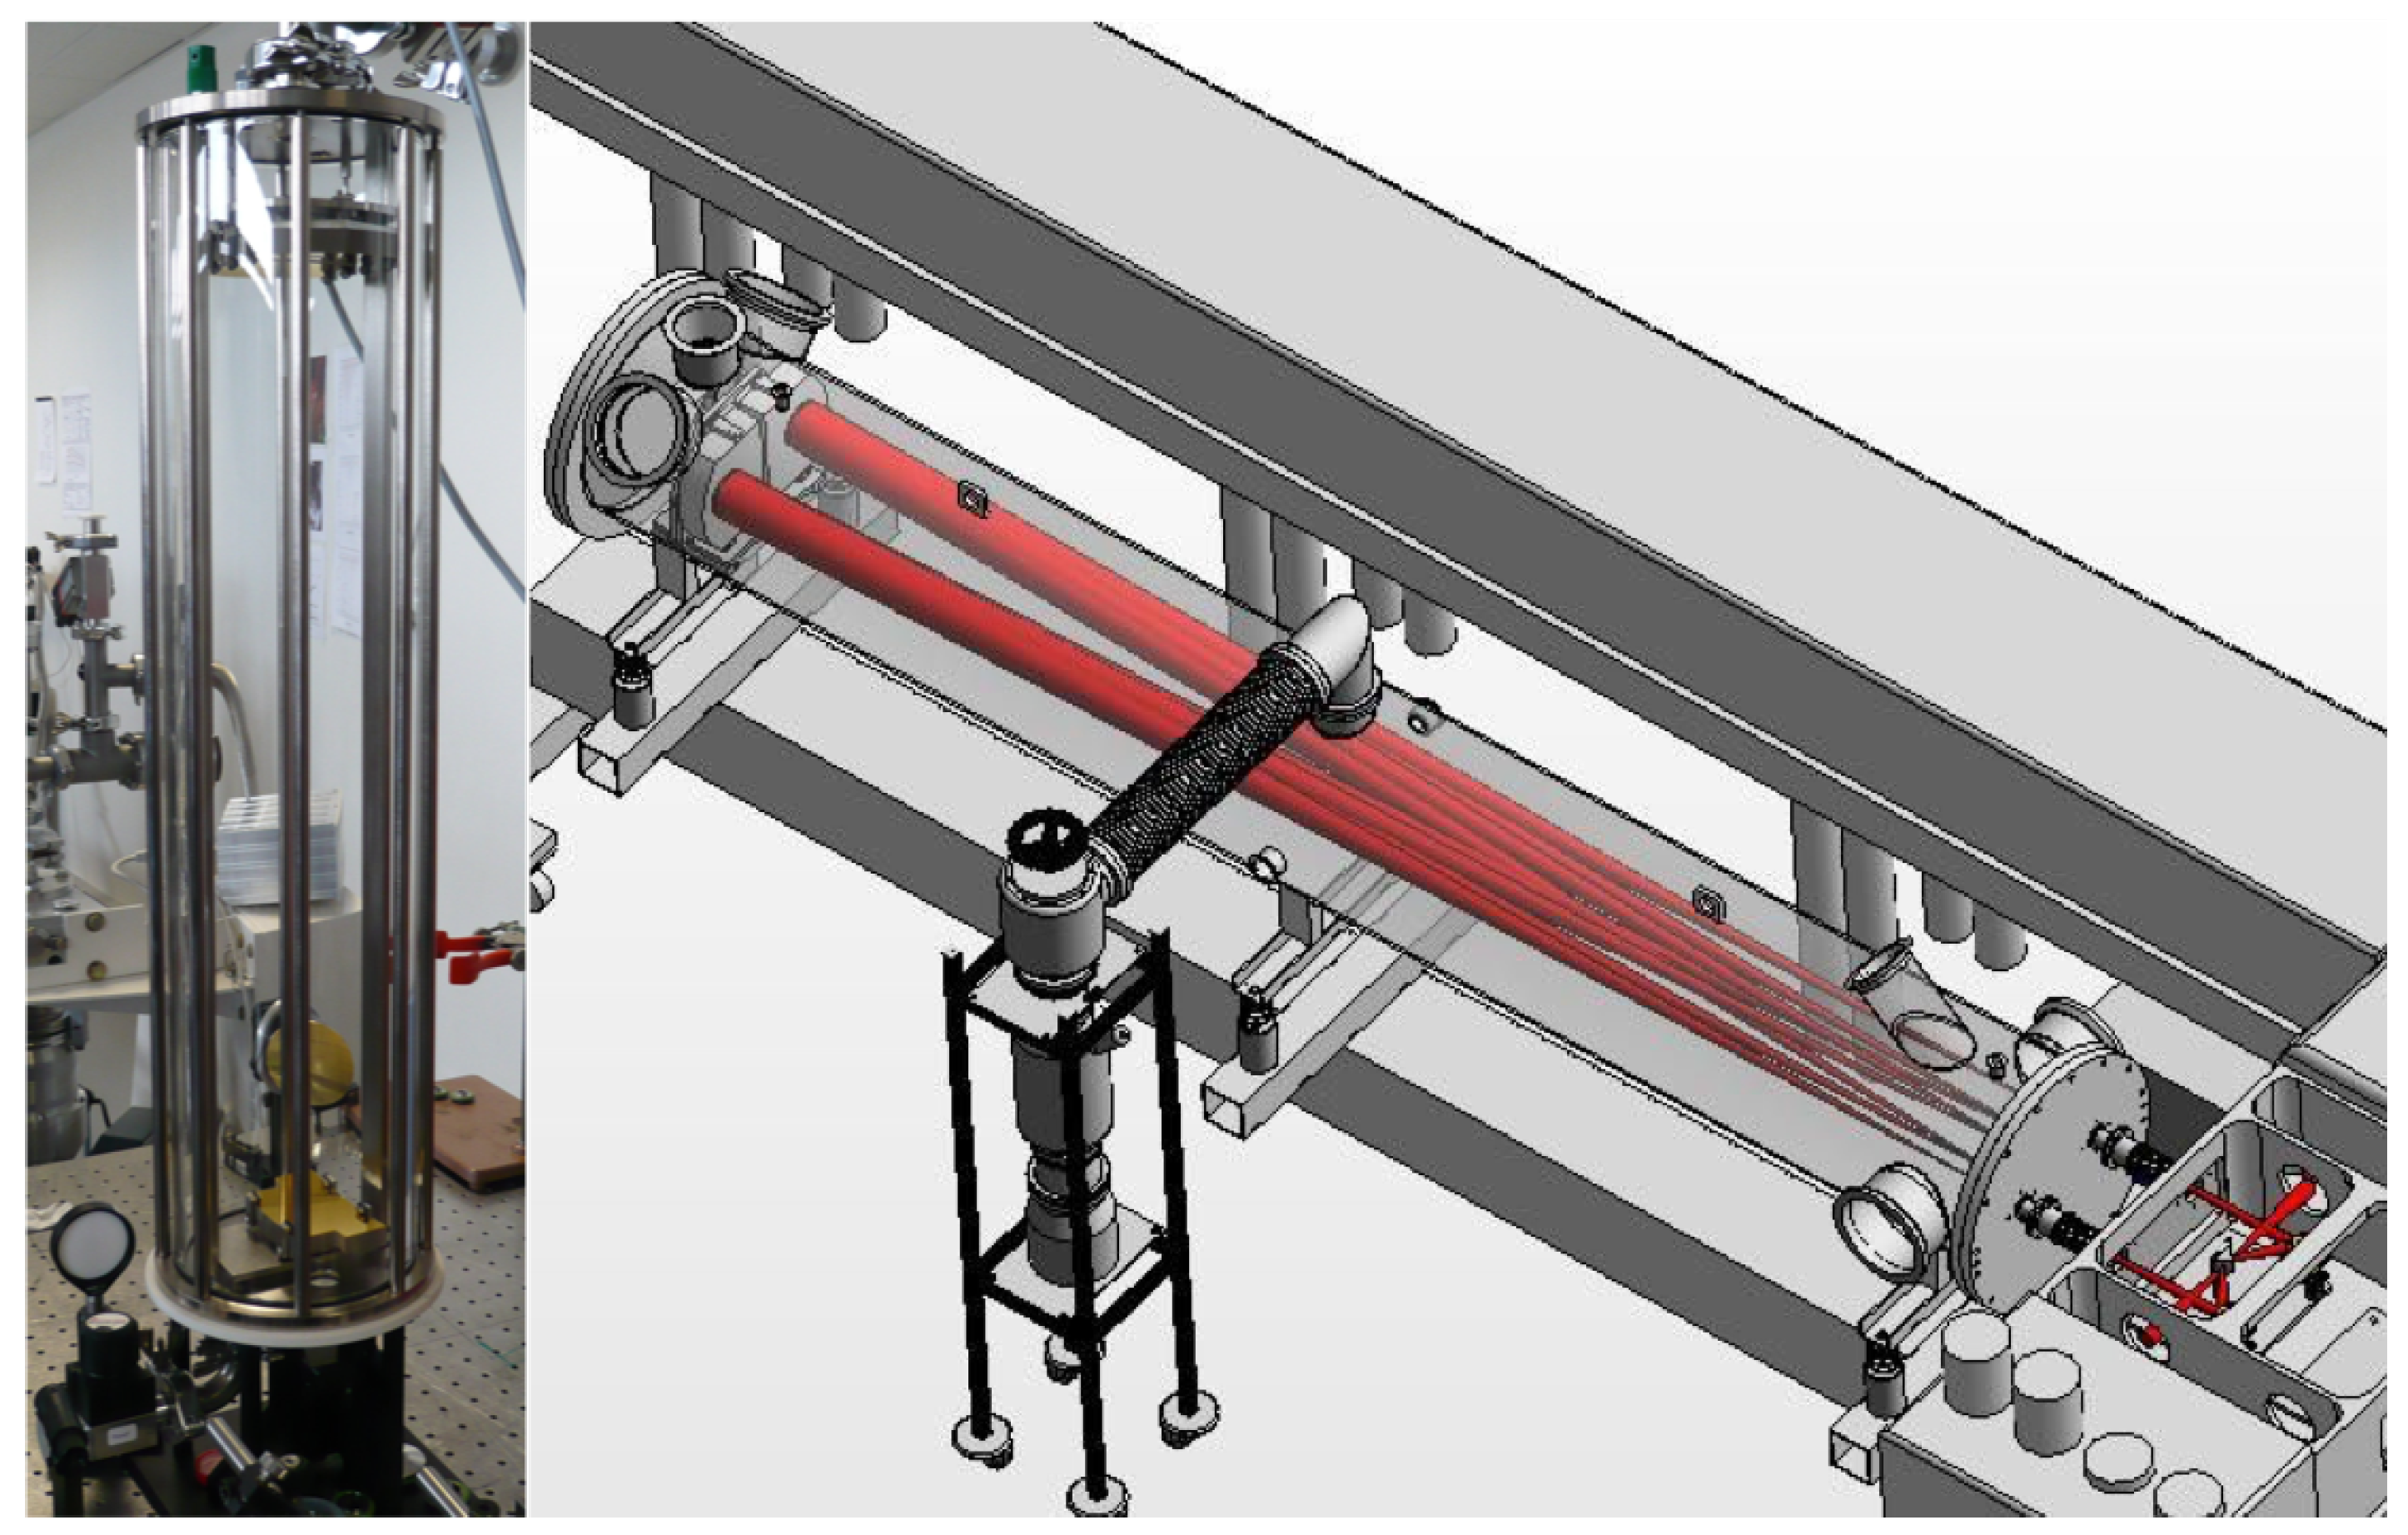
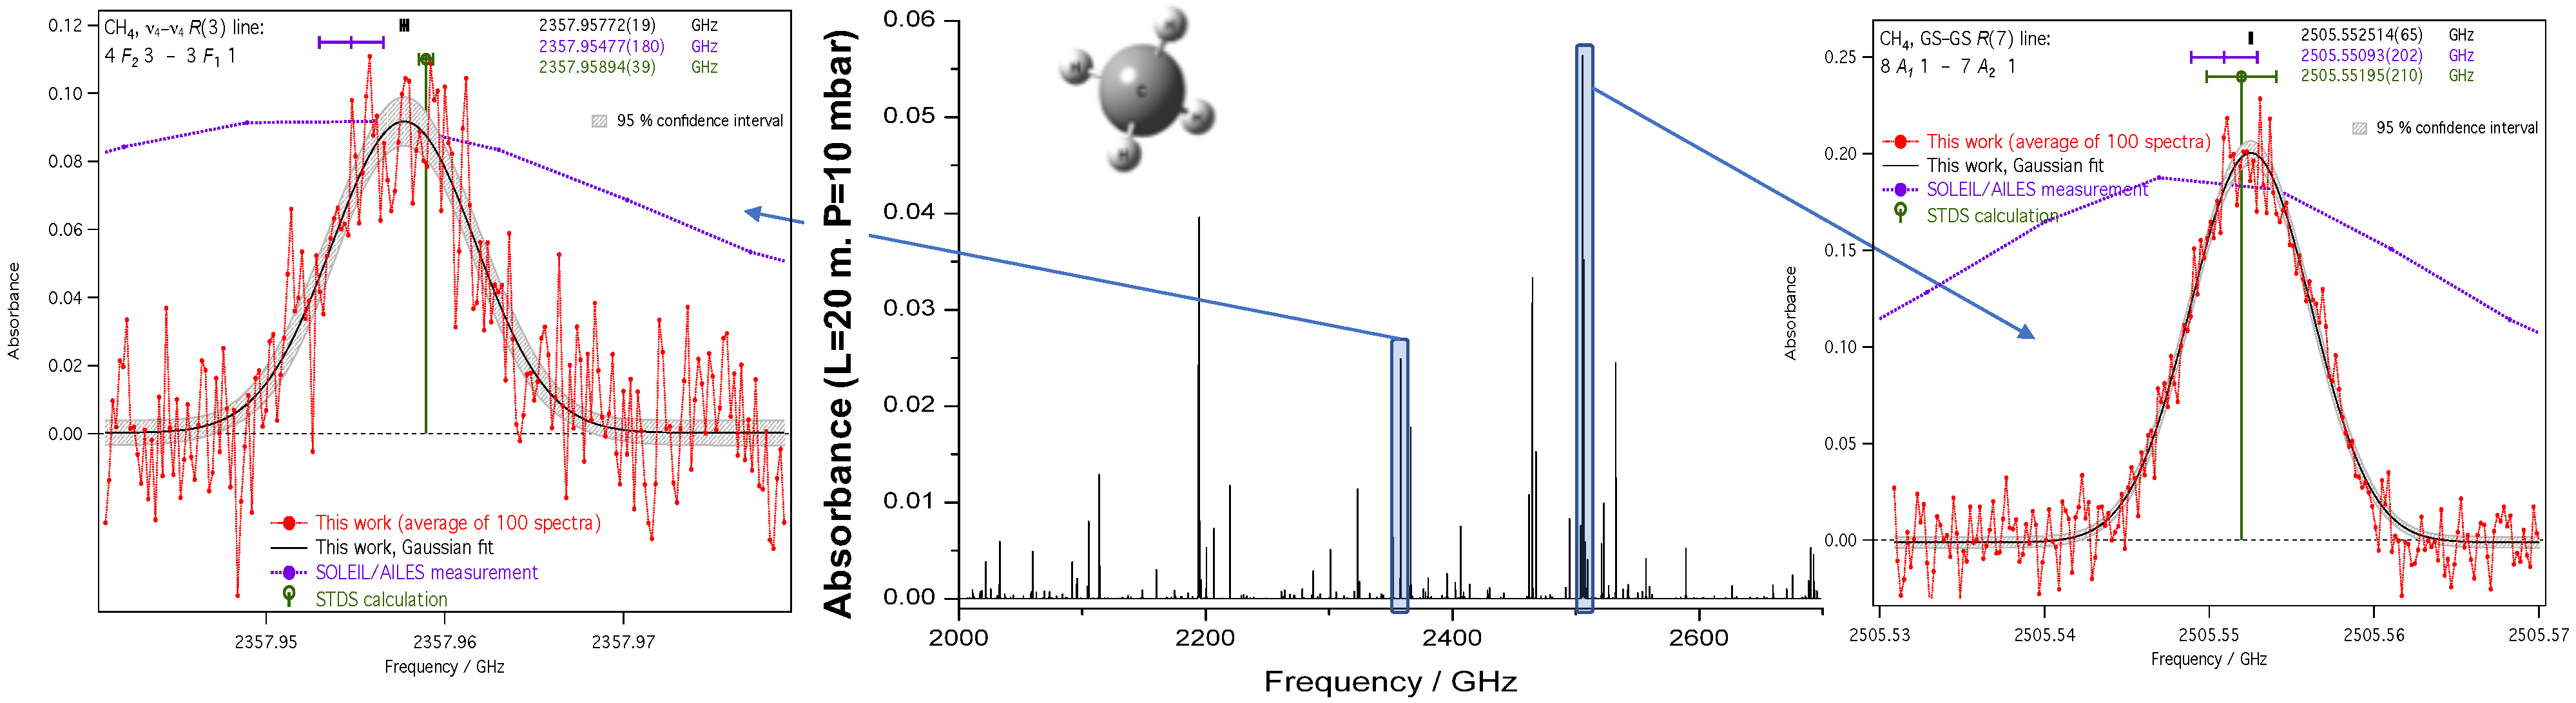
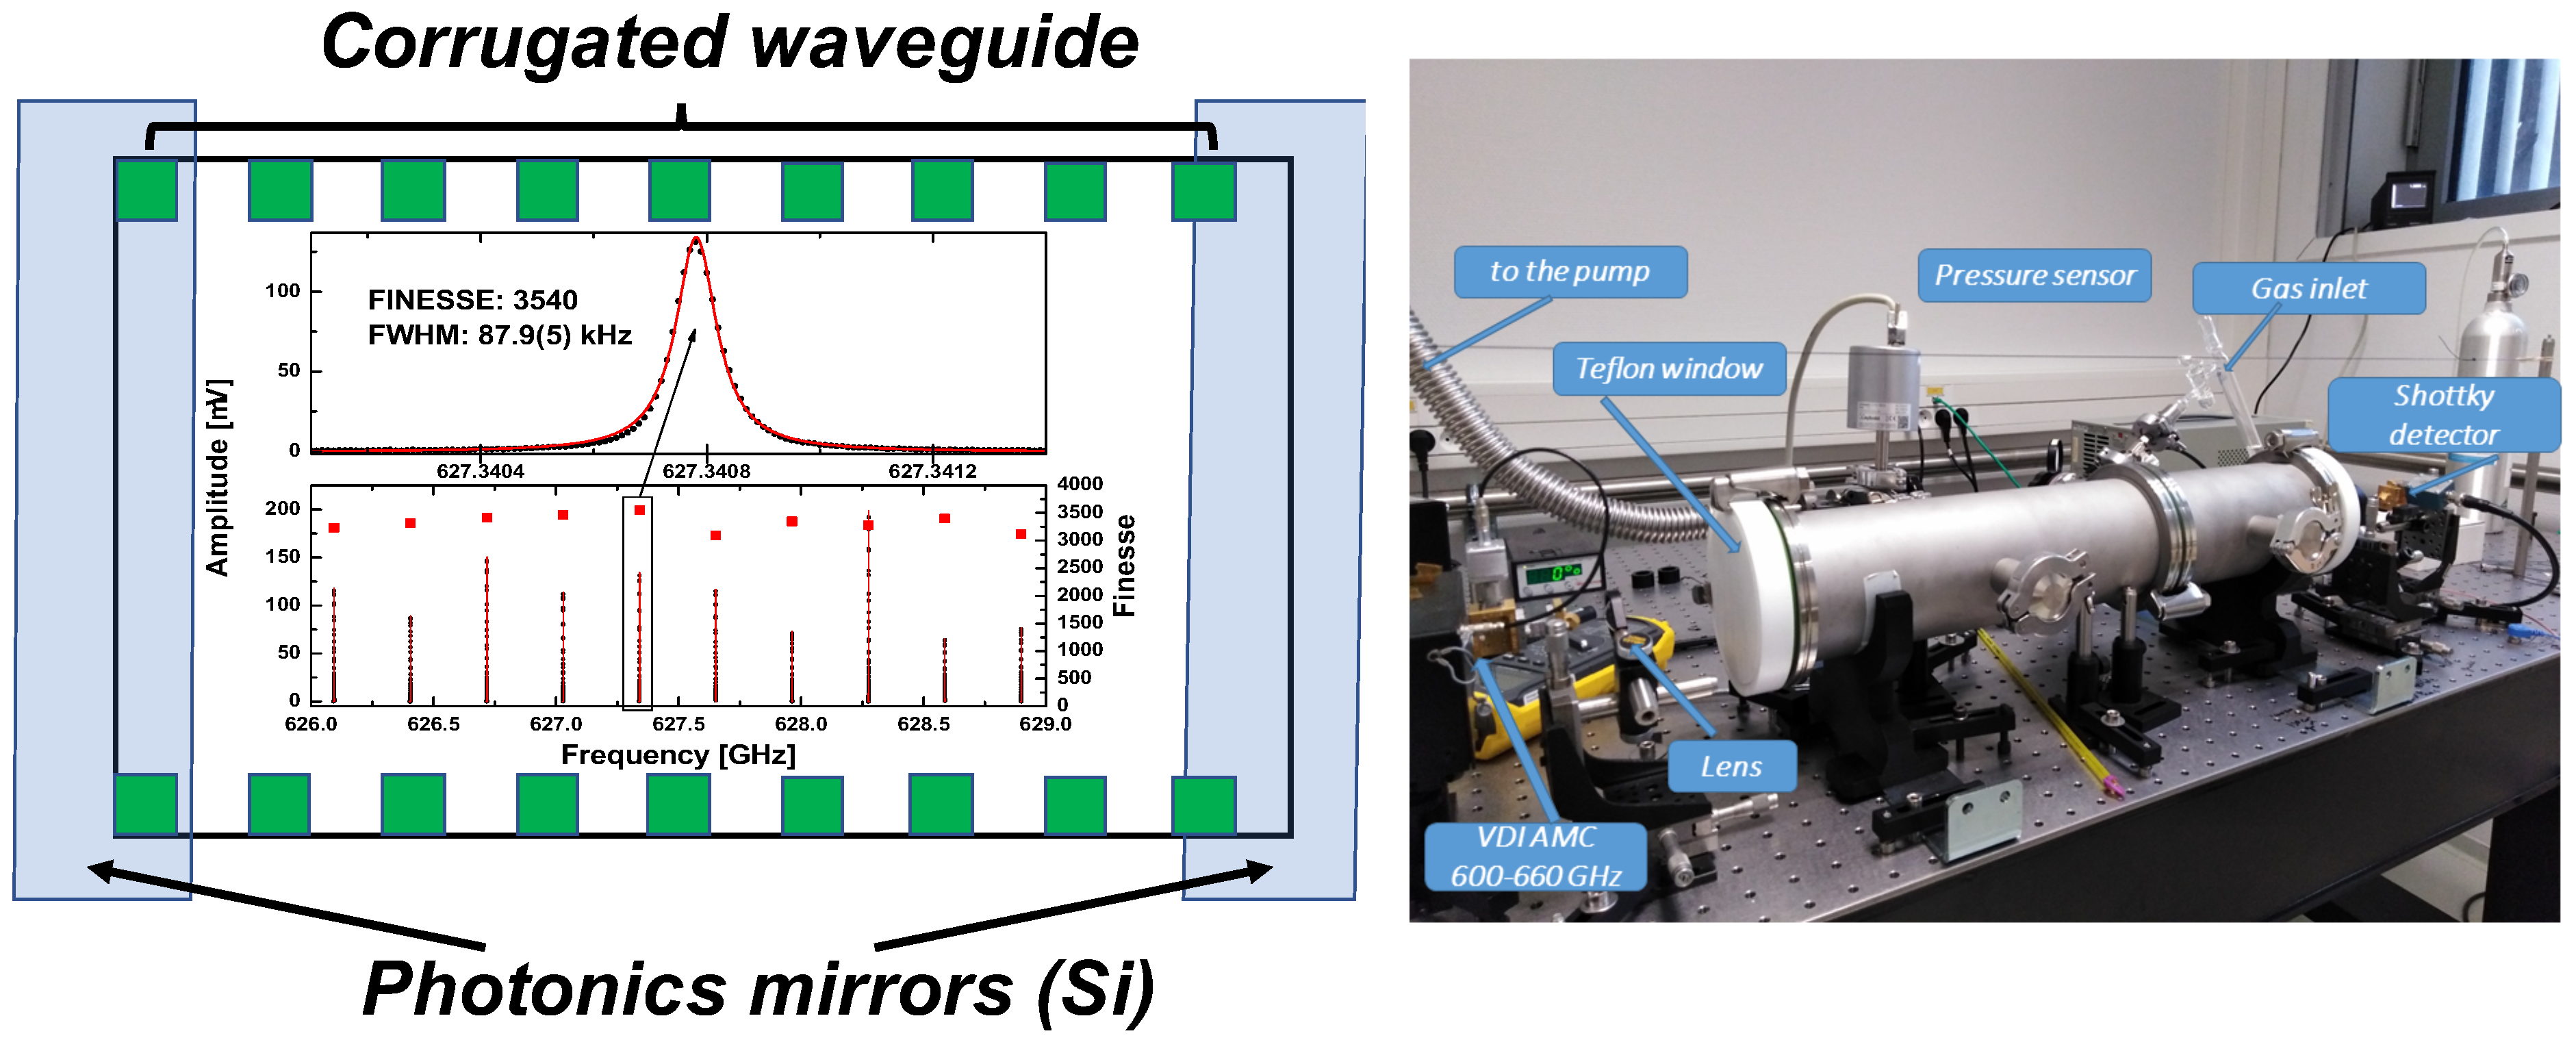
3.1. THz Measurements of CH in a White Type Multi-Pass Cell
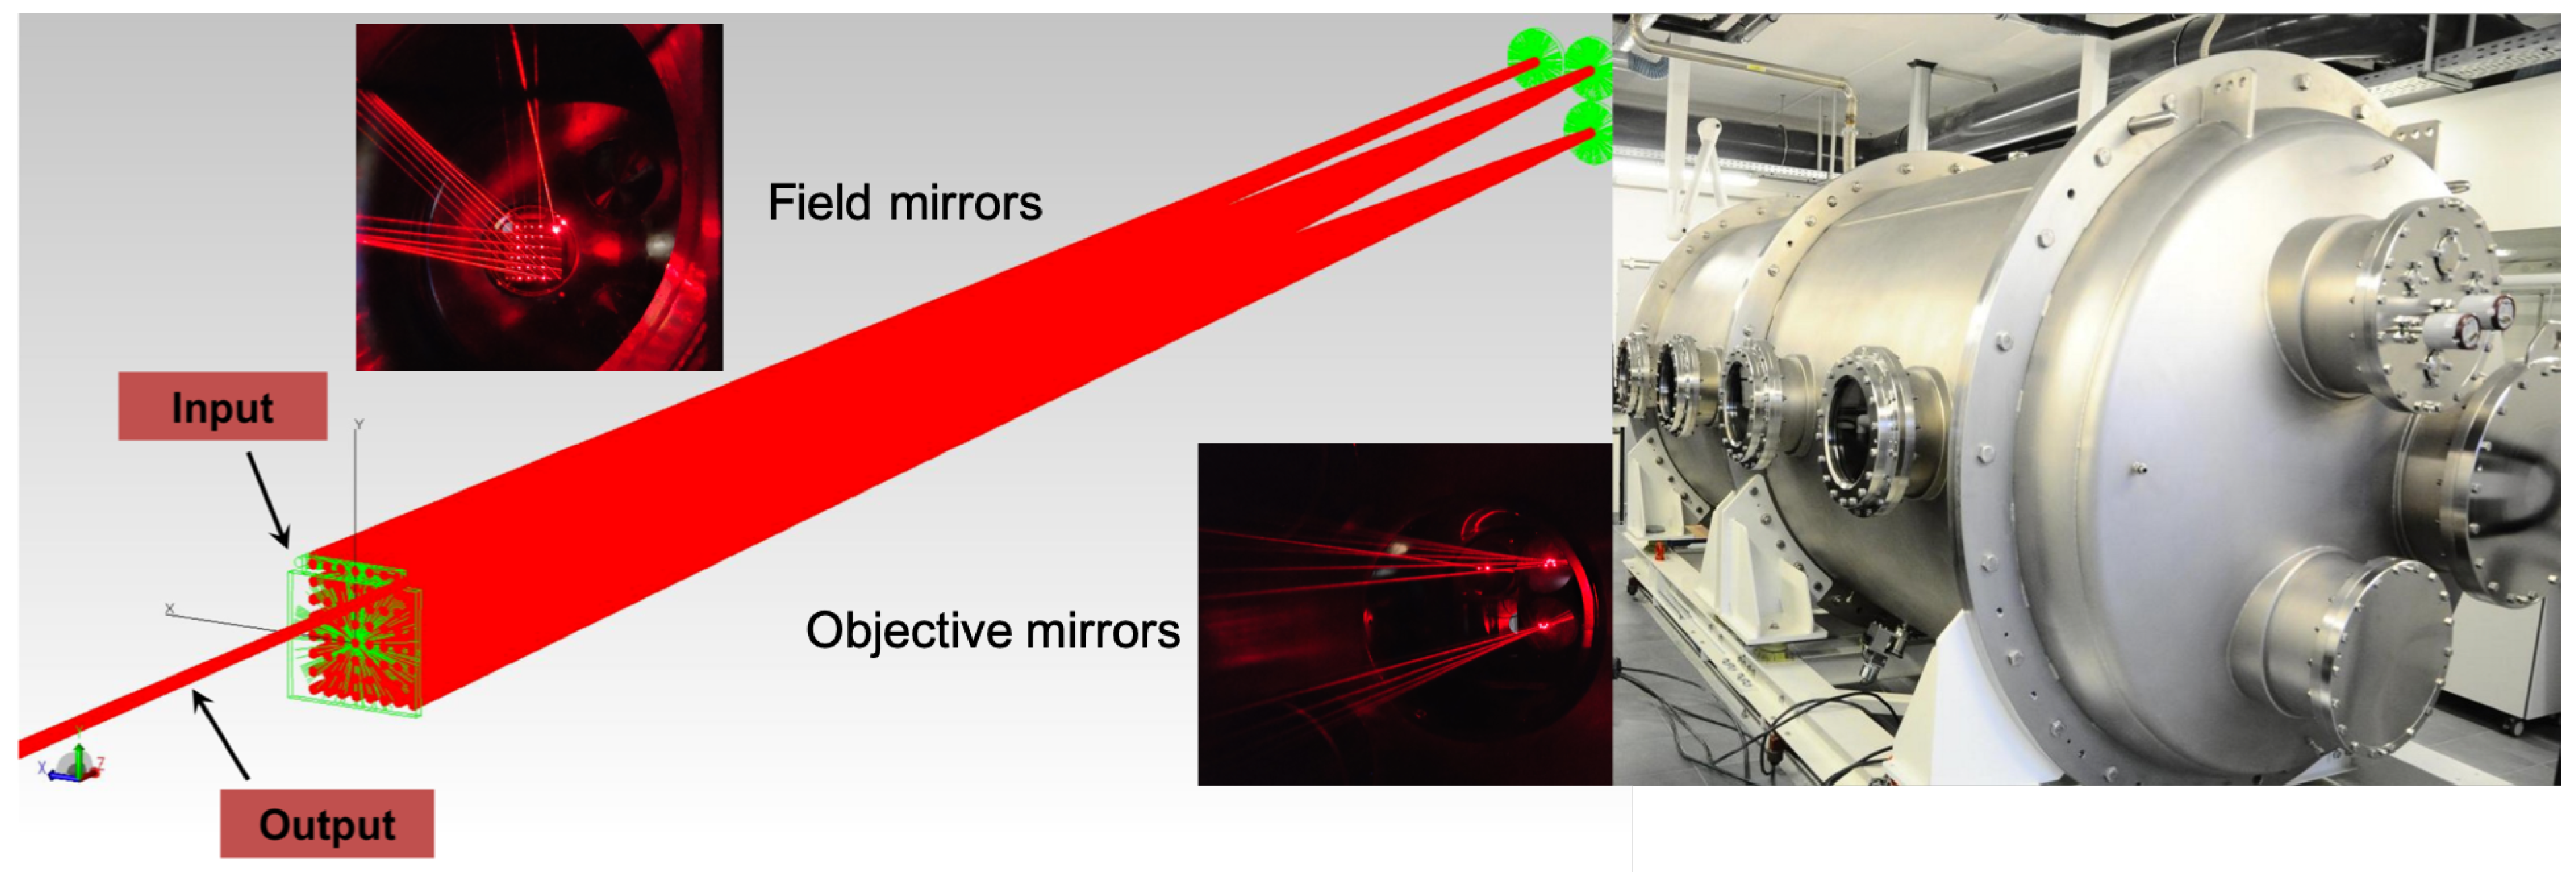
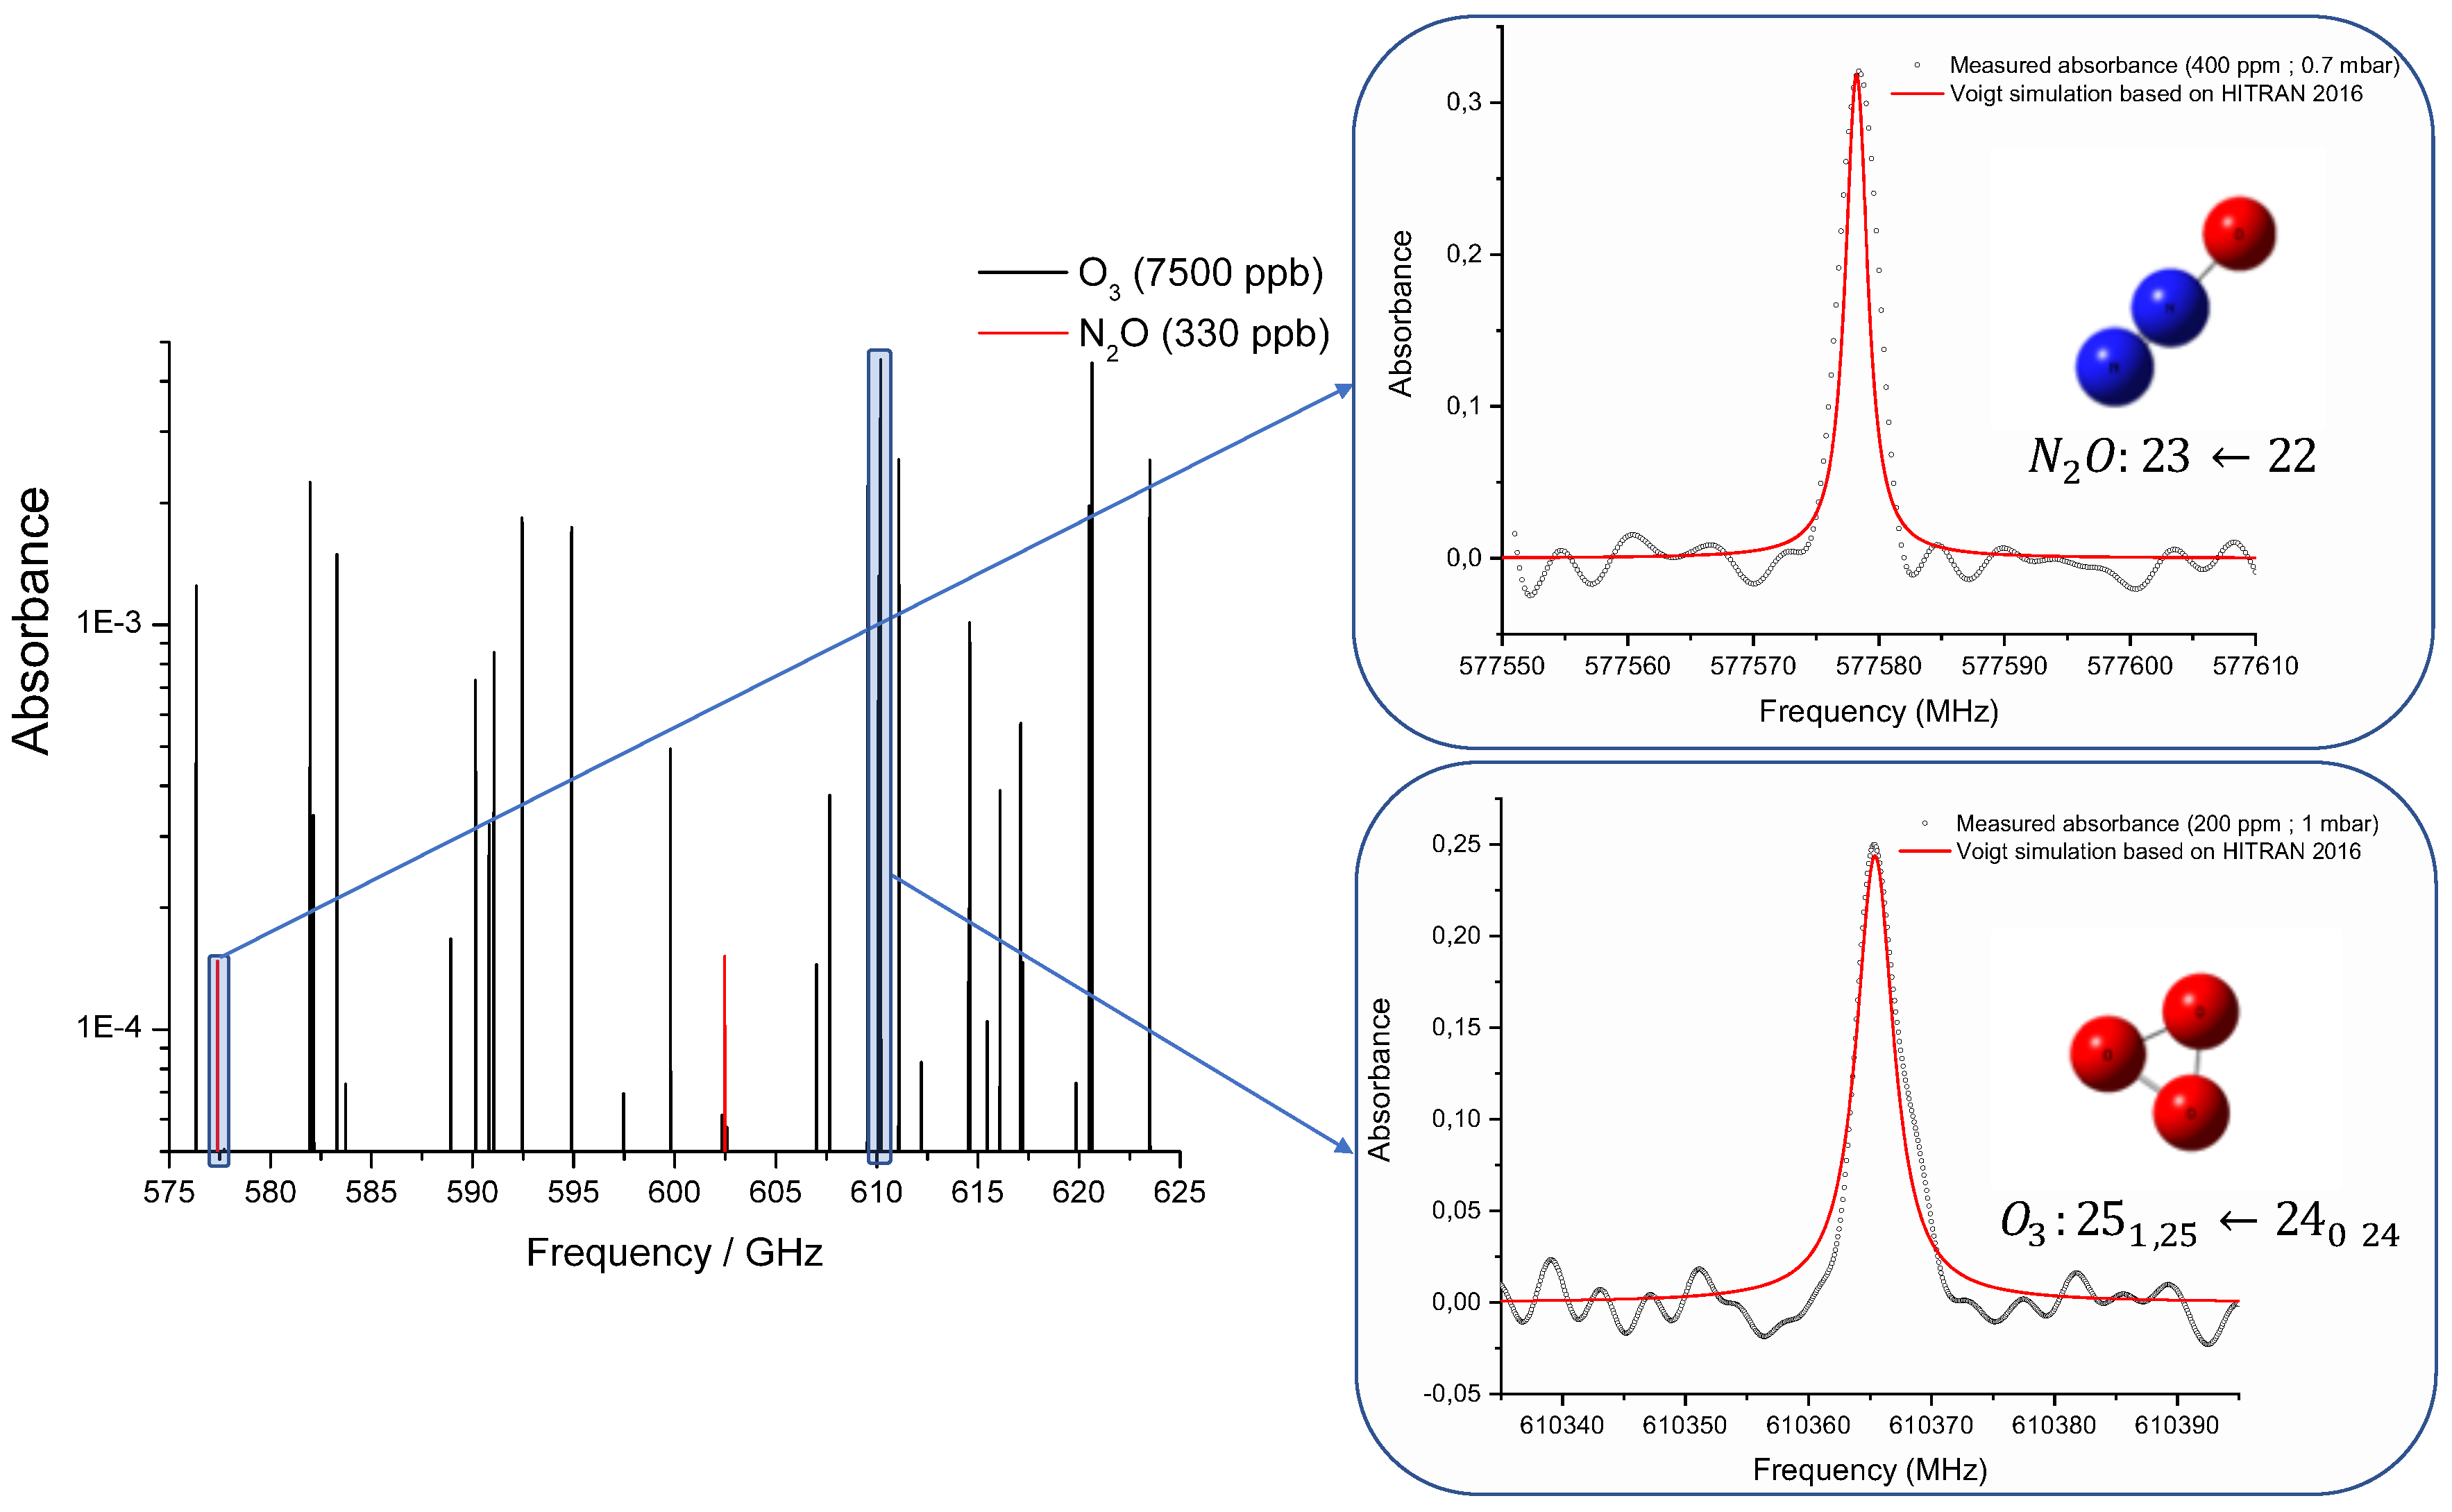
3.2. Trace Gases THz Measurements of NO and O in an Atmospheric Simulation Chamber Equipped with a Chernin Type Multi-Pass Cell
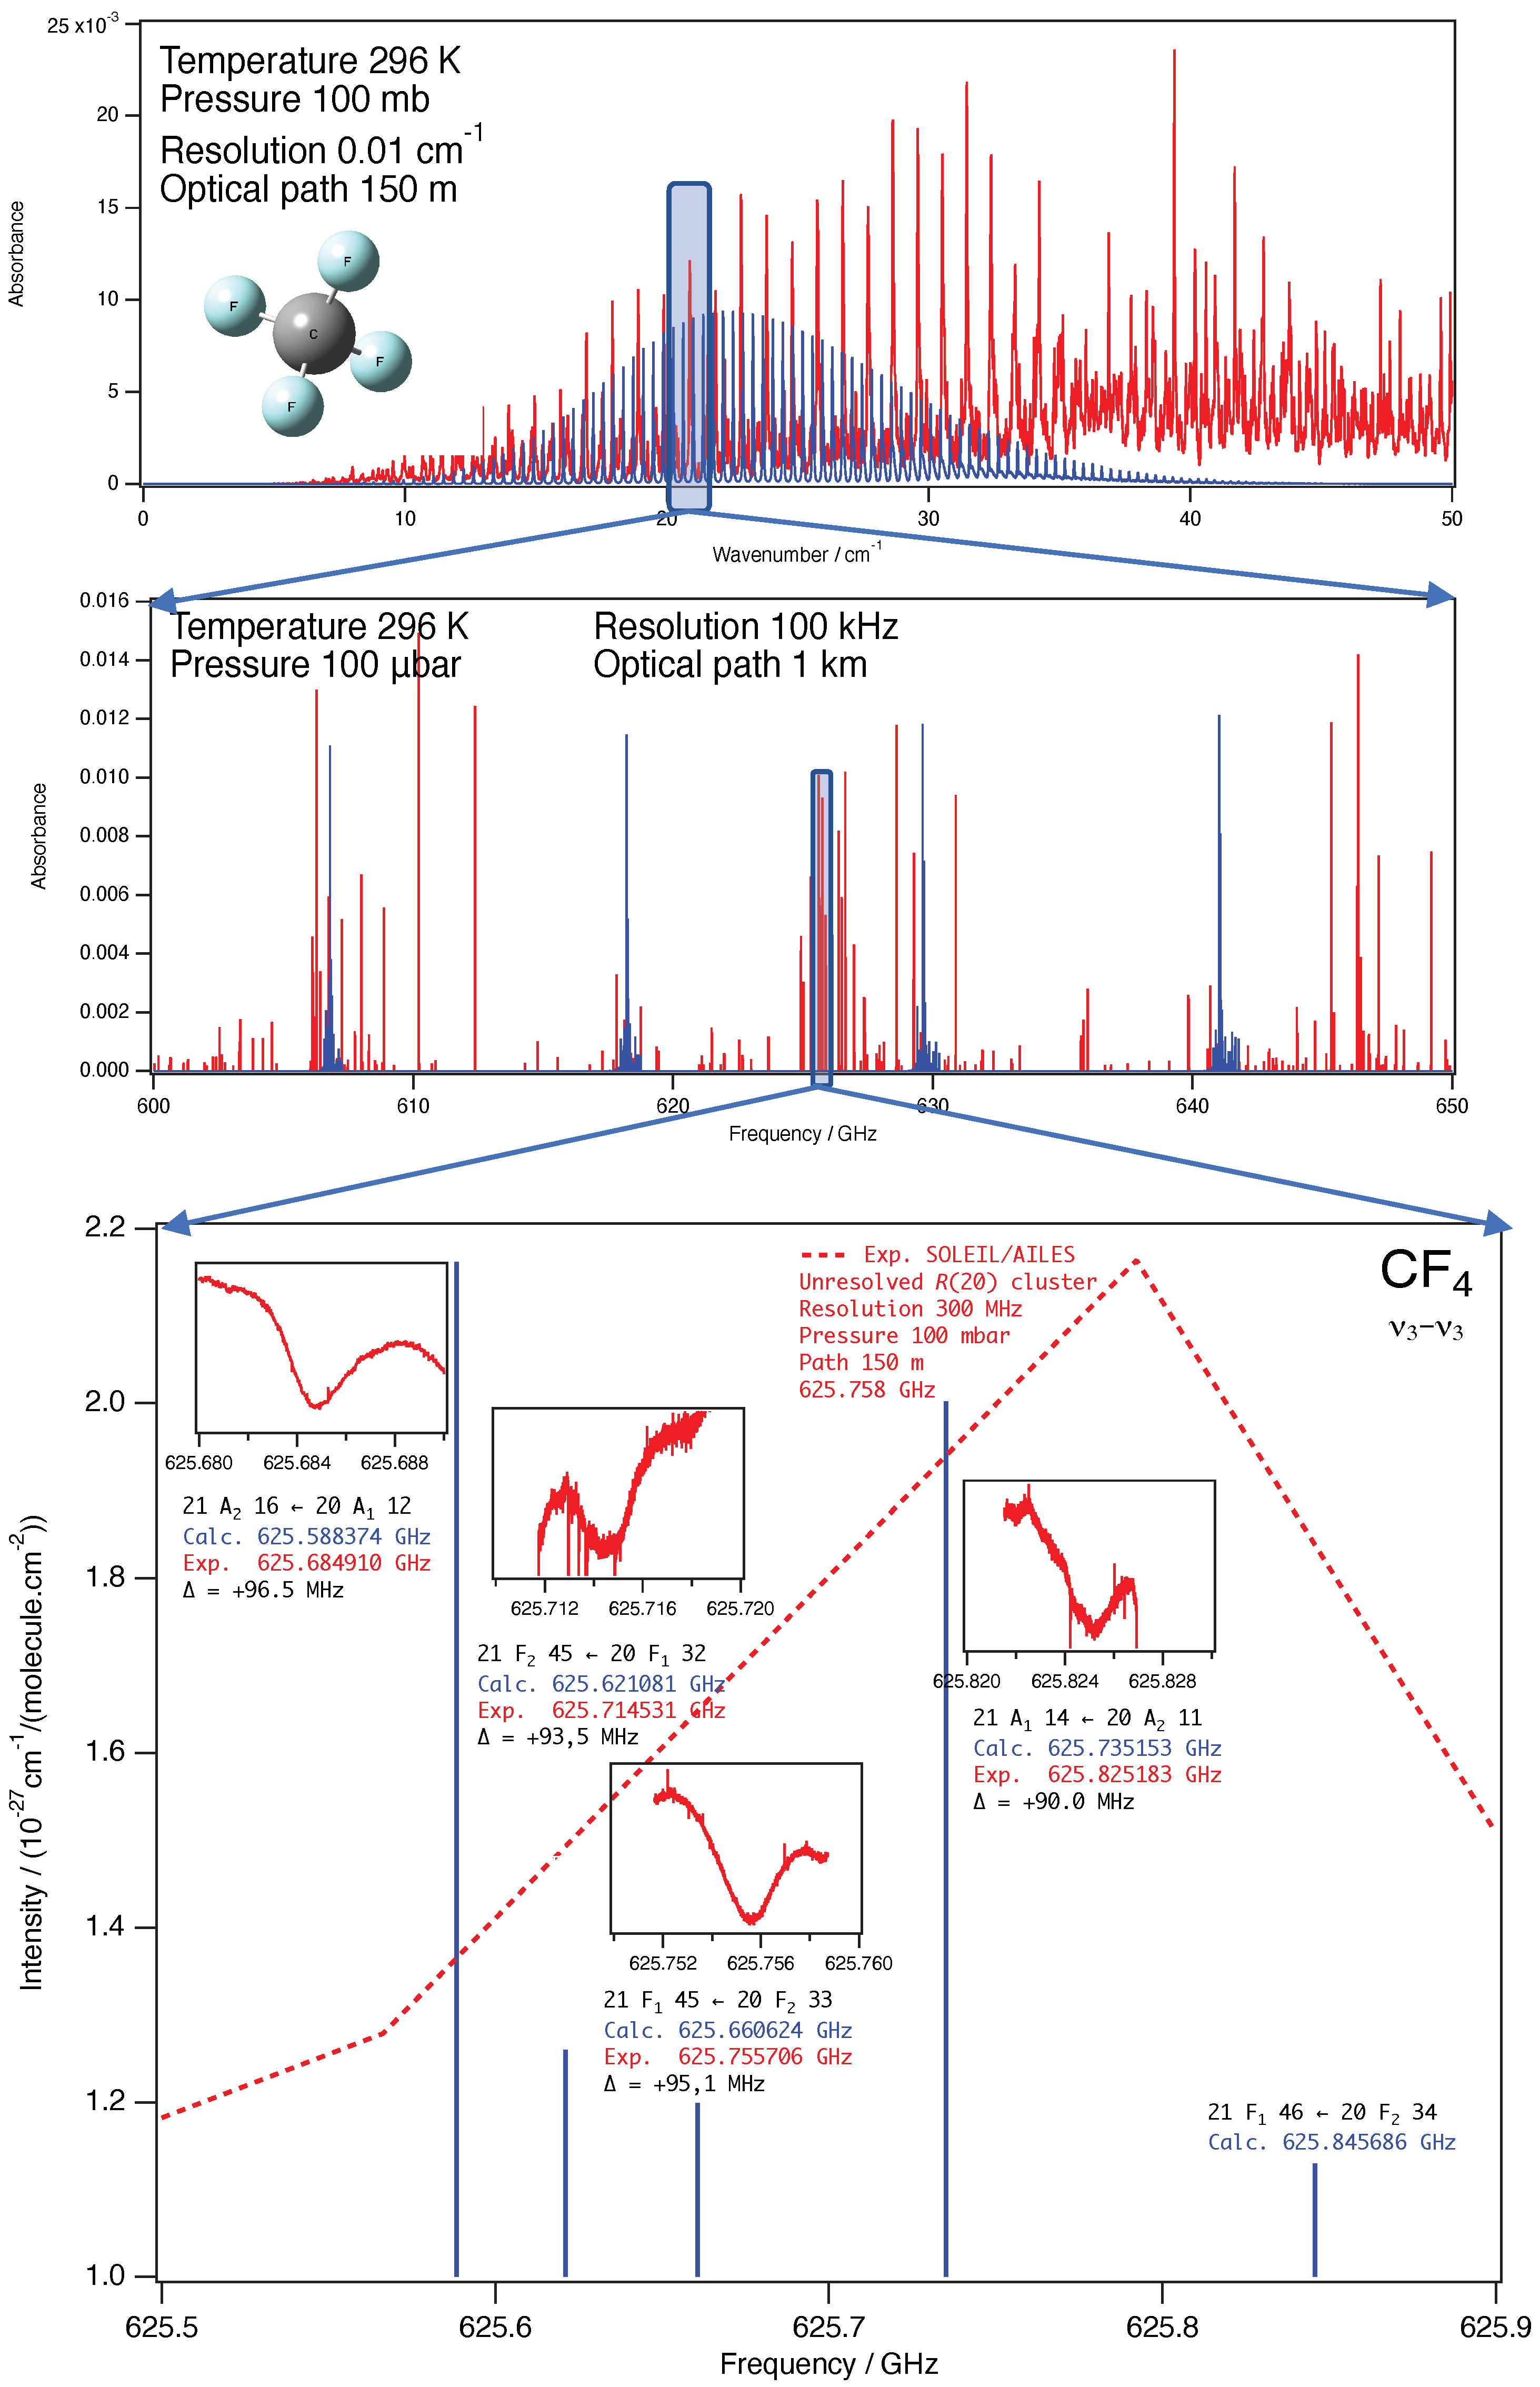
3.3. Intra-Cavity THz Measurements of CF
4. Conclusions
Author Contributions
Funding
Acknowledgments
Conflicts of Interest
Abbreviations
| ACE | Atmospheric Chemistry Experiment |
| AILES | Advanced Infrared beamLine Exploited for Spectroscopy |
| AMC | Amplified Multiplier Chains |
| CFCs/HCFCs | ChloroFluoroCarbons |
| CHARME | CHamber for the Atmospheric Reactivity and the Metrology of the Environment |
| cw-THz | continuous-wave Terahertz |
| FFT | Fast Fourier Transform |
| FP-TAS | Fabry-Perot Terahertz Absorption Spectroscopy |
| FSR | Free Spectral Range |
| FTS | Fourier Transform Spectrometer |
| GHG | Greenhouse gas |
| HITRAN | HIgh-resolution TRANsmission molecular absorption database |
| IASI | Infrared Atmospheric Sounding Interferometer |
| IR | InfraRed |
| LOD | Level of Detection |
| LTG-AsGa | Low-Temperature Grown—Arsenide Gallium |
| MLS | Microwave Limb Sounder |
| NEP | Noise Equivalent Power |
| SCISAT | SCIence Satellite |
| SNR | Signal to Noise Ratio |
| SOLEIL | Source Optimisée de Lumière d’Énergie Intermédiaire du LURE |
| STDS | Spherical-Top Data System |
| TALIS | THz Atmospheric Limb Sounder |
| TES | Tropospheric Emission Spectrometer |
| TFMeCaSDa | TetraFluoroMethane Calculated Spectroscopic Databases |
| THz-TDS | Terahertz-Time Domain Spectroscopy |
| LO | Local Oscillator |
| UV | Ultraviolet |
| ZBD | Zero Bias Detector |
References
- U.S. Environmental Protection Agency; Global Greenhouse Gas Emissions Data; U.S. Environmental Protection Agency. The Burning of Coal, Natural Gas, and Oil for Electricity and Heat is the Largest Single Source of Global Greenhouse Gas Emissions. In Global Greenhouse Gas Emission Data; U.S. Environmental Protection Agency: Washington, DC, USA, 2019. [Google Scholar]
- Ravishankara, A.R.; Solomon, S.; Turnipseed, A.A.; Warren, R.F. Atmospheric lifetimes of long-lived halogenated species. Science 1993, 259, 194–199. [Google Scholar] [CrossRef] [PubMed] [Green Version]
- Butler, J.; Montzka, S. The NOAA Annual Greenhouse Gas Index (AGGI); NOAA Global Monitoring Laboratory/Earth System Research Laboratories: Washington, DC, USA, 2016.
- Myhre, G.; Shindell, D.; Bréon, F.-M.; Collins, W.; Fuglestvedt, J.; Huang, J.; Koch, D.; Lamarque, J.-F.; Lee, D.; Mendoza, B.; et al. Anthropogenic and Natural Radiative Forcing. In Climate Change 2013: The Physical Science Basis. Contribution of Working Group I to the Fifth Assessment Report of the Intergovernmental Panel on Climate Change; Stocker, T.F., Qin, D., Plattner, G.-K., Tignor, M., Allen, S.K., Boschung, J., Nauels, A., Xia, Y., Bex, V., Midgley, P.M., Eds.; Cambridge University Press: Cambridge, UK; New York, NY, USA, 2013. [Google Scholar]
- Clerbaux, C.; Boynard, A.; Clarisse, L.; George, M.; Hadji-Lazaro, J.; Herbin, H.; Hurtmans, D.; Pommier, M.; Razavi, A.; Turquety, S.; et al. Monitoring of atmospheric composition using the thermal infrared IASI/MetOp sounder. Atmos. Chem. Phys. 2009, 9, 6041–6054. [Google Scholar] [CrossRef] [Green Version]
- Bernath, P.-F. The Atmospheric Chemistry Experiment (ACE). J. Quant. Spectrosc. Radiat. Transf. 2017, 186, 3–16. [Google Scholar]
- Beer, R. TES on the Aura Mission: Scientific Objectives, Measurements, and Analysis Overview. IEEE Trans. Geosci. Remote Sens. 2006, 44, 1102–1105. [Google Scholar] [CrossRef]
- Froidevaux, L.; Livesey, N.J.; Read, W.G.; Jiang, Y.B.; Jimenez, C.; Filipiak, M.J.; Schwartz, M.J.; Santee, M.L.; Pumphrey, H.C.; Jiang, J.H.; et al. Early validation analyses of atmospheric profiles from EOS MLS on the aura Satellite. IEEE Trans. Geosci. Remote Sens. 2006, 44, 1106–1121. [Google Scholar] [CrossRef]
- Wang, W.; Wang, Z.; Duan, Y. Performance evaluation of THz Atmospheric Limb Sounder (TALIS) of China. Atmos. Meas. Tech. 2020, 13, 13–38. [Google Scholar] [CrossRef] [Green Version]
- Ha, T.; Cuisset, A.; Payan, S.; Schwell, M.; Té, Y.; Tomasini, L.; Giraud-Héraud, Y. The first Vietnam School of Earth Observation: Atmospheric Remote Sensing and Molecular Spectroscopy. Vietnam J. Earth Sci. 2019, 41, 138–155. [Google Scholar] [CrossRef]
- Kim, G.-R.; Lee, H.-B.; Jeon, T.-I. Terahertz Time-Domain Spectroscopy of Low Concentration N2O using Long-Range multi-pass Gas Cell. IEEE Trans. THz Sci. Technol. 2020, 10, 524–530. [Google Scholar]
- Brubach, J.-B.; Manceron, L.; Rouzières, M.; Pirali, O.; Balcon, D.; Tchana, F.; Boudon, V.; Tudorie, M.; Huet, T.; Cuisset, A.; et al. Performance of the AILES THz-infrared beamline on SOLEIL for high resolution spectroscopy. AIP Conf. Proc. 2010, 1214, 81–84. [Google Scholar]
- Bray, C.; Cuisset, A.; Hindle, F.; Mouret, G.; Bocquet, R.; Boudon, V. Spectral lines of methane measured up to 2.6 THz at sub-MHz accuracy with a cw-THz photomixing spectrometer: Line positions of rotational transitions induced by centrifugal distortion. J. Quant. Spectrosc. Radiat. Transf. 2017, 203, 349–354. [Google Scholar] [CrossRef]
- Hindle, F.; Yang, C.; Mouret, G.; Cuisset, A.; Bocquet, R.; Lampin, J.-F.; Blary, K.; Peytavit, E.; Akalin, T.; Ducournau, G. Recent Developments of an Opto-Electronic THz Spectrometer for High-Resolution Spectroscopy. Sensors 2009, 9, 9039–9057. [Google Scholar] [CrossRef] [PubMed] [Green Version]
- Hindle, F.; Mouret, G.; Eliet, S.; Guinet, M.; Cuisset, A.; Bocquet, R.; Yasui, T.; Rovera, D. Widely tunable THz synthesizer. Appl. Phys. B 2011, 104, 763–769. [Google Scholar] [CrossRef]
- Mouret, G.; Guinet, M.; Cuisset, A.; Croize, L.; Eliet, S.; Bocquet, R.; Hindle, F. Versatile Sub-THz Spectrometer for Trace Gas Analysis. IEEE Sens. J. 2013, 13, 133–138. [Google Scholar] [CrossRef]
- Hindle, F.; Bocquet, R.; Pienkina, A.; Cuisset, A.; Mouret, G. Terahertz gas phase spectroscopy using a high-finesse Fabry–Pérot cavity. Optica 2019, 6, 1449–1454. [Google Scholar] [CrossRef] [Green Version]
- White, J.U. Long optical paths of large aperture. J. Opt. Soc. Am. 1942, 32, 285–288. [Google Scholar]
- Podobedov, V.-B.; Plusquellic, D.-F.; Fraser, G.-T. Investigation of the water-vapor continuum in the THz region using a multi-pass cell. J. Quant. Spectrosc. Radiat. Transf. 2005, 91, 287–295. [Google Scholar] [CrossRef]
- Winnewisser, M.; Winnewisser, B.-P.; Stein, M.; Birk, M.; Wagner, G.; Winnewisser, G.; Yamada, K.; Belov, S.-P.; Baskakov, O.-I. Rotational Spectra of cis-HCOOH, trans-HCOOH, and trans-H13COOH. J. Mol. Spectrosc. 2002, 216, 259–265. [Google Scholar] [CrossRef]
- Boudon, V.; Pirali, O.; Roy, P.; Brubach, J.-B.; Manceron, L.; Auwera, J.-V. The high- resolution far-infrared spectrum of methane at the SOLEIL synchrotron. J. Quant. Spectrosc. Radiat. Transf. 2010, 111, 1117–1129. [Google Scholar]
- Harmon, S.-A.; Cheville, R.-A. Part-per-million gas detection from long-baseline THz spectroscopy. Appl. Phys. Lett. 2004, 85, 2128–2130. [Google Scholar] [CrossRef] [Green Version]
- Gordon, I.-E.; Rothman, L.-S.; Hill, C.; Kochanov, R.V.; Tan, Y.; Bernath, P.F.; Birk, M.; Boudon, V.; Campargue, A.; Chance, K.V.; et al. The HITRAN2016 Molecular Spectroscopic Database. J. Quant. Spectrosc. Radiat. Transf. 2017, 203, 3–69. [Google Scholar] [CrossRef]
- Available online: https://hitran.iao.ru (accessed on 26 January 2021).
- Sanzharov, M.; Auwera, J.-V.; Pirali, O.; Roy, P.; Brubach, J.-B.; Manceron, L.; Gabard, T.; Boudon, V. Self and N2 collisional broadening of far-infrared methane lines measured at the SOLEIL synchrotron. J. Quant. Spectrosc. Radiat. Transf. 2012, 113, 1874–1886. [Google Scholar] [CrossRef]
- Amyay, B.; Gardez, A.; Georges, R.; Biennier, L.; Vander Auwera, J.; Richard, C.; Boudon, V. New investigation of the ν3 C–H stretching region of 12CH4 through the analysis of high temperature infrared emission spectra. J. Chem. Phys. 2018, 148, 134306. [Google Scholar] [CrossRef] [PubMed]
- Wenger, C.; Champion, J.P. Spherical top data system (STDS) software for the simulation of spherical top spectra. J. Quant. Spectrosc. Radiat. Transf. 1998, 59, 471–480. [Google Scholar]
- Wenger, C.; Boudon, V.; Rotger, M.; Sanzharov, J.P.; Champion, J.P. XTDS and SPVIEW: Graphical tools for the analysis and simulation. J. Mol. Spectrosc. 2008, 251, 102–113. [Google Scholar] [CrossRef]
- Rothbart, N.; Schmaltz, K.; Hübers, H.-W. A Compact Circular multi-pass Cell for Millimeter-Wave/Terahertz Gas Spectroscopy. IEEE Trans. THz Sci. Technol. 2019, 10, 9–14. [Google Scholar] [CrossRef]
- Chernin, S.-M. New generation of multi-pass systems in high resolution spectroscopy. Spectrochim. Acta Part A 1996, 52, 1009–1022. [Google Scholar] [CrossRef]
- Tchana, F.K.; Willaert, F.; Landsheere, X.; Flaud, J.-M.; Lago, L.; Chapuis, M.; Herbeaux, C.; Roy, P.; Manceron, L. A new, low temperature long-pass cell for mid-infrared to terahertz spectroscopy and synchrotron radiation use. Rev. Sci. Instrum. 2013, 84, 093101. [Google Scholar] [CrossRef]
- Meng, L.; Coeur, C.; Fayad, L.; Houzel, N.; Genevray, P.; Bouzidi, H.; Tomas, A.; Chen, W. Secondary organic aerosol formation from the gas-phase reaction of guaiacol (2-methoxyphenol) with NO3 radicals. J. Atmos. Environ. 2020, 240, 1117740. [Google Scholar] [CrossRef]
- Decker, J.; Fertein, E.; Bruckhuisen, J.; Houzel, N.; Kulinski, P.; Fang, B.; Zhao, W.; Bocquet, R.; Hindle, F.; Mouret, G.; et al. MULTICHARME: A Chernin type multi-pass cell designed for IR and THz spectroscopies experiments in CHARME. 2021; manuscript in progress. [Google Scholar]
- Deng, H.-B.; Li, F.-X.; Cai, Y.-H.; Xu, S.-Y. Waste anesthetic gas exposure and strategies for solution. J. Anesthes. 2018, 32, 269–282. [Google Scholar]
- Rey, M.; Chizhmakova, I.-S.; Nikitin, A.-V.; Tyuterev, V.-G. Understanding global infrared opacity and hot bands of greenhouse molecules with low vibrational modes from first-principles calculations: The case of CF4. Phys. Chem. Chem. Phys. 2018, 20, 21008–21033. [Google Scholar] [CrossRef]
- Boudon, V.; Carlos, M.; Richard, C.; Pirali, O. Pure rotation spectrum of CF4 in the v3 = 1 state using THz synchrotron radiation. J. Mol. Spectrosc. 2018, 348, 43–46. [Google Scholar] [CrossRef]
- Peytavit, E.; Latzel, P.; Pavanello, F.; Ducournau, G.; Lampin, J.-F. CW source based on photomixing with output power reaching 1.8 mW at 250 GHz. IEEE Electron Device Lett. 2013, 34, 1277–1279. [Google Scholar] [CrossRef]
- Richard, C.; Boudon, V.; Rotger, M. Calculated spectroscopic databases for the VAMDC portal: New molecules and improvements. J. Quant. Spectrosc. Radiat. Transf. 2020, 251, 107096. [Google Scholar] [CrossRef]
- Endo, Y.; Yoshida, K.; Saito, S.; Horota, E. The microwave spectrum of carbon dioxide—18O. J. Chem. Phys. 1980, 73, 3511–3512. [Google Scholar] [CrossRef]
- Odintsova, T.-A.; Tretyakov, M.-Y.; Zibarova, A.-O.; Pirali, O.; Roy, P.; Campargue, A. Far-infrared self-continuum absorption of and (15–50 cm−1). J. Quant. Spectrosc. Radiat. Transf. 2019, 227, 190–200. [Google Scholar]
Publisher’s Note: MDPI stays neutral with regard to jurisdictional claims in published maps and institutional affiliations. |
© 2021 by the authors. Licensee MDPI, Basel, Switzerland. This article is an open access article distributed under the terms and conditions of the Creative Commons Attribution (CC BY) license (http://creativecommons.org/licenses/by/4.0/).
Share and Cite
Cuisset, A.; Hindle, F.; Mouret, G.; Bocquet, R.; Bruckhuisen, J.; Decker, J.; Pienkina, A.; Bray, C.; Fertein, É.; Boudon, V. Terahertz Rotational Spectroscopy of Greenhouse Gases Using Long Interaction Path-Lengths. Appl. Sci. 2021, 11, 1229. https://doi.org/10.3390/app11031229
Cuisset A, Hindle F, Mouret G, Bocquet R, Bruckhuisen J, Decker J, Pienkina A, Bray C, Fertein É, Boudon V. Terahertz Rotational Spectroscopy of Greenhouse Gases Using Long Interaction Path-Lengths. Applied Sciences. 2021; 11(3):1229. https://doi.org/10.3390/app11031229
Chicago/Turabian StyleCuisset, Arnaud, Francis Hindle, Gaël Mouret, Robin Bocquet, Jonas Bruckhuisen, Jean Decker, Anastasiia Pienkina, Cédric Bray, Éric Fertein, and Vincent Boudon. 2021. "Terahertz Rotational Spectroscopy of Greenhouse Gases Using Long Interaction Path-Lengths" Applied Sciences 11, no. 3: 1229. https://doi.org/10.3390/app11031229