
Investigation of a Gravel-Bed River’s Pattern Changes: Insights from Satellite Images


Department of Engineering, University of Palermo, Viale delle Scienze, 90128 Palermo, Italy
Appl. Sci. 2021, 11(5), 2103; https://doi.org/10.3390/app11052103
Submission received: 26 January 2021
/
Revised: 23 February 2021
/
Accepted: 23 February 2021
/
Published: 27 February 2021
(This article belongs to the Special Issue Fluvial Hydrodynamics: Hydrodynamic and Sediment Transport)
Abstract
:Changes in river pattern have been documented in the literature. The recognition of islands and vegetated patches, which is indicative of the evolution processes, requires simultaneous information at different points and at different times and field studies are still difficult and scarce. The present work, focusing the attention on a gravel-bed river, explores the possibility to conduct a first-step pattern changes analysis by identifying the evolution of the morphological features and taking information of islands and vegetated patches from satellite images easily available from Google Earth. The study is conducted by combining the information taken from both the satellite images and the field photos and the hydrological data. Here analysis concerns a reach of the Tagliamento River, in Italy, in a decadal timescale characterized by evident stream pattern changes. Results confirm that a combination of different factors determine favorable conditions for the river’s evolution, but the frequency of occurrence of high-magnitude events is the most important factor to consider in a first-step analysis. This is because the frequency of occurrence of high-magnitude events affects, in turn, some of the other influencing factors. In particular, the present study highlights that different morphological features form in time periods characterized by different frequency of occurrence of high-magnitude events. On one hand, this could be related to the fact that high-magnitude events could influence the sediment transport and deposition mechanisms, modifying the ratio coarse-to-fine sediments and the grain-to-grain interactions, with consequences in the sediment flux variation and in the migration of the morphological features. On the other hand, the frequency of occurrence of high-magnitude events could affect the vegetation distribution and growth, contributing to determine a variation of the typology of the vegetation characteristics depending on the tolerances of the vegetation species. A sort of interface between the vegetated-dominated area, where the flow resistance is significant, and the flood-disturbance-dominated area, where the action by flow is significant, is determined with a progressive reduction of the number of active channels and development of the meandering bend.
1. Introduction
As it is well known, alluvial rivers develop different planform morphologies that extend between braided and meandering [1,2,3]. While a braided stream is formed by multiple threads channels with emerged bars separating the threads from each other, a meandering stream consists of one-thread channel. Especially braided rivers are characterized by a high dynamism [4,5,6,7], with rapid and frequent changes in bed topography, plan-form shape and vegetated patches.
The identification of river’s islands and vegetated patches evolution is important for the evolution of the stream pattern changes and the habitat dynamism [8].
Stream pattern changes have been documented in the literature both in sand-bed rivers [3,9,10,11,12] and in gravel-bed rivers [3,13,14,15]. In this work attention is restricted to gravel-bed rivers with the aim of contributing to clarify conditions that support meandering pattern.
Hooke and Redmond [13], by conducting field investigations in the gravel-bed Bullin River in England, suggested that the stream pattern changes could be due either to river’s intrinsic threshold conditions (termed as autogenic factors) or to anthropogenic actions or to combined effects related to temperature, runoff regime and vegetation pattern (termed as allogenic factors). Métivier and Barrier [3] analyzed a large amount of literature data of meandering and braided gravel-bed rivers and established that the stream pattern changes may be induced either by a change in the aspect ratio or by a change in sediment supply transported as bed-load. Other researchers [16,17,18] exalted the role of vegetation on river’s dynamics: on one hand vegetation controls sediment dynamics (as an example vegetation traps, reinforces and aggrades landforms) driving the geomorphic variations within the river’s active reaches, on the other hand it increases the stability of deposited sediments because of its roots system. Thus, vegetation is not a passive factor in the fluvial processes but an active one and could exert an important role in the stream pattern changes [6,19,20]. Field studies [21,22,23], flume experiments [24,25,26] and aerial images analyses [27,28] have been carried out to explore the mutual feedbacks vegetation/morphodynamics and how the hydrological processes could influence them. Flooding events on one hand could induce the vegetation’s mechanical damage [29,30,31] and on the other hand could facilitate the transport of seeds and sediments and their deposition [32]. In this context, while some researchers, among others [33], suggested that high-magnitude events exert the major role on the vegetation erosion, others [34] highlighted also the important role of low-magnitude events in determining significant vegetation erosion, especially in high energy systems. Furthermore, all studies indicate that the growth of vegetation and the extension of the vegetated areas can vary greatly in time depending on the tolerance of the species to frequent floods [32,35,36,37].
Although several works have been conducted to investigate the river’s dynamism, field studies are still scarce and further real cases documenting the aforementioned processes are needed [38,39]. The difficulty is related to the fact that detailed and simultaneous information at different points and at different times are required.
To overcome such a difficulty, in recent years remote sensing approaches have been also applied and radar technologies and advanced aquatic-terrestrial LIDAR (Light Detection and Ranging) techniques have been used both for measuring high resolution topographic data in a relatively short time [40] and for mapping the morphology of clear-water streams in fluvial environments [41,42]. The application of these technologies presents still today many difficulties and uncertainty because of the reflection in the air-water interface, especially when the water is too shallow (i.e., less than about 20 cm deep) so that a combination of hardware and software is generally applied to detect more accurate information. Thus, this approach requires not only long time and expensive monitoring activities but also hard and long computing time [40,41].
The present study aims to give a contribution in investigating stream pattern changes and explores the possibility to analyze them by identifying the evolving morphological features by detecting information from satellite images easily available from Google Earth. This methodology could be used for a first-step analysis driving a successive, more accurate and specific field monitoring. Here attention is focused on a reach of the Tagliamento River (Italy) which has been also object of previous literature studies [32,33,34,35,43]. The general objective is achieved by two tasks: the first task consists in identifying the variation in time both of the stream pattern and of the vegetated patches and of the frequency of occurrence of flood events; the second task consists in analyzing their interconnections identifying the evolving river’s morphological features. In the following Section 2, the data and the methods used are explained; the results are analyzed in Section 3, discussion is presented in Section 4 and finally conclusions are reported in Section 5.
2. Materials and Methods
2.1. Images and Data Detected
The Tagliamento River, intensively studied and illustrated in the literature [8,19,34,44], flows in northeastern Italy. It is only moderately impacted by anthropogenic intervention, and thus it is considered as the last morphologically intact river in the Alps and represents a model ecosystem for large European rivers [8]. The river bed is composed mainly of gravel-pebbles (with D50 > 50 mm), but large areas with gravel covered by sand and finer sediment can be also found [45]. In the present work, attention is devoted to the reach characterized by a braided dominant morphology, about 2700 m long, located between the Corino village and the Flagogna village (see Figure 1).
The considered river reach was also the object of previous literature studies [32,34,43]. Bertoldi et al. [32] investigated, in a 1-km-long reach, the morphological changes induced by different flow and flood pulses. Surian et al. [34] considered a 14 km long reach and explored, over long timescale, the existence of a threshold discharge above which erosion of vegetated patches occur. Gurnell et al. [43] analyzed, over short timescale (i.e., from single floods to decades), the river’s islands and vegetated patches development processes in a reach few kilometers long, based on the conceptual model proposed by Gurnell et al. [19]. In the present work, the attention is focused on the stream pattern changes and the evolving morphological features in a decadal time scale. Satellite images available from Google Earth in a time period 13 years long (from June 2002 to December 2015), as shown in Figure 2, have been considered for the analysis. Field photos (by courtesy by A. Sukodolov and T. Sukhodolova- IGB Berlin, Germany) have been also used to check the river’s pattern and vegetation characteristics especially during periods of times when no satellite images were available.
By inspecting the sequences of images reported in Figure 2 it can be observed that: (i) passing from June 2002 to July 2002 (i.e., after one month) no evident variations of the braided stream pattern occur; (ii) from June 2002 to June 2003 (i.e., after one year) very little changes of the stream pattern can be observed; (iii) from July 2003 to September 2003 some flowing channels at the upstream end of the study reach become dry but not substantial stream pattern changes can be observed; (iv) from September 2003 to June 2005 (i.e., after almost two years) no significant stream pattern variations occur; (v) passing from June 2005 to May 2011 (i.e., after almost six years) an evident stream pattern change can be observed with the formation of a bend of high curvature; (vi) from May 2011 to February 2012 the stream pattern maintains almost the same; (vii) from February 2012 to December 2015 the stream pattern presents only slightly modifications. Thus, from Figure 2 it appears clear that, for the considered study reach, the changes in stream pattern can be especially observed in June 2003, in June 2005 and in February 2012. For this reason, in the present work attention has been restricted to the time period 2003–2012 and, for simplicity of exposure, in the following often only the aforementioned three images are considered.
Based on the aforementioned considerations, the images have been grouped into two classes: class I which includes the images (from June 2002 to June 2005) detected with time intervals equal or less than three years; class II which includes the images detected with time intervals greater than two years (from June 2005 to December 2015).
2.2. Hydrological Data
As described in the literature [8,46] the Tagliamento River is influenced by Alpine snows and precipitation regime with high peaks especially in spring and in autumn. In the present study the Villuzza gauging station, located at Pinzano gorge, that is around 2 km downstream of the examined river reach and with continuous records in the examined time period, has been considered. Only the recorded water depths are available. In fact, the definition of a stage discharge relationship in the Tagliamento river is rather difficult because of the absence of stable cross-sections. At Pioverno gauging station (basin area 1880 Kmq), in the period 1932–1973, the maximum and the mean discharge were estimated respectively of 81 m3s−1 and of 4050 m3s−1 [34]. Maione and Machne [46] estimated a 10-year flood of 2150 m3s−1.
Based on the aforementioned, the water depths registered the Villuzza gauging station in the time period between January 2002 and September 2012 have been considered for the analysis. From Figure 3a it is clear that frequent peaks ranging from 100 cm to 200 cm and sporadic peaks over 200 cm occur. This trend has suggested to assume for the analysis a low threshold value of the water depths equal to 100 cm. This is in line with previous Bertoldi et al.’ [32] findings highlighting that the water level starts to attack bar surfaces at a stage of around 130 cm and a complete gravel islands inundation occurs at around 200 cm. Figure 3b reports the estimated values of the frequency of occurrence of water depths in the range 100 cm < h < 200 cm and of the frequency of occurrence of water depths higher than 200 cm during the examined time period. For both cases it is clear that during the year 2002 the frequency of occurrence is around of 20%, in the time period 2003–2007, the frequency of occurrence is very low; it suddenly increases in the year 2008 maintaining high values in the time period 2009–2012.
Thus, it could be summarized that, while the time period 2003–2007 is characterized by relatively frequent low-magnitude events with sporadic peaks (as an example the events occurring in August 2003, in November 2003 and in October 2004, as Figure 3a shows), the time period 2008–2012 is characterized by frequent high-magnitude events.
2.3. Methods
The extraction of information from each image was operated by the help of CAD and QGIS software. According to Gurnell [47], in order to minimize the errors in extracting information from the images representing different dates, some control points (such as corner of bridges or of buildings, specific rocks. etc.) clearly distinguishable inside the study area were identified and the images were extracted at the same scale. This was operated also with the help of the AirphotoSE free code for the images’ rectification. The existence of some control points enhances significantly Google Earth positional accuracy [48]. Furthermore, it should be considered that the examined area is around 1 Km2 and for areas smaller than about 2 km2, the distortion of the images determines an error usually of the order of a meter or two [48]. This error is not too far from the error obtained by using other image-based techniques [34,40].
The procedure to take information was divided into three steps. In the first step, for each image the external boundary of the “active” area of the examined river reach was determined and digitized; thus, the boundary of the largest active area was obtained as the external intersection of the digitized active areas obtained at each time. The second step concerned the extraction of information regarding the active channels and the vegetation patches. To this aim, the study reach was divided into subareas by transients spaced of almost equal longitudinal length. Within each subarea both the flowing channels (i.e., the channels with water present at the image date) and the nonflowing channels (i.e., the channels without water at the image date) and the gravel/sediments islands were identified. Then, according to Gurnell et al. [6,44], the vegetated areas were determined by aggregating them into islands whose digitized boundaries were identified either by water or by gravel sediments. In the third step, by considering the obtained gravel/sediments islands, the morphological features were identified and their evolution in time was examined. The vegetated islands were classified according to the patch and to the height (hv) of the plants, by using the information obtained both from the available images and from the available field photos and from literature [8,21,34,47]. In particular, previous literature works indicated the presence of Populus Nigra as the dominant riparian tree species which strongly resist to uprooting [21,34] and of abundant willow species (such as alix eleagnos, S. alba, S. purpurea–see [49]). Both single bushes and large extent of vegetated islands of trees and piles of woody debris were found by analyzing the field photos.
3. Analysis and Results
3.1. Evolution of the Active Area and of the Vegetation Islands
By considering the subareas, identified as described in Section 2.3, the study reach was divided into polygons of almost equal length, as shown in Figure 4. In particular, eight polygons divided by nine transients (T1–T9), spaced of 330 m in average, were identified.
From Figure 4 it can be observed that, during the examined time period, the variations of the external boundaries of the examined channel reach are remarkably little. This means that, despite the high dynamism observed from Figure 2, the active area remains almost constant in time. This is in accordance with previous findings obtained by Zanoni et al. [6] which analyzed the dynamics of a reach of the Tagliamento river 16 km long, which includes the reach considered in the present work, in a time period between years 1944 and 2005.
By combining information taken from the available images, from the available field photos and from the literature [8,34], the vegetated islands were classified into three classes: (i) class A, which includes trees with height 2 m ≤ hv ≤ 20 m; (ii) class B, which includes bushes (herbaceous and low shrubs) with height 80 cm ≤ hv ≤ 2 m and mutual distance less than 5 m; (iii) class C, which includes bushes with mutual distance greater than 5 m (sparse vegetation). Such a classification is also in line with that adopted by Surian et al. [34] distinguishing tall trees with height >10 m from high shrubs and trees with medium height variable in the range 1.5 m–10 m and from herbaceous and low trees with height < 1.5 m. Figure 5 reports, for each polygon, the extension area of each class of the vegetated islands. For simplicity of exposure, in this figure only the images taken in June 2003, in June 2005 and in February 2012 have been considered. Furthermore, by excluding the islands with sparse vegetation, Table 1 reports, for each polygon, the percent area occupied by classes A (trees) and B (dense bushes) with respect to the total active area.
As Table 1 shows, in June 2003 the percent area occupied by the vegetation class A tends to decrease slightly as one passes from polygon 1 to polygon 4 and then it increases until reaching polygon 8 where it assumes a value of 2%; the percent area occupied by the vegetation class B is almost equal (around 4%) in all the polygons with the exception in polygons 1 and 6; in June 2005, the percent area occupied by the vegetation class A is almost the same as that observed in June 2003 and the percent area occupied by vegetation class B generally increases, with exception of polygons 4, 6 and 8 where it slightly decreases; in February 2012, the percent area occupied by the vegetation class A slightly increases with exception of the polygons 5 and 6 where it decreases; the percent area occupied by vegetation class B strongly increases, assuming values ranging from 8% (in the polygon 6) to 46 % (in the polygon 1).
Thus, it can be summarized that, in the time period 2003–2005 (that is characterized by low-magnitude events with some sporadic high peaks), the extension of vegetation islands of class A (trees) slightly increases over the time; the extension of vegetation islands of class B (dense bushes) also increases passing the time with exception of polygons 5 and 6 where an opposite trend has been observed. This behavior is consistent with the fact that, as observed by Corenblit et al. [21], the dominant tree species resist to the sporadic flow peaks. This behavior indicates that these vegetated species could have a crucial role on the stabilization or transport of sediments.
During the time period 2005–2012 (i.e., period with frequent high-magnitude events), the extension of vegetation islands of class A tends to increase slightly in all the polygons (polygons 1, 2, 3, 6, 7, 8) with exception of the central ones (polygons 4, 5) where it decreases. This could be related to the deposition of fine sediments in some polygons (polygons 1, 2, 3, 6, 7, 8) contributing to the vegetation growing and to the soil reinforcement by roots. In this case a vegetation-dominated area forms. In the central polygons (4, 5) the vegetation is eliminated by the frequent high-magnitude events occurring especially during years 2008, 2009 and 2010. This central area is dominated by flooding disturbances.
Thus, the aforementioned behavior confirms that frequent flooding events remove vegetation before colonization can take place while during periods with infrequent flooding events vegetation grows [37].
Figure 6 reports the total area occupied by vegetation of classes A and B along the considered river reach in June 2003, in June 2005 and in February 2012. It can be seen that passing from year 2003 to year 2005 the total area occupied by both classes of vegetation does not change a lot; passing from year 2005 to year 2012 the total area occupied by vegetation strongly increases, especially for the vegetation class B. It should be considered that the increasing trend occurring in Figure 6 between years 2005 and 2012 has been also verified by examining the available field photos.
On one hand, the observed behavior suggests that the high frequency of high-magnitude events contributes to the variation of the typology of the vegetation characteristics; on the other hand, it confirms that the flood events could contribute to the formation of islands where vegetation seeds germinate. As an example, from the available photos it is clear (in the year 2008) the accumulation of woody debris and of uprooted vegetation around bushes or trees which could be transported during the previous high-magnitude events. During the period characterized by low frequency of flood events, the resistance of vegetated patches contributes to stabilize the sediment and plants germination; the ability of these plants to resist to uprooting allows them to survive and colonize alluvial environments.
Figure 7 shows the vegetation cover (for classes A and B) and the active channels identified from the images taken in June 2003, in June 2005 and in February 2012. From this figure, it can be clearly seen the difference both in the vegetation cover and in the stream pattern passing from June 2003 to February 2012. In particular, it can be observed that the extension of the vegetation cover always increases on the right side of the study reach and the sediment deposition especially on the left side. The vegetation cover determines a sort of interface between the vegetated-dominated area, where the flow resistance is more significant, and the floods-disturbances-dominated area, where the action due to flow is more significant. According to previous literature findings [50,51,52], this behavior can induce the progressive abandonment of secondary channels so that the stream has the tendency to evolve towards a single thread channel.
3.2. Morphological Features and Their Dynamics
In order to examine the morphological features along the examined river reach at different times, for each image the axis both of the flowing and nonflowing channels were traced identifying the islands surrounded by these tracers.
As an example, Figure 8 reports the tracers and the islands identified in June 2003 and in June 2005 (i.e., two images of class I) and in May 2011 and in February 2012 (i.e., two images of class II).
By inspecting the images of class I, a sequence of island features, schematized as bars, has been identified. These features migrate downstream. As an example, by considering the reference point R1 of Figure 8, it can be observed that in June 2003 it is located inside polygon 5 at a distance of around 150 m from the transient T6, but in June 2005 it is found at a distance of around 100 m downstream of transient T7. This means that the point R1 moves downstream of around 580 m over two years. On the left side of the examined reach, a low curvature bend (in red in Figure 8) seems to appear over-imposed to the aforementioned features. In June 2005 the curvature of this bend is more accentuated than that in June 2003 and it tends to migrate downstream and gradually to expand laterally. As literature indicates [53,54,55], this behavior is typical at the early evolution stages of a meander.
Thus, it can be summarized that in the time period between June 2003 and June 2005, which is characterized by frequent low-magnitude events with sporadic high peaks, the active part of the study reach is mainly concentrated on the left side where a sequence of migrating bars and a bend of low curvature form. At this stage, the bars represent the dominant morphological feature.
By inspecting the images of class II, a stream pattern very different from that observed between June 2003 and June 2005 can be seen. In particular, in May 2011 a meander bend of high curvature is clearly visible. This suggests that passing from June 2005 to May 2011 a significant lateral migration of the bend occurred. Then, passing from May 2011 to February 2012 such a high-curvature bend furtherly expands laterally with no evident downstream migration. As an example, the reference point R2 is found along the transient T4 both in May 2011 and in February 2012. Thus, in such a time period, the meandering bend becomes the dominant morphological feature. According to the literature [53,54,55] for a high-amplitude meander wave the lateral expansion prevails over the downstream migration.
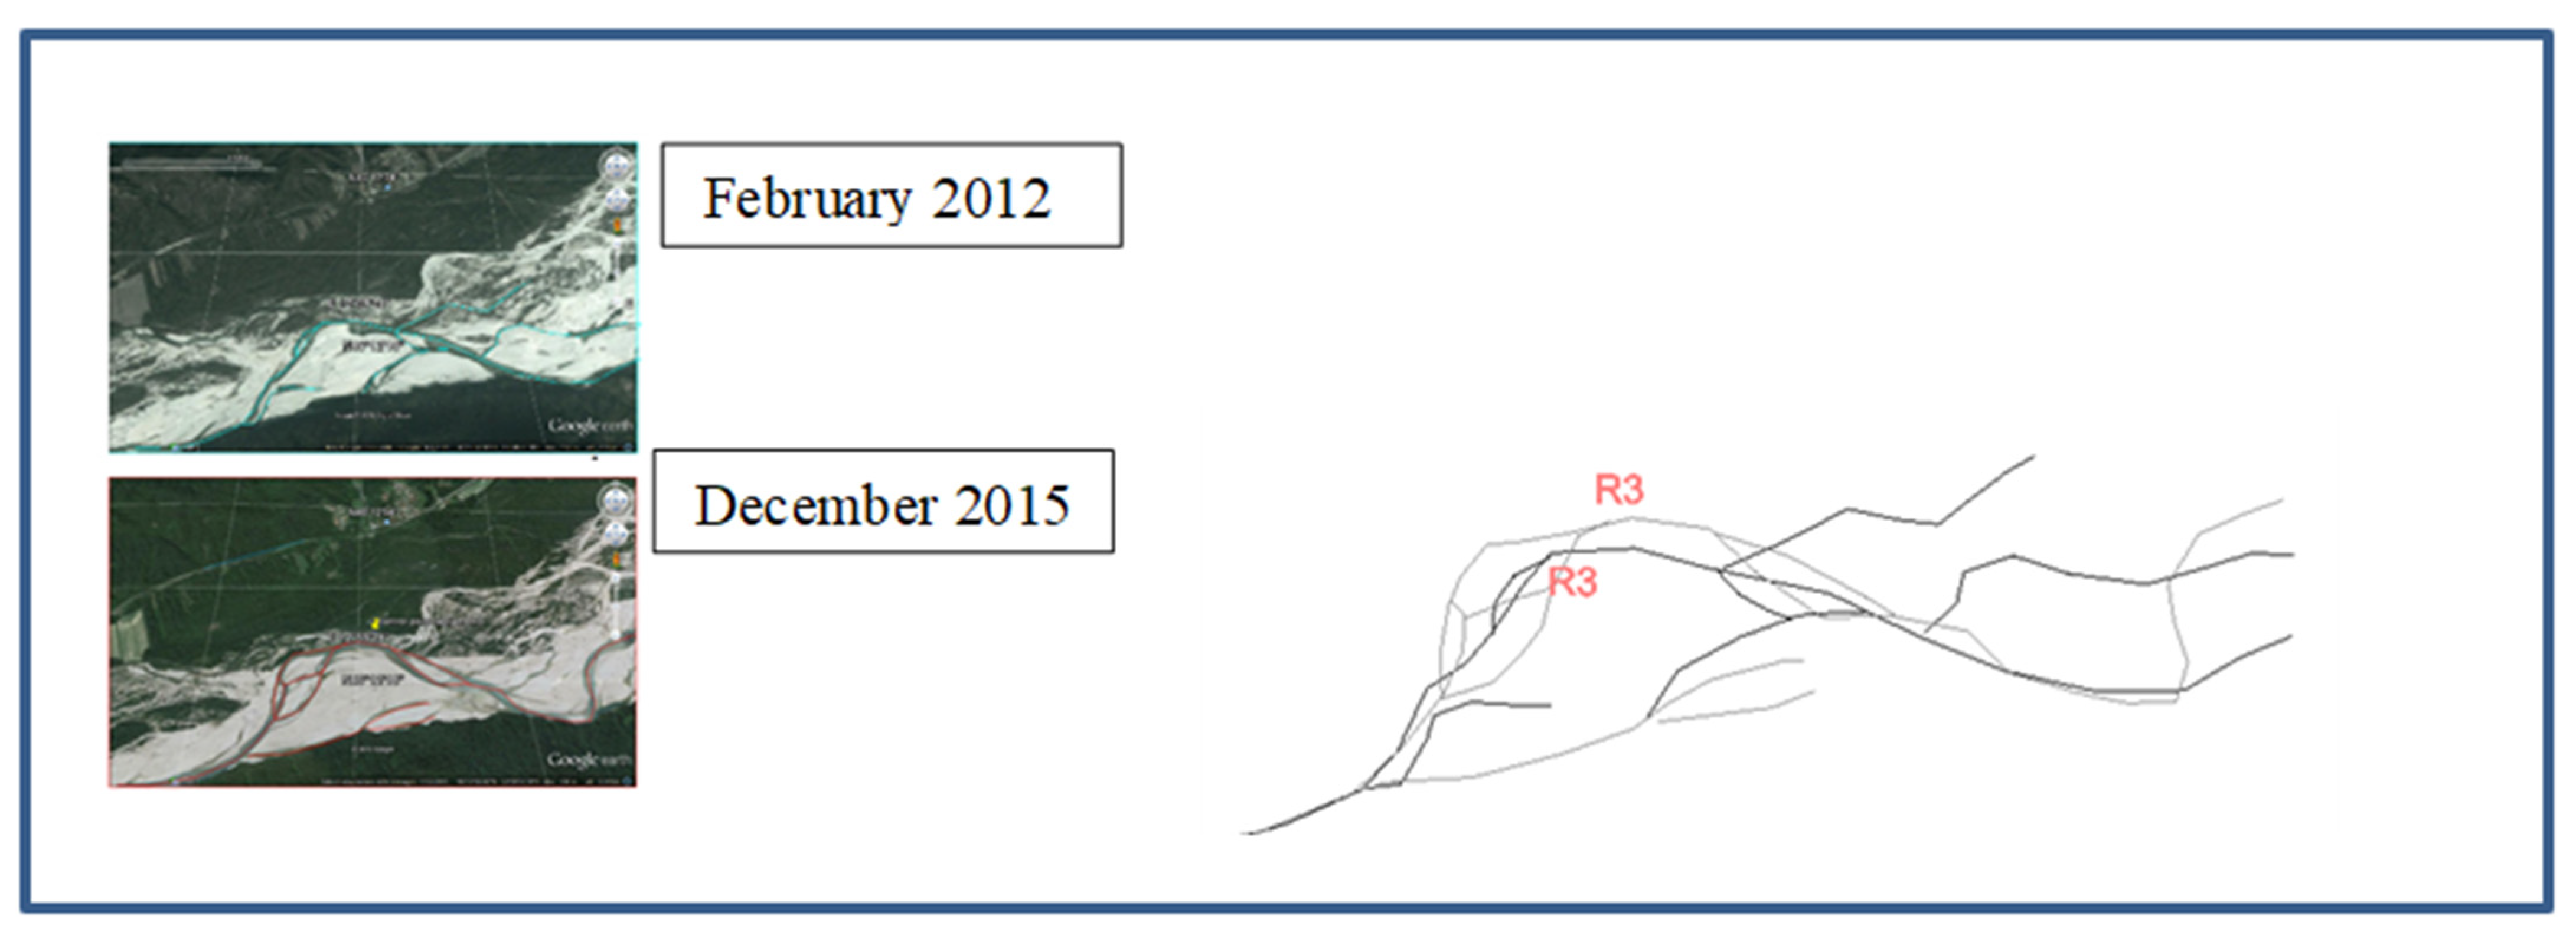
The aforementioned behavior is also confirmed by Figure 9 where the tracers identified in February 2012 are compared with those obtained in December 2015. This comparison shows that the main channel further tends to expand outwards until in December 2015 the bend is also slightly skewed with the formation of chute channels: the reference point R3 moves both outwards and upstream.
Thus, it can be summarized that while in the time period between June 2003 and June 2005, characterized by frequent low-magnitude events, multiple bars form and the downstream migration is the prevailing movement, in the time period between June 2005 and February 2012, which is characterized by frequent high-magnitude events, the channel tends to assume a single tread pattern with prevalent lateral expansion.
4. Discussion
The present analysis has highlighted that different evolution patterns occur between the time period characterized by frequent low-magnitude events with sporadic peaks (i.e., the time period 2003–2005) and the time period characterized by frequent high-magnitude events (i.e., the time period 2005–2012). In particular, for the examined river reach, in the first case (time period 2003–2005) active multiple threads flowing channels form on the left side, the vegetation cover extends on the right side and the transported sediments are deposited in the central part; in the second case (i.e., during the time period 2005–2012) sediment and woody debris are transported and then deposited after the events facilitating the germination of seeds and the formation of vegetation islands. This is consistent with previous literature works, see as an example [8]. Such a behavior tends to suppress the secondary channels and the main channel tends to assume a single tread pattern.
Thus, the different frequency of occurrence of the high-magnitude events could affect differently the sediment dynamics and the distribution and growth of vegetation, determining a different river’s morphological behavior. This result is in line with previous findings indicating either that the channel pattern changes especially depend on the channel’s sensitivity to flow discharge variations [56] or that the frequency of occurrence of high-magnitude events could strongly affect the degradation processes of the vegetation especially during its germination phase [18]. Thus, the results obtained in this work have demonstrated that, although according to literature [34,43] the hydrological processes are not the only cause of the river’s morphodynamic evolution, they exert a significant role in river’s dynamics. This is because the frequency of occurrence of high-magnitude events affects, in turn, other factors such as the vegetation distribution and growth and the transport and the deposition of sediments.
For the considered case, the fact that the extension of vegetation islands increases always on the right side determines a vegetation-dominated area where the flow resistance assumes high values. This means that in such vegetation-dominated area the sediment fluxes are very low and the sediments are stabilized by the vegetation root systems. On the contrary, the left side is dominated by floods disturbance and is characterized almost by the absence of vegetation, high sediment fluxes and the presence of migrating morphological features (bars). Thus, in accordance with previous works [37,43], the vegetation cover determines a sort of interface between the vegetated-dominated area, where the flow resistance is significant, and the flood-disturbance-dominated area, where the action by flow is significant. During the time period characterized by frequent high-magnitude events, parts of vegetation are cut by floods; after the floods, the transported sediments and the woody debris are deposited on the bed, facilitating the germination of vegetation on one side of the study reach, forcing the suppression of the secondary channels and the consequent formation of a single tread channel pattern and, then, of a high-amplitude bend. This morphological feature is characterized by a lateral expansion which prevails over the downstream migration. The different morphological behavior observed during the time periods characterized by different frequency of high-magnitude events could be also related to the different sediment transport mechanism induced by the events. In fact, during floods both coarse material and fine fractions (sand) could be transported and the interactions between the coarse and the fine fractions could affect the bed-load transport and the associated migrating behavior. According to previous literature works [57,58,59,60], the coarse particles slow or stop each other, but the presence of finer particles trapped in their interstices determines that their mobility becomes higher. Braudrick et al. [61], as an example, indicated that the fine sediments represent a critical element to maintain the rapid bar growth rate and sediment transport controlling the braided rivers. They also suggested that, by limiting the bank erosion rate, the meandering morphology tends to be maintained.
It should be also considered that the transfer of sediments from one zone to another varies with both the size of materials and with the discharge. Furthermore, the coarsest materials move less frequently and shorter distances than the finer ones. This is in accordance with Gurnell et al. [43] which observed that vegetated islands show predominantly sandy surface sediments containing silt, clay and organic material, whereas sparsely-vegetated surfaces of youngest islands show coarser gravel-sand mixtures. After moderate flows the deposition of sediment determines a clear fining of vegetated areas and the presence of shrubs increases the trapping of fine sediments.
Results have shown that during the period 2003–2005 (period characterized by low-frequent high-magnitude events) the vegetation cover does not increase a lot. As a consequence, the banks of the active channels are more erodible leading to the channels’ widening and the formation of islands in the central part of the river reach. Passing the time, the vegetation species more resistant dominate and the developed islands aggrade and extend laterally. The increasing presence of vegetation on the right side of the river reach, during the successive time period, on one hand increases the hydraulic resistance and on the other hand increases soil strength due to the vegetation roots system. The increase of soil stabilization due to the roots system, in turn, makes the banks resistant to the erosion during the period with frequent high-magnitude events, reducing the number of active channels on the floodplain, maintaining an almost constant width and facilitating the formation of the meandering bend. According with Gurnell et al. [39], the growing of vegetation in time leads to sediment trapping and transforms the gravel bars to new floodplain surface. The progressive prevailing of lateral migration and the evolution of the bend determines an increase of the curvature and, consequently, of the bend effect. In fact, as flow enters in the bend, because of the channel’s curvature, an unbalance between the centrifugal force and the transversal pressure gradient force develops and the secondary flow motion (often called as helical flow motion) evolves along the bend itself [62,63,64]. The secondary flow motion, with surface velocity directed towards the outer bank and the near-bed velocity directed towards the inner bank, tends to move the sediment from the outer bank towards the inner bank, thus facilitating the development of the point bar in the apex of the bend. Furthermore, as several studies demonstrate [62,63], the secondary flow contributes to the redistributions of the primary flow and of the maximum velocity gradients’ location along the bend [62,64,65]. In turn, the spatial variations of the primary velocity and of the bed shear stress determines also a spatial variation of the sediment fluxes along the bend. Thus, the interaction between the channel curvature effect and the migration movement could explain the development of the bend at late evolution stage [66].
5. Conclusions
In the present work the stream pattern changes have been analyzed by identifying the evolution of morphological features formed at different time periods. The main results obtained in the present work can be summarized as follows:
- different morphological features form between time periods characterized by frequent low-magnitude events with sporadic high peaks and time periods characterized by frequent high-magnitude events.
- during the time period characterized by frequent low-magnitude events with sporadic high peaks, the active channels are mainly concentrated on one side (left part) of the study reach, where a series of downstream migrating bars form. During the time period characterized by frequent high-magnitude events, the channel tends to assume a single tread meandering pattern characterized by a prevailing lateral migration;
- the difference in the morphological features evolving between the two time periods could be related to the different vegetation distribution and sediment transport mechanisms induced by the floods. The vegetation cover, which always increases on the right part of the study reach, determines a sort of interface between the vegetated-dominated area, where the flow resistance is significant, and the flood-disturbance-dominated area, where the action by flow is significant. Especially during frequent low-magnitude events, interactions between coarse and fine fractions could determine that the coarse particles become more mobile affecting the bed-load transport and the associated migrating features; during the period with frequent high-magnitude events, the ratio of coarse to fine sediments is altered and the gravel material and woody debris are deposited. This furtherly facilitates the formation of vegetation islands in one side and the sediment deposition on the other one, forcing the channel to suppress the secondary channels and assuming a single tread pattern.
In summary, the obtained results have shown that a combination of factors (such as the tolerances of vegetation species, the erosion and deposition of sediment, the transport of sediments and seeds) determine favorable conditions to channel pattern changes but, the frequency of occurrence of high-magnitude events should be especially considered in a fist-step analysis. This is because the frequency of occurrence of high-magnitude events influences, in turn, other important factors: on one hand it contributes to determine a variation of the typology of the vegetation characteristics; on the other hand, it affects the ratio of coarse to fine of sediments, the typology and dynamics of sediments and, consequently, the variation in sediment flux and the morphological features migration mechanisms.
Although the data used are not comprehensive of other detailed local data, the present approach has allowed researchers to conduct a first-step analysis on dynamics of stream patterns changes, which could drive a successive, more accurate and specific field monitoring and measurements especially aimed to explain specific multiscale interaction processes among flow, bed and banks erosion and plan-form evolution. Furthermore, it should be noted that the approach presented is scalable and applicable by using other image sources.
Future studies will be conducted to verify conditions for the changing configuration also at seasonal timescales.
Funding
This paper represents some of the results of a research programme undertaken during author’s research fellowship at Leibniz-Institut für Gewässerökologie und Binnenfischerei im Forschungsverbund Berlin e.V.- IGB (Berlin), funded by Deutcher Akademischer Austausch Dienst- (DAAD). Part of the successive development of this work has been then supported by Italian National Research Programme PRIN 2017, with the project “IntEractions between hydrodyNamics flows and bioTic communities in fluvial Ecosystems: advancement in dischaRge monitoring and understanding of Processes Relevant for ecosystem sustaInability by the development of novel technologieS with fIeld observatioNs and laboratory testinG (ENTERPRISING)”.
Institutional Review Board Statement
Not applicable.
Acknowledgments
The author wishes to thank the Head of the Department of Ecohydrology (Gunnar Nützmann), the researchers which contributed with ideas and suggestions during the development of this research and all the staff for the logistic support at Leibniz-Institut für Gewässerökologie und Binnenfischerei im Forschungsverbund Berlin-IGB (Berlin).
Conflicts of Interest
The author declares no conflict of interest.
References
- Schumm, S.A. The Fluvial System; John Wiley & Sons: New York, NY, USA, 1977; 338p. [Google Scholar]
- Bridge, J.S. Rivers and Floodplains: Forms, Process, and Sedimentary Record; Blackwell Science: Oxford, UK, 2003; p. 491. [Google Scholar]
- Métivier, F.; Barrier, L. Alluvial landscape evolution: What do we know about metamorphosis of gravel bed meandering and braided streams. In Gravel-Bed Rivers: Processes, Tools, Environments; Church, M., Biron, P., Roy, A., Eds.; Wiley & Sons: Chichester, UK, 2012; Chapter 34; pp. 474–501. [Google Scholar]
- Beechie, T.J.; Lierman, M.; Pollock, M.M.; Baker, S.; Davies, J. Channel Pattern and river-floodplain dynamics in forested mountain river systems. Geomorphology 2006, 78, 124–141. [Google Scholar] [CrossRef]
- Piegay, H.; Grant, G.; Nakamura, F.; Trustrum, N. Braided river management: From assessment of river behavior to improved sustainable development. Braided Rivers Process. Depos. Ecol. Manag. 2006, 36, 257–275. [Google Scholar]
- Zanoni, L.; Gurnell, A.; Drake, N.; Surian, N. Island dynamics in a braided river from analysis of historical maps and air photographs. River Res. Appl. 2008, 24, 1141–1159. [Google Scholar] [CrossRef]
- Zolezzi, G.; Bertoldi, W.; Tubino, M. Morphodynamics of Bars in Gravel-Bed Rivers: Bridging Analytical Models and Field Observations; Chapter 6. Gravel-Bed Rivers: Processes, Tools, Environments; Church, M., Roy, A.G., Biron, P.M., Eds.; John Wiley & Sons: Hoboken, NJ, USA, 2012. [Google Scholar]
- Tockner, K.; Ward, J.V.; Arscott, D.B.; Edwards, P.J.; Kollmann, J.; Gurnell, A.M.; Petts, G.E.; Maiolini, B. The Tagliamento river: A model ecosystem of European importance. Aquat. Sci. 2003, 65, 239–253. [Google Scholar] [CrossRef] [Green Version]
- Nami, M.; Leeder, M.R. Changing channel morphology and magnitude in the scalby formation (middle jurassic) of yorkshire, England. In Fluvial Sedimentology. Vol. 5. Ch. Memoirs of the Canadian Society of Petroleum Geologists; Miall, A.D., Ed.; CSPG Special Publications: Calgary, AB, Canada, 1978; pp. 431–440. [Google Scholar]
- Osterkamp, W.R.; Hedman, E.R. Perennial-Streamflow Characteristics Related to Channel Geometry and Sediment in Missouri River Basin; USGS Professional Paper 1242; US Government Printing Office: Washington, DC, USA, 1982. [Google Scholar]
- Parker, G.; Wilcock, P.; Paola, C.; Dietrich, W.E.; Pitlick, J. Quasi-universal relations for bankfull hydraulic geometry of single-thread gravel-bed rivers. J. Geophys. Res. Earth Surf. 2007, 112, 1–21. [Google Scholar] [CrossRef]
- Gaurav, K.; Métivier, F.; Devauchelle, O.; Sinha, R.; Chauvet, H.; Houssais, M.; Bouquerel, H. Morphology of the Kosi meagfan channels. Earth Syrface Dyn. 2015, 3, 321–331. [Google Scholar] [CrossRef] [Green Version]
- Hooke, J.M.; Redmond, C.E. Causes and nature of river planform change. In Dynamics of Gravel-Bed Rivers; Billi, P., Hey, R.D., Thorne, C.D., Tacconi, P., Eds.; John Wiley and Sons: Chichester, UK, 1992; pp. 549–563. [Google Scholar]
- Huisink, M. Late-glacial sedimentological and morphological changes in lowland river in response to climatic change: The maas, southern netherlands. J. Quat. Sci. 1997, 12, 209–223. [Google Scholar] [CrossRef]
- Nakayama, K.; Ulak, P. Evolution of uvial style in the siwalik group in the foothills of the nepal himalaya. Sediment. Geol. 1999, 125, 205–224. [Google Scholar] [CrossRef]
- Abernethy, B.; Rutherfurd, I.D. The e_ect of riparian tree roots on the mass-stability of riverbanks. Earth Surf. Process. Landforms 2000, 25, 921–937. [Google Scholar] [CrossRef]
- Abernethy, B.; Rutherfurd, I.D. The distribution and strength of riparian tree roots in relation to riverbank reinforcement. Hydrol. Process. 2001, 15, 63–79. [Google Scholar] [CrossRef]
- Perona, P.; Molnar, P.; Crouzy, B.; Perucca, E.; Jiang, Z.; McLelland, S.; Wüthrich, D.; Edmaier, K.; Francis, R.; Camporeale, C.; et al. Biomass selection by floods and related timescales: Part 1. Exp. Obs. Adv. Water Resour. 2012, 39, 85–96. [Google Scholar] [CrossRef]
- Gurnell, A.M.; Petts, G.E.; Hannah, D.M.; Smith, B.P.G.; Edwards, P.J.; Kollmann, J.; Ward, J.V.; Tockner, K. Riparian vegetation and island formation along the gravel-bed Fiume Tagliamento, Italy. Earth Surf. Process. Landf. 2001, 26, 31–62. [Google Scholar] [CrossRef]
- Wetzel, P.R. Tree islands ecosystems of the World. In Tree Islands of the Everglades; Sklar, F.H., van der Valk, A.G., Eds.; Kluwer Academic Publishers: Dordrecht, The Netherlands, 2002; pp. 19–69. [Google Scholar]
- Coremblit, D.; Steiger, J.; Gonzalez, E.; Gurnell, A.M.; Charrier, G.; Darrozes, J.; Dousseau, J.; Julien, F.; Lambs, L.; Larrue, S.; et al. The biogeomorphological life cycle of poplars during the fluvial biogeomorphological succession: A special focus on Populus nigra L. Earth Surf. Process. Landf. 2014, 39, 546–563. [Google Scholar] [CrossRef]
- Wintenberger, C.L.; Rodrigues, S.; Bréhéret, J.-G.; Villar, M. Fluvial islands: First stage of development from nonmigrating (forced) bars and woody-vegetation interactions. Geomorphology 2015, 246, 305–320. [Google Scholar] [CrossRef]
- Métivier, F.; Devaichelle, O.; Chauvet, H.; Lajeunesse, E.; Meunier, P.; Blanckaert, K.; Ashmore, P.; Xhang, Z.; Fan, Y.; Liu, Y.; et al. Geometry of meandering and breided gravel-bed threads from Bayanbulak Grassland, Tianshan, P.R. China. Earth Surf. Dynam. 2016, 4, 273–283. [Google Scholar] [CrossRef] [Green Version]
- Bertoldi, W.; Welber, M.; Gurnell, A.; Mao, L.; Comiti, F.; Tal, M. Physical modelling of the combined effect of vegetation and wood on river morphology. Geomorphology 2015, 246, 178–187. [Google Scholar] [CrossRef]
- Gran, K.B.; Tal, M.; Wartman, E.D. Co-evolution of riparian vegetation and channel dynamics in an aggrading braided river system, Mount Pinatubo, Philippines. Earth Surf. Process. Landf. 2015, 40, 1101–1115. [Google Scholar] [CrossRef]
- Diehl, R.M.; Wilcox, A.C.; Stella, J.C.; Kui, L.; Sklar, L.S.; Lightbody, A. Fluvial sediment supply and pioneer woody seedlings as a control on bar-surface topography. Earth Surf. Process. Landf. 2016, 42, 724–734. [Google Scholar] [CrossRef]
- Mardhiah, U.; Rillig, M.C.; Gurnell, A. Reconstructing the development of sampled sites on fluvial island surfaces of the Tagliamento River, Italy, from historical sources. Earth Surf. Process. Landf. 2014, 40, 629–641. [Google Scholar] [CrossRef]
- Corenblit, D.; Steiger, J.; Charrier, G.; Darrozes, J.; Garófano-Gómez, V.; Garreau, A.; González, E.; Gurnell, A.M.; Hortobágyi, B.; Julien, F.; et al. establishment and fluvial landform construction: Biogeomorphic dynamics within a channelized river. Earth Surf. Process. Landf. 2016, 41, 1276–1292. [Google Scholar] [CrossRef]
- Polvi, L.E.; Wohl, E.; Merritt, D.M. Modeling the functional influence of vegetation type on streambank cohesion. Earth Surf. Process. Landf. 2014, 39, 1245–1258. [Google Scholar] [CrossRef]
- Pasquale, N.; Perona, P. Experimental assessment of riverbed sediment reinforcement by vegetation roots. In Proceedings of the 7th International Conference on Fluvial Hydraulics (River Flow), Lausanne, Switzerland, 3–5 September 2014; Schleiss, A.E.A., Ed.; pp. 553–561. [Google Scholar]
- Edmaier, K.; Crouzy, B.; Perona, P. Experimental characterization of vegetation uprooting by flow. J. Geophys. Res. Biogeosci. 2015, 120, 1812–1824. [Google Scholar] [CrossRef]
- Bertoldi, W.; Zanoni, L.; Tubino, M. Assessment of morphological changes induced by flow and flood pulses in a gravel bed braided river: The Tagliamento River (Italy). Geomorphology 2010, 114, 348–360. [Google Scholar] [CrossRef]
- Comiti, F.; Da Canal, M.; Surian, N.; Mao, L.; Picco, L.; Lenzi, M.A. Channel adjustments and vegetation cover dynamics in a large gravel bed river over the last 200 years. Geomorphology 2011, 125, 147–159. [Google Scholar] [CrossRef]
- Surian, N.; Barban, M.; Ziliani, L.; Monegato, G.; Bertoldi, W.; Comiti, F. Vegetation turnover in a braide driver: Frequency and effectiness of floods of different magnitude. Earth Surf. Process. Landf. 2014, 40, 542–558. [Google Scholar] [CrossRef]
- Johnson, W.C. Tree recruitment and survival in rivers: Influence of hydrological processes. Hydrol. Process. 2000, 14, 16–17. [Google Scholar]
- Camporeale, C.; Ridolfi, L. Riparian vegetation distribution induced by river flow variability: A stochastic approach. Water Resour. Res. 2006, 42, W10415. [Google Scholar] [CrossRef] [Green Version]
- Crouzy, B.; Edmaier, N.K.; Pasquale, P. Perona Impact of floods on the statistical distribution of riverbed vegetation. Geomorphology 2013, 202, 51–58. [Google Scholar] [CrossRef]
- Nakamura, F.; Swanson, F.I.; Wondzell, S.M. Disturbance regimes of stream and riparian systems—A disturbace.cascade perspective. Hydrol. Process. 2000, 14, 2849–2860. [Google Scholar] [CrossRef]
- Gurnell, A.M.; Bertoldi, W.; Corenblit, D. Changing river channels: The roles of hydrological processes, plants and pioneer fluvial landforms in humid temperate, mixed load, gravel bed rivers. Earth-Sci. Rev. 2012, 111, 129–141. [Google Scholar] [CrossRef]
- Mckean, J.; Nagel, D.; Tonina, D.; Bailey, P.; Wright, C.W.; Bohn, C.; Nayegandhi, A. Remote Sensing of Channels and Riparian Zones with a Narrow-Beam Aquatic-Terrestrial LIDAR. Remote. Sens. 2009, 1, 1065–1096. [Google Scholar] [CrossRef] [Green Version]
- Kinzel, P.J.; Wright, C.W.; Nelson, J.M.; Burman, A.R. Evaluation of an experimental LiDAR for surveying a shallow, braided, sand-bedded river. J. Hydraulic Eng. 2007, 133, 838–842. [Google Scholar] [CrossRef] [Green Version]
- McKean, J.; Isaak, D.; Wright, C.W. Stream and riparian habitat analysis and monitoring with a high-resolution terrestrial-aquatic lidar. In Remote Sensing Applications for Aquatic Resource Monitoring; Bayer, J.M., Schei, J.L., Eds.; Pacific Northwest Aquatic Monitoring Partnership Special Publication: Cook, WA, USA, 2009; pp. 7–16. [Google Scholar]
- Gurnell, A.M.; Bertoldi, W.; Francis, R.A.; Gurnell, J.; Mardhiah, U. Understanding processes of island development on an island braided river over timescales from days to decades. Earth Surf. Process. Landf. 2019, 44, 624–640. [Google Scholar] [CrossRef]
- Gurnell, A.; Petts, G.; Hannah, D.; Smith, B.; Edwards, P.; Kollmann, J.; Ward, J.; Tockner, K. Wood storage within the active zone of a large European gravel-bed river. Geomorphology 2000, 34, 55–72. [Google Scholar] [CrossRef]
- Petts, G.E.; Gurnell, A.M.; Gerrard, A.I.; Hannah, D.M.; Smith, B.P.G.; Edwards, P.J.; Kollmann, J.; Ward, J.V.; Tockner, K. Longitudinal variations in exposed riverine sediments: A context for the development of vegetated islands along the Fiume Tagliamento, Italy. Aquat. Conserv. 2000, 10, 249–266. [Google Scholar] [CrossRef]
- Maione, U.; Machne, G. Studio Della Formazione Delle Piene del Fiume Tagliamento; Ecoconsult: Milano, Italy, 1982. (In Italian) [Google Scholar]
- Gurnell, A.M. Channel change on the river dee meanders, 1946–1992, from the analysis of air photographs. Regul. Rivers Res. Manag. 1997, 13, 13–26. [Google Scholar] [CrossRef]
- Ragheb, A. Enhancement of Google Earth Positional Accuracy. Int. J. Eng. Res.Technol. 2015, 4, 627–630. [Google Scholar]
- Karrenberg, S.; Blaser, S.; Kollman, J.; Speck, T.; Edwards, P.J. Root anchorage of saplings and cuttings of woody pioneer species in a riparianenvironment. Funct. Ecol. 2003, 17, 170–177. [Google Scholar] [CrossRef] [Green Version]
- Gran, K.; Paola, C. Riparian vegetation controls on braided stream dynamics. Water Resour. Res. 2001, 37, 3275–3283. [Google Scholar] [CrossRef] [Green Version]
- Murray, A.B.; Paola, C. Modelling the effect of vegetation on channel pattern in bedload rivers. Earth Surf. Process. Landf. 2003, 28, 131–143. [Google Scholar] [CrossRef]
- Tal, M.; Paola, C. Effects of vegetation on channel morphodynamics: Results and insights from laboratory experiments. Earth Surf. Process. Landf. 2010, 35, 1014–1028. [Google Scholar] [CrossRef]
- Yalin, M.S. River Mechanics; Pregamon Press: London, UK, 1992. [Google Scholar]
- Sedláček, J.; Kapustová, V.; Šimíček, D.; Bábek, O.; Sekanina, M. Initial stages and evolution of recently abandoned meanders revealed by multi-proxy methods in the Odra River (Czech Republic). Geomorphology 2019, 333, 16–29. [Google Scholar] [CrossRef]
- Słowik, M. The influence of meander bend evolution on the formation of multiple cutoffs: Findings inferred from floodplain architecture and bend geometry. Earth Surf. Process. Landf. 2016, 41, 626–641. [Google Scholar] [CrossRef]
- Hooke, J. Temporal variations in fluvial processes on an active meandering river over a 20-year period. Geomorphology 2008, 100, 3–13. [Google Scholar] [CrossRef]
- Reid, I.; Frostick, L.E.; Layman, J.T. The incidence and nature of bedload transport during flood flows in coarse-grained alluvial channels. Earth Surf. Process. Landf. 1985, 10, 33–44. [Google Scholar] [CrossRef]
- Whiting, P.J.; Dietrich, W.E.; Leopold, L.B.; Drake, T.G.; Shreve, R.L. Bedload sheets in heterogeneous sediment. Geology 1988, 16, 105–108. [Google Scholar] [CrossRef]
- Cudden, J.R.; Hoey, T.B. The causes of bedload pulses in a gravel channel: The implications of bedload grain-size distributions. Earth Surf. Process. Landf. 2003, 28, 1411–1428. [Google Scholar] [CrossRef]
- Venditti, J.; Nelson, P.; Lamb, M.; Dietrich, W.; Yager, E.; Collins, L. Sediment patches, sediment supply and channel morphology. In River, Coastal and Esturarine Morphodynamics; Parker, G., Garcia, M.H., Eds.; RCEM: London, UK, 2005; pp. 79–90. [Google Scholar]
- Braudrick, C.A.; Dietrich, W.E.; Lieverich, G.T.; Sklar, L.S. Experimental evidence for the conditions to sustain meandering in coarse-bedded rivers. Proc. Natl. Acad. Sci. USA 2009, 106, 16936–16941. [Google Scholar] [CrossRef] [Green Version]
- Termini, D. Momentum transport and bed shear stress distribution in a meandering bend: Experimental analysis in a laboratory flume. Adv. Water Resour. 2015, 81, 128–141. [Google Scholar] [CrossRef]
- Van Dijk, W.M.; Van De Lageweg, W.I.; Kleinhans, M.G. Experimental meandering river with chute cutoffs. J. Geophys. Res. Space Phys. 2012, 117, 03023. [Google Scholar] [CrossRef] [Green Version]
- Termini, D.; Piraino, M. Experimental analysis of cross-sectional flow motion in a large amplitude meandering bend. Earth Surf. Process. Landf. 2010, 36, 244–256. [Google Scholar] [CrossRef]
- Bai, R.; Zhu, D.; Chen, H.; Li, D. Laboratory Study of Secondary Flow in an Open Channel Bend by Using PIV. Water 2019, 11, 659. [Google Scholar] [CrossRef] [Green Version]
- Engel, F.L.; Rhoads, B.L. Interaction among mean flow, turbulence, bed morphology, bank failures and channel planform in an evolving compound meander loop. Geomorphology 2012, 163–164, 70–83. [Google Scholar] [CrossRef]
Figure 1.
Localization of the study reach along the Tagliamento River (images obtained from Google Earth, Image ©2016 DigitalGlobe).
Figure 1.
Localization of the study reach along the Tagliamento River (images obtained from Google Earth, Image ©2016 DigitalGlobe).

Figure 2.
Available images from Google Earth (images obtained from Google Earth, Image ©2015 DigitalGlobe).
Figure 2.
Available images from Google Earth (images obtained from Google Earth, Image ©2015 DigitalGlobe).

Figure 3.
(a) recorded data during time period 2002–2012 at Villuzza gauging station; (b) frequency of occurrence of events with water depth 100 cm < h < 200 cm and of events with water depth h > 200 cm.
Figure 3.
(a) recorded data during time period 2002–2012 at Villuzza gauging station; (b) frequency of occurrence of events with water depth 100 cm < h < 200 cm and of events with water depth h > 200 cm.
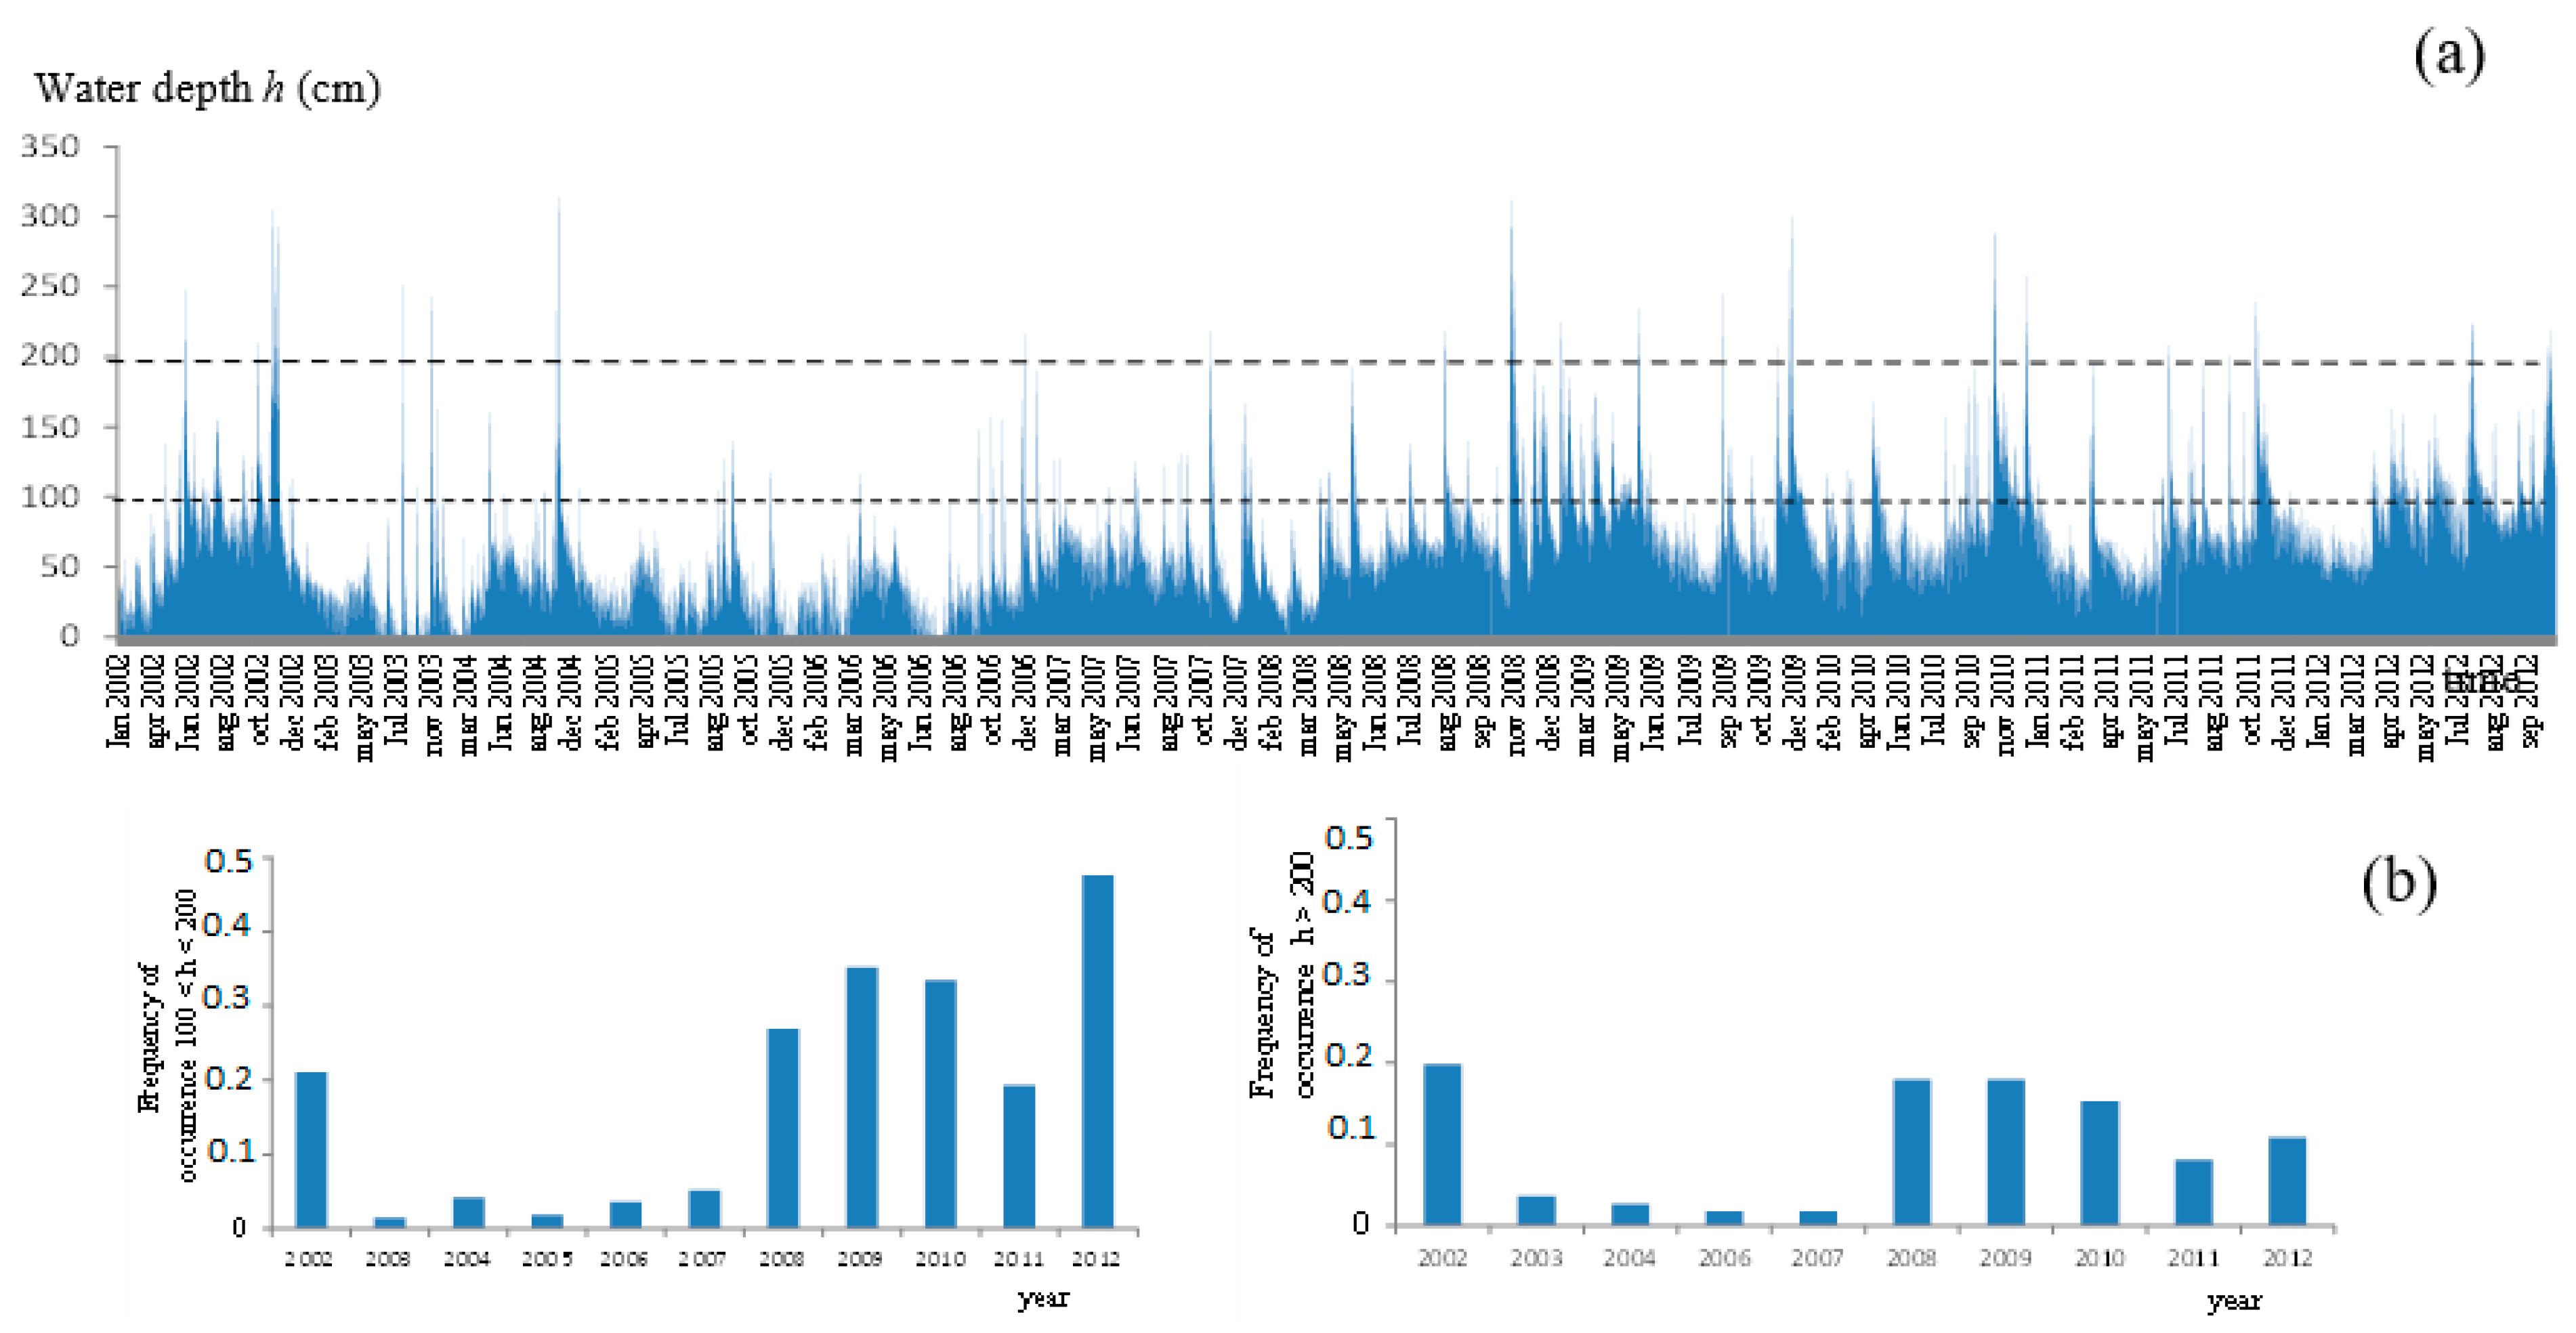
Figure 4.
External boundary of all considered images and external limit, polygons and transients.
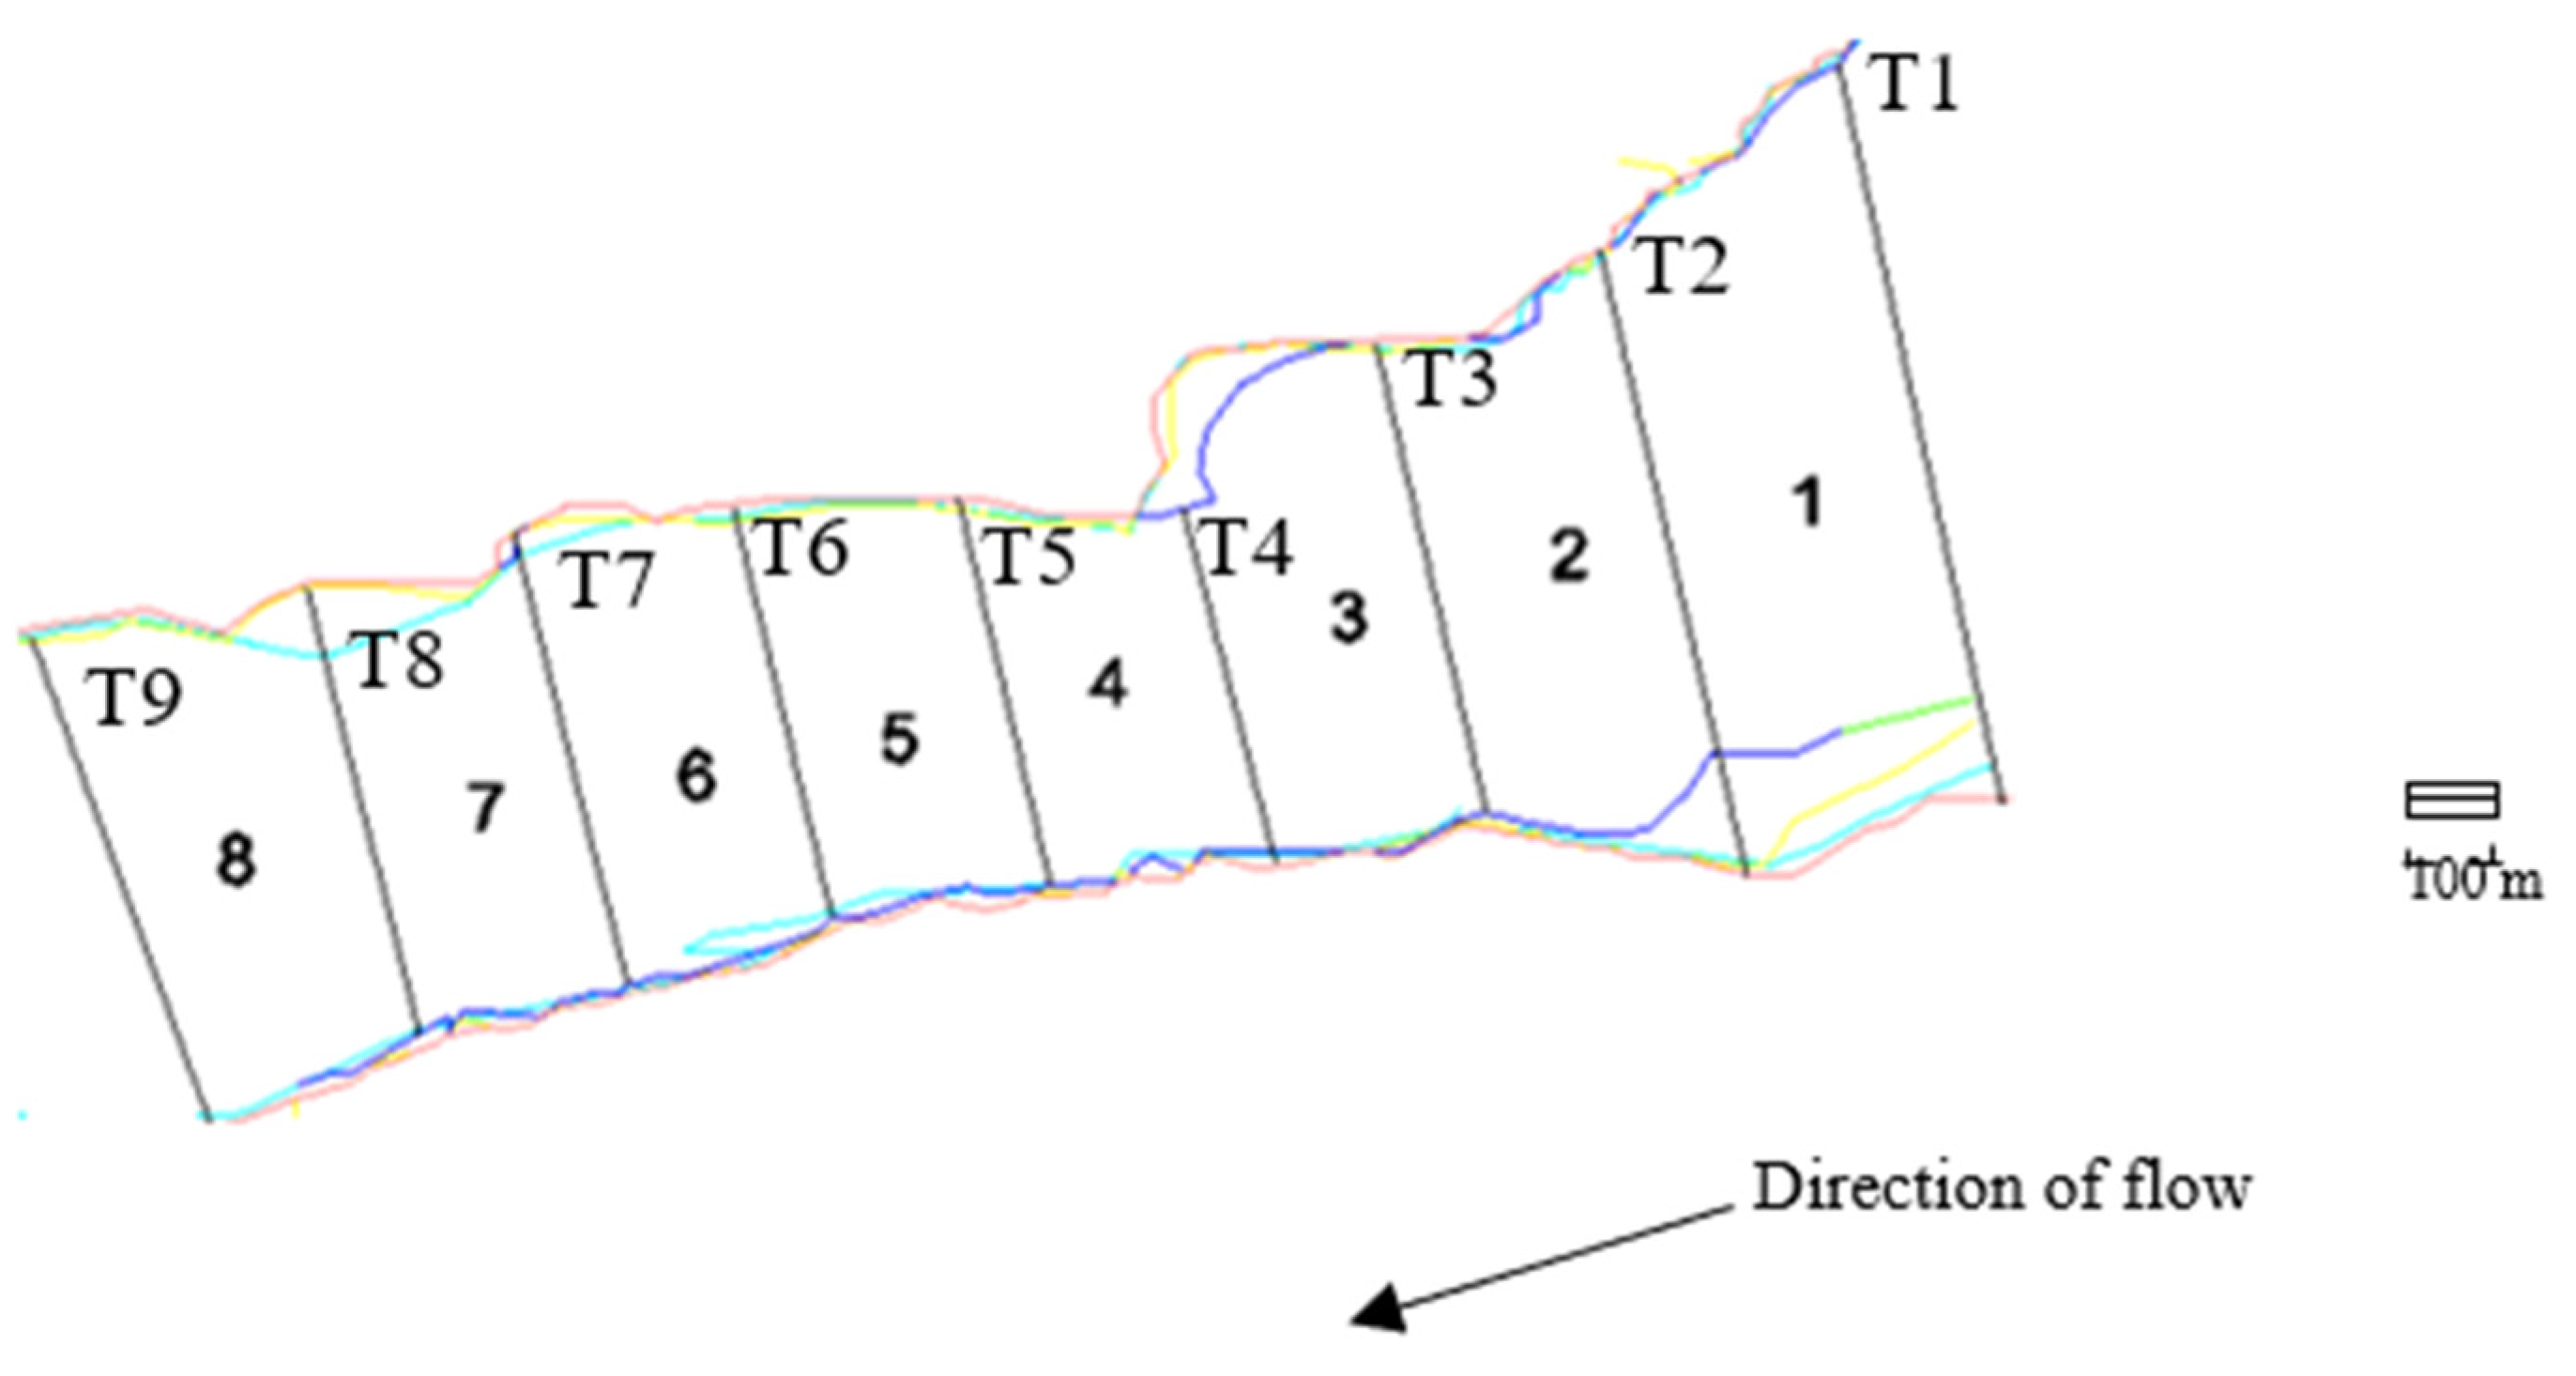
Figure 5.
Area extension of the vegetation islands: (a) Class A; (b) Class B; (c) Class C.
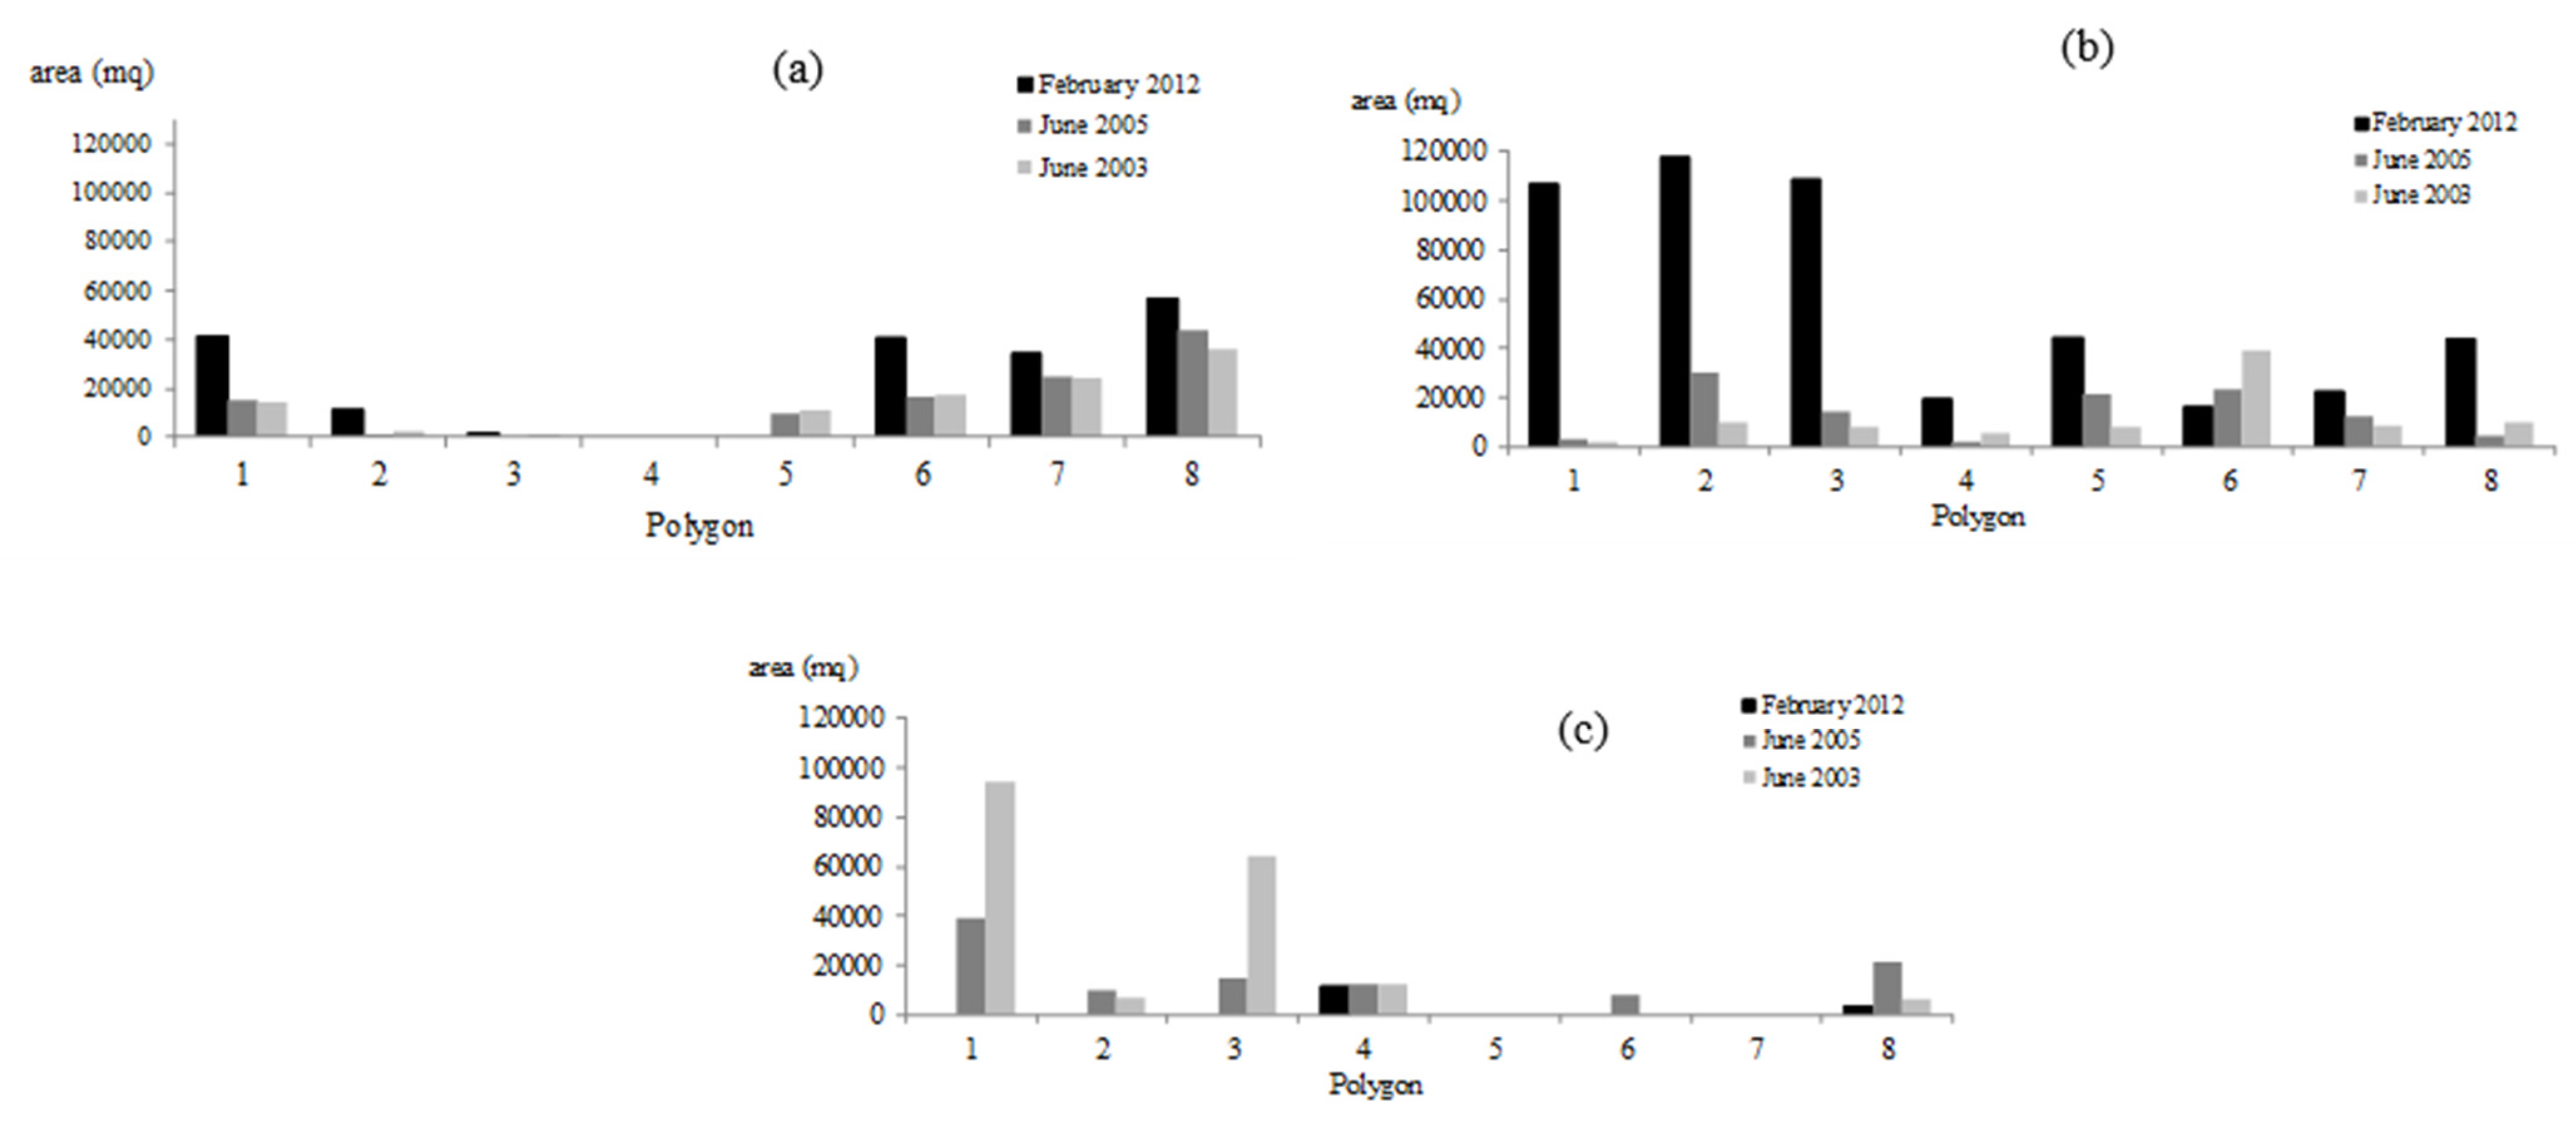
Figure 6.
Total area occupied by vegetation of classes A and B.
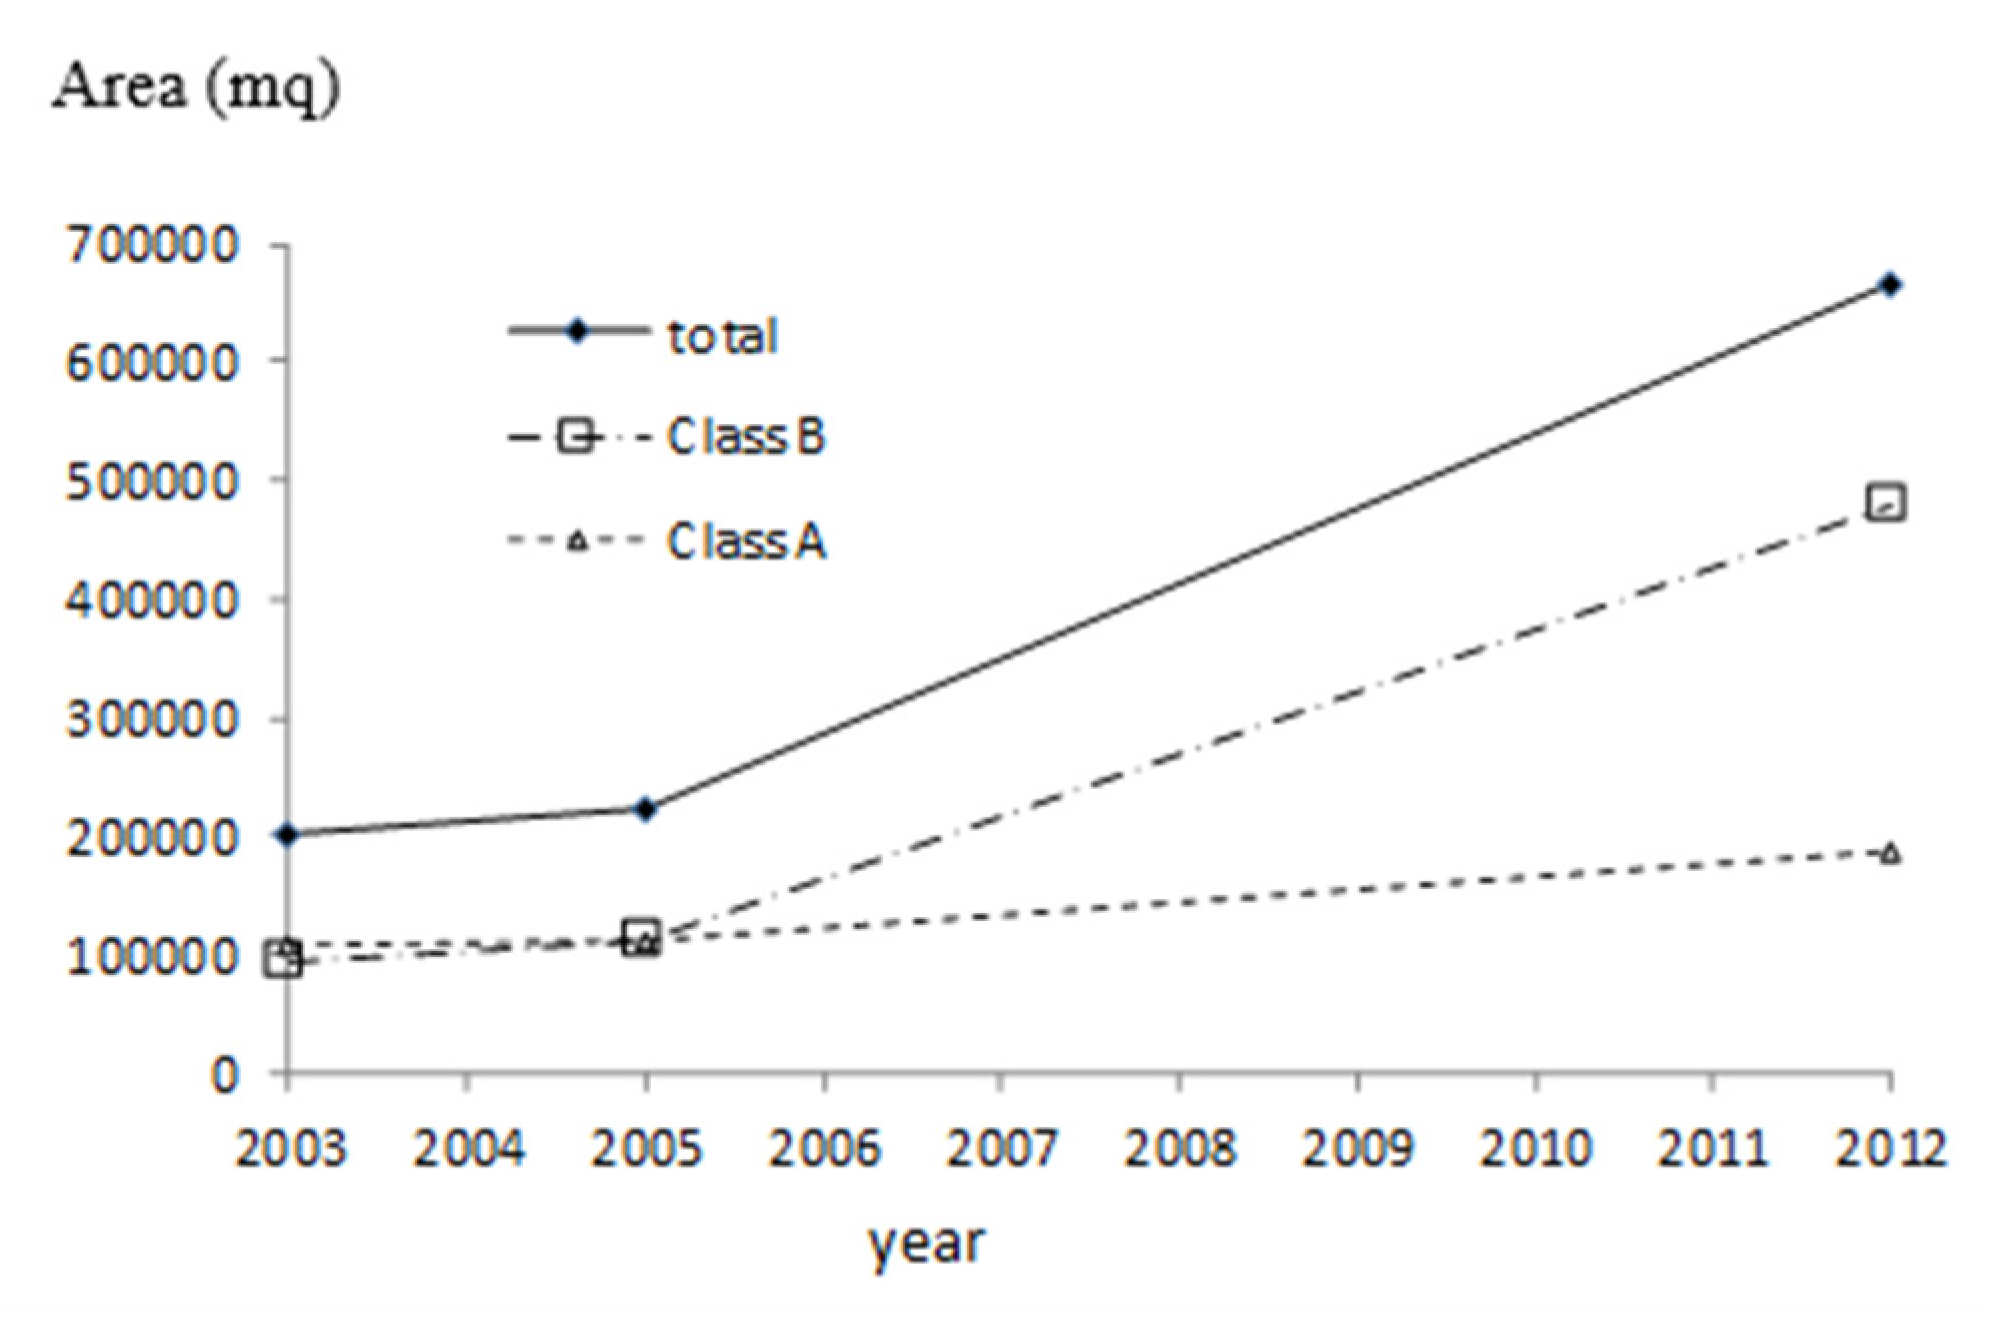
Figure 7.
Digitized vegetation cover and active channels: (a) June 2003; (b) June 2005; (c) February 2012.
Figure 7.
Digitized vegetation cover and active channels: (a) June 2003; (b) June 2005; (c) February 2012.
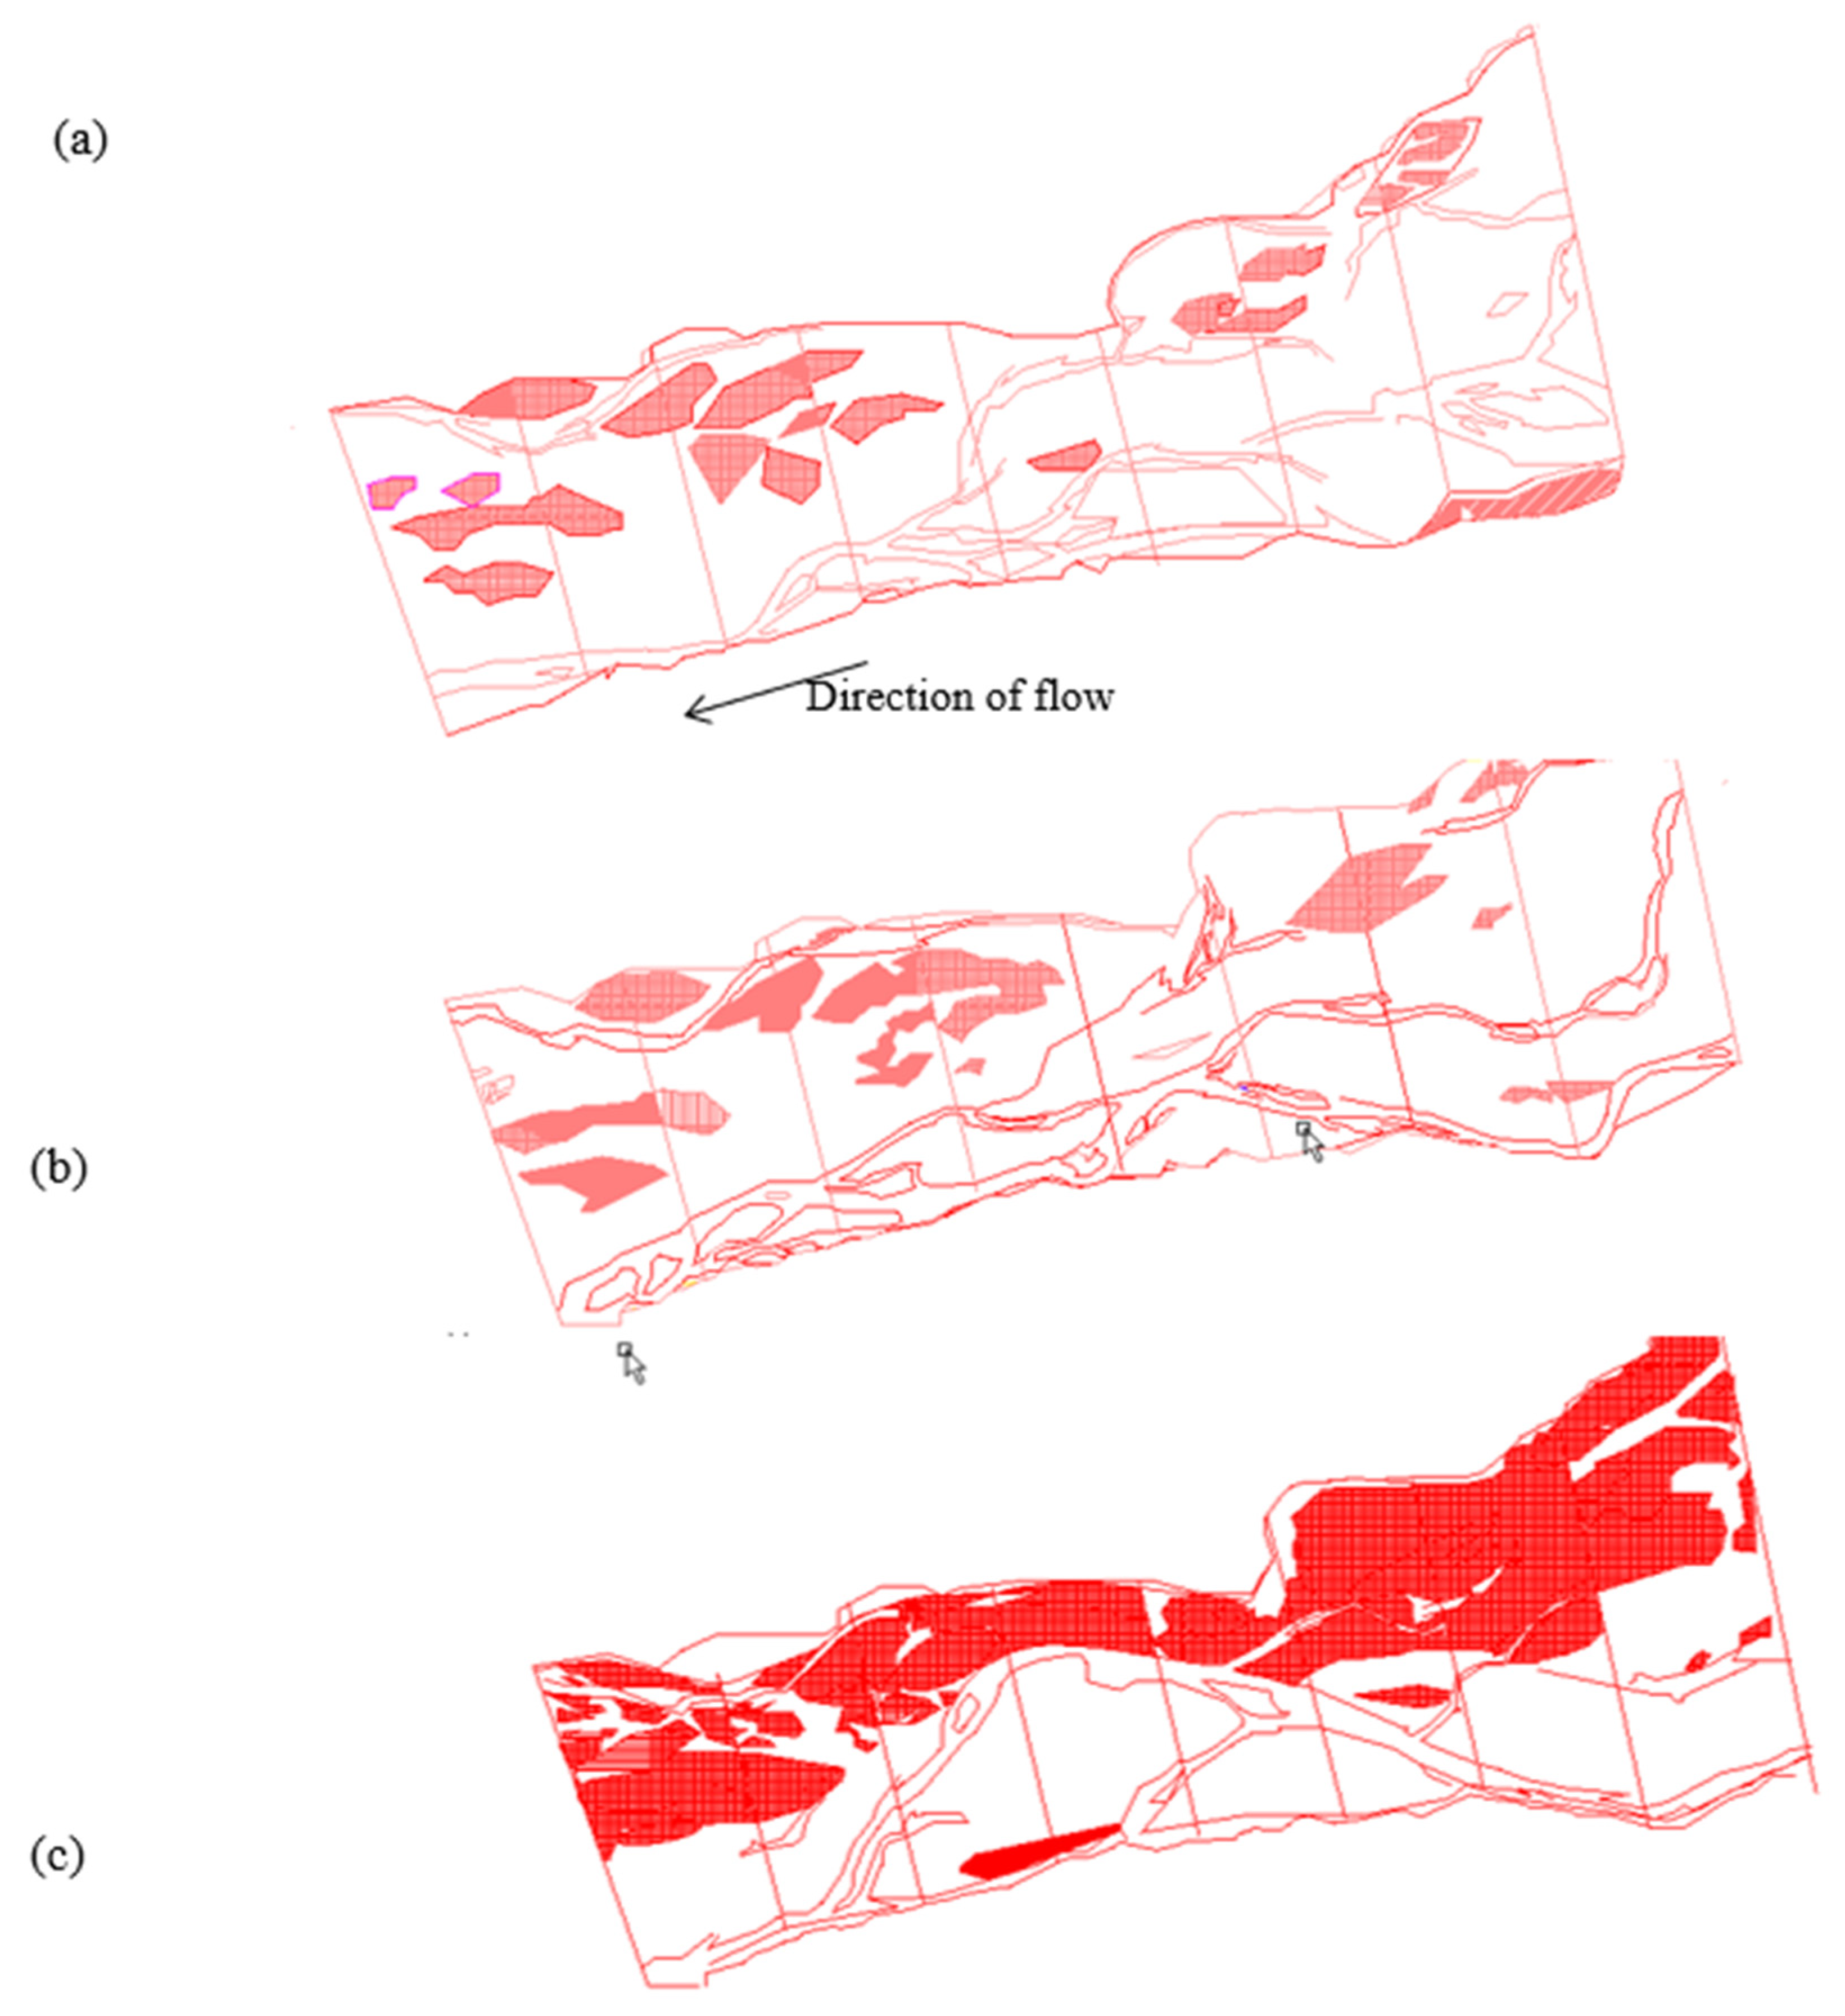
Figure 8.
Morphological features and evolution from June 2003 to February 2012 (images obtained from Google Earth, Image ©2015 DigitalGlobe).
Figure 8.
Morphological features and evolution from June 2003 to February 2012 (images obtained from Google Earth, Image ©2015 DigitalGlobe).

Figure 9.
Comparisons between the tracers in February 2012 (in black) and December 2015 (in grey) (images obtained from Google Earth, Image ©2015 DigitalGlobe).
Figure 9.
Comparisons between the tracers in February 2012 (in black) and December 2015 (in grey) (images obtained from Google Earth, Image ©2015 DigitalGlobe).

Table 1.
Percent area occupied by vegetation types A (trees) and B (dense bushes).
| N. polygon | Class A | Class B | |
| % | % | ||
| June 2003 | 1 | 0.008 | 0.006 |
| 2 | 0.001 | 0.039 | |
| 3 | 0.001 | 0.039 | |
| 4 | 0.000 | 0.035 | |
| 5 | 0.006 | 0.044 | |
| 6 | 0.010 | 0.185 | |
| 7 | 0.014 | 0.043 | |
| 8 | 0.020 | 0.040 | |
| N. polygon | Class A | Class B | |
| % | % | ||
| June 2005 | 1 | 0.009 | 0.008 |
| 2 | 0.001 | 0.111 | |
| 3 | 0.000 | 0.062 | |
| 4 | 0.000 | 0.011 | |
| 5 | 0.006 | 0.117 | |
| 6 | 0.009 | 0.115 | |
| 7 | 0.014 | 0.060 | |
| 8 | 0.025 | 0.018 | |
| N. polygon | Class A | Class B | |
| % | % | ||
| February 2012 | 1 | 0.024 | 0.275 |
| 2 | 0.006 | 0.445 | |
| 3 | 0.001 | 0.466 | |
| 4 | 0.000 | 0.116 | |
| 5 | 0.000 | 0.237 | |
| 6 | 0.023 | 0.081 | |
| 7 | 0.020 | 0.124 | |
| 8 | 0.032 | 0.181 |
Publisher’s Note: MDPI stays neutral with regard to jurisdictional claims in published maps and institutional affiliations. |
© 2021 by the author. Licensee MDPI, Basel, Switzerland. This article is an open access article distributed under the terms and conditions of the Creative Commons Attribution (CC BY) license (http://creativecommons.org/licenses/by/4.0/).
Share and Cite
MDPI and ACS Style
Termini, D. Investigation of a Gravel-Bed River’s Pattern Changes: Insights from Satellite Images. Appl. Sci. 2021, 11, 2103. https://doi.org/10.3390/app11052103
AMA Style
Termini D. Investigation of a Gravel-Bed River’s Pattern Changes: Insights from Satellite Images. Applied Sciences. 2021; 11(5):2103. https://doi.org/10.3390/app11052103
Chicago/Turabian StyleTermini, Donatella. 2021. "Investigation of a Gravel-Bed River’s Pattern Changes: Insights from Satellite Images" Applied Sciences 11, no. 5: 2103. https://doi.org/10.3390/app11052103
Note that from the first issue of 2016, this journal uses article numbers instead of page numbers. See further details here.