Article

Electrochemical Determination of Lead Using A Composite Sensor Obtained from Low-Cost Green Materials:Graphite/Cork

by
Iasmin B. Silva
1,
Danyelle Medeiros de Araújo
2,
Marco Vocciante
3,
Sergio Ferro
4,*,
Carlos A. Martínez-Huitle
1,* and
Elisama V. Dos Santos
1,*
1
Laboratório de Eletroquímica Ambiental e Aplicada, Instituto de Química, Universidade Federal do Rio Grande do Norte, Lagoa Nova, Natal 59072-900, Brazil
2
Laboratório de Eletroquímica e Química Analítica, Departamento de Química, Universidade do Estado do Rio Grande do Norte, Mossoró 59610-210, Brazil
3
Department of Chemistry and Industrial Chemistry, University of Genova, 16124 Genova, Italy
4
Ecas4 Australia Pty Ltd., Mile End South 5031, Australia
*
Authors to whom correspondence should be addressed.
Appl. Sci. 2021, 11(5), 2355; https://doi.org/10.3390/app11052355
Submission received: 13 January 2021 / Revised: 1 March 2021 / Accepted: 1 March 2021 / Published: 6 March 2021
(This article belongs to the Special Issue Sustainable Environmental Solutions)

Abstract

:
The purpose of this study was to develop an inexpensive, simple, and highly selective cork-modified carbon paste electrode for the determination of Pb(II) by differential pulse anodic stripping voltammetry (DPASV) and square-wave anodic stripping voltammetry (SWASV). Among the cork–graphite electrodes investigated, the one containing 70% w/w carbon showed the highest sensitivity for the determination of Pb(II) in aqueous solutions. Under SWASV conditions, its linear range and relative standard deviation are equal to 1–25 µM and 1.4%, respectively; the limit of detection complies with the value recommended by the World Health Organization. To optimize the operating conditions, the selectivity and accuracy of the analysis were further investigated by SWASV in acidic media. Finally, the electrode was successfully applied for the determination of Pb(II) in natural water samples, proving to be a sensitive electrochemical sensor that meets the stringent environmental control requirements.

1. Introduction

Lead is a highly toxic heavy metal that causes serious environmental problems due to its non-biodegradability. It is commonly released into the environment because of mining activities, natural processes, and the development of new technological devices [1,2], being frequently used by the automotive, plastics, paints, and ceramics industries for its corrosion resistance [3].
Since the nitrate and chloride salts of lead show excellent solubility in water [4,5], lead is normally present in soil and aquatic ecosystems in ionic form, as Pb(II). According to the World Health Organization (WHO), a Pb(II) concentration as low as 0.24 µmol L−1 can cause decreased intelligence in children, behavioral difficulties, and learning problems. For this reason, the concentration of lead in water and soils should always be below the WHO limit and, consequently, must be monitored.
Nowadays, several analytical methods are employed for lead detection, such as spectroscopy [6], optical colorimetry [7], inductively coupled plasma mass spectrometry (ICP-MS) [8], atomic absorption spectrometry (AAS) [9], and fluorescence spectrometry [10]. However, these analytical methods are expensive (they require trained operators, complex equipment, solvents or gases, and so on) and, in some cases, sample preparation procedures are required. In this context, electrochemical techniques have been investigated because of their significant advantages such as simplicity of operation, high sensitivity, low cost, and easy handling [11,12,13,14,15]. In general, electrochemical sensors are rapid, portable, inexpensive, and highly sensitive and offer a low limit of detection, good reproducibility, good signal-to-noise ratio, and selective detection [12]. Consequently, electrochemical sensors have been applied for the determination of heavy metals in the environment, industrial products, food matrices, electronic waste, and clinical materials [16,17,18].
Among the electrochemical sensors used, graphite-modified electrodes have been extensively developed due to their higher selectivity, sensitivity, high specific area, unique electrical conductivity, self-assembly behavior, mechanical flexibility, extreme resistance to oxidation, natural origin, and low cost [19,20,21,22]. However, these properties can be improved by including other modifiers in their composition.
Recently, cork has emerged as a promising low-cost and efficient green material for various environmental applications (e.g., compound detection [13,23,24], soil and water remediation [25,26]). Cork is a natural organic polymeric material, which has modest electrical, magnetic, and optical properties and exhibits self-cleaning behavior and antibacterial activity. For raw cork (RAC), electrical conductivity (σ) values of approximately 1.2 × 10⁻¹⁰ and 1.67 × 10⁻¹³ S m−1 were registered at 25 and 50 °C, respectively [27]. Based on the existing literature, two types of cork are often used: raw cork (RAC) and regranulated cork (RGC). Their differences are mainly due to their composition, which depends on the thermal pretreatment applied to RAC to produce RGC.
In the present communication, cork–graphite composite electrodes to be used as electrochemical sensors for the detection of lead ions are discussed. The effects of the cork composition, the cork–graphite ratio, and the supporting electrolyte for detecting Pb(II) were investigated. The performance in Pb(II) detection of two voltammetric techniques (differential pulse adsorptive stripping voltammetry (DPASV) and square-wave adsorptive stripping voltammetry (SWASV)) was also evaluated. Finally, the applicability of the cork–graphite voltammetric device was successfully demonstrated by detecting Pb(II) in real water matrixes (groundwater, tap water, and “produced water”) as well as verifying the selectivity, repeatability, reproducibility, and stability of the sensors.

2. Materials and Methods

The highest quality commercially available chemicals were used. Graphite powder and Pb(NO3)2 were sourced from Sigma (Brazil); the former was used without further purification. Acetate buffer, NaNO3, CdCl2, H2SO4, NaCl, FeCl2, KCl, CaCl2, MgSO4, ZnCl2, AlCl3, and MnSO4 were sourced from Merck (Brazil). The raw cork (RAC) used in the experimental studies was provided by Corticeira Amorim S.G.P.S., S.A. (Portugal); the granules were washed twice with distilled water in cycles of 2 h at 60 °C to remove impurities and other water-extractable components that could interfere with the electrochemical analysis. Before use, the RAC was dried at 60 °C in an oven for 24 h [23]. Aqueous solutions were prepared using ultrapure water obtained from a Millipore Milli-Q direct-0.3 purification system.

2.1. Preparation of Cork-Modified Electrodes

The RAC granules were reduced in size using a ball mill and sieved to obtain the finest fractions. The fraction below 150 µm (designated as RAC powder) was selected for use in this work. The cork–graphite composite sensor (working electrode) was prepared by mechanical homogenization of RAC and graphite (Gr) in different proportions (10:90, 70:30, and 90:10 %w/w), using 0.3 mL of paraffin oil as a binder and mixing everything in an agate mortar for about 30 minutes, as previously reported [23]. The paste was packed in a polypropylene nozzle (model K31-200Y) used as a support, and the sensor surface was smoothed over a tissue paper. Before use, the sensor was electroactivated by cyclic voltammetry between −1.1 and 0 V (scan rate: 100 mV s−1) in 0.5 M H2SO4. The different sensors are referred to as GrRAC-X, where X is the amount of cork (RAC) expressed as %w/w. The unmodified graphite sensor (Gr) was prepared as described for the GrRAC-X sensors, but in the absence of RAC powder. Electrode stability was also determined by repetitive determinations of Pb (25 µM) in 0.5 M H2SO4.

2.2. Electrochemical Measurements

The electrochemical tests were performed using an Autolab PGSTAT302N (Metrohm) controlled with NOVA 1.8 software, and a three-electrode cell including an Ag/AgCl (3.0 M KCl) reference electrode, a Pt wire auxiliary electrode, and one of the cork–graphite sensors (GrRAC) as the working electrode (geometrical area of approximately 0.45 mm2). Differential pulse anodic stripping voltammetry (DPASV) measurements were performed with different concentrations of Pb(II) ions in acetate buffer solutions (pH 4.5), 0.5 M NaNO3, and 0.5 M H2SO4. The accumulation of Pb(II) ions on the surface of the composite sensor was achieved by applying a potential of −1.2 V (vs. Ag/AgCl) for different preconcentration times (40, 70, 100, 130, and 160 s), during which the stirring conditions were kept constant for 30, 60, 90, 120, and 150 s; the remaining 10 s were considered as an equilibration time, without stirring. Subsequently, the anodic stripping scan was performed at 50 mV s−1, with a modulation amplitude of +0.05 V, and a modulation time of 0.04 s. Square-wave anodic stripping voltammetry (SWASV) measurements were performed in 0.5 M H2SO4. In this case, a preconcentration potential of −1.2 V was applied to the working electrode for 120 s under continuous magnetic stirring, with a scanning frequency of 80 Hz, an amplitude of 50 mV, and a step potential of 5 mV. All electrochemical studies were conducted without deaerating and performed at room temperature (25 ± 2 °C). Each measurement was performed in triplicate, and obtained data were subjected to statistical analysis and reported as mean ± standard deviation (SD). For the determination of Pb(II) in different water matrices (tap water, groundwater, and produced water), the water samples were spiked with a known quantity of a standard solution of Pb(II) and the determination of Pb(II) was performed using the standard addition method.

3. Results and Discussion

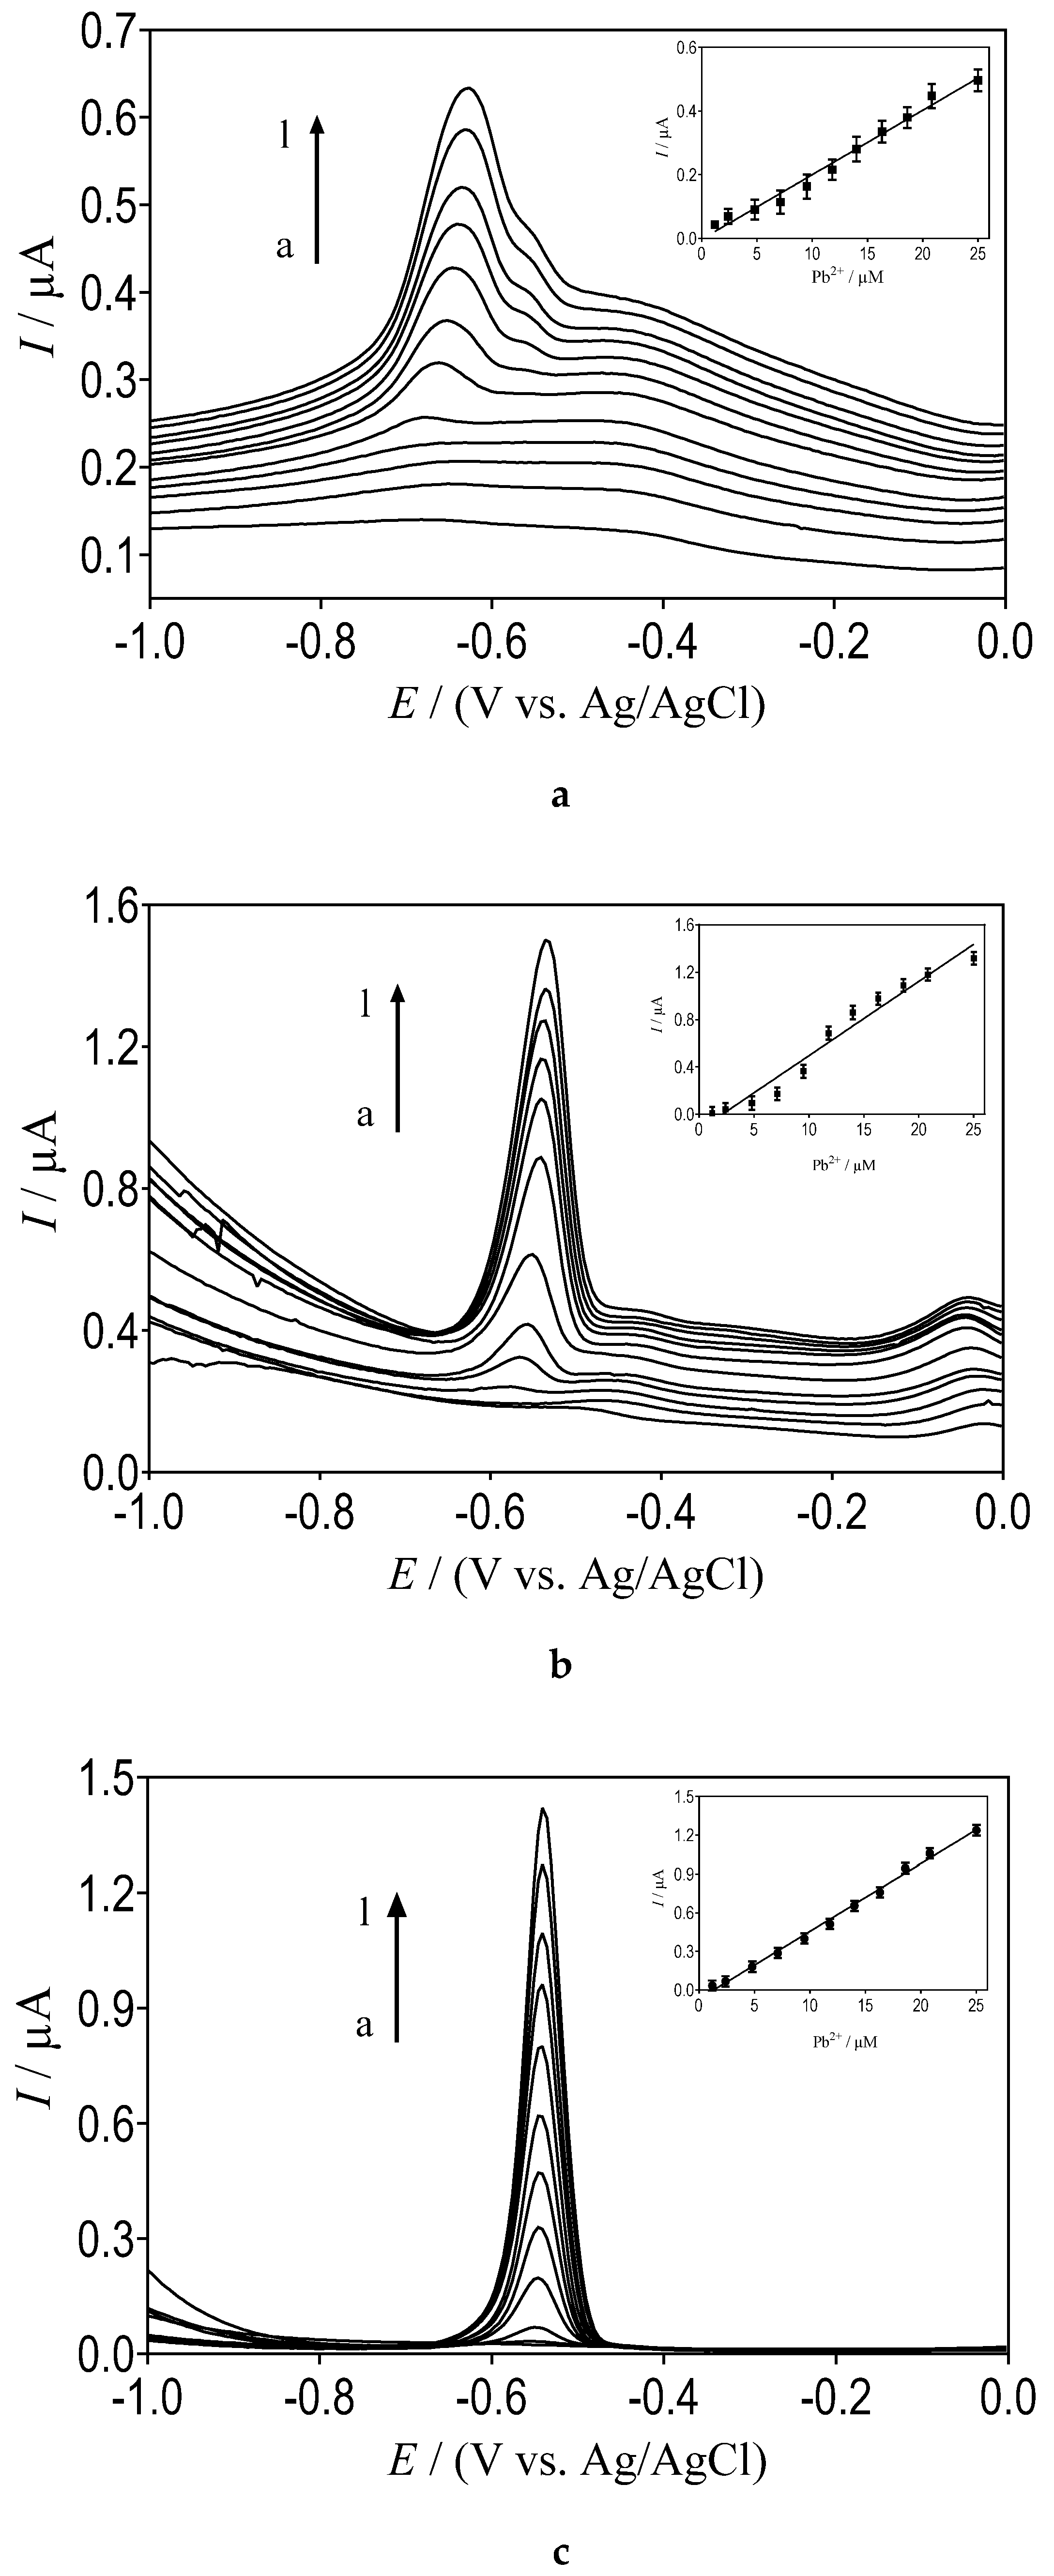
3.1. Effect of the Supporting Electrolyte

In order to evaluate the voltammetric response of the proposed modified sensor, the quantification of Pb(II) was carried out in different supporting electrolytes. Figure 1a–c show the DPASV response for the determination of Pb(II) using a GrRAC-70% sensor (this composition was selected for preliminary analysis based on the results reported in the literature) from solutions of 0.1 M acetate buffer (pH 4.5), 0.5 M NaNO3, and 0.5 M H2SO4, respectively, using a preconcentration time of 30 s. The sulfuric acid solution proved to be the most suitable electrolytic solution because it provided a well-defined voltammetric signal and the response increased linearly without significant deviations (Figure 1). The limit of detection (LOD), for each of the supporting electrolytes used, was estimated by the equation LOD = 3 × Sy/x/b, where Sy/x is the residual standard deviation and b is the slope of the calibration plot, in accordance with IUPAC recommendations of the mean value for samples analyzed in triplicate. This approach allows the control of both false positive and negative errors (α = β = 0.05), as recommended by IUPAC [28,29], and has been confirmed and recommended by experts in the field [30,31]. For the 0.1 M acetate buffer solution, no significant current response was obtained, resulting in an LOD of 4.8 µM; a similar outcome was obtained in 0.01 M acetate buffer solution, where an LOD of approximately 3.2 µM confirmed the poor performance of the sensor in acetate buffer solutions. Conversely, the analytical approach significantly improved when 0.5 M NaNO3 and 0.5 M H2SO4 solutions were used, which resulted in LOD values of 2.8 (Figure 1b) and 1.6 µM (Figure 1c). Comparing the values obtained with an unmodified graphite electrode and with the modified cork–graphite electrodes in H2SO4, the LOD is 3 times higher on graphite (≈4.8 µM) than that obtained with the GrRAC-70% electrode. The best result obtained using the composite material shows that the cork–graphite mixture is able to influence the intensity of the current signals.
According to the literature [32], cork has a great adsorption capacity, which is assumed to occur through a so-called biosorption mechanism consisting of an initial physical adsorption (rapid metal uptake) and then a slower chemisorption. The biosorption mechanism is the result of several kinds of interactions, such as complexation, coordination, chelation, ion exchange, inorganic microprecipitation, and hydrolysis products of metal ions; in the case of metal ion biosorption, ion exchange is usually the main mechanism. Hence, the type of cork, the pH conditions, and the contact time determine the interactions that can occur between the target compound and the cork surface. Depending on the cork used, specific active sites may predominate in its surface composition (phenolic, carboxylic, sulfonic, phosphate, and amino groups as well as coordination sites), in addition to the cork surface charge depending on pH conditions [33]. It is also important to consider that carbonaceous materials have micropores and mesopores, the accessibility of which will be increased following the inclusion of cork as a surface modifier. Thus, an improvement in voltammetric current signals can be achieved. Another important feature to consider is that the surface morphology of GrRAC-70% is more homogeneous, as evidenced by the SEM micrographs, which can positively influence its current response [34].
In the case of the acetate buffer as the supporting electrolyte, the formation of Pb(CH3COO)2 can decrease the availability of Pb(II) in solution; in addition, the acetate ions can compete with Pb(II) ions for the active sites available on the graphite–cork surface. As a result, a poor current response is achieved, with limitations on the selectivity and sensitivity of the modified electrode. Indeed, lead concentrations below 10 µM (Figure 1a), which affect the LOD, cannot be efficiently detected. In the case of NaNO3, the lack of complexing activity by nitrate anions and the possibility of preferential interactions between the composite material (cork–graphite) and Pb(II) ions in solution allow significant improvements in the current response, with consequent benefits in terms of the linearity of the response, although superficial adsorption phenomena may be highlighted for lead concentrations below 10 µM (Figure 1b). Finally, well-defined voltammetric signals were observed at the GrRAC-70% electrode when H2SO4 was used (Figure 1c). Due to the acidic conditions, lead is present in solution in its cationic form, Pb2+, and the cork surface is also completely protonated and positively charged. When the working electrode is negatively polarized, the lead ions compete with protons for surface sites; however, the surface accumulation of Pb ions is favored due to ion exchange mechanisms with active sites. In fact, the current response increased linearly without any significant deviations. Therefore, H2SO4 was selected as the supporting electrolyte for the subsequent experiments.

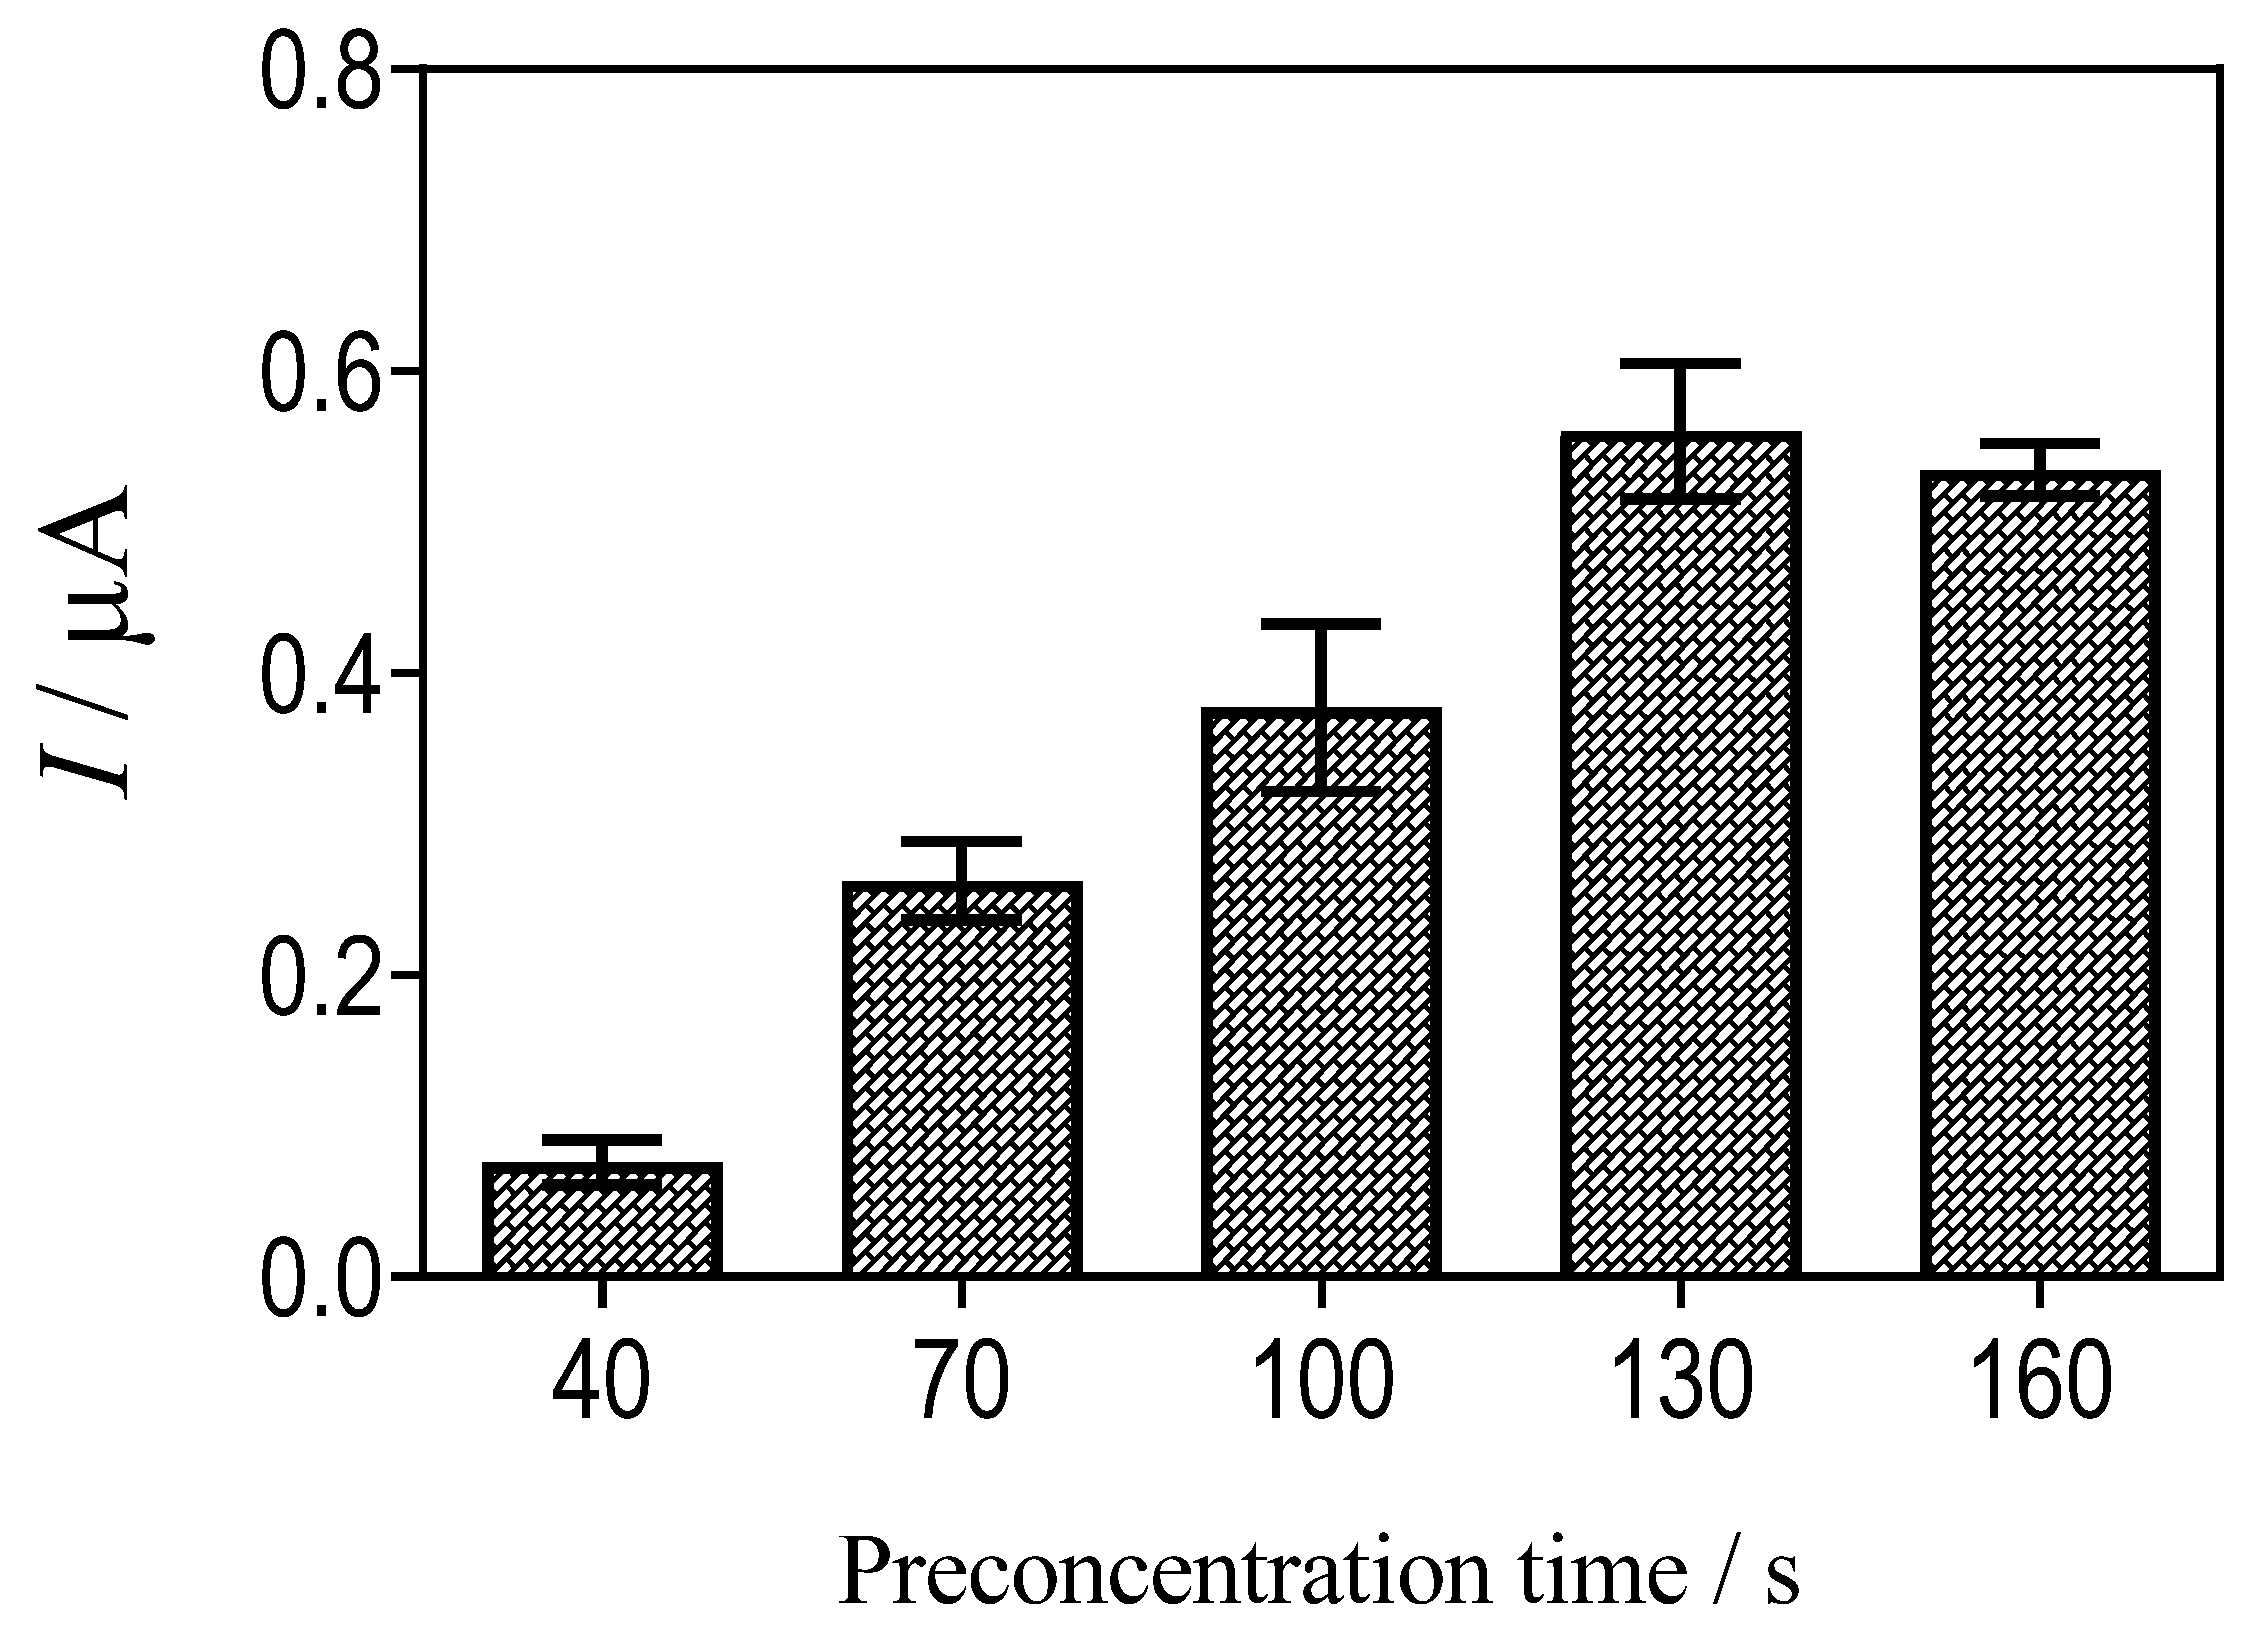
3.2. Influence of the Preconcentration Time

The effect of the preconcentration time (40, 70, 100, 130, and 160 s) on the voltammetric response for Pb(II) detection was studied in 15 mL of 0.5 M H2SO4 by using the GrRAC-70% sensor. The results indicate that the peak current increased with the preconcentration time, from 40 to 160 s, as illustrated in Figure 2. For all tests, the initial potential was held constant at −1.2 V under stirring conditions for different times (30, 60, 90, 120, and 150 s), with an additional resting time of 10 s without stirring; subsequently, the stripping voltammetry was carried out at 50 mV s−1. As seen in Figure 2, a decrease in current was achieved when the preconcentration time was extended to 160 s; thus, 130 s was chosen as the most suitable preconcentration time for further analysis. Ten replicates were considered in order to study the effect of preconcentration. According to Student’s t-test at a confidence level of 95% (parameter denominated as p), there were no significant differences between the experimental value (23.5 µM of Pb) and the theoretical value (25 µM of Pb). The observed trend can be motivated by the high adsorption rate due to the porous structure of the cork [33]; for preconcentration times greater than 130 s (120 s under stirring conditions and 10 s in rest conditions), the GrRAC-70% sensor plausibly reached the maximum adsorption capacity on its surface.

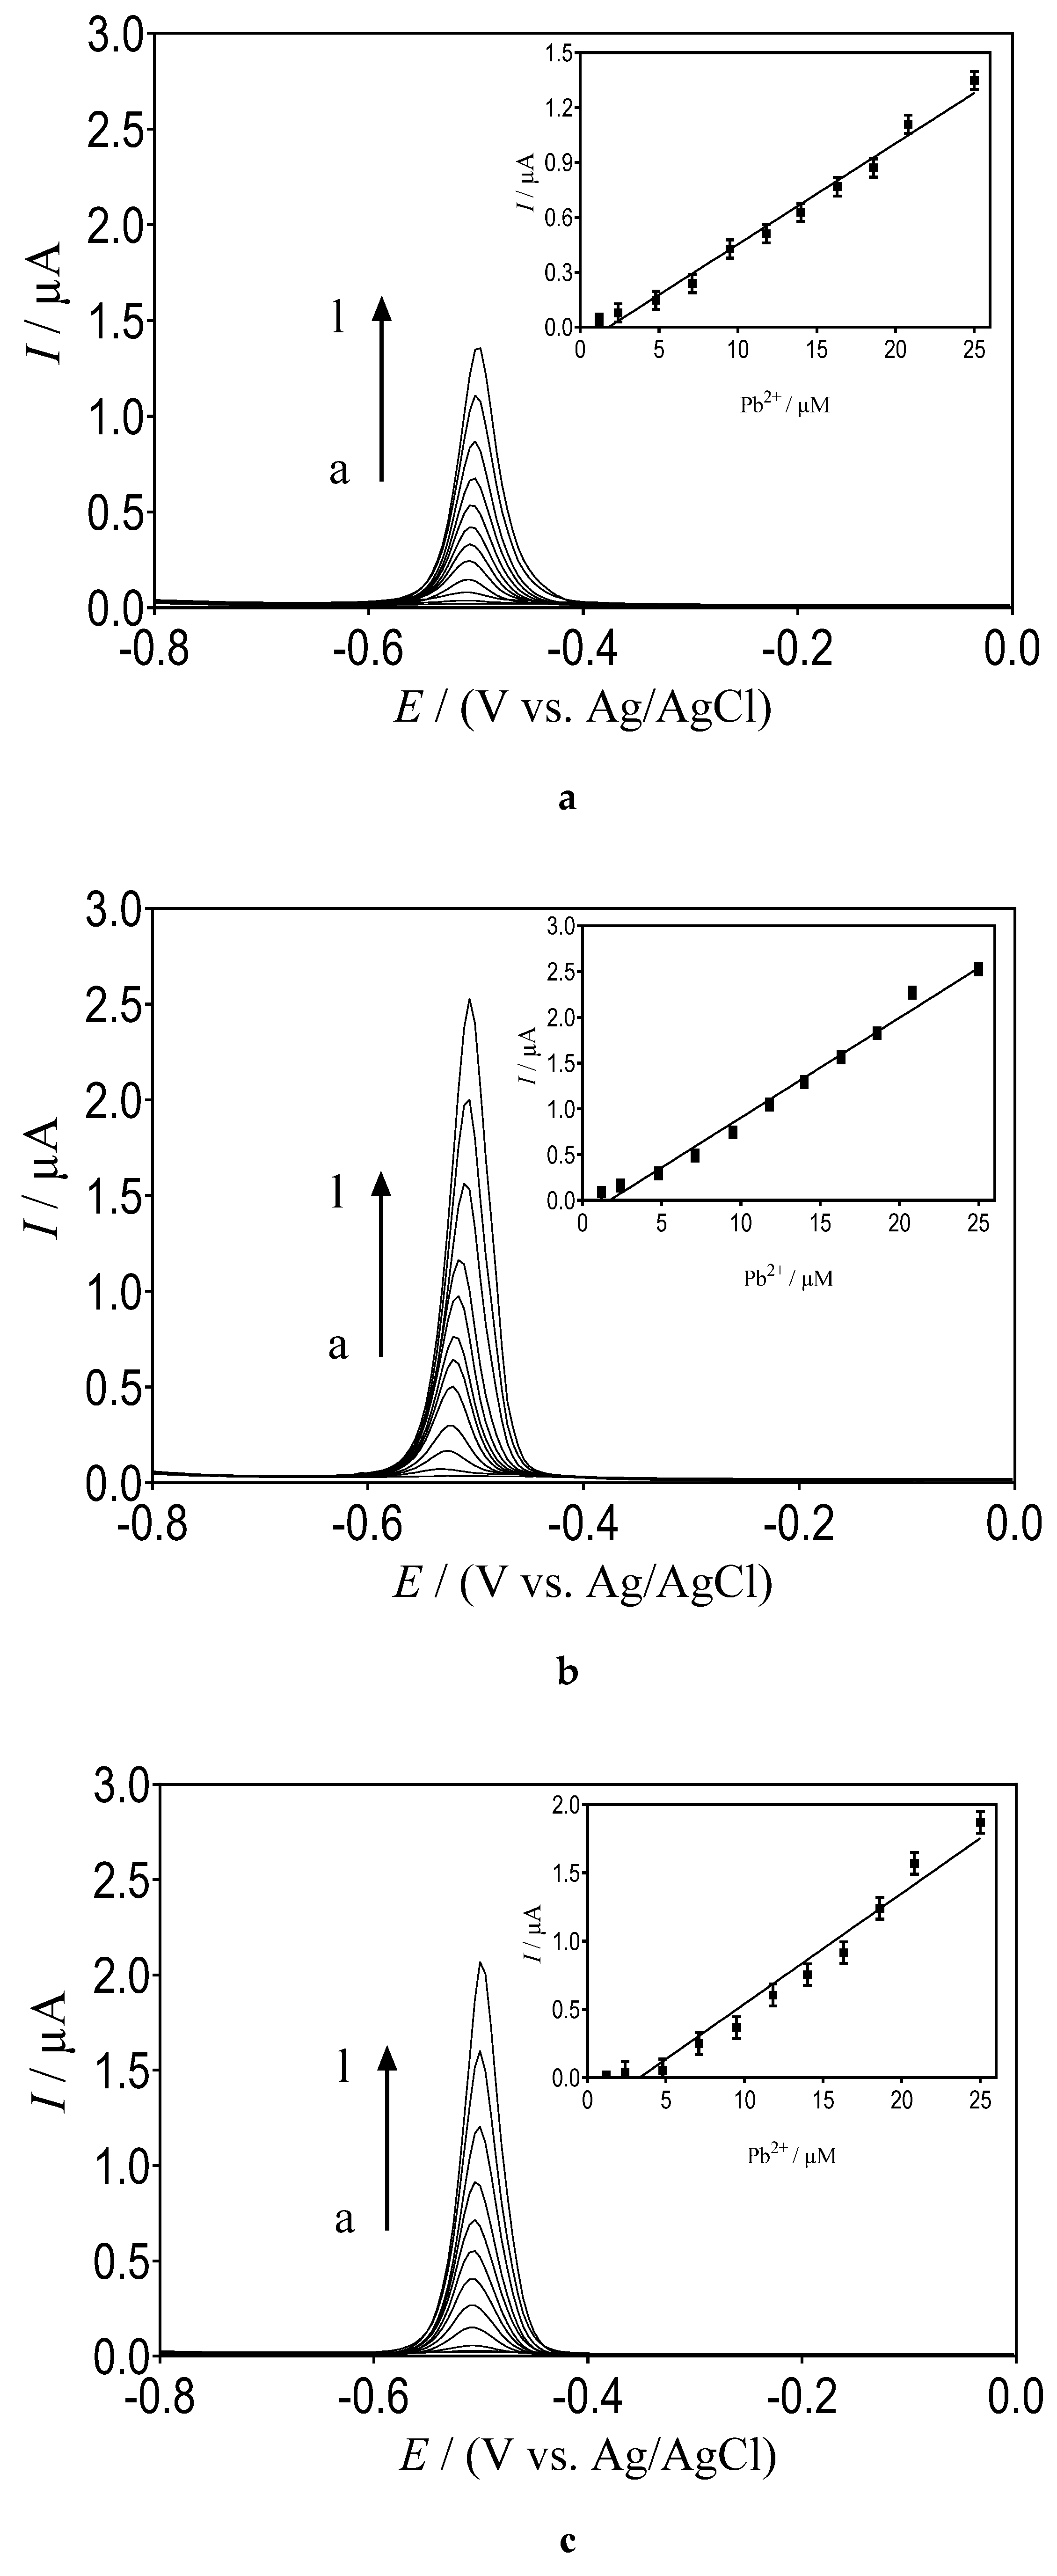
3.3. Influence of the Cork Concentration
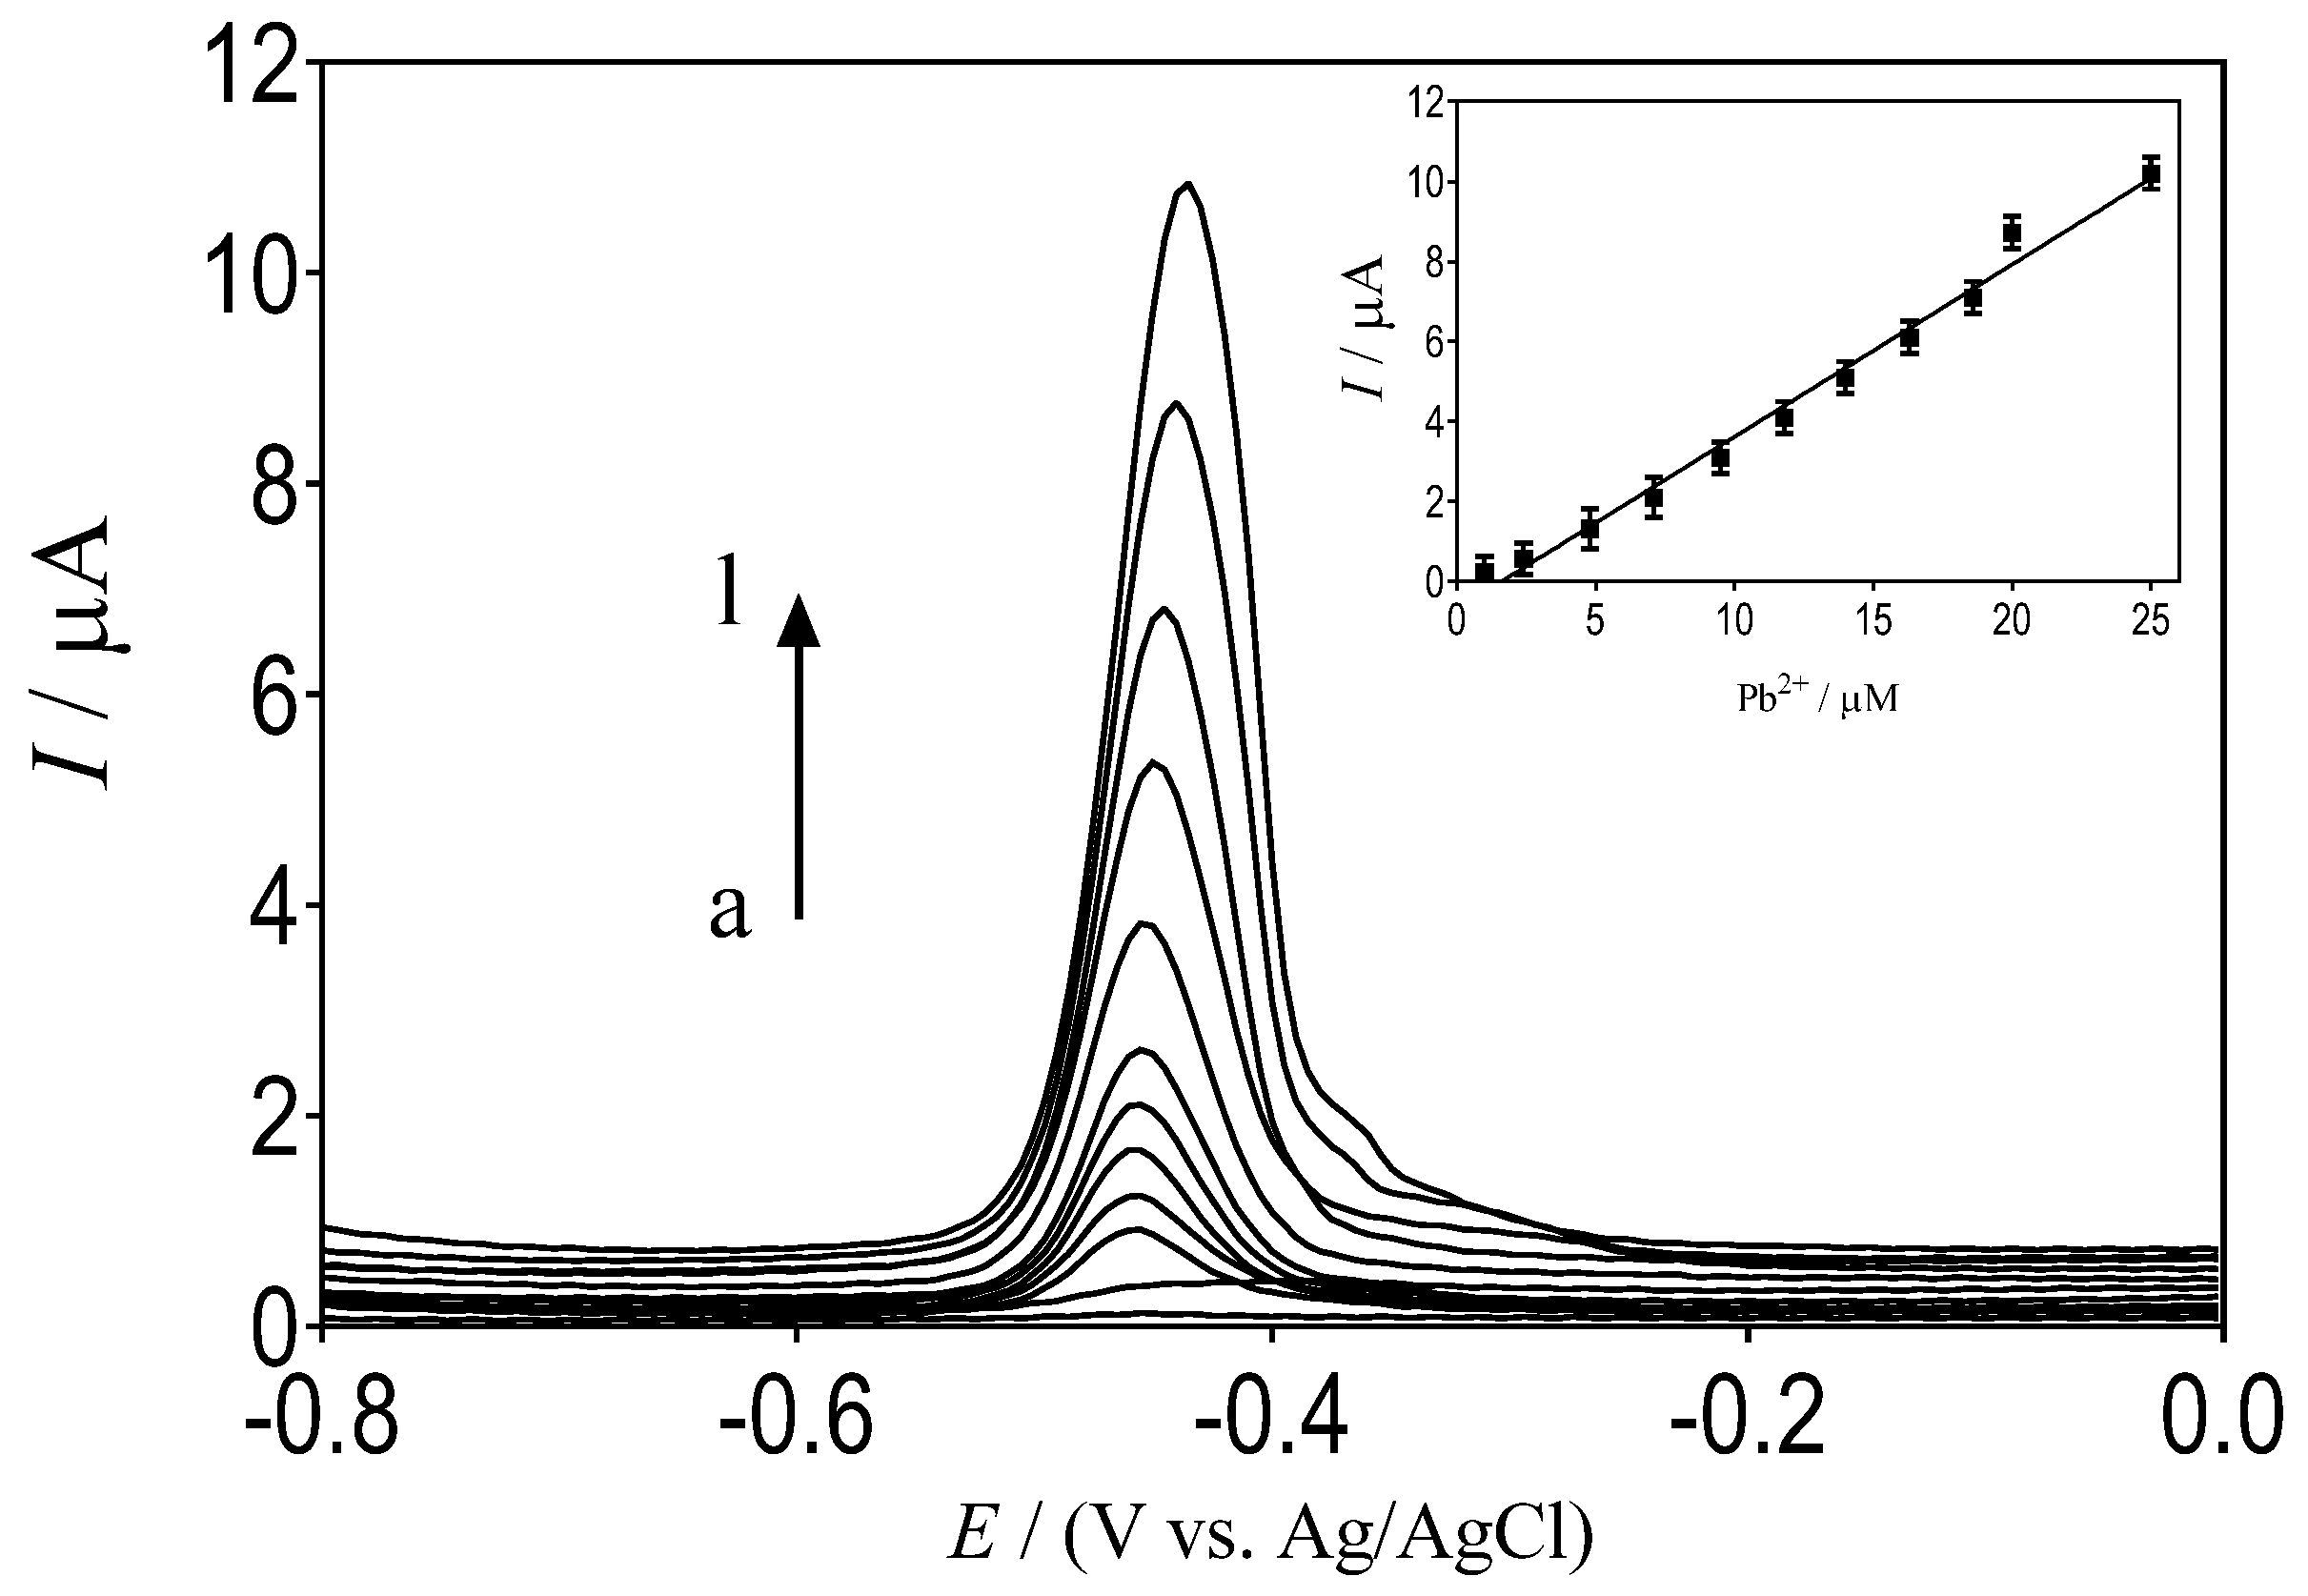
The performance of the composite electrode is affected by the amount of cork that is mixed with the graphite. In a previous work, we showed that the quantity of cork influences the electroactive area of the sensor as well as the electron transfer during the oxidation of caffeine [13]. In order to evaluate the effect of the quantity of cork on the detection of Pb(II) by DPASV, 0.5 M H2SO4 was used as the supporting electrolyte. As can be observed in Figure 3a–c, the peak current recorded on GrRAC depends on the amount of cork present in the composite sensor. In particular, a linear relationship between the peak current and the Pb(II) concentration was obtained in the Pb(II) concentration range from 1 to 25 µM in 0.5 M H2SO4 (inserts in Figure 3a–c), considering at least 11 different concentrations of the analyte. Pb(II) calibration curves were obtained for each of the prepared sensors. From the analytical curves obtained using GrRAC-10%, GrRAC-70%, and GrRAC-90% by DPASV, it can be seen that the stripping peak currents (Ip) increased linearly with the concentration of Pb(II) (inserts in Figure 3). The calculated correlation equations are
GrRAC-10%: Ip (μA) = (0.05 ± 0.03)×C – (0.1 ± 0.05); R2 = 0.97
GrRAC-70%: Ip (μA) = (0.08 ± 0.04)×C – (0.3 ± 0.1); R2 = 0.98
GrRAC-90%: Ip (μA) = (0.11 ± 0.09)×C – (0.2 ± 0.1); R2 = 0.95
According to Figure 3, the best performing GrRAC sensor in terms of sensitivity, capable of providing an LOD for Pb(II) of only about 0.8 µM, was GrRAC-70%. In contrast, the GrRAC-10% and GrRAC-90% sensors provided higher LODs of approximately 1.5 and 1.2 µM, respectively. This difference in the LODs is attributable to the different degrees of dispersion of the surface active sites, as reported in our previous study on the determination of caffeine [23]. The highest peaks were obtained with GrRAC-70% and this cork–graphite ratio was used for detecting Pb(II). The results show that Pb(II) stripping signals with GrRAC-70% are superior to those obtained with the GrRAC-10% and GrRAC-90% electrodes. This can be attributed to the honeycomb macroporous structure of the cork granules, which favor the presence of propagation paths through the cork cells, forming macroporosity with textural properties. Based on our previous results, the surface morphology of GrRAC-70% appears particularly homogeneous because the graphite sheets are arranged in close contact within the porosities of the cork [23].

3.4. SWASV Analysis

The GrRAC-70% composite sensor produced the best DPASV results for Pb(II) detection and was therefore chosen as the working electrode for evaluating Pb(II) traces by SWASV. Figure 4 shows the SWASV voltammetric responses of Pb(II) under pre-selected experimental conditions: 0.5 M H2SO4 as the supporting electrolyte, −1.2 V as the preconcentration potential, 120 s of preconcentration time plus 10 s of resting time. The stripping voltammetric peaks of Pb(II) ions appeared at −0.44 V for the GrRAC-70% sensor. The peak current (Ip) increased linearly with the concentration of Pb(II) in the range from 1 to 25 µM; the linear regression equation (Ip vs. C) was obtained as
Ip (μA) = (0.4 ± 0.1) × C – (0.8 ± 0.2); R2 = 0.98
The LOD was found to be 0.3 μM. Compared with DPASV, SWASV produced much better results: the regression residuals are randomly distributed around zero and the linearity is practically perfect. Another important point is that no noticeable alterations were noted in the calibration curves recorded on different days, confirming the stability of the GrRAC-70% composite sensor. The GrRAC-70% sensor used in this work remained stable for at least two months of intensive use.
Table 1 collects the results available in the literature and relating to the analysis of Pb(II) with different electrodes and allows a comparison with the results obtained in this study. The ease of sensor preparation and the analytical protocol suggested here offer advantages over the other methods reported.

3.5. Study of the Interferences

In order to evaluate the specificity of the suggested approach, the sensor response in the presence of several potentially interfering species was investigated. In particular, the response to Pb(II) was evaluated in solutions containing 10 µmol/L of the following cations: Fe2+, Na+, K+, Ca2+, Mg2+, Zn2+, Al3+, Mn2+, Cu2+, and Cd2+. No additional signals were recorded when Fe2+, Na+, K+, Ca2+, Mg2+, Zn2+, Al3+, Mn2+, or Cu2+ ions were present in solution during the determination of Pb at different concentrations (Figure 5). Conversely, a well-defined peak signal for Cd2+ was observed at −0.8 V. However, no changes in the Pb current peak were observed for the GrRAC-70% composite sensor in the presence of Cd2+ ions in solution (Figure 5). Therefore, the GrRAC-70% sensor can be used to detect Pb(II) even in the presence of other metals.

3.6. Stability

The stability of GrRAC was previously examined by determining caffeine, obtaining results of good consistency with a relative standard deviation (RSD) of 1.41% (n = 3); this outcome suggested that the cork–graphite composite sensor can be reused. A similar stability assessment was carried out in the case of Pb(II) by recording a series of voltammetric analyses over 10 days. No significant changes in the Pb peak current were observed after five measurements over that time period (Pb(II) = 15 μM; RSD = 1.52%, n = 5). The cork–graphite composite sensor was washed and stored at 25 °C after each experiment.

3.7. Analytical Applications

The effectiveness of the proposed method, for the detection of Pb(II) in real samples, was also tested by analyzing tap water, groundwater, and “produced water” (a brackish water that is extracted as a by-product from underground during the process of oil and natural gas extraction). The electrochemical determination of Pb(II) was based on SWASV in acidic medium. For this, a quantity of Pb(II) was added to the water samples to obtain a well-known concentration between 10 and 50 µM for each sample. Then, the prepared samples were analyzed using the GrRAC-70% composite sensor under the optimized experimental conditions reported in Section 3.4. The validity of the proposed method for the determination of Pb(II) was evaluated using the standard addition method and recovery studies were conducted on the samples. As shown in Table 2, the recoveries ranged from 89 to 115 (n = 3), indicating that the proposed method can be efficiently applied for the detection of Pb(II) in real water samples. In all cases, the relative standard deviation (RSD) values ranged from 0.3 to 2.1%, which confirms that the developed detection approach is potentially applicable.

4. Conclusions

Cork–graphite-based sensors offer a fast, reliable, cost-effective, and simple way to determine Pb(II) in real samples. The composite sensor exhibits higher sensitivity and reproducibility than conventional unmodified graphite sensors, and the low LOD allows for reduced matrix effects in dilute solutions. As for the materials tested, the affinity of the cork with the analyte allowed a substantial improvement in sensitivity. According to the results reported in this work, the sensor obtained by mixing 70% w/w of cork with 30% w/w of graphite allowed obtaining higher voltammetric responses and a rapid detection of Pb(II). The proposed approach is precise, with a limit of quantification of 0.3 μM, reproducible, and less expensive, both in terms of time and materials, compared to other analytical methods. The composite electrode can be applied effectively for the determination of Pb(II) in acidic media. As for the physical and chemical properties, which favor the interactions with the analytes to be detected or/and quantified, more experiments are needed to better understand the chemical and electrochemical processes that occur on the cork–graphite surface when the current is applied or when cork participates as a mediator.
Finally, even if the LOD reported in this work (0.3 µmol L−1) is slightly above the limit established by the WHO (Pb: 0.24 µmol L−1), there is room for improvement; for example, the size of the electrochemical sensor could be reduced, in order to approximate a micro-electrode, while the use of other carbon-based modifiers could allow improving the sensitivity.

Author Contributions

Conceptualization, E.V.D.S. and C.A.M.-H.; methodology, M.V.; formal analysis, I.B.S., S.F., and C.A.M.-H.; investigation, I.B.S. and C.A.M.-H.; resources, C.A.M.-H.; data curation, I.B.S., E.V.D.S., and C.A.M.-H.; writing—original draft preparation, I.B.S. and D.M.d.A.; writing—review and editing, M.V., S.F., and C.A.M.-H.; funding acquisition, D.M.d.A. and C.A.M.-H. All authors have read and agreed to the published version of the manuscript.

Funding

This research was funded by Conselho Nacional de Desenvolvimento Científico e Tecnológico (Brazil), grant number 306323/2018-4, and Fundação de Amparo à Pesquisa do Estado de São Paulo (Brazil), grant numbers 2014/50945-4 and 2019/13113-4.

Acknowledgments

I.B. Silva acknowledges the Coordenação de Aperfeiçoamento de Pessoal de Nível Superior for her fellowship. Financial supports from the Conselho Nacional de Desenvolvimento Científico e Tecnológico (CNPq–306323/2018-4) and from Fundação de Amparo à Pesquisa do Estado de São Paulo (Brazil) (FAPESP 2014/50945-4 and 2019/13113-4) are gratefully acknowledged. The authors also thank V.J.P. Vilar from the University of Porto (Portugal) for providing the cork samples used in this study.

Conflicts of Interest

The authors declare no conflict of interest.

References

  1. Gupta, R. Reproductive and Developmental Toxicology, 1st ed.; Ramesh Gupta, Ed.; Academic Press: Cambridge, MA, USA, 2017. [Google Scholar]
  2. Khoshbin, Z.; Housaindokht, M.R.; Verdian, A.; Bozorgmehr, M.R. Simultaneous detection and determination of mercury(II) and lead(II) ions through the achievement of novel functional nucleic acid-based biosensors. Biosens. Bioelectron. 2018, 116, 130–147. [Google Scholar] [CrossRef]
  3. Pinho, S.; Ladeiro, B. Phytotoxicity by lead as heavy metal focus on oxidative stress. J. Bot. 2012, 2012, 1–10. [Google Scholar] [CrossRef]
  4. Tangahu, B.V.; Sheikh Abdullah, S.R.; Basri, H.; Idris, M.; Anuar, N.; Mukhlisin, M. A review on heavy metals (As, Pb, and Hg) uptake by plants through phytoremediation. Int. J. Chem. Eng. 2011, 2011. [Google Scholar] [CrossRef]
  5. Fan, R.D.; Liu, S.Y.; Du, Y.J.; Reddy, K.R.; Yang, Y.L. Impacts of presence of lead contamination on settling behavior and microstructure of clayey soil—calcium bentonite blends. Appl. Clay Sci. 2017, 142, 109–119. [Google Scholar] [CrossRef]
  6. Chisholm-brause, C.J.; Hayes, K.I.M.F.; Lawrence, A. Spectroscopic investigation of Pb(II) complexes at the γA12O3/water interface. Geochim. Cosmochim. Acta 1990, 54, 1897–1909. [Google Scholar] [CrossRef]
  7. Roto, R.; Mellisani, B.; Kuncaka, A.; Mudasir, M.; Suratman, A. Colorimetric sensing of Pb2+ ion by using ag nanoparticles in the presence of dithizone. Chemosensors 2019, 7, 28. [Google Scholar] [CrossRef] [Green Version]
  8. Krachler, M.; Irgolic, K.J. The potential of inductively coupled plasma mass spectrometry (ICP-MS) for the simultaneous determination of trace elements in whole blood, plasma and serum. J. Trace Elem. Med. Biol. 1999, 13, 157–169. [Google Scholar] [CrossRef]
  9. L’vov, B.V. Fifty years of atomic absorption spectrometry. J. Anal. Chem. 2005, 60, 382–392. [Google Scholar] [CrossRef]
  10. Beltrán, B.; Leal, L.O.; Ferrer, L.; Cerdà, V. Determination of lead by atomic fluorescence spectrometry using an automated extraction/pre-concentration flow system. J. Anal. At. Spectrom. 2015, 30, 1072–1079. [Google Scholar] [CrossRef]
  11. Dai, X.; Wu, S.; Li, S. Progress on electrochemical sensors for the determination of heavy metal ions from contaminated water. J. Chin. Adv. Mater. Soc. 2018, 6, 91–111. [Google Scholar] [CrossRef]
  12. Silva, K.N.O.; Paiva, S.S.M.; Souza, F.L.; Silva, D.R.; Martínez-Huitle, C.A.; Dos Santos, E.V. Applicability of electrochemical technologies for removing and monitoring Pb2+ from soil and water. J. Electroanal. Chem. 2018, 816, 171–178. [Google Scholar] [CrossRef]
  13. Monteiro, M.K.S.; Santos, E.C.M.M.; Silva, D.R.; Martínez-Huitle, C.A.; Dos Santos, E.V. Simultaneous determination of paracetamol and caffeine in pharmaceutical formulations and synthetic urine using cork-modified graphite electrodes. J. Solid State Electrochem. 2020, 18–20. [Google Scholar] [CrossRef]
  14. Araújo, E.G.; Jhones dos Santos, A.; da Silva, D.R.; Salazar, R.; Martínez-Huitle, C.A. Cysteic acid-modified glassy carbon electrode for monitoring oxalic acid (OA) concentration during its electrochemical oxidation at Ti/Pt anode. Electroanalysis 2014, 26, 748–755. [Google Scholar] [CrossRef]
  15. Araújo, E.G.; Oliveira, G.R.; Santos, E.V.; Martínez-Huitle, C.A.; Panizza, M.; Fernandes, N.S. Applicability of electroanalysis for monitoring oxalic acid (OA) concentration during its electrochemical oxidation. J. Electroanal. Chem. 2013, 701. [Google Scholar] [CrossRef] [Green Version]
  16. March, G.; Nguyen, T.D.; Piro, B. Modified electrodes used for electrochemical detection of metal ions in environmental analysis. Biosensors 2015, 5, 241–275. [Google Scholar] [CrossRef] [PubMed] [Green Version]
  17. Palisoc, S.; Vitto, R.I.M.; Natividad, M. Determination of heavy metals in herbal food supplements using bismuth/multi-walled carbon nanotubes/Nafion modified graphite electrodes sourced from waste batteries. Sci. Rep. 2019, 9, 1–13. [Google Scholar] [CrossRef] [PubMed]
  18. Yantasee, W.; Lin, Y.; Hongsirikarn, K.; Fryxell, G.E.; Addleman, R.; Timchalk, C. Electrochemical sensors for the detection of lead and other toxic heavy metals: The next generation of personal exposure biomonitors. Environ. Health Perspect. 2007, 115, 1683–1690. [Google Scholar] [CrossRef] [Green Version]
  19. Koirala, K.; Santos, J.H.; Tan, A.L.; Ali, M.A.; Mirza, A.H. Chemically modified carbon paste electrode for the detection of lead, cadmium and zinc ions. Sens. Rev. 2016, 36, 339–346. [Google Scholar] [CrossRef]
  20. Nery, E.W.; Kundys-Siedlecka, M.; Furuya, Y.; Jönsson-Niedziółka, M. Pencil lead as a material for microfluidic 3D-electrode assemblies. Sensors 2018, 18, 4037. [Google Scholar] [CrossRef] [PubMed] [Green Version]
  21. Palisoc, S.; Gonzales, A.J.; Pardilla, A.; Racines, L.; Natividad, M. Electrochemical detection of lead and cadmium in UHT-processed milk using bismuth nanoparticles/Nafion®-modified pencil graphite electrode. Sens. Bio-Sens. Res. 2019, 23, 100268. [Google Scholar] [CrossRef]
  22. Batista, L.C.D.; Santos, T.I.S.; Santos, J.E.L.; da Silva, D.R.; Martínez-Huitle, C.A. Metal Organic Framework-235 (MOF-235) modified carbon paste electrode for catechol determination in water. Electroanalysis 2021, 33, 57–65. [Google Scholar] [CrossRef]
  23. Monteiro, M.K.S.; Paiva, S.S.M.; da Silva, D.R.; Vilar, V.J.P.; Martínez-Huitle, C.A.; Dos Santos, E.V. Novel cork-graphite electrochemical sensor for voltammetric determination of caffeine. J. Electroanal. Chem. 2019, 839, 283–289. [Google Scholar] [CrossRef]
  24. Henrique, J.M.M.; Monteiro, M.K.S.; Cardozo, J.C.; Martínez-Huitle, C.A.; da Silva, D.R.; Dos Santos, E.V. Integrated-electrochemical approaches powered by photovoltaic energy for detecting and treating paracetamol in water. J. Electroanal. Chem. 2020, 876, 114734. [Google Scholar] [CrossRef]
  25. Pintor, A.M.A.; Ferreira, C.I.A.; Pereira, J.C.; Correia, P.; Silva, S.P.; Vilar, V.J.P.; Botelho, C.M.S.; Boaventura, R.A.R. Use of cork powder and granules for the adsorption of pollutants: A review. Water Res. 2012, 46, 3152–3166. [Google Scholar] [CrossRef]
  26. Gil, L. New cork-based materials and applications. Materials 2015, 8, 625–637. [Google Scholar] [CrossRef] [PubMed] [Green Version]
  27. Marat-Mendes, J.N.; Neagu, E.R. The study of electrical conductivity of cork. Ferroelectrics 2003, 294, 123–131. [Google Scholar] [CrossRef]
  28. Danzer, K.; Currie, L.A. Guideline for calibration in analytical chemistry—Part 1. Fundamentals and single component calibration. Pure Appl. Chem. 1998, 70, 993–1014. [Google Scholar] [CrossRef]
  29. Currie, L.A. International Union of Pure and Applied Chemistry Nomenclature in Evaluation of Analytical Methods Including Detection and Quantification Capabilities. Pure Appl. Chem. 1995, 67, 1699–1723. [Google Scholar] [CrossRef]
  30. Desimoni, E.; Brunetti, B. About estimating the limit of detection of heteroscedastic analytical systems. Anal. Chim. Acta 2009, 655, 30–37. [Google Scholar] [CrossRef] [PubMed]
  31. Brunetti, B.; Desimoni, E. Voltammetric determination of vitamin B6 in food samples and dietary supplements. J. Food Compos. Anal. 2014, 33, 155–160. [Google Scholar] [CrossRef]
  32. Pintor, A.M.A.; Vieira, B.R.C.; Brandaõ, C.C.; Boaventura, R.A.R.; Botelho, C.M.S. Complexation mechanisms in arsenic and phosphorus adsorption onto iron-coated cork granulates. J. Environ. Chem. Eng. 2020, 8, 104184. [Google Scholar] [CrossRef]
  33. Pintor, A.M.A.; Silvestre-Albero, A.M.; Ferreira, C.I.A.; Pereira, J.P.C.; Vilar, V.J.P.; Botelho, C.M.S.; Rodríguez-Reinoso, F.; Boaventura, R.A.R. Textural and surface characterization of cork-based sorbents for the removal of oil from water. Ind. Eng. Chem. Res. 2013, 52, 16427–16435. [Google Scholar] [CrossRef]
  34. Monteiro, M.K.S.; Da Silva, D.R.; Quiroz, M.A.; Vilar, V.J.P.; Martínez-Huitle, C.A.; Dos Santos, E.V. Applicability of cork as novel modifiers to develop electrochemical sensor for caffeine determination. Materials 2021, 14, 37. [Google Scholar] [CrossRef]
  35. Morante-Zarcero, S.; Pérez-Quintanilla, D.; Sierra, I. A disposable electrochemical sensor based on bifunctional periodic mesoporous organosilica for the determination of lead in drinking waters. J. Solid State Electrochem. 2015, 19, 2117–2127. [Google Scholar] [CrossRef]
  36. Salmanipour, A.; Taher, M.A. An electrochemical sensor for stripping analysis of Pb(II) based on multiwalled carbon nanotube functionalized with 5-Br-PADAP. J. Solid State Electrochem. 2011, 15, 2695–2702. [Google Scholar] [CrossRef]
  37. Oularbi, L.; Turmine, M.; El Rhazi, M. Electrochemical determination of traces lead ions using a new nanocomposite of polypyrrole/carbon nanofibers. J. Solid State Electrochem. 2017, 21, 3289–3300. [Google Scholar] [CrossRef] [Green Version]
  38. Baś, B.; Jakubowska, M. The renovated silver ring electrode in determination of lead traces by differential pulse anodic stripping voltammetry. Anal. Chim. Acta 2008, 615, 39–46. [Google Scholar] [CrossRef] [PubMed]
  39. Al-Gahouari, T.; Bodkhe, G.; Sayyad, P.; Ingle, N.; Mahadik, M.; Shirsat, S.M.; Deshmukh, M.; Musahwar, N.; Shirsat, M. Electrochemical sensor: L-cysteine induced selectivity enhancement of electrochemically reduced graphene oxide–multiwalled carbon nanotubes hybrid for detection of lead (Pb2+) ions. Front. Mater. 2020, 7. [Google Scholar] [CrossRef] [Green Version]
  40. Ghanei-Motlagh, M.; Taher, M.A. An electrochemical sensor based on novel ion imprinted polymeric nanoparticles for selective detection of lead ions. Anal. Bioanal. Chem. Res. 2017, 4, 295–306. [Google Scholar] [CrossRef]
  41. Rahm, C.E.; Torres-Canas, F.; Gupta, P.; Poulin, P.; Alvarez, N.T. Inkjet printed multi-walled carbon nanotube sensor for the detection of lead in drinking water. Electroanalysis 2020, 32, 1533–1545. [Google Scholar] [CrossRef]
Figure 1. DPASV curves recorded for different concentrations of Pb(II) in (a) 0.1 M acetate buffer (pH 4.5), (b) 0.5 M NaNO3, and (c) 0.5 M H2SO4. Lead concentrations: (a) 0, (b) 1.2, (c) 2.4, (d) 4.8, (e) 7.1, (f) 9.5, (g) 11.8, (h) 14.0, (i) 16.3, (j) 18.6, (k) 20.8, (l) 25 µM. Inserts: plots of the electrochemical response, in terms of current, as a function of the lead concentration.
Applsci 11 02355 g001
Figure 2. Effect of the preconcentration time on the quantification of Pb(II) ions by DPASV, using the GrRAC-70% composite sensor. Experimental conditions: 25 µM of Pb(II) (n = 10; R2 = 0.98; p = 95%). Reduction potential: −1.2 V (vs. Ag/AgCl); scan rate: 50 mV s−1; potential range: −1.0 to 0 V. Supporting electrolyte: 0.5 M H2SO4.
Applsci 11 02355 g002
Figure 3. DPASV curves recorded for different concentrations of Pb(II) with (a) GrRAC-10%, (b) GrRAC-70%, and (c) GrRAC-90%. Lead concentrations: (a) 0, (b) 1.2, (c) 2.4, (d) 4.8, (e) 7.1, (f) 9.5, (g) 11.8, (h) 14.0, (i) 16.3, (j) 18.6, (k) 20.8, (l) 25 µM. Inserts: plots of the electrochemical response, in terms of current, as a function of the lead concentration.
Applsci 11 02355 g003
Figure 4. SWASV curves of GrRAC-70% recorded for different concentrations of Pb(II) in 0.5 M H2SO4: (a) 0, (b) 1.2, (c) 2.4, (d) 4.8, (e) 7.1, (f) 9.5, (g) 11.8, (h) 14.0, (i) 16.3, (j) 18.6, (k) 20.8, (l) 25 µM. Inserts: plots of the electrochemical response, in terms of current, as a function of the lead concentration.
Applsci 11 02355 g004
Figure 5. SWASV curves of GrRAC-70% recorded for different concentrations of Pb(II) in 0.5 M H2SO4 in the presence of a fixed concentration of interfering metal ions (10 µmol/L).
Applsci 11 02355 g005
Table 1. Comparison of the analytical parameters of the sensors reported in the literature for the determination of Pb(II).
ElectrodesMethodElectrolyteLinear Range
µM
LOD/µMRef.
MTZ-PMO-S-S 1SWASV0.2 M HCl0.01–100.024[35]
5-Br-PADAP/MWCNT 2DPA0.1 M acetate buffer0.9–1140.5[36]
PPy/CNFs/CPE 3SWASV0.1 M acetate buffer0.2–1300.05[37]
SRE 4DPASV0.01 M HNO3 + 0.01 M KCl0.01−0.10.02[38]
Glassy carbonADSV0.5 M NaNO3 0.5[12]
ErGO–MWNTs–L-cys 5DPASV0.1 M acetate buffer0.2–400.05[39]
CPE modified with IIP-MWCNTs 6DPSV0.1 M acetate buffer3–550.5[40]
IJP-MW-CNT 7SWASV0.1 M acetate buffer5–200.05[41]
GrRACSWASV0.5 M H2SO41250.3This work
1 Mercaptothiazoline-disulfide-bridged periodic mesoporous organosilica. 2 2-(5-bromo-2-pyridylazo)-5-diethylaminophenol modified multiwalled carbon nanotube electrode. 3 Nanocomposite of polypyrrole (PPy) and carbon nanofibers (CNFs)-modified carbon paste electrode (CPE). 4 Silver ring electrode. 5 Electrochemically reduced graphene oxide–multiwalled carbon nanotubes–L-cysteine. 6 Carbon paste electrode (CPE) modified with ion-imprinted polymer nanoparticles and multiwalled carbon nanotubes. 7 Inkjet-printed multiwalled carbon nanotubes.
Table 2. Pb(II) content in real water samples, measured with SWASV using the GrRAC-70% composite sensor.
SamplePresent Method 1Pb2+ Added (µM)Pb2+ Found (µM) 1Recovery (%)
GroundwaterNot detected1011.5 ± 0.3115
5052.1 ± 1.8104
Tap waterNot detected1010.8 ± 0.5108
5050.4 ± 1.5100
Produced water12.0 ± 0.4 µM1019.6 ± 0.589
5060.3 ± 2.197
1 Mean of three determinations ± standard deviation.
Publisher’s Note: MDPI stays neutral with regard to jurisdictional claims in published maps and institutional affiliations.

