1. Introduction
Recently, software systems have been structured as several different components which communicate to accomplish software tasks. Due to some limitations, testing of these components may end up very costly or time-consuming. One of the limitations is the unavailability of other internal or external requisite components for testing any of components. This limitation can lead to a delay in the delivery of the components to the time when all of them are developed. This example illustrates one of the situations when all the requisite components are from one vendor. Using different vendors for the requisite components can cause the problem of testing to be even more severe.
Continuous delivery is one of the approaches in software engineering to deliver higher quality software faster [
1]. Embracing continuous delivery reduces the integration cost which makes the continuous integration plausible. Continuous integration requires the continuous testing of the components every time they are either developed or changed. For the continuous testing of each component, all the requisite components need to be present regardless of their development status.
Several approaches aimed to provide the required components and environments ready for testing each component. The first approach is the commonly used mock objects such as stubs [
2,
3]. The server-side interactive behaviour of each requisite component is simulated in this approach by coding them in specific languages. This manual coding needs to be repeated every time each component is being modified.
Virtual machines tools such as VirtualBox and VMW are are the second commonly used approach which aims to provide a platform to install multiple server systems [
4]. This approach requires the availability of the server systems to be installed on the virtual machines, which may not be accessible in some situations. The need for the real service resource for the installation causes the method to suffer from scalability issues, which limits the number of systems that can be installed on one system.
Another approach to alleviating the high system resource demand in hardware virtualisation is container technologies such as Docker [
5]. In comparison to other hardware virtualisation approaches, this solution requires fewer system resources and provides protected portions of the operating system; therefore, it can set up a lighter testing environment with higher scalability. However, this method still suffers from scalability limitations.
Service emulation [
6,
7] is a slightly recent approach which tries to replace each requisite component with its behaviour estimation. This estimation is meant to be executable and very light-weight. This solution is used to target a specific component’s characteristics for the specific quality test and ignore the rest. Emulating each component in this approach requires the functionality information of each component and an expert’s manual configuration. The components’ functionality information may not be available in components with intricate behaviour.
To alleviate some of the service emulation limitations, the idea of service virtualisation (SV) [
8] was proposed. SV aims to get information about components’ behaviour directly from their network interactions. By utilising tools such as Wireshark [
9], this method can record the components’ network interactions. Then, instead of human experts, it aims at using machine learning techniques to drive light-weight executable component models [
3,
8,
10,
11,
12]. Record-and-replay technique is another term used for the SV solution. This is because, in responding to a live request, the proposed SV tries to find the most similar request from those that have been recorded before and substitute some of its response fields to make it compatible with the new request.
Figure 1 visualises the record-and-replay concept.
The referenced SV solutions cover some simple stateless protocols that do not require more than the current request to generate an accurate response message. To accommodate stateful protocols—when the response message requires not only the current request but also the previous relevant messages—there are a few methods proposed by Enişer and Sen [
13] and Farahmandpour et al. [
14,
15]. However, the long short-term memory (LSTM) based method presented by Enişer and Sen to cover stateful protocols needs a long time and lots of resources to train.
These were the research efforts that directly contributed to the development and improvements of SV approaches. In contrast to the limited number of solutions within the SV field, there is a huge body of work that indirectly contributes to this area of the research. As a result, the rest of this paper provides an overview of different research efforts that can directly or indirectly contribute to the software virtualisation solution in a component based structure.
2. Related Work
Discovering or mining software/service behaviour turned into an area of focus in several domains of software engineering. As a result, several efforts have been devoted to the advancement of techniques to fulfill this. Software behaviour mining is concerned with the discovery of message formats, control, data and multi-service dependency facets of software services from their execution logs or network interactions.
Service virtualisation provides a promising way to provision a realistic testing environment by modelling the approximate interactive behaviour of individual real software systems. Modelling of services can be derived using the service descriptions [
6,
7] or other automatic techniques [
16] as a black-box approach. This black-box without looking into the service implementation or description by analysing the recorded interaction traces can achieve a similar outcome. Automatic service virtualisation includes analysing service interaction traces and deriving executable models for the services without requiring any knowledge about the services or their protocol message format. This process can lead to the emulation of a much wider range of protocols and services. This paper surveys existing methods of discovering models from a requisite service interacting with the service under the test (SUT). These methods analyse the SUT’s interaction traces and take into account the dependencies and mutual impacts between their traces.
SUT is interacting with the requisite service by sending and receiving network messages. The goal is to emulate/replicate the requisite service to generate the same messages, as is generated by the requisite service in response to the request messages sent by the SUT in a real environment. The generated response messages in virtual service need to satisfy three different aspects to be considered similar to a real service. The first aspect is the format of the messages, the second is having the same header information, and the third is containing the payload as expected. Virtualising requisite services can help with testing the SUT without connecting to the real requisite service and without the effort of specifying service descriptions.
The aim of virtualising a service is modelling the interactive behaviour of enterprise software systems to enable mimicking their run-time properties. Software services or components cooperate with each other through sending or receiving messages, regularly with the assumption that one service sends a request to other services, looking to receive a response (or multiple responses) in a short time period. Functional behaviours of virtualised services need to be precise as the service’s characteristics [
7].
There are four key aspects that need to be considered in order to mimic the full interactive behaviour of the requisite service. Firstly, the structure of messages have to be well-formed and adhere to their format in the protocol as they are generated by the actual requisite service, secondly, generating protocol-conformant header information [
16]. This means sending service response messages that contain acceptable and expected header information such as response types. Thirdly, generating payload-conformant messages indicates that the content of the response message generated has to be identical with the actual payload. Last but not least is the multi-service dependencies which focus on control and data model dependencies between distributed services and try to incorporate them into the service’s behaviour.
As a result, the relevant literature is classified into four different areas, i.e., message format is discussed in
Section 3, control model (temporal ordering) which is explained in
Section 4, the data model will be reviewed in
Section 5, and multi-service dependencies explained in
Section 6. In the following sections, we introduce and analyse each area in detail.
4. Control Model
This section discusses existing methods for extracting the temporal ordering or control model of services from their logs. These methods analyse the network interactions of service with other services or its internal execution logs as the only external recorded documents of the system’s behaviour and extracts the service’s temporal behaviour in the form of a state machine. Following the state machine in these approaches, the next behaviour of the system is determined based on the previous behaviour of the system from the start of the session/interaction to the current point. Some other methods use deep learning methods to infer the next message or legitimate fields and values. The resulting control model for the service helps to identify the type of response messages for the incoming request messages.
4.1. Inferring Control Models from Network Interaction Logs
The following studies try to infer the protocol model of software systems from different network interaction logs such as tcpdump file, etc. The methods try to extract the temporal order of message occurrences in the logs.
Some of the existing methods first construct a finite state machine (FSM) of the protocol, from the raw traces without pre-processing the messages or prior knowledge about the structure or type of the messages. Instead, they try to identify the equivalent states by comparing different messages to generalise the inferred model. ScriptGen [
26] generates a FSM which includes all the messages of the traces. Each edge in the FSM is for a request message and each node for a response message. In order to generalise and abstract the FSM, it uses macro-clustering and micro-clustering to identify semantically similar messages. It uses the Protocol Informatics (PI) method on the request messages of outgoing edges of each node, to identify the major classes of messages (macro-clustering). Then, it proposes the Region Analysis algorithm to produce microclusters. To generate a script, it then infers dependencies between the client messages and corresponding server responses by using Random Regions analysis.
Leita et al. [
37] improved ScriptGen and proposed new algorithms to emulate the behaviour of systems under attack by handling two distinct types of dependencies as intra and inter-protocol dependencies. Their method also introduces a new proxying algorithm to tunnel to a real server and proxy the live traffic between the real server and its attackers up-to-date and adjust the current state machines model. For Intra-protocol dependencies, it uses two techniques, generating links and consolidating them, to handle content dependencies. Link generation analyses each conversation separately and makes optimistic estimates on the content dependencies that might be correct or coincidental matches. Consolidation makes use of the statistical variability to consolidate the proposals produced by link generation. Inter-protocol dependencies such as session interleaving and exploiting, generate connections in the interaction of several TCP sessions. The causality between identified sessions is emulated by using a signalling method between their state machines.
Prospex was introduced [
24] to automatically extract a protocol specification as state machines in the absence of any prior protocol knowledge. It infers a state machine that models the message types sent and received by first building an initial deterministic finite-state automaton (DFA) from the observed traces utilising the inferred message format. Then, it extracts prerequisite message types for each state and uses domain-specific heuristics to label states as identical (states with similar application conditions) and minimise and generalise the DFA by applying the Exbar algorithm. Exbar [
38] is an exact algorithm for minimal consistent DFA inference.
The rest of this section discusses methods that first cluster messages and identify different types of messages or assume that they have access to the operation code (opcode or message type). Then, they consider opcodes of the messages as representatives of messages and try to model the order of their occurrences as an FSM. Network Protocol Reverse Engineering (NPRE) [
18] has been proposed to automatically create a protocol state machine of the peers involved in the communication. The nodes in the FSM represent different messages with different values of the relevant fields. It starts with building the initial state machine where each sending or receiving of a message leads to changing the state. Then, the initial state machine is compared with network traces by using a sliding window of three and the state machine is split where it causes a non-existing sequence of three messages. As the last step, it parses the traces with the state machine and keeps the transitions visited at least once.
PRISMA [
28] method infers a protocol state machine using the Markov model to determine message ordering of the network traffic. First, it discovers discriminating features of the messages using sub-strings of fixed length n (n-gram)/token and statistical test-driven methods to reduce the extracted n-grams that are less frequent. Then, it groups messages into different types using part-based or position-based clustering. Next, it infers the minimised Markov model of the sequence of messages in sessions where the state represents a message type. Lastly, it generates the templates for the messages associated with each state of the Markov model and derives information flow rules between different states.
A scalable framework that infers protocol specifications in the form of FSMs without any prior information was presented by Yong et al. [
34]. The protocol keywords are identified before the finite state construction to improve the framework’s efficiency. It constructs two FSMs: Language FSM or L-FSM for the protocol language and Session FSM or S-FSM to show protocol sessions’ state transitions. Nodes in the S-FSM are states, and transitions are different types of messages assigned to one path of L-FSM. The initial FSM stores all input sessions. At the generalisation step, the states with the same language type are merged into one state node, and the associated transition paths are updated. The framework was tested to extract the protocol information of both binary and text protocols.
SpecMiner [
10] automatically extracts the temporal behavioural model from interaction traces. It assumes that all message types are identified. To improve the precision of the initially mined finite state automata (FSA), it uses a heuristic-driven generalisation method, which considers loop, cycle, multi-loop and intra-trace state merging to generalise a derived FSA and minimise over-generalisation. SpecMiner achieves better results compared to the existing FSA-based specification miners such as k-tail [
39] and Synoptic [
40]. In addition, it applies the Ullman–Hopcroft minimisation algorithm to merge the generalised traces, to allow a state merge without changing the FSA properties.
Antunes et al. [
35] presented an automatic method to complete an available protocol specification, with potential extensions as implied in interaction traces. Their method analyses the contents of the message in the network traces and makes use of the former specification version. After extracting the FSM of the protocol language (message format), it parses message traces and, for every new message, adds a new transition and a new state as an extension to the existing protocol FSM model. For generalising the protocol extensions, their method uses the ReverX method to compact the extensions. Their method is limited to application-level text-based protocols.
Aichernig et al. [
41] employed a long short-term memory (LSTM) neural network technique to infer a model for any legitimate network protocol. Their method uses a neural network with two hidden layers, each with 128 neurons in each layer. It embeds the messages in a 64-dimensional continuous space. The model can process large vocabularies successfully, allowing the consideration of more complex protocols and more detailed abstractions. It takes prefixes of random length and lets the model predict the next message.
A deep learning-based approach is proposed in [
42] to develop an effective and flexible Network Intrusion Detection System (NIDS) by employing self-taught learning (STL) [
43], a deep learning-based technique that uses sparse coding to construct higher-level features using unlabelled data. A sparse auto-encoder and softmax regression classification based NIDS was implemented to learn normal/anomaly behaviour. It identifies important features (fields and values) and ranks them using deep learning to classify traffic as normal or attack. The deep learning structure learns the true model of the network in the training phases, and the test phase can recognise the traces that deviate from that model.
The basic idea of Arafat et al. [
44] is to infer the service’s state models to enhance the playback in virtualised services. It has three phases as analysis, model inference and run-time. It defines an event as a specific/unique request-response message type pair and event series as the sequences of events related to specific service at the analysis phase. Then, at the model inference phase, it infers the state model of each service from its event sequences using k-tail (K = 0). The run-time phase, upon receiving a request, uses the inferred state model and its current state of the service to specify the response type. Then, it synthesises response message by dynamic substitution of the nearest matching request type among the interactions. However, this research has improved state of the art of current service virtualisation (opaque SV), in considering the contextual information in generating the type of the response message, but it does not consider the contextual information in generating response content.
Kobayashi et al. [
45] proposed a technique for extracting contextual information in network logs by integrating a graph-based causal inference algorithm and a pruning method on the basis of both the layer-2 and layer-3 network topology domain knowledge along with log events’ functional layers. The proposed method applied to a set of log data illustrated that the pruning method reduces processing time and detects more relevant troubleshooting information compared to the available methods.
Table 3 shows a summary of the introduced methods that infer control model from network logs.
4.2. Inferring Control Models from Program Internal Interactions Logs
Some of the related work uses process execution traces to discover a set of temporal rules with statistically significance and then generates automata using the mined rules to minimise imprecise process generalisations. Others infer finite state automata from the execution log and then try to generalise and abstract the model.
Process mining [
46] is a service mining technique. It aims to discover, monitor and enhance real-world business processes by extracting event logs’ knowledge available through recording activities inside services or interactions between services. Process mining has achieved a good state in mining the behaviour of services by inferring temporal models from the logs.
A semi-automatic, end-to-end approach was presented by Lu et al. [
47] for analysing event data in a relational database of an ERP system for uncommon executions. It identifies an artifact-centric process model explaining the business objects, their life cycles and how the different objects interact through their life cycles. Using the CreateTraceMapping algorithm, it can obtain generic artifact types. It discovers and classifies interactions between artifacts into strong, weak and invalid artifact type-level interactions (ARTIs). It uses a graph with nodes as artifact instances and edges as relations, to identify strong ARTIs through a depth-first-search of the graph. Indirect ARTIs considered as weak that made by merging two ARTIs who share the same child. The paper discovers all interactions and separate frequent interactions as the main flow by using different classification methods from infrequent interactions as outliers.
A dynamic approach to infer temporal characteristics automatically from execution traces on the basis of a set of property pattern templates is presented by Yang and Evans [
48]. The main contribution of the work is proposing a set of additions to the response property pattern (the cause–effect relationships between two abstract events) and an algorithm that can automatically deduce the strictest patterns that are satisfied by a set of events with a given scope. The method starts with instrumenting a program and executing it with multiple test suites. Then, it instantiates candidate temporal property patterns and calculates the satisfaction ratio table for each candidate pattern on the basis of the execution traces. Next, it infers the strongest pattern satisfied by each set of events and adds scope limitation for each pattern. The final validation of the inferred patterns is done by the user.
Steering [
49] is a framework to discover temporal properties automatically in the structure of future and past-time temporal rules to steer the generation of FSA. It first processes the execution traces to learn a set of temporal rules which are statistically significant. It considers temporal rules with precondition events having the support of 20% and post-condition events having the confidence of 100%. In the automata learning phase, it generates automata utilising the rules extracted to minimise inaccurate generalisations. It avoids overgeneralisation through incrementally refining the initial automaton, i.e., merging likely equivalent states only if it does not violate any temporal properties inferred. To check the refined FSA against temporal properties, it presents two algorithms called “Sound and complete” and “Sound and incomplete” that can be chosen based on the trade-off between performance and accuracy. Their technique increases the precision of the classic k-tail method [
39] without loss of recall.
Synoptic [
40] is another approach that uses invariants to improve the precision of the inferred temporal model. It infers the model as a directed graph where states are operation types and edges are valid invocations. In addition to the temporal rules used by Steering (i.e., pre (a always precedes b) and post (a always followed by b)), it uses an additional invariant, i.e., (a never followed by b). This extra invariant leads to the derivation of better models in comparison to the Steering method because it can identify counter-examples. Then, it applies a hybrid refinement and coarsening algorithm named BisimH to search the models’ space and merge partitions using k-tail-equivalence with k = 0 and those which do not violate the satisfied invariants.
SpecForge [
50], an automated specification mining approach, takes advantage of four existing FSA-based specification miners such as k-tail [
39], Contractor++, SEKT and TEMI [
51] in order to get a better result. SpecForge disintegrates FSAs that are built by available miners into simple constraints using a set of six constraint templates. It then extracts common constraints among the inferred FSAs. The three additional temporal constraints (compared to Synoptic [
40] ) are (a always immediately followed by b), (a never immediately followed by b), and (a always immediately preceded by b). It then removes the outlier constraints and combines the remaining constraints back together into a single FSA by considering intersection over the selected constraints from different FSAs.
A system interaction log may be extremely large to analyse, consequently, defining a stopping criterion to specify “enough” traces have been seen, [
52] could be considered as a solution. Statistical analysing of the log can be used to reduce the computation cost substantially while maintaining very reliable results by calculating statistical guarantees. Instead of analysing the entire log, it samples events by applying statistical log analysis to address scalability in behavioural log mining algorithms.
To derive a rich semantic meaning and process-specific features, Nguyen et al. [
53] present logs as a heterogeneous information network (HIN), a directed graph containing multiple nodes and edge types. They propose SeqPathSim, a meta path-based measure of similarity for HIN to cluster traces. The SeqPathSim uses the rich semantic relationship between nodes captured by PathSim and the sequential similarity between traces captured by an edit-distance based method. They also use an optimisation approach to propose a new dimension reduction method to mitigate the efficiency limitations of an edit-distance based method. The optimisation function maximises both topical similarity and process model-based relationships between events of the same dimension by using an objective function and bottom-up greedy approximation. In addition, to address computational scalability of the logs, it combines the event similarity with the regularisation of a process model structure.
Lo et al. proposed SMArTIC [
49], which is an architecture for mining software specification with a trace filtering and clustering approach to enhance the accuracy, validity and scalability of specification miners before inferring the finite state machine. It filters traces by pruning erroneous traces and transforms them into regular expressions using Sequitur. Then, it clusters traces using k-medoid, to determine the number of clusters K, and the sequence alignment method in order to localise inaccuracies and reduce over-generalisation in learning. Next, it constructs PFSA using Sk-string for each cluster and finally merges the generated PFSA of all clusters.
The method presented by Jong [
54] is complementary to the static software architecture reconstruction approaches, which provides insight into the actual concurrent behaviour of software by visualising the system execution log. The visualisation approach consists of two parts: the hierarchical architecture model (HIM) and process models created from these interactions. HIM contains a visualisation of the components of a system, their structure and interactions derived from software execution data.
A summary of the introduced methods of inferring control model from program internal interaction logs is shown in
Table 4.
4.3. Summary
Some of the approaches reviewed in this section extract a temporal behavioural model of a system as temporal invariants from their network interactions or internal execution logs or both of them. They use different temporal patterns to capture the system’s behaviour, including always occurrence, immediate occurrence, non-occurrence, etc. Each of the statistically significant constraints are kept as building blocks of FSA and others are considered as outliers. Moreover, most of the papers discussed consider the inferred invariants in the global scope, i.e., the whole event trace needs to match the inferred constraints. There is also an example that defines a local region as the scope of the extracted pattern.
Existing studies try to mine and model services’ behaviour in the form of FSA based on two types of approaches. The first group, Comparetti et al. [
24], Leita et al. [
26,
37], Wang et al. [
34], Trifilò et al. [
18], Antunes [
35], and Kabir and Hun [
10] build an FSA model from the logs (raw/pre-processed) and then try to abstract and generalize the model based on some heuristics or clustering methods. While Beschastnikh et al. [
40], Yang and Evans [
48], Lo et al. [
49], and Le et al. [
50] first infer invariants and refine them based on statistical techniques and then construct FSA. The papers tried to use a variety of methods to refine the FSA. They can be summarised as incrementally refining and merging likely equivalent states without violating the satisfied invariants, using counter-examples to split and refine the model, using domain-specific heuristics to identify similar states to merge, and bottom-up methods such as intra-trace refinement, which starts merging from each cluster of similar traces up to merging between different clusters called inter-trace merging.
As we can see, the existing literature infers a service’s temporal model based on its interaction behaviour with one service, without incorporating different types of dependencies to generate all the message payload required to virtualise a service’s behaviour. One service’s behaviour may be affected in different ways by another requisite service. Therefore, we need to expand the existing methods to consider the services’ mutual impacts on each other in generating both exact service response message types and their contents.
5. Data Models
This section surveys research efforts related to inferring data models from logged data. In some studies, data models are referred as data invariants. This section also reviews studies that add the inferred data models/data invariants to the temporal/control model.
The data invariants can help better understand software behaviour. Data dependency between two services can be considered at different levels of granularities. Intra-protocol data dependency are ones that concern data dependency between messages of one protocol. For example, at a more granular level, data dependency between the data fields of a request message and those of its corresponding response message are one type of inter-message dependency and part of the intra-protocol dependency. Such inter-message data dependency can help formulate a response message for a corresponding request message. We note that most of them utilise clustering to differentiate between different pairs of request–response messages.
Predator [
34] generates dynamic responses to the real-time incoming requests. It uses the iterative k-medoids algorithm and TF/IDF (Term Frequency/Inverse Document Frequency) cosine similarity as a distance metric to cluster pairs of requests and corresponding responses based on their requests. Then, it builds the request and response models for each medoid in the form of Markov models. The response language models are trained with the corresponding requests to find contextual dependency between data fields using the Needleman–Wunsch string alignment algorithm.
Another work that tries to discover data dependency between request and response messages is Du et al. [
12,
21,
23], which uses BEA and visual assessment of (Cluster) tendency or VAT clustering algorithms to cluster the recorded messages. They use centre-only or whole cluster approaches to compare the incoming request to find the nearest cluster (type) request to use for corresponding response generation. The symmetric and dynamic fields of its corresponding response, which were identified using the Needleman–Wunsch byte stream alignment algorithm, are replaced with the corresponding fields from the request message. Roleplayer [
19] uses the Needleman–Wunsch sequence alignment algorithm to check and relate two dialogue instances of the same type, finds dynamic fields, and determines which fields need to be changed to successfully replay one side of the session. The sample dialogues and dynamic fields discovered are used to generate the script for replaying (as client or server) dialogues with the same flow as the training samples.
In another attempt to extract data dependency at different granularity levels, Ernst et al. [
55] presented Daikon, a dynamic technique for discovering data-driven invariants from execution traces. The technique executes a program on a set of inputs and extracts the invariants from the captured variable traces. Daikon’s aim is to extract invariants over any variable, invariants over a single numeric variable, invariants over three numeric variables, invariants over a single sequence variable, invariants over two sequence variables, invariants over a sequence, and a numeric variable. The data relationships that Daikon tries to extract are linear relationships between invariants, comparison, range limit, ordering comparison, constant values, membership, etc. The method also computes invariant confidences to identify non-coincidental invariants. It analyses scalability problems such as invariant identification time and accuracy as a function of test suites and instrumented program points.
Combining different perspectives to create complete process models was discussed by van der Aalst [
56]. First, his method obtains an event log to create or discover a process model. It considers control flow as the starting point and tries to connect events in the log to activities in the model. After that, it extends the model by adding either organisational/resource perspective, time perspective or case/data perspective.
Lorenzoli et al. [
57] presented the GK-tail to combine data model and control model. It uses Daikon [
55] to extract the constraints on data values and infers EFSM (extended FSM) by labelling FSM edges with data value conditions. It models the interaction between data values and component interactions and generates a behaviour model of the software system from interaction traces. It uses three merging/subsumption criteria to make the model more effective, compact and generalised, even when it does not have access to such data to mine the behavioural models. It consists of four steps (1) merging input-equal traces, (2) generating predicates related to traces using Daikon, (3) creating an initial EFSM and (4) merging equivalent states to obtain the final EFSM.
GK-tail+ [
58] infers guarded finite state machines from the execution traces of object-oriented programs. In comparison to GK-tail, it postpones the extraction of the data model constraints until after the generalisation of the FSM. It substantially reduces the GK-tail’s inference time while producing guarded finite state machines with recall and comparability. Its four steps are: (1) merging traces, (2) generating the Initial FSM, (3) merging the states and (4) generating constraints using Daikon.
One promising technique presented by Qin et al. [
59] named Context-based Multi-Invariant Detection (CoMID), which improves the true-positive while reducing the false-positive rates of detected abnormal states in Daikon. CoMID effectively and robustly detects abnormal states, distinguishes different contexts for invariants based on the contextual similarity of execution traces and makes them context-aware. CoMID consists of two steps: context-based trace grouping technique which clusters execution traces collected from different iterations in a program’s execution based on the similarities of corresponding contexts between each pair of execution traces. The second step is multi-invariant detection which conducts ensemble evaluation of multiple invariants only based on the execution traces in each group to detect abnormal states.
To address stateful services, Enişer and Sen [
13,
60] suggested three different methods of creating responses for each request. To generate each response field, their first method uses classification to assign each request and its previous messages to a class of potential values. This method views the fields’ values as categorical data and utilises a classifier to assign the request and historical messages to one of the categories. Their second method uses a sequence-to-sequence technique and employs a specific RNN structure, comprising of two LSTM networks [
61]. To generate each categorical response field, their third method uses a model inference technique called MINT [
62]. MINT is used to deduce flexible and deterministic guarded extended finite state machines (EFSM) which uses random data-classifiers to deduce data invariants for creating the guard variables and combining the states. The RNN takes considerable time for training which explain the usage of GPUs in their work. This method cannot incorporate long-term information into consideration.
To improve the Enişer and Sen methods, in generating numerical response fields as well as incorporating long-term dependencies, CSV was proposed by Farahmandpour et al. [
14]. CSV focused on generating the accurate numeric values of the service response in stateful as well as stateless protocols. CSV operates in two modes of offline and playback. CSV treats each numeric response field of each request type separately. In the offline mode, for each numeric field in the response, it finds a model that more accurately generates its values. It also finds out the suitable response template, the machine learning model to apply, and the relevant number of historical messages to generate an accurate numeric value for each numeric field. Despite its success, it has some limitations. First, it needs the relevant data to each incoming request in playback mode to exist in the training set. In addition, its current version cannot cover the protocols with interactions containing error messages and requests with more than one response type. In addition, it requires a medium-size data set for training the machine learning models which may not exist in commercial applications.
In another attempt, Farahmandpour et al. [
15] to complement their recent work in generating categorical fields in service responses, proposed a method that identifies the request fields that can be used to drive the value of each categorical field based on those that acquire minimum conditional entropy and called them predictor set. Then, the method finds a value for the categorical response field from all the categorical response fields’ values in the historical messages that have the highest joint probability distribution with the predictor values. The proposed method improves existing research by increasing accuracy and reducing complexity and works for both stateless and stateful protocols. It has some limitations such as it cannot incorporate more than one influential message type in generating the categorical fields.
Different methods of inferring data model are summarised in
Table 5.
Summary
Despite the advancement in the inference of the temporal model (control model), few researchers have addressed the problem of discovering data models. The above attempts tried to combine control models and some data invariant models in order to improve the inferred behavioural model. However, the coverage of the inferred data model in terms of the complexity of the model, the type, and the number of parameters are limited and can only reflect a limited range of data types and data dependency in the real environment. There remains a need to design and develop a more comprehensive dependency extraction method, which uses different methods of dependency discovery and different levels of complexity to infer complex data dependency models that describe the inter-dependency between systems.
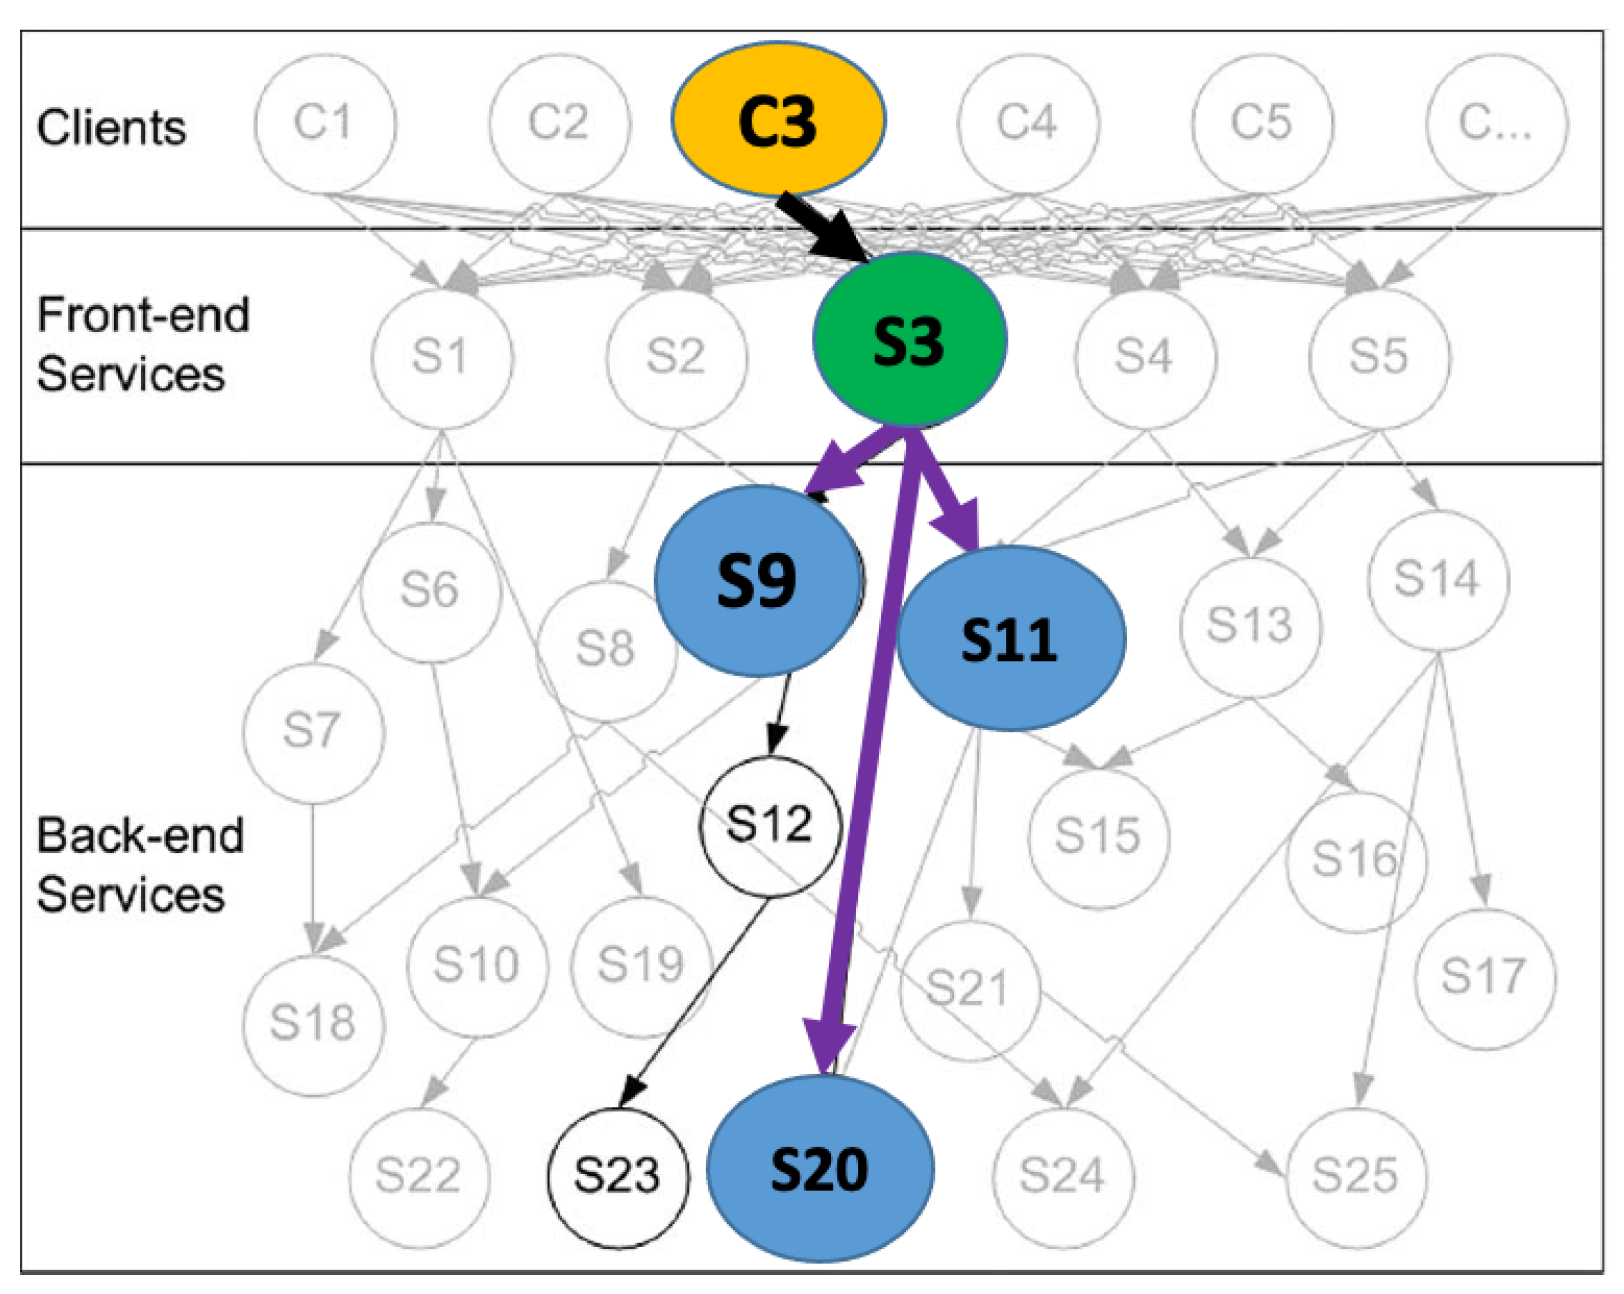
6. Multi-Service Dependency
Looking to find the relevant work in other areas, such as multi-service dependency which could possibly be used to extract more complex dependency between services that can influence service behaviour has resulted in the following insights. As an example shown in
Figure 3 taken from [
63], we can see different dependencies that can influence the behaviour of service S3.
To extract the multi-service dependency model of distributed services, and get the total ordering of the events, the first step is the synchronisation of the services’ clock. In [
64], Lamport examined the concept of one event happening before another in a distributed system and defined a partial ordering of the events. To synchronise a system of logical clocks, a distributed algorithm was introduced, which also can be used to totally order the events. Lamport then derived a bound on how far out of the synchrony the clock can become.
We categorise the related work below based on the type of data that they use to investigate the dependencies. Some of the studies use network-level data, some use application-level data, and others utilise both of them. Depending on criteria such as test goals, needs, and systems and resources access level, different methods are followed. Based on the captured data, they extract dependencies between distributed systems or components at different levels of granularities, and, in most cases, build a dependency graph to show the dependencies, their strength and direction of influence.
6.1. Network Level Data
Some studies attempt to extract dependencies between distributed services components from network level data. The hypothesis of Aiello et al. [
65] is that the behaviour of a collection of hosts are regular and structured. This regular structure can be illuminated and utilised to form models that later become the basis of management policies. The paper defines a community of interests (COI) as a collection of the interacting hosts and introduces two concepts, popularity and frequency, to capture the distribution of the set size and the stability of COI for each host and core COI over time. By using the in-out degree of connections between each host and other hosts, the server client roles of the hosts are identified. For a set of monitored hosts over time, they define the network anomalies as the deviations from the common COI size distribution.
Leslie Graph [
66] is an abstraction method that discovers network dependencies for network management. The edges in the Leslie Graph describe the complex inter-dependencies and nodes represent networks, hosts and application components. It utilises two approaches to discover dependencies using the low-level packet correlation: Constellation is a distributed method and AND (Analysis of Network Dependencies) is a centralised approach. The Constellation method extracts the sending and receiving patterns of each node in a time period. It tries to model the correlation between services using the activity patterns of their sending/receiving channels in a different window of time by using classification methods such as Naive Bayes classifiers and Noisy-OR models. The AND method adds a centralised engine to aggregate and generalises the dependencies in the Leslie Graph by considering long-time processing on all the hosts to obtain better accuracy. Note that the Leslie Graph can express different granularities of dependencies for an activity.
Orion [
67] discovers enterprise service and application dependencies using packet headers (e.g., in IP, UDP, and TCP) and timing information from the network traffic. Chen et al. [
67] proposed a novel analysis technique based on delay spikes, to identify dependent systems through finding typical spikes in their delay distributions. It uses Fast Fourier Transform (FFT) with delay distribution, service and client aggregation, noise filtering with Kaiser window and spike detection, to extract and improve dependency discovery in a significant manner.
Oliner et al. [
68] proposed a method to infer the influences among components in a system. The method constructs Structure-of-Influence Graphs (SIGs), where the nodes are components and edges represent the strength, temporal ordering, and delay of correlations between components. It abstracts components as anomaly signals, calculates components’ normalised cross-correlation and enables noise-robust modelling of diverse systems. SIG is constructed in four steps: (1) identifying the information to be examined from each component, (2) measuring the system’s behaviour during actual operation as anomaly signals, (3) computing the pairwise cross-correlation between all components’ anomaly signals to identify the delay and the strength of correlations, and (4) constructing a SIG graph.
Discovering the behaviour of services and their interactions in the enterprise environment demands the power to carry the relationship between service interaction messages into process instances. Guabtni et al. [
69] provided a lightweight approach that identifies relevant sequences with the equality of two messages’ attributes founded on message indexation and aggregation in order to build a size-efficient Aggregated Correlation Graph (ACG). ACG is a weighted and directed graph created by processing one-by-one messages which are sorted by their total ordering in the interaction log of a service. The ACG graph shows all the ways messages match and relate in the interaction log, not merely for disparate message pairs but also for sequences of messages related to processing instances. The graph utilises user-defined heuristics to assist the experts in effectively identifying the most frequent executed processes from their sequences of correlation conditions.
Motahari-Nezhad et al. [
70] examined event correlations for business processes through the interactions of a set of Web services. They proposed heuristics and algorithms to discover correlated sets of events and empower users to manage it toward interesting process views and set up the discovered process views within a process map. The paper introduces an abstraction algorithm and a tool for semi-automated correlation of process events from the correlations between messages (key-based correlation, reference-based correlation or both). Their approach starts with an event log, and then it discovers instances by correlation condition discovery. The correlation condition discovery starts with atomic conditions and goes to composite conditions. Then, it prunes non-interesting conditions using non-interestingness criteria, user input and feedback. The next step is to find part of/subsumption relationships between process views and then generate the process map and refinement leveraging user information. The report on experiments shows the viability and efficiency of their approach.
Novotny et al. [
63] proposed a new dynamic dependency discovery method designed for dependencies among the components of service-oriented software applications hosted in a mobile ad hoc network (MANET). The method uses dynamic snapshots of dependency relationships identified while observing the service interactions. It discovers inter-service dependencies through activity patterns of the output channel of one service and the input channel of the other services in a time window. Intra-service dependencies are inferred by examining the input and output channel of one service in a time window. Dependent data are collected and aggregated locally and taken to central locations based on the specific condition where it is required. The approach allows engineers to have a trade-off between accuracy and cost.
Zhang et al. [
71] provided an expandable and precise technique of detecting service-level dependency in an enterprise network. This method needs neither application modification nor software installation on corresponding machines. Based on incoming network messages, it distinguishes messages with five tuples (source IP and port, destination IP and port, and protocol) in common, aggregates the identified messages to form transactions linked to individual hosts, and determines delay distributions between services sought from or in response to the individual hosts. Based on the delay distributions, the system makes a distinction between independent service and dependent service pairs and subsequently builds dependency graphs that contain dependency relationships between services from the client and server viewpoint.
The approach proposed by Cai and Thain [
72], which analyse the dynamics of the distributed systems and predicts impacts of one system call propagated both within and across process boundaries where components communicate via socket-based message passing. The approach called DISTIA, which partially orders the distributed method-execution events, then infers causality from the ordered events by utilising the happens-before relation and later exploiting message-passing semantics. DISTIA offers quick results independent of the message-type specification or well-defined inter-component interfaces.
Different methods of inferring multi-service dependency from network data are summarised in
Table 6.
6.2. Application Level Data
The work that will be discussed in this section utilises application-level data to identify the dependent services/components in a distributed environment. Lou et al. [
73] proposed a technique to identify dependencies between a set of distributed components out of system execution console logs. It first parses each log message into its keys and parameters. Next, it finds dependent log key pairs belonging to different components by exploiting the co-occurrence analysis of the keys and their corresponding parameters. Later, it uses the Bayesian decision theory to determine the dependency direction of each dependent log key pair. To remove false positive detection, it applies time delay consistency additionally.
Beschastnikh et al. [
74] presented the CSight (for “concurrency insight”) tool for inferring Communicating FSM (CFSM) models from the execution traces of the concurrent and distributed systems. A CFSM is a set of pre-process FSMs that interact over first-in-first-out (FIFO) channels. CSight uses the ShiVector2 tool to automatically compute and insert vector timestamps into logs of concurrent systems. Then, it mines invariants based on such heuristics as “always followed by”, “never followed by” and “always precedes an event instance”, and creates a concrete FSM. It abstracts the concrete FSM into an initial abstract FSM (AFSM) using a first-k-in-channels partitioning strategy and then converts an AFSM into a CFSM. Next, it checks the CFSM to satisfy the valid invariants using the McScM model checker and refines the model using counter-example guided abstraction refinement (CEGAR) to remove the invariant’s counter-examples.
NetCheck [
75] automatically collects sequences of network system invocations of the application hosts to diagnosis network problems in complex applications. NetCheck diagnoses by (1) ordering the distributed input trace sets, and (2) employing a network model to specify deviation points in the ordered execution where the traces differ from anticipated network semantics. It starts with collecting run-time traces with standard black-box tracing tools, such as strace [
75]. Then, it orders the syscalls using a heuristic algorithm and syscall priorities, originated from the POSIX syscalls dependency graph. To confirm the ordering, it imitates the highest priority call using the network model. It conducts a diagnosis by analysing the model simulation state and each simulation error on the basis of a set of rules and detects deviations from the expected network model.
Popova et al. [
76] proposed a series of methods to discover artifact-centric process models captured in the guard-stage-milestone (GSM) notation, starting from raw logs consisting of a flat collection of event records. It extracts lifecycle models of several artifacts that are related to each other in the form of 1-to-n and m-to-n fashion. It discovers relationships between entities, starting by extracting the event table, finding candidate keys, designating a primary key per entity, clustering tables into entities and identifying foreign keys. Then, it discovers artifacts by identifying entity precedence relations and designating artifact types. The presented methods are implemented as a package for ProM, a generic open-source framework for process mining.
CloudScout [
77] automatically identifies dependent service components and facilitates latency reduction for networked and distributed applications. It collects, normalises and filters monitored data such as the number of TCP/UDP connections and resource usage measures (e.g., CPU, memory, I/O, and network usage). It computes the distance between each service component pairs and clusters the service components to identify service dependencies. It calculates service distance by classifying the state of a service component as one of three possible states as dormant, stable, or active, and develops an iEntropy technique to specify each resource metric’s weight in the service distance calculation. Then, an enhanced hierarchical and iterative K-means clustering algorithm, called HiKM, is used to cluster dependent services.
To automatically infer the run-time distributed state properties of the distributed systems in a general setting where clocks are not synchronised, Grant et al. [
78] proposed Dinv. Their method utilises static and dynamic program analyses to deduce relations between different nodes’ variables which can imply the correctness of the developed systems. Dinv can be seen as an automated analysis technique which first identifies the distributed state. Second, it instruments the state and records the system at run-time. Third, it combines the recorded run-time using three different strategies, and fourth it uses the combined log to infer likely distributed state invariants. Dinv uses real-time snapshots to check the invariants at run-time by introducing lightweight probabilistic assertion mechanism.
Table 7 shows a summary of different methods of inferring multi-service dependency from application level data.
6.3. Using Both Network and Application-Level Data
Macroscope [
79] takes advantage of both network and application-level data to extract dependencies between networked services/components. It automatically extracts the dependencies of networked applications using application-level data such as application ID, process ID, along with network-level data, to construct application-service dependency graphs at different levels of granularity. It separates dependencies into static dependencies that are more frequent and transient dependencies that are less frequent and uses a two-step algorithm to identify them. At the first step, it classifies applications into one of two types: it merely generates connections produced from static dependencies, or it generates connections from both static dependencies and transient relations. The second step takes data from the applications with connections appearing from both static dependencies and transient relations, and makes use of usage frequency information to distinguish them. In addition, it extracts different levels of dependencies between application and services such as application-level dependency, application instance and service instance dependencies, using different collections of data.
6.4. Summary
As we can see, the discussed methods try to extract the dependencies between distributed services or components. Some of them use network-level data, which use sending/receiving patterns in a time period, packet header data like (e.g., IP, port, protocol), delay distribution of the traffic, cross-correlation of data, equality of the attributes (key-based correlation) and reference-based correlation. Others leverage application-level data such as application ID and process ID, monitored data (e.g., resource usage, TCP/UDP connection number), and temporal dependency between the execution of systems, which allow them to have a better understanding of the systems’ behaviour and their dependencies.
The existing approaches try to extract simple explicit dependencies (i.e., dependencies between services with their direct traffic between them). Latent dependencies (where the dependencies cannot be identified at first glance and need mathematical calculation to discover) and implicit dependencies (data dependencies between distributed services without access to their traffic or through their traffic with other services) have only been covered in a very limited sense. For example, Oliner et al. [
68] extracted part of latent dependencies using cross-correlation, but their effort only considers linear dependencies for the services that communicate directly in terms of sending and receiving messages. In general, each existing method tries to discover only one part of the simple dependencies in the real service’s traffic. Little attention has been paid to the selection of multiple and complex dependency functions that can identify latent dependencies or a combination of several dependencies. A major focus in existing service dependency discovery efforts has been on how to identify data-dependent services rather than incorporating their effects on the system’s behaviour. In general, there remains a need for efficient and systematic approaches that can cover all types of data dependencies between services and their mutual impacts on each other.
7. Conclusions
Message format extraction, control model, data model and multi-service dependencies are four vast areas of active research whose combination as well as individual areas have been getting the researchers’ attention for different research purposes. This paper focused on surveying the research efforts based on these four areas to promote service virtualisation. We believe that this study provides the first valuable overview of the state of the art to service virtualisation and its functional requirements, which is beneficial for researchers who are keen to comprehend this research area to leverage or contribute to the field.
Service virtualisation’s success highly relies on these four discussed research areas. This paper shows that each area has had its progress and improvements throughout time. However, several gaps for enhancement remained open:
Method to extract the hierarchical and complex structure of messages with fixed and variable length fields;
Expanding the existing methods to consider the services’ mutual impacts on each other in generating both exact service response message types and their contents;
Developing a more comprehensive dependency extraction method, to discover complex data dependency models that describe the inter-dependency between systems;
An efficient and systematic approach that can discover data dependencies between more than two services and their mutual impacts of each pair on the rest of systems’ behaviour.
As this field gets more attention, we expect to see more levels of sophistication in all four areas. To assist and enhance the previous methods, the significance of using automatic machine learning and AI methods in all four areas became apparent not only as creating yet another approach but also as a way to promote the real-world industry solution.


