
Research on Energy Storage Optimization Operation Schedule in an Island System


Department of Electrical Engineering, National Taiwan University of Science and Technology, No. 43, Sec. 4, Keelung Rd., Daan Dist., Taipei 106335, Taiwan
*
Author to whom correspondence should be addressed.
Appl. Sci. 2021, 11(8), 3690; https://doi.org/10.3390/app11083690
Submission received: 9 March 2021
/
Revised: 13 April 2021
/
Accepted: 14 April 2021
/
Published: 19 April 2021
(This article belongs to the Special Issue Advances and Trends in Smart Grids and Microgrids: Operation, Control, Protection, and Security)
Abstract
:This paper proposes a 24-h ahead unit commitment for a diesel-photovoltaic (PV)-battery system using mixed-integer linear programming (MILP) to minimize the operating cost which includes the power storage system (PSS) in the reserve capacity. Considering the Kinmen island’s winter peak load case of 20 MW, and summer peak load case of 60 MW, a 24-h schedule for the diesel-PV-battery system island system for these two scenarios was optimized that allows the PSS to perform both as an additional reserve capacity and peak-shaving auxiliary device. The results show that the addition of PSS in the dispatch decision can allow the flexibility of the systems, especially in the reserve allocation, to up to twice the value of the PSS capacity. In this way, the PSS reduces the early startup and late shutdown of high-cost units while maintaining the system reserve, thereby, reducing the operating cost of the system.
1. Introduction
In the past 20 years, the power generation cost of renewable energy and power storage systems (PSS) has been greatly reduced. This represents the use of renewable energy to replace a certain percentage of traditional thermal units around the world. In particular, power generation costs of the island systems are higher than those of large-scale power systems because their smaller scale is more economically competitive. It can be expected that more renewable energy will be added to island systems in the future.
Because island systems use diesel generators, the energy cost is usually higher than that of large-scale power systems. In addition, island systems have special geographical environments. The following are important economic issues for island systems [1].
The overhead power lines are susceptible to salt injury. Therefore, some island systems will use underground cables for the power supply. Since underground cables are capacitive, generators need to absorb additional reactive power. If the diesel engine absorbs too much reactive power, it may cause the protection relay to trigger and let other generators trip, and eventually cause power outages.
The addition of renewable energy will increase the uncertainty of the power system. Therefore, the island system prediction technology of renewable energy becomes more important. The planning and economic analysis of PSS are also important research topics.
Only a few generators operate when the island system is off-peak. According to the N-1 principle, if one of the generators fails, it may cause serious power system accidents, so it is necessary to explore the dispatch strategy.
In the power generation system, unit commitment (UC) has great significance, as it is the determination of committed units during a scheduling period that is crucial to power system operation [2]. Mixed-integer linear programming (MILP) is a common approach to solve this mixed-integer combinatorial problem, but it does not traditionally schedule the PSS. Many works of literature have studied the situation of island systems combining renewable energy and PSS. Some consider the fast response characteristics of storage systems to maintain the stability of renewable energy by adding several types of reserves in the system [3,4]. Others use PSS to reduce the curtailment of renewable energy [5,6], and likewise, its volatility [7]. The PSS is also not a new peak-shaving solution. The PSS can be used by itself [8] or can be combined with movable loads [9] to reduce the total operating costs of the system through peak-shaving. However, studies on the use of the PSS in the spinning reserve are still insufficient. Although the paper of Kwon and Kim [10] studied its use as an additional ancillary service, they only considered it to solve the error in demand forecast. Branco et al. [11] included the PSS in the reserve but only set limited participation from it in the spinning reserve.
This paper aims to study the scheduling system of the penetration of renewable energy in Taiwan’s Kinmen Island to reduce power system accidents, including unexpected situations, small-scale disturbances, and changes in load or renewable energy output during normal operation, by allowing full participation from the PSS in the reserve schedule. This study simulated two cases with two load conditions, minimum and maximum, to analyze the system’s robustness in handling both up- and down-spinning reserve constraint to mitigate power system accidents. In the case of safe and stable power system operation, this paper considers the scheduling of both generators and PSS to minimize the economic costs of the system.
The research architecture is shown in Figure 1. The input of the model was the load and PV profiles, from which the net load was computed, and the generator constants. The optimization problem included the objective function and system constraints. Then, the MILP was used to calculate the corresponding unit commitment and dispatch for the diesel units (DU), and likewise the charge–discharge power and state-of-charge (SOC) of the battery.
2. Problem Formulation
2.1. Linear Programming
Linear Programming (LP) is a method of describing problems by mathematical equations and inequalities and then using mathematical methods to find the best solution. This means that the problem of linear programming is expressed in a set of simultaneous linear inequalities or equations under many constraints, and the maximum or minimum objective function. The linear programming model is composed of objective, constraint, decision variable, and parameter components.
2.2. Objective Function
The purpose of this study is to determine the commitment and dispatch of power from both diesel generators and batteries that would minimize the operating cost. Therefore, the paper calculated two types of operating costs: diesel generator and startup cost. The objective function was formulated as follows, where F is the total operating cost, T is the total scheduling period, C is the linearized fuel cost of the diesel generator, and Cst is the startup cost:
2.3. Diesel Generator Model
The fuel cost function of the diesel generator n (FCn) can be expressed by a quadratic equation [2], as shown in Equation (2).
where ,, and are the fuel cost constants of the unit and is the output power of the diesel generator at a specific hour.
A non-linear characteristic curve is used to describe the relationship between the output power of the diesel generator and the fuel consumption cost, and there will only be a one-line segment at each given time. The linearized fuel cost of the diesel generators [1] is, therefore, in Equation (3).
In Equation (3), is the power output of the generator corresponding to each line segment i of the characteristic curve, represented by a set of linear segments. The cost C(t) of generating diesel power is obtained from the non-linear characteristic curve. For every generator n, there is a gradient of segment i, an intercept on the ordinate axis of segment i, and a binary variable representing the start of the segment i.
For the diesel generator model, it must be ensured that only one segment can be analyzed at a time, so Inequality (4) is used to describe this constraint. Equations (3)–(5) are used to ensure the output power of the diesel generator is in the range of the minimum and maximum of the segment. The startup cost of diesel generators Cst is shown in Equation (6), where stprice is the startup cost of the generator. is a binary variable of the operating state of the diesel generator n.
2.4. PSS Model
In Equation (7), represents the output power of the battery. The values of discharge power of the battery is positive, while the charging is negative. In addition, the discharging efficiency and the charging efficiency are included.
The battery’s state-of-charge (SOC) is shown in Equation (8) and describes the relationship between the charging and discharging power of the battery. The inequality in (9) ensures that the SOC of the battery is within the minimum and maximum limits of the SOC. Finally, with and as the binary variables for the discharging and charging state of the battery, respectively, Equation (10) should be satisfied to ensure that the battery does not discharge and charge at the same time.
In Inequalities (11) and (12), the power limitation of the charging and discharging power of the battery is formulated. and are the maximum values of battery discharging and charging power, respectively.
2.5. System Constraints
2.5.1. Power Balance Constraint
At any given time, the power generated by the PV and diesel generators, plus the discharging and charging of the battery, should be equal to the load demand. Equation (13) shows the power balance constraint where is the power from the renewable energy, in this case PV, and is the load demand.
2.5.2. Minimum Startup Time and Shutdown Time
Because the changes of temperature and pressure for thermal power generators are slow, in order to prevent frequent operation and comply with the characteristics of thermal power generators, the minimum time of startup and shutdown are formulated as follows.
where is startup time of the nth unit in period t, is shutdown time of the nth unit in period t, is minimum startup time of the nth unit, and is minimum shutdown time of the nth unit.
2.5.3. Up-Spinning Reserve Constraint
In order to prevent the power system from insufficient power supply due to unexpected conditions (such as generator tripping or feeder short-circuit), or sudden large changes in load or renewable energy, the reserve should be set. In addition to the power generation required by the load, the additional power generation capacity of the system must be planned for emergency dispatch. Equation (16) shows the up-spinning reserve constraint where is the spinning reserve.
2.5.4. Down-Spinning Reserve Constraints
The reserve capacity mainly deals with emergencies of load changes, usually due to feeder or transformer tripping. Based on experience, the down-spinning reserve can be set from 10% to 15% of load demand [2]. Equation (17) shows the spinning reserve constraint where is the down-spinning reserve.
3. Case Study
3.1. System Information
This study used the Kinmen power grid as the target system. Kinmen Island is a small island directly west of Taichung City in Taiwan (R.O.C.), which is very near mainland China. It has a 10 MW PV plant, two PSS with a total capacity of 1.8 MW/10.8 MWh, and two fuel plants on the island. The first fuel plant has ten heavy fuel oil generators grouped into three phases corresponding to the commissioning year of the generators. The second fuel plant has four light fuel oil generators. The capacity, power limits, startup cost, and time constraint constants of each generator in the two plants are shown in Table 1. The quadratic form of the fuel cost constants (a, b, and c) was plotted and divided into three segments. The three-segment piecewise linear fuel cost equations, in Equation (3) form, are listed in Table 2. According to [12], light fuel oil (LFO) fuel constants are about three times that of the heavy fuel; hence, parameters for the LFO were assumed to be thrice that of heavy fuel.
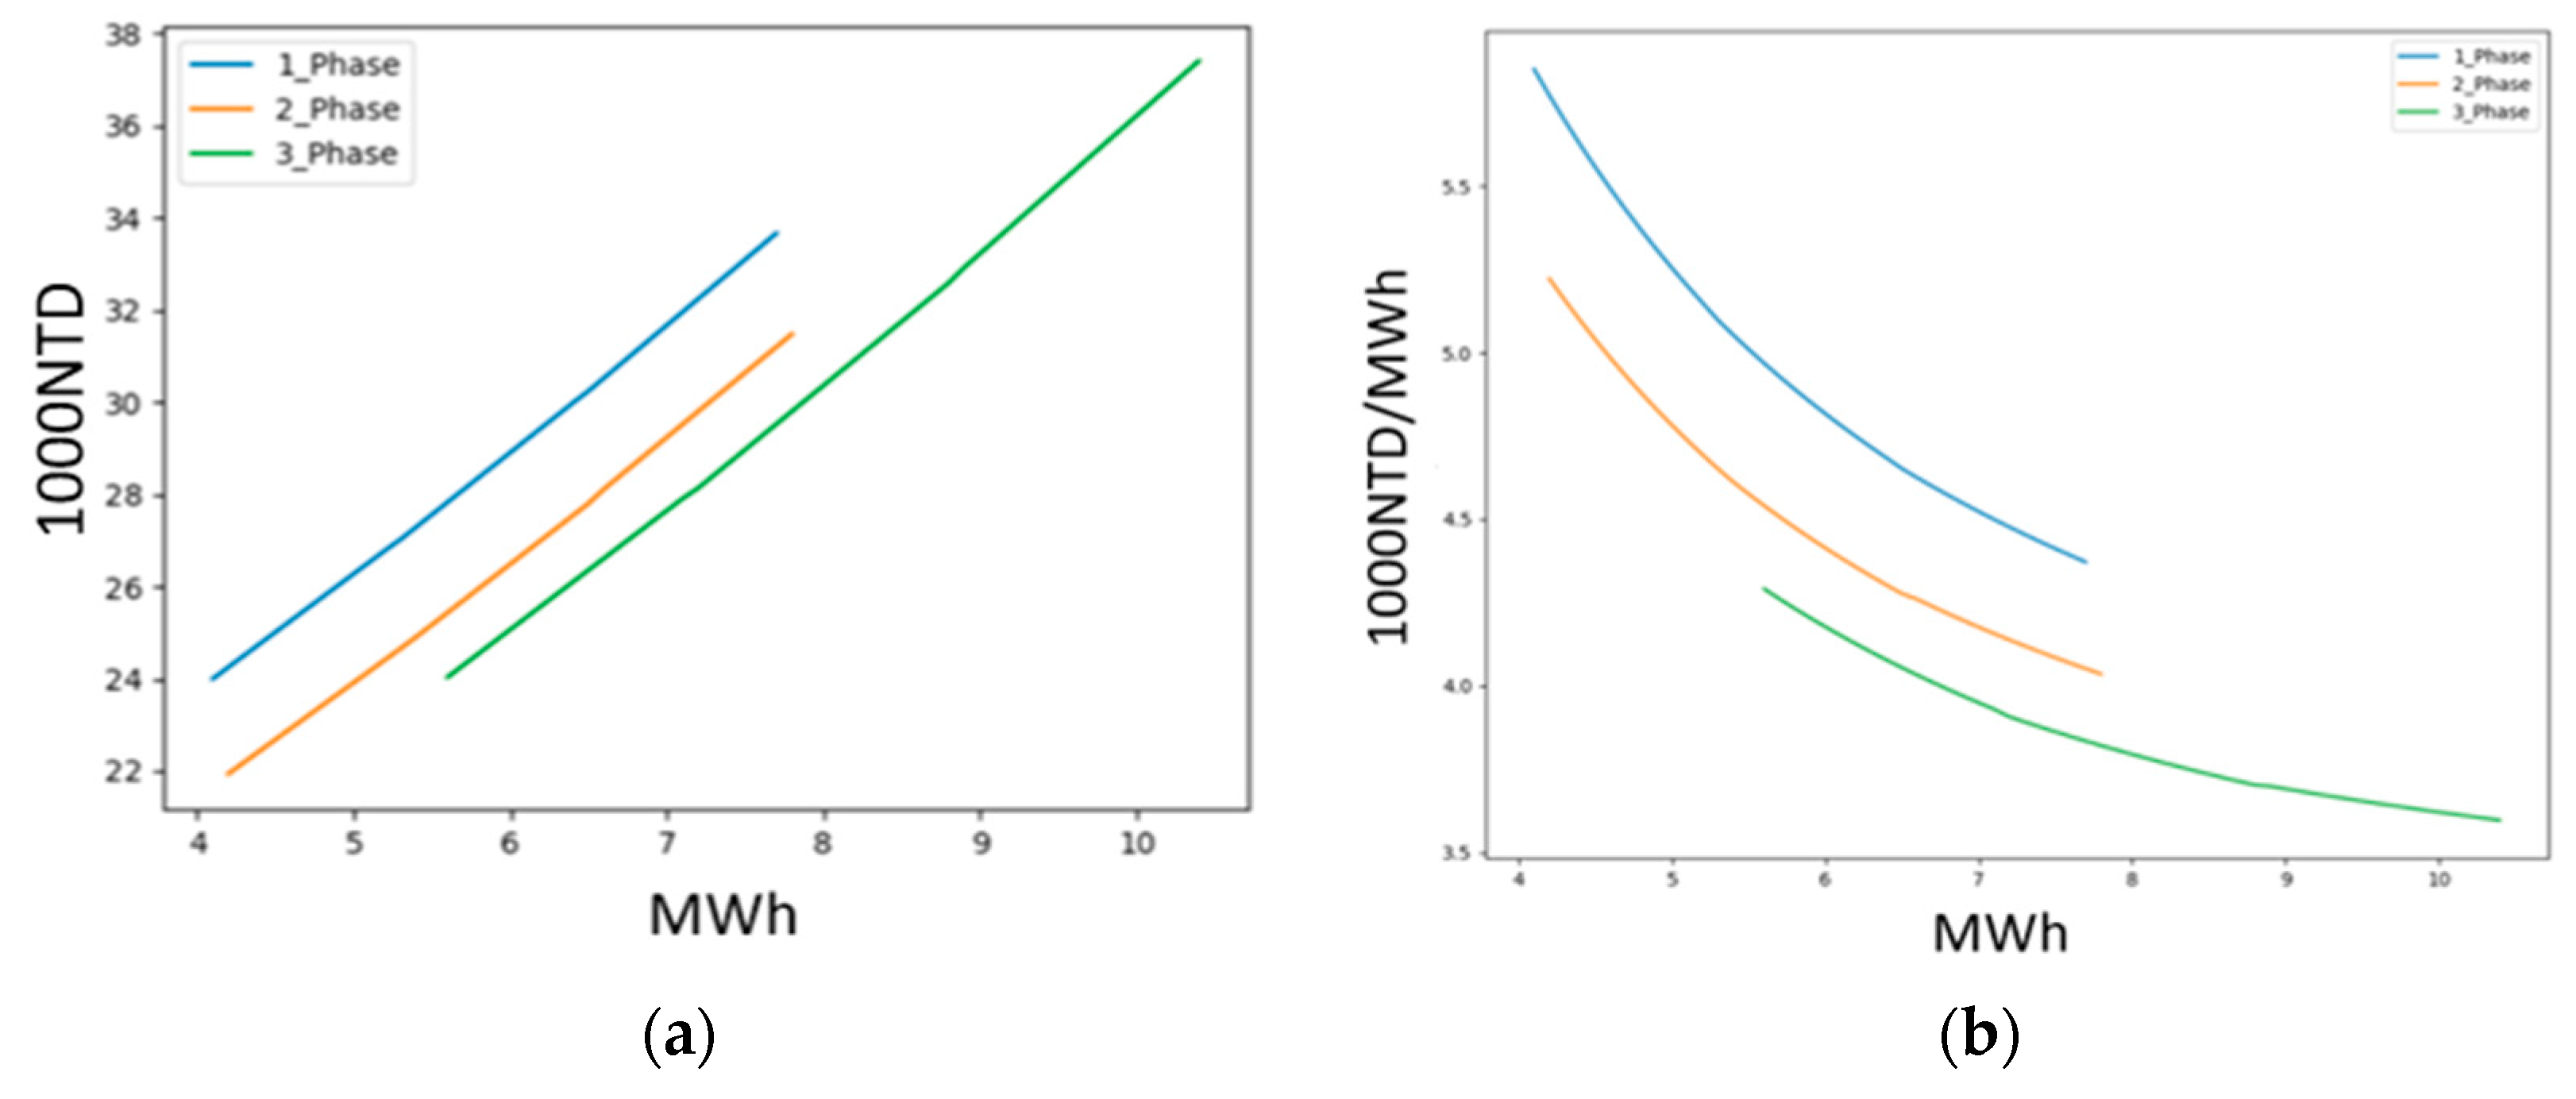
Figure 2a shows the cost curve of the generators according to their range. Different types of units have different working intervals, as listed in Table 1. Figure 2b shows the average cost of power generation by dividing the cost (from Figure 2a) by the power generation. The left end of each segment is the minimum operating power of the generator, and the right end is the maximum operating power of the generator. The results showed that the generator closest to a full load had higher efficiency. In this case, the Phase III generators would be most efficient as their cost was lowest when operating at a higher output. This is followed by Phase II (orange) and Phase I (blue).
3.2. PSS Setting
Because this research considered the PSS in the reserve capacity, the and were set to 22% and 78%, respectively, so that the PSS could still discharge for another hour from the lowest point of SOC, and charge for another hour from the highest point of SOC. These reserve capacity limitation conditions were considered in Equations (16) and (17).
This study assumed that the charge and discharge cost of the ideal PSS was set to 0, the charge and discharge efficiency was 1, the initial SOC capacity was set to 50%, the termination SOC capacity was set to 50%, and the SOC was calculated after the hourly charge and discharge capacity was completed.
3.3. System Scenarios
Two 24 h optimizations were conducted to simulate the minimum load scenario (case 1) and the maximum load scenario (2). The 24 h load profile was taken from one year of historical data from the Kinmen grid. The day with the least power and the day with the highest power were used as case 1 and case 2, respectively. However, for both cases, though the PV was also taken from measured data, no cloud condition was used. Therefore, the solar PV peak at 11 a.m. reached a peak of about 10 MW. Furthermore, regular maintenance of three heavy oil units (Plant1_1, Plant1_8, Plant1_9) is conducted during the summer, so these plants were considered shutdown for case 2.
Figure 3a shows the load and PV profiles for the minimum load scenario that had a minimum load of 17MW occurring at 4:00 a.m. This specific day took place in the winter season where most of the load occurred at night due to electric heaters being turned on by island dwellers. There was no district heating present since the average winter temperature was 16 °C during the day, and the lowest night temperature was around 3 °C.
Figure 3b shows the load and PV profiles for the day with a maximum load of 62 MW occurring at 1:00 p.m. This load profile occurred in the summer. The increased energy usage was due to switching on air conditioning units, especially during the day where the temperature can reach 33 °C.
For both case studies, a fixed reserve was used. The up-spinning reserve limit was set to 10 MW while the down-spinning reserve was 2 MW (based on a 20 MW minimum load).
4. Results
Using Equation (1) as the objective function, subject to the constraints in (3)–(17), where the equations for (3) are found in Table 2, the optimization problem was solved based on the conditions for cases 1 and 2. The modeling was done using Python and solved using the CPLEX Python API.
4.1. Case 1
For case 1, the total cost of power generation was 2245kNTD (new Taiwan dollars), the total startup cost was 14kNTD, and the total economic cost was 2259kNTD with a total number of two startups. The result of the power flow for optimization for the day with minimum load is shown in Figure 4. Note that the sumP (violet) is the net load that also considers the charging and discharging of the PSS. In addition, the SOC (brown) is expressed in percentage using the right y-axis.
In Figure 5, the power output of each generator for the day with the least load is shown. Figure 5 shows that the system was mainly supplied by the two Phase III units (Plant1_9 and Plant1_10), and a Phase II unit (Plant 1_6). In addition, two other Phase II units only operated at certain hours. Plant 1_7 operated from 3:00 p.m. to 11:00 p.m., while Plant 1_5 operated from 5:00 p.m. to 1:00 a.m. the following day.
Figure 6 shows the hourly up- and down-spinning reserve for the day with minimum load. Notice that the up and down reserve changed whenever a generator turned off (1:00 a.m. and 11:00 p.m.) or turned on (4:00 p.m. and 6:00 p.m.). The green and the dark blue line shows the up and down reserve, respectively, this time considering the PSS as an additional ancillary service.
The up-spinning reserve was at the minimum up reserve at the 1st, 15th, 17th, and 23rd hours because of the transition of the system when a diesel generator turned off or on. With this transition, the PSS operated to maintain the up-spinning reserve limit. At the 1st and 2nd hour, the PSS-available power was added to the operating reserve allowing the shutdown of one unit. During the 15th and 17th hours, because of the increase in load, an additional unit was turned on with the PSS providing small power outputs (compare from Figure 4) for support and maintaining the up reserve limit. This was also seen at the 23rd hour when a unit shut down. This means that the system used the PSS to keep the operating reserve at its limit.
The down-spinning reserve, on the other hand, was at the minimum from the 4th to the 8th, 10th, and 12th hours. This may be due to the scheduled discharge of PSS in the early hours, causing the SOC to be lower than 50% (see Figure 4 of SOC). During this period, the use of the PSS was very limited until around the 10th hour. In addition, in the 4th to 11th hours, the gray line overlaps the dark blue line because the down-spinning reserve was maintained at the boundary through small PSS charging and discharging because of low SOC (compare with Figure 4 PSS_power and SOC).
Figure 7 shows the hourly power generation cost for case 1. It can be seen that even though the net load increased from 16 MW (5th hour) to 30 MW (18th hour), the average power generation cost decreased for these hours. It is reasonable to speculate that because the only generators operating were of heavy diesel types, the cost (Phase III generators) would not change and would be more economical when the load increases. Furthermore, the low load would cause the generator to operate at low efficiency, as was also discussed in Section 3.1, giving a higher power generation cost. The full-load condition of generators increased the efficiency, allowing the average cost of power generation to slightly change. The results show that the economic effect of using the PSS to doing peak-shaving in this condition was not that significant.
4.2. Case 2
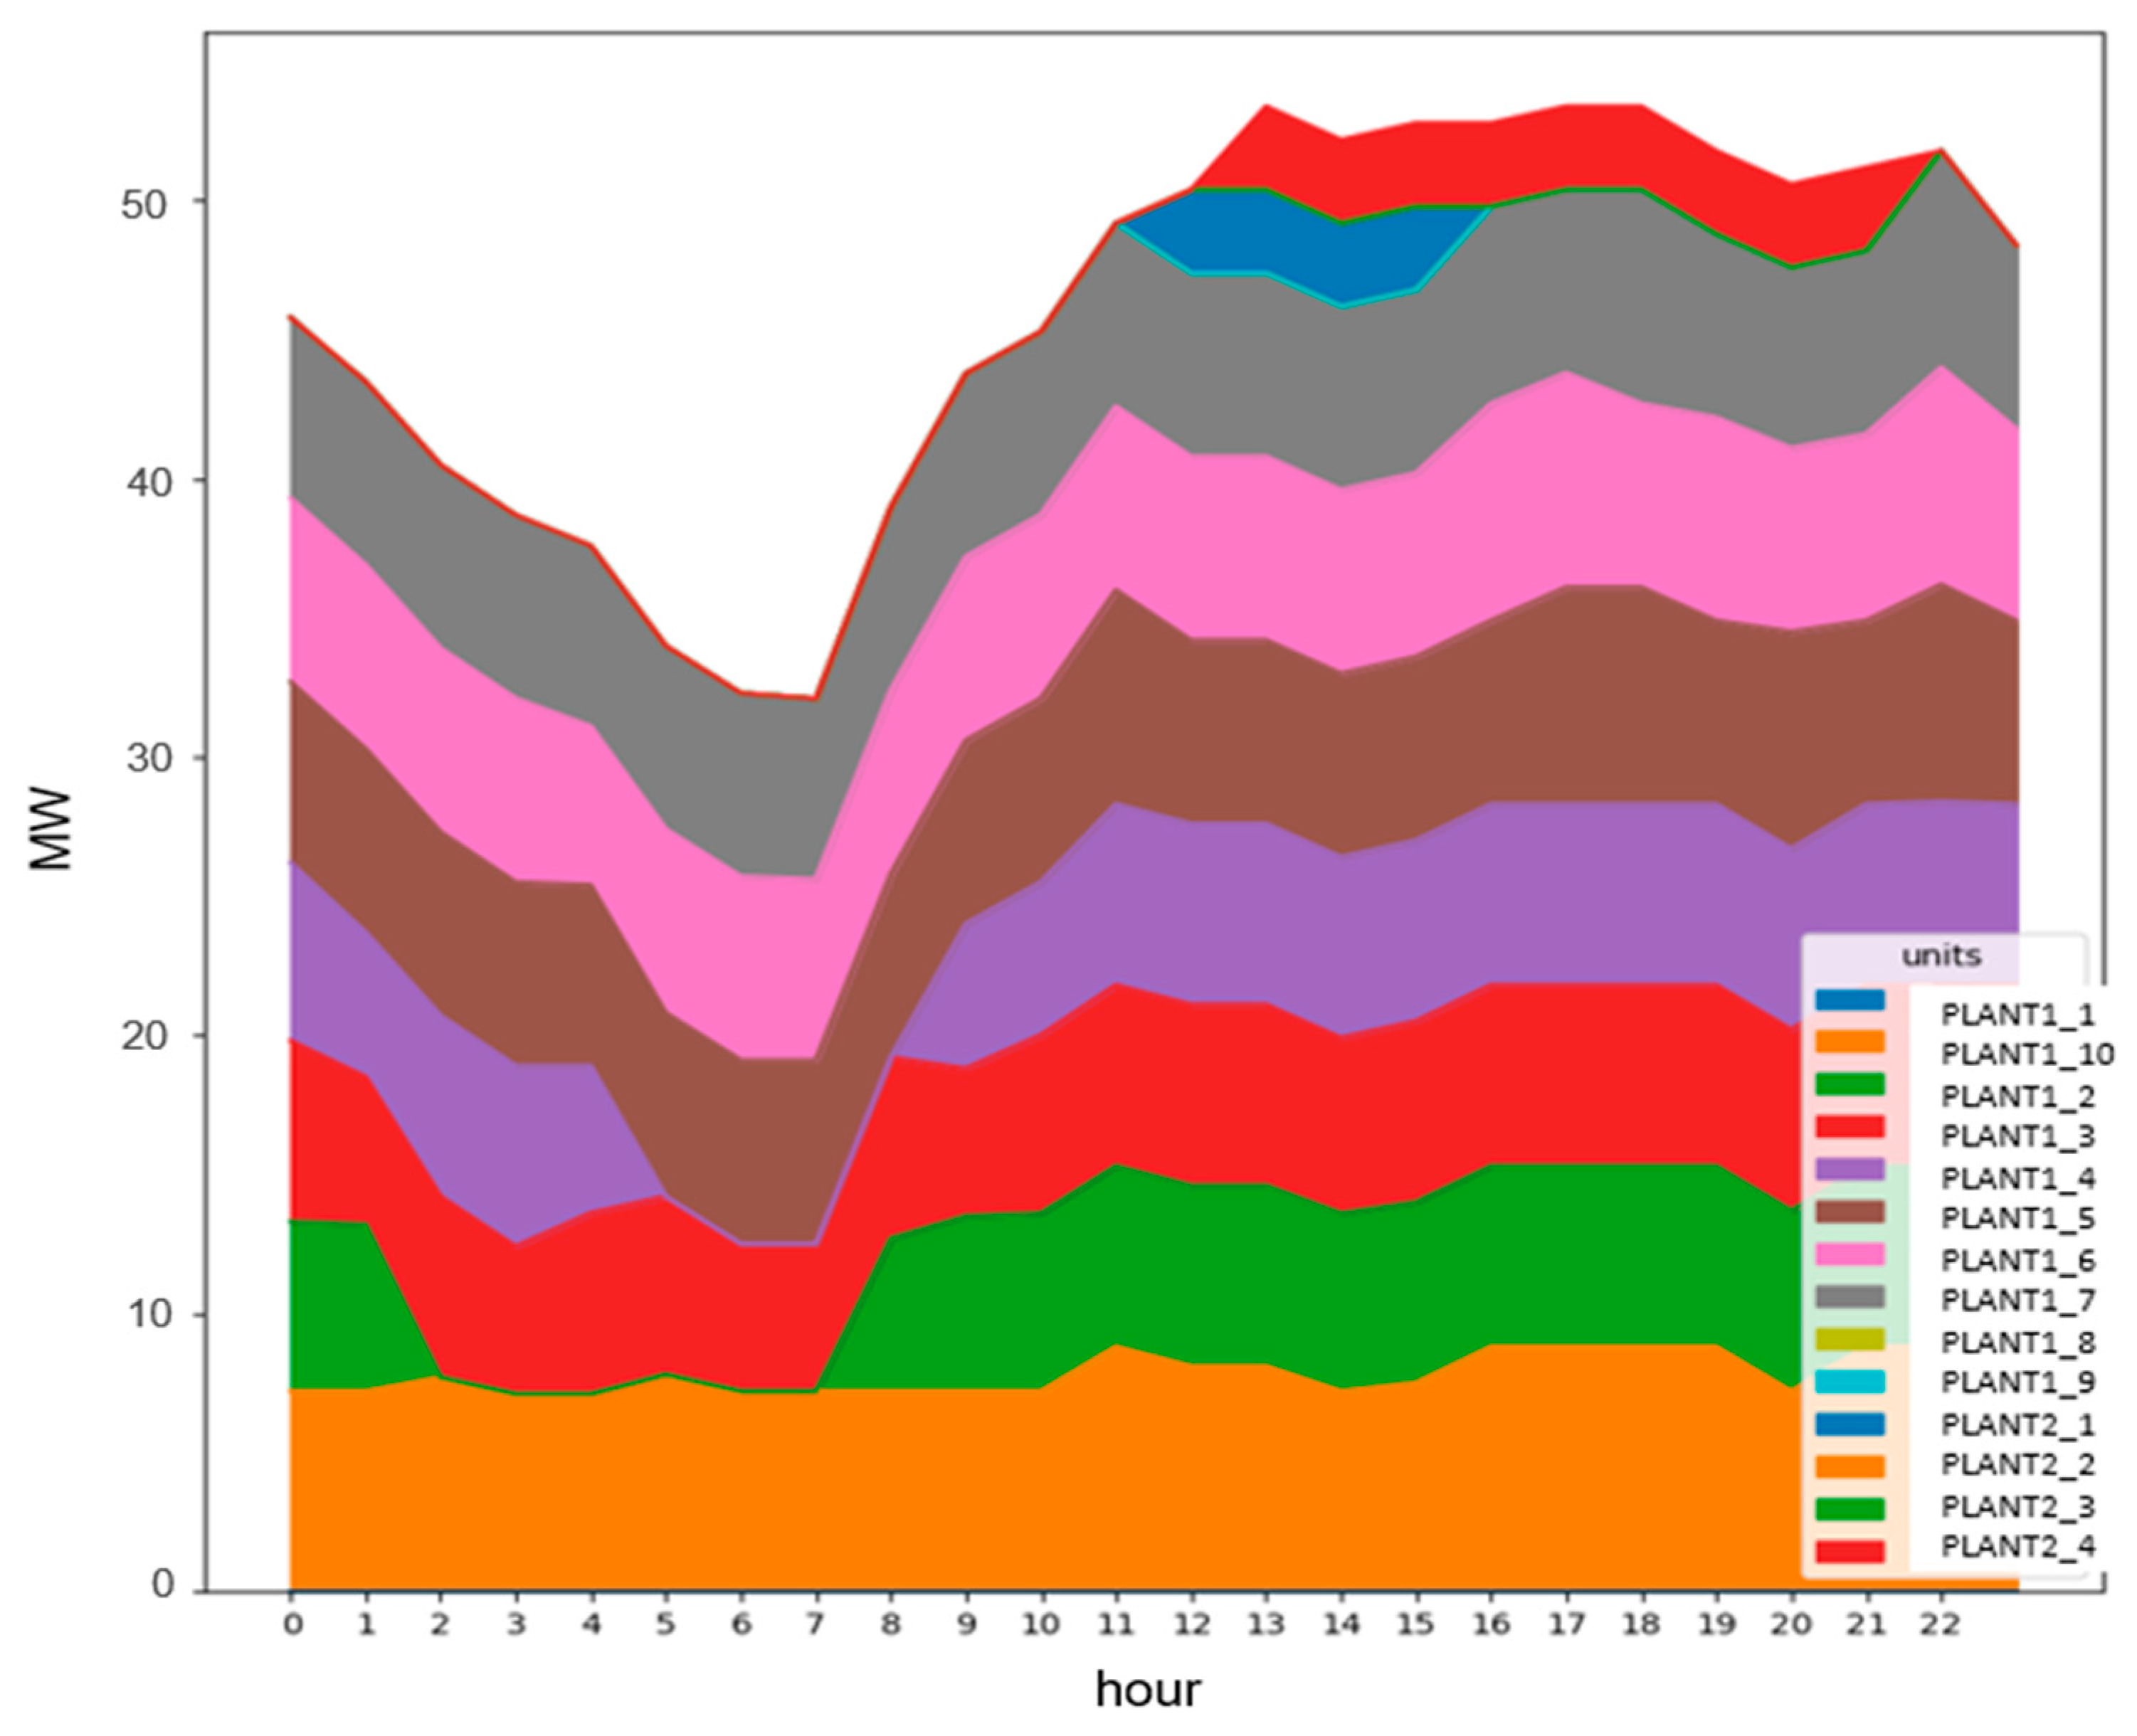
For case 2, the total cost of power generation was 4957kNTD, the total startup cost was 28kNTD, and the total economic cost was 4985kNTD with a total number of four startups. Figure 8 shows the hourly power flow for the day with a maximum load while considering three heavy oil plants (Plant1_1, Plant1_8, and Plant1_9) on shutdown mode. Again, the sumP (violet) is the net load that also considers the charging and discharging of the PSS while the SOC (brown) is expressed in percentage.
As shown in Figure 9, when the load was heavy at the 12th and 13th hour, two LFOs (Plant2_1 and Plant2_4) were turned on. Plant2_1 was turned on from the 12th to the 15th hour, while Plant2_4 was turned on from the 13th to the 21st hour. In addition, the startup and shutdown time of each generator all met the constraint of minimum startup time and shutdown time in the period.
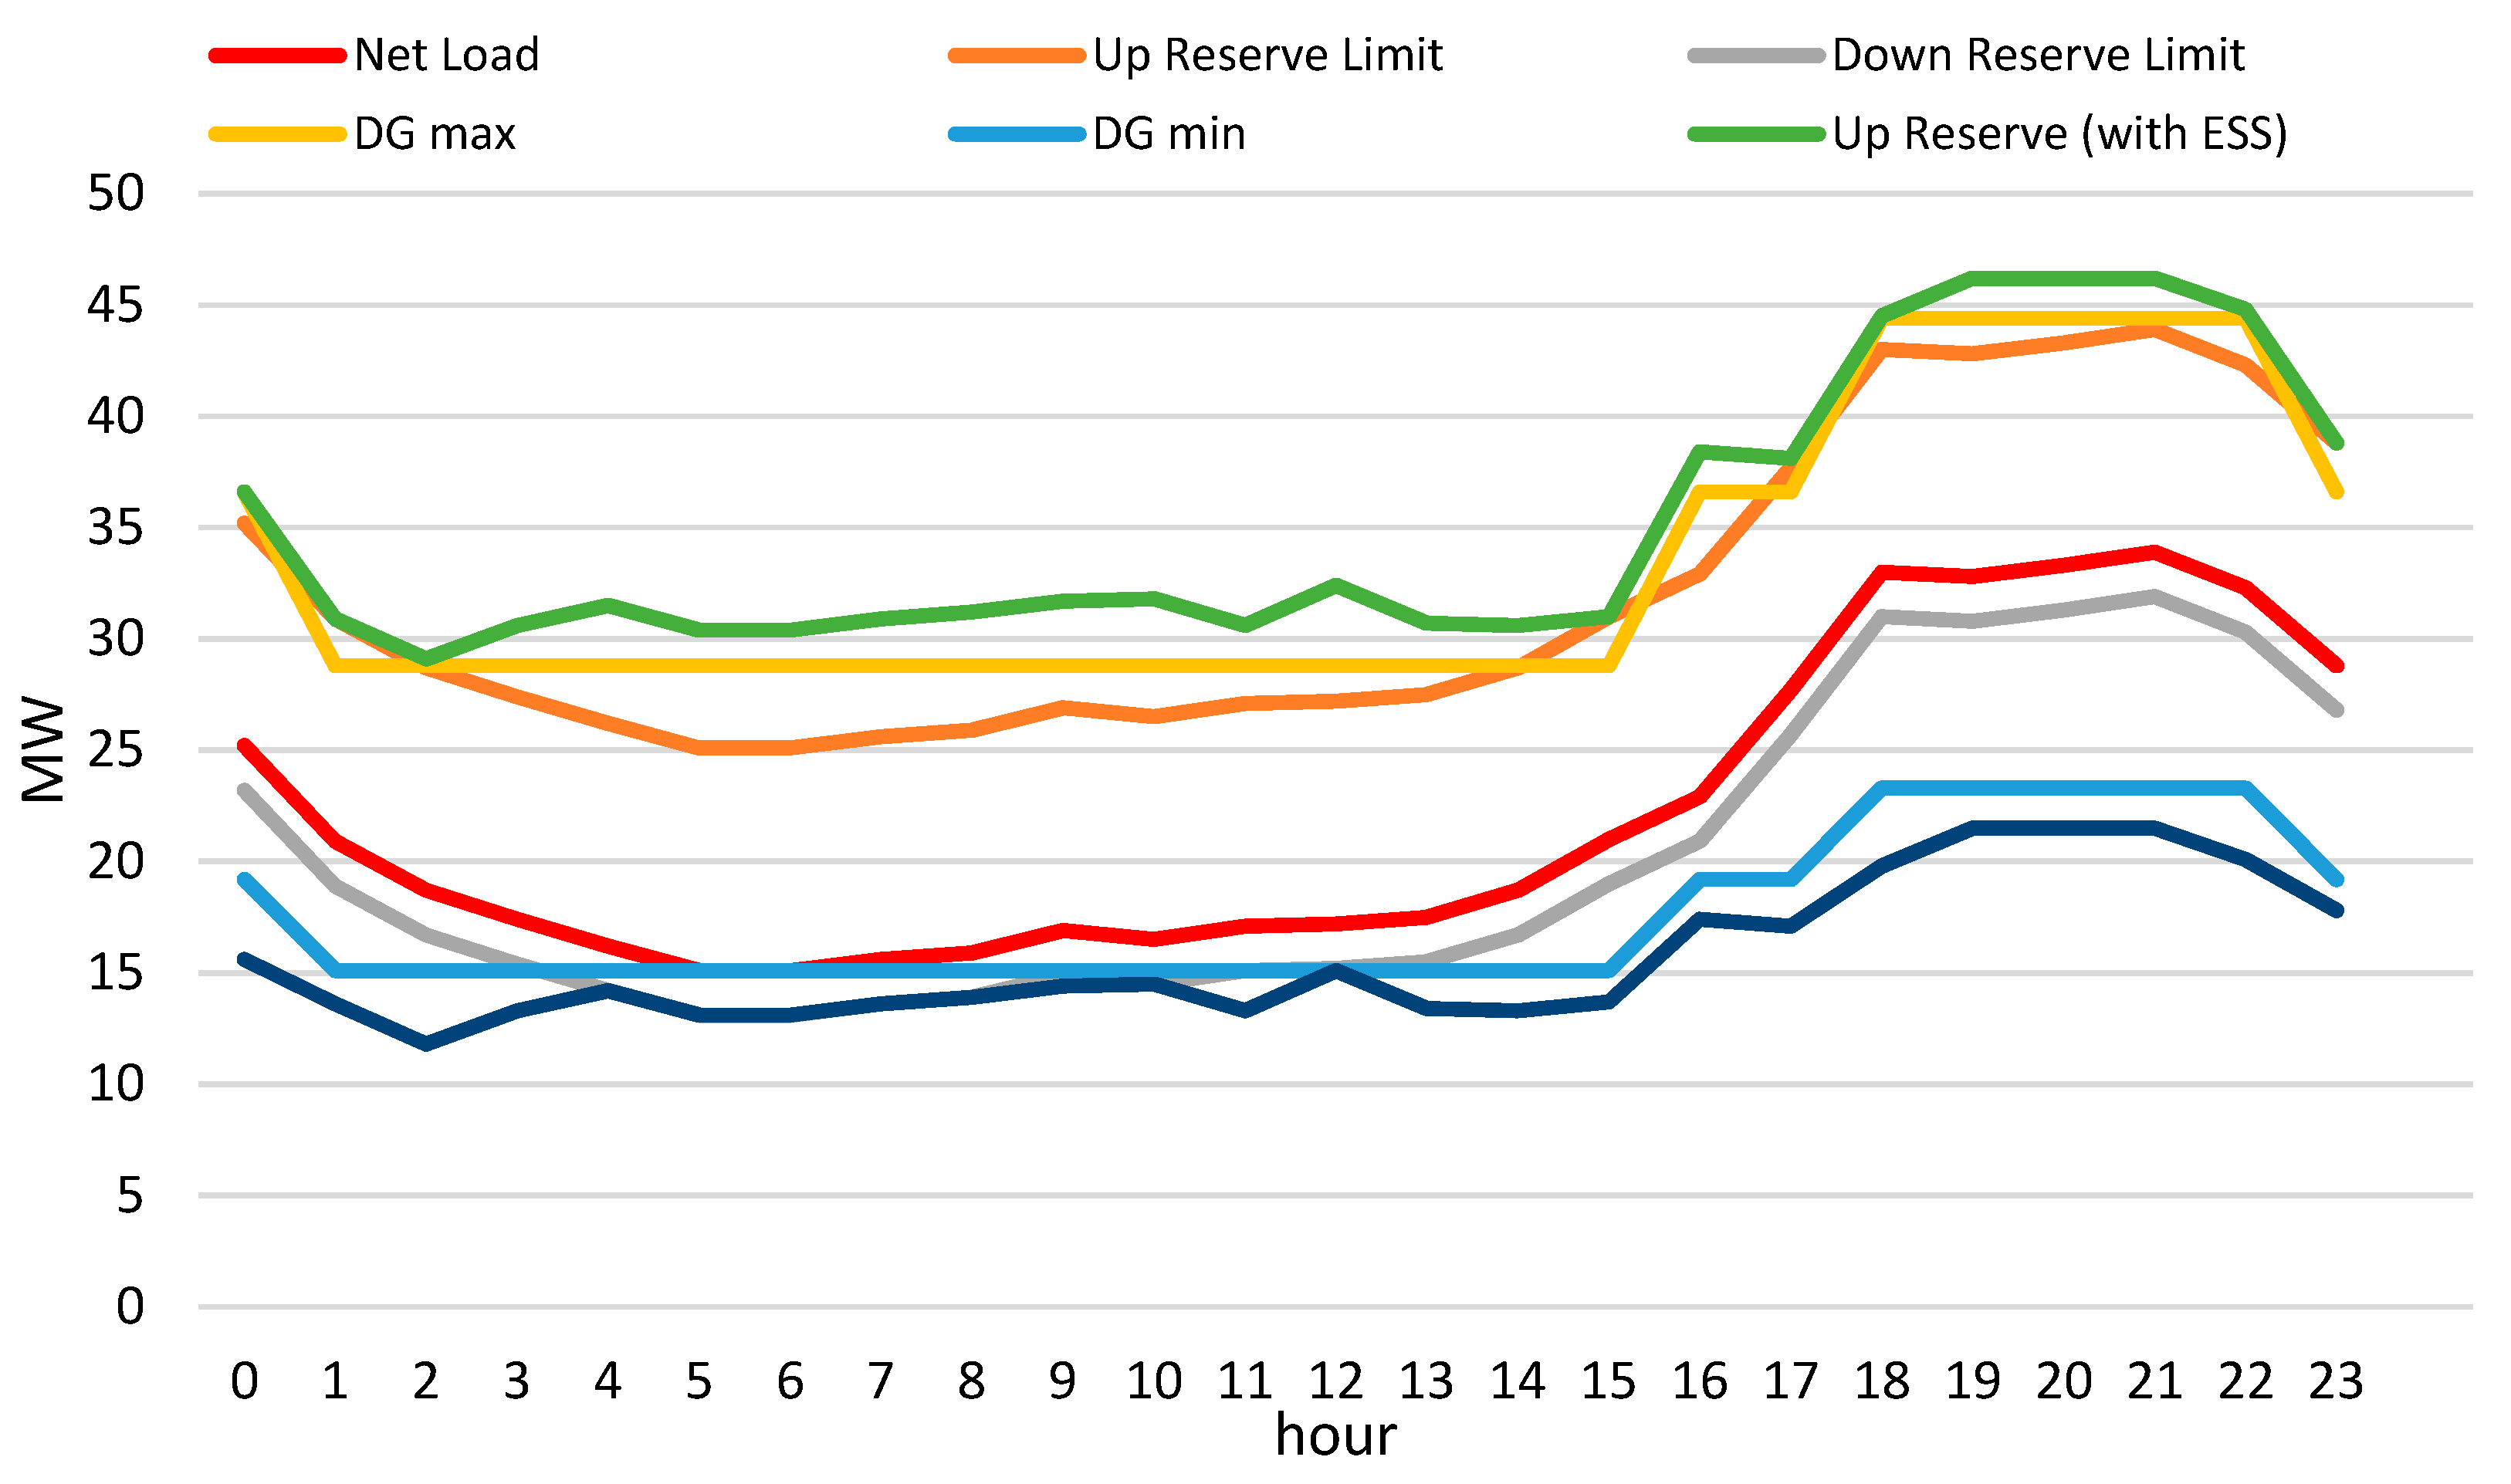
In the case of peak load, because many generators were working at/near their maximum capacity, the down-spinning reserve was sufficient for the system. From Figure 10, the operating up-reserve (green) was maintained at the up-spinning reserve constraint, especially for the 16th to 18th hours where the charging and discharging of the PSS just met the spinning reserve constraint. As seen in the crisscrossing of the up-reserve limit (orange), and the diesel’s maximum output (yellow), the PSS provided for additional reserve so that the use of the diesel generator could be reduced. This result highlights the importance of the PSS.
Figure 11 shows the hourly cost of power generation. From the 0th to 11th hours, if there were only heavy fuel units, the power generation cost was just around 4.5 NTD/kWh. When the LFO units were turned on at the 12th and 13th hours, during peak load hours, the power generation cost increased significantly, as shown in the red block in Figure 12.
By comparing the average fuel cost with the charging and discharging power of the PSS, as seen in Figure 12, it can be noticed that during the peak hours (12th–21st hour) the cost was high when the PSS discharged, and decreased when the PSS charged at the 16th to 18th hours. To reiterate, at the 12th and 13th hours, the LFOs turned on, and the PSS in this case provided power to transition into the system. When the system had stabilized, the PSS charged to lessen the cost during the peak hours, then discharged again when support was needed during generator shutdown. This can prove that the PSS had the function of peak-shaving in this case.
5. Discussion
Though this research only considers solar PV renewable energy, it is expected that other renewable energy sources, such as wind power generation, can be added and analyzed in the future. The same model can be used, but this time the inclusion of the output of wind power in renewable energy would be required. The use of net load, instead of actual load power, will help better understand the behavior and effects of PSS in the system.
For the case study of the Kinmen Island power grid, during low load conditions, the use of the PSS may not be seen as economical. This is mainly because only a few generators were online, and those online generators were of a low fuel cost type. Since almost the same generators were online, the range of the power generation cost was small, and the effect of the charging and discharging of the PSS was barely seen. However, the available full-power range from the PSS (±1.8 MW or 3.6 MW) was used, and the large decrease in cost (however small in range) usually corresponded to the charging of the PSS.
On the other hand, for case 2, the peak-shaving, as well as the cost saving brought by the use of the PSS, was evident. In the simulations, the PSS helped the system to stabilize, in terms of the reserve, by acting as a load or a source when there was generator turn-on or turn-off. Though the high peak load happened during high PV output, the shaving of the low load condition was seen, where the PSS acted as a load to flatten the net load. Again, the full charging–discharging range of the PSS (±1.8 MW or 3.6 MW) was used in this condition. Furthermore, cost reductions could be seen with the use of PSS.
In power systems, the PSS has several functions, such as frequency regulator and auxiliary support for intermittent renewable energy. For this case study, not only did the PSS act as a peak-shaving device, but we also saw how the PSS provided support to maintain the spinning reserve limits, which usually happened during the turning on/off of generators. This furthers the maximization of the use of PSS as it may help prevent earlier or later startup or shutdown of generators to maintain the spinning reserve.
6. Conclusions
In this research, the use of the 1.8 MW/10.8 MWh PSS of the Kinmen power grid was investigated as an additional up- and down-spinning reserve capacity, in contrast to traditional economic dispatch. The optimization problem was modeled so that the charging and discharging of the PSS achieved the peak-shaving function in order for the diesel generators to provide more reserve to the system.
At low load power conditions, the Kinmen power grid may only have two to three units operating, and if all these units are operating at their minimum capacity, it will not be able to cope with drastic load changes. Therefore, this study proposed a more robust power dispatch by including the PSS in both up and down-spinning reserve constraints.
This study has shown how the PSS was able to maintain the reserve especially in the transition stages of the system. The PSS was found to have prevented too many generators online, or the early turning-on or late turning-off of generators, so that it could reduce the operating cost of the system by charging the PSS at off-peak hours and discharging during peak hours. The PSS can also provide a maximum reserve capacity of twice its available power range for the flexibility of the system.
Author Contributions
Conceptualization, Y.-T.C. and C.-C.K.; Data curation, Y.-T.C.; Formal analysis, Y.-T.C.; Investigation, Y.-T.C. and J.-Z.J.; Methodology, Y.-T.C. and C.-C.K.; Project administration, Y.-T.C. and C.-C.K.; Software, J.-Z.J.; Validation, Y.-T.C. and C.-C.K.; Visualization, J.-Z.J.; Writing–original draft, Y.-T.C.; Writing–review & editing, Y.-T.C. All authors have read and agreed to the published version of the manuscript.
Funding
This work was supported in part by the Ministry of Science and Technology, Taiwan, under Grant MOST 109-2622-E-011-017-CC2.
Institutional Review Board Statement
Not applicable.
Informed Consent Statement
Not applicable.
Data Availability Statement
All data are already provided in the manuscript.
Conflicts of Interest
The authors declare no conflict of interest.
References
- Wu, Y.-K.; Ye, G.-T.; Tang, K.-T. Preventive Control Strategy for An Island Power System that Considers System Security and Economics. In Proceedings of the 2017 IEEE/IAS 53rd Industrial and Commercial Power Systems Technical Conference (I & CPS), Niagara Falls, ON, Canada, 6–11 May 2017; pp. 1–12. [Google Scholar]
- Abujarad, S.Y.; Mustafa, M.W.; Jamian, J.J. Recent approaches of unit commitment in the presence of intermittent renewable energy resources: A review. Renew. Sustain. Energy Rev. 2017, 70, 215–223. [Google Scholar] [CrossRef]
- Chang, G.W.; Chuang, C.; Lu, T.; Wu, C. Frequency-regulating reserve constrained unit commitment for an isolated power system. IEEE Trans. Power Syst. 2013, 28, 578–586. [Google Scholar] [CrossRef]
- Sokoler, L.E.; Vinter, P.; Bærentsen, R.; Edlund, K.; Jørgensen, J.B. Contingency-Constrained Unit Commitment in Meshed Isolated Power Systems. IEEE Trans. Power Syst. 2016, 31, 3516–3526. [Google Scholar] [CrossRef]
- Psarros, G.N.; Kokkolios, S.P.; Papathanassiou, S.A. Centrally Managed Storage Facilities in Small Non-Interconnected Island Systems. In Proceedings of the 2018 53rd International Universities Power Engineering Conference (UPEC), Glasgow, UK, 4–7 September 2018; pp. 1–6. [Google Scholar]
- Psarros, G.N.; Karamanou, E.G.; Papathanassiou, S.A. Feasibility Analysis of Centralized Storage Facilities in Isolated Grids. IEEE Trans. Sustain. Energy 2018, 9, 1822–1832. [Google Scholar] [CrossRef]
- Kim, R.-K.; Glick, M.B.; Olson, K.R.; Kim, Y.-S. MILP-PSO Combined Optimization Algorithm for an Islanded Microgrid Scheduling with Detailed Battery ESS Efficiency Model and Policy Considerations. Energies 2020, 13, 1898. [Google Scholar] [CrossRef] [Green Version]
- Danish, S.M.S.; Ahmadi, M.; Danish, M.S.S.; Mandal, P.; Yona, A.; Senjyu, T. A coherent strategy for peak load shaving using energy storage systems. J. Energy Storage 2020, 32, 101823. [Google Scholar] [CrossRef]
- Li, X.; Cao, X.; Li, C.; Yang, B.; Cong, M.; Chen, D. A Coordinated Peak Shaving Strategy Using Neural Network for Discretely Adjustable Energy-Intensive Load and Battery Energy Storage. IEEE Access 2020, 8, 5331–5338. [Google Scholar] [CrossRef]
- Kwon, K.-B.; Kim, D. Enhanced method for considering energy storage systems as ancillary service resources in stochastic unit commitment. Energy 2020, 213, 118675. [Google Scholar] [CrossRef]
- Branco, H.; Castro, R.; Setas Lopes, A. Battery energy storage systems as a way to integrate renewable energy in small isolated power systems. Energy Sustain. Dev. 2018, 43, 90–99. [Google Scholar] [CrossRef]
- Psarros, G.N.; Nanou, S.I.; Papaefthymiou, S.V.; Papathanassiou, S.A. Generation scheduling in non-interconnected islands with high RES penetration. Renew. Energy 2018, 115, 338–352. [Google Scholar] [CrossRef]
Figure 1.
The architecture of the research.

Figure 2.
The (a) cost curve of the generators, and (b) average cost curve.

Figure 3.
Load and PV profile with the net load for (a) case 1: day with minimum load, and (b) case 2: day with maximum load.
Figure 3.
Load and PV profile with the net load for (a) case 1: day with minimum load, and (b) case 2: day with maximum load.

Figure 4.
Case 1 power flow results.

Figure 5.
Case 1 hourly power generation of each fuel generator.

Figure 6.
The up- and down-spinning reserve for the day with minimum load (case 1).

Figure 7.
Hourly power generation cost for the day with minimum load (case 1).

Figure 8.
Case 2 power flow result.

Figure 9.
Case 2 hourly power generation of each fuel generator.

Figure 10.
The operating reserve and load for the day with maximum load (case 2).

Figure 11.
The hourly average power generation cost for the day with maximum load (case 2).

Figure 12.
Hourly average cost of energy and PSS power output for case 2.


Table 1.
The simulation parameters of the diesel generators.
| Units | DG Capacity (MVA) | Minimum Power (MW) | Maximum Power (MW) | Startup Cost | Minimum Time of Startup | Minimum Time of Shutdown |
|---|---|---|---|---|---|---|
| Plant1_1~4 | 10.2 | 4 | 7.7 | 7 | 4 | 2 |
| Plant1_5~8 | 9.7 | 4.1 | 7.8 | 7 | 3 | 2 |
| Plant1_9~10 | 13.8 | 5.5 | 10.5 | 10 | 5 | 3 |
| Plant2_1~4 | 3.48 | 1.5 | 3 | 7 | 4 | 2 |
Table 2.
The parameters for piecewise linear for the diesel generators.
| Units | Description | ai | bi | ci | Segment 1 | Segment 2 | Segment 3 |
|---|---|---|---|---|---|---|---|
| Plant1_1~4 | Phase I | 15 | 1.9161 | 0.0661 | 2.53x + 13.62 | 2.69x + 12.76 | 2.85x + 11.71 |
| Plant1_5~8 | Phase II | 13 | 1.8518 | 0.0657 | 2.47x + 11.56 | 2.63x + 10.7 | 2.8x + 9.63 |
| Plant1_9~10 | Phase III | 12 | 1.7966 | 0.0615 | 2.58x + 9.58 | 2.78x + 8.11 | 2.99x + 6.3 |
| Plant2_1~4 | LFO | - | - | - | 2.53x + 30 | 2.69x + 21 | 2.85x + 18 |
Publisher’s Note: MDPI stays neutral with regard to jurisdictional claims in published maps and institutional affiliations. |
© 2021 by the authors. Licensee MDPI, Basel, Switzerland. This article is an open access article distributed under the terms and conditions of the Creative Commons Attribution (CC BY) license (https://creativecommons.org/licenses/by/4.0/).
Share and Cite
MDPI and ACS Style
Chen, Y.-T.; Kuo, C.-C.; Jhan, J.-Z. Research on Energy Storage Optimization Operation Schedule in an Island System. Appl. Sci. 2021, 11, 3690. https://doi.org/10.3390/app11083690
AMA Style
Chen Y-T, Kuo C-C, Jhan J-Z. Research on Energy Storage Optimization Operation Schedule in an Island System. Applied Sciences. 2021; 11(8):3690. https://doi.org/10.3390/app11083690
Chicago/Turabian StyleChen, Yu-Tung, Cheng-Chien Kuo, and Jia-Zhang Jhan. 2021. "Research on Energy Storage Optimization Operation Schedule in an Island System" Applied Sciences 11, no. 8: 3690. https://doi.org/10.3390/app11083690
Note that from the first issue of 2016, this journal uses article numbers instead of page numbers. See further details here.