
Effects of Aging on the Dry Shrinkage Cracking of Lime Soils with Different Proportions
by
Jianwei Yue
1,2, 
Ying Chen
1,
Limin Zhao
1,2,*,
Siyuan Wang
3,
Huicong Su
1,
Xue Yang
1, 
Huijie Gao
1,
Yiang Zhang
1 and
Wenhao Li
1 1
School of Civil Engineering and Architecture, Henan University, Kaifeng 475004, China
2
Key Laboratory for Safety Evaluation and Restoration of Immovable Cultural Relics in Kaifeng City, Henan University, Kaifeng 475004, China
3
School of Architectural Engineering, Tianjin University, Tianjin 300072, China
*
Author to whom correspondence should be addressed.
Appl. Sci. 2022, 12(1), 145; https://doi.org/10.3390/app12010145
Submission received: 26 November 2021
/
Revised: 14 December 2021
/
Accepted: 21 December 2021
/
Published: 24 December 2021
(This article belongs to the Section Civil Engineering)
Abstract
:In this study, the reasonable aging time of lime soils with different ratios was determined to investigate the effect of aging on the internal mechanism of the dry shrinkage cracking of lime soil. To this end, the effects of aging time, lime content, and particle size on the volume crack rate, expansion and shrinkage rate, particle size distribution, and pH were analyzed using a dry–wet cycle, screening, and pH tests. In addition, the changes in the particle structure of the samples and the formation of new substances were analyzed. The results revealed that the volume crack and expansion shrinkage rates of the sample initially decreased, and then stabilized with increasing aging time. In addition, the aging time of the sample increased with increasing lime content and particle size. Further, at the initial aging stage, the volume crack and expansion/shrinkage rates of the sample increased with increasing lime content and particle size. With an increase in the aging time, the pH increased and then decreased significantly to 0.57–1.1% at the reasonable aging time. These indicate that the pH exhibited a significant effect on the reasonable aging time, and this will provide useful insights for the restoration of lime soil sites.
1. Introduction
Lime soil, which is composed of lime, clay, quartz sand, and other materials, exhibits a compact structure, high strength, and good compatibility with ancient buildings [1,2,3,4]. Particularly, lime soil is used in the construction of existing sites [5,6,7,8,9,10]. Although the remediation of lime soil sites does not require high mechanical properties, the susceptibility of insufficiently aged lime soil to hydration results in a reduction in its internal moisture, which results in dry shrinkage cracking [11,12,13,14]. Particularly, the alternating action of dry and wet cycles results in the generation of a large number of cracks and peeling to varying degrees, which adversely affect the stability and long-term preservation of earth sites [15,16]. In addition, the durability requirements of newly restored soil sites [17,18] reveal that the dry shrinkage cracking mechanism of lime soil is one of the key factors for analyzing the deterioration and disease prevention of soil sites.
To improve the characteristics of lime soil and reduce the hydration of lime, the “aging” of lime soil has been tremendously investigated. For example, Mascolo and Margalha explored the mechanism involved in the effect of aging time on the crystal transformation of calcium hydroxide (Ca(OH)2) [19,20]. In addition, Maafi and Wei reported that the aging time affects the particle size and high reactivity of Ca(OH)2, and can improve the mechanical properties, such as strength and hardness, of lime soil [21,22]. Furthermore, Mascolo investigated the effect of aging time on the size distribution and crystal formation of lime particles. The results revealed that an increase in the aging time of lime soil resulted in a change in the shape of Ca(OH)2 crystal from a prismatic to a plate shape, which resulted in an increase in the average crystal particle size [23]. Kang investigated the effects of water consumption during aging on the size distribution, chemical composition, and crystal formation of lime particles. The results revealed that the average particle size of lime decreased with an increase in water consumption; however, the water consumption of the lime particles had no significant effect on the Ca(OH)2 and calcium carbonate (CaCO3) contents [24]. Moreover, it is worth noting that Khattab confirmed that increasing the aging time of lime soil samples can reduce pozzolanic reaction in the soil and improve their durability [25]. Gu investigated the effects of factors, such as aging time and water to lime mass ratio, on the dispersion and activity of lime milk. The results revealed that the optimum water to lime mass ratio was 5:1. In addition, without aging, the Ca(OH)2 produced by lime digestion exhibited good dispersion and high activity [26]. Sweeney investigated the effects of aging time and lime content on the mechanical properties of lime-improved clay. The results revealed that the density and compressive strength of the lime soil samples decreased with increasing aging time. In addition, the aging time increased with increasing lime content, which reduced the plasticity index of the sample [27]. Moreover, an insufficient aging time resulted in the hydration reaction and expansion of calcium oxide (CaO), which resulted in the uplifting and cracking of lime soil [28,29]. In addition, a long aging time and low lime activity affect the mechanical properties of lime soil [30,31,32]. These indicate that the reasonable aging time plays an important role in guiding lime soil construction technology.
Current research on the aging of lime soil mainly focuses on the effect of aging on Ca(OH)2 and engineering application; however, research on the mechanism involved in the aging process of lime soil under the combined effects of lime and soil is rare. This study investigated the effects of the aging time, lime content, and particle size on the sample volume crack rate, expansion and contraction rate, particle size distribution, and pH of lime soil samples using the dry–wet cycle, screening, and pH detection tests. In addition, the micro-scale change in the particle structure, and the formation of new substances were analyzed using scanning electron microscopy (SEM) and an X-ray diffraction (XRD) analysis. Furthermore, the reasonable aging time of samples with different lime content and particle size was determined.
2. Materials and Methods
2.1. Materials
The soil used in the test is obtained from the peeling of a soil site in Kaifeng City. The soil is silty clay, the relative density is 2.24, the liquid limit is 32%, the plastic limit is 14%, and the plastic index is 18. The particle grading curve of soil sample is shown in Figure 1. High active Cao used for lime soil is massive and white in appearance.
The test parameters employed in this study to investigate the effects of aging time and lime content on the dry shrinkage cracking of lime soil samples are shown in Table 1. To investigate the effect of aging time and lime content on the dry shrinkage cracking of lime soil, samples with a lime particle size of 0.01–0.074 mm, lime content of 10, 20, and 30%, and aging time of 6, 12, 24, 48, 72, 120, and 168 h were prepared. To investigate the effect of lime particle size on the dry shrinkage cracking of samples, samples with a lime content of 20%, lime particle size of 0.01–0.074, 0.074–0.25, and 0.25–2 mm, and aging time of 6, 12, 24, 48, 72, 120, and 168 h were prepared. A total of 35 groups of samples were prepared, and the samples were named according to the lime content, lime particle size, and aging time. For example, a sample with a lime content, lime particle size, and aging time of 20%, 0.01–0.074 mm, and 6 h, respectively, was named as 20%–0.01–0.074 mm–6 h. The test process is shown in Figure 2.
2.2. Methods
The effects and mechanism involved in the effect of the aging time, lime content, and particle size on the dry shrinkage cracking of lime soil were analyzed using the dry–wet cycle test, screening test, pH detection test, XRD, and SEM.
The test parameters are shown in Table 1. To investigate the effects of various factors on the dry shrinkage cracking of lime soil, samples with different lime particle sizes and contents were prepared, and the analysis was performed at aging times of 6, 12, 24, 48, 72, 120, and 168 h. The samples were named according to the lime content, lime particle size, and aging time.
1. Preparation of bulk sample: Briefly, a soil sample was dried, crushed, and sieved using a 2 mm sieve. Subsequently, a large lime sample was crushed, and sieved using a sieve with different particle sizes. Thereafter, different proportions of the soil samples were mixed with lime, after which an appropriate amount of water was added and the mixture was mixed evenly. Lastly, samples with an initial moisture content of 20% were configured, after which the aging test was performed.
2. Aging test: Briefly, the prepared bulk sample was placed in a standard curing box (temperature: 20 °C, humidity: 95%) for aging at different times. During aging, 50 g of the aged samples (3 parallel samples) was obtained every 12 h, and dried. Subsequently, the average moisture content of the sample was measured, after which water was added to the sample to maintain the initial moisture content of 20%.
3. Dry–wet cycle test: After the aging test, 2000 g of the aged bulk sample was obtained and placed in a mold with a size of 25 cm × 25 cm, after which a Static compaction was performed in a 2 cm steel mold. Subsequently, the sample was placed in a temperature-controlled laboratory at a temperature of 40 °C for 36 h to dry the sample. Subsequently, water was uniformly sprayed on the surface of the sample using a watering can. The water spraying mass was 800 mL (Figure 3a shows the dry and wet cycle process of the sample). The drying and wetting process was recorded as one cycle, and a total of five dry–wet cycles were performed. During the test, the crack development process was recorded using a camera fixed above the sample.
4. Expansion and shrinkage test: The height of the sample was measured using a vernier caliper with an accuracy of 0.02 mm. To obtain more accurate data, the height of the soil samples was measured at eight different positions using a vernier caliper, after which the average mean value of these eight measured values was considered as the average height of the sample. The expansion and shrinkage test of the samples is shown in Figure 3b.
5. pH detection test: After the aging test, 20 g of the dried samples (three parallel samples) was obtained, and 100 mL distilled water was added to the sample, after which the mixture was mixed. Subsequently, the mixture was left to stand, after which the pH value of the supernatant was measured using a PGS–3C precision pH meter.
6. Screening test: The test took 200 g dried samples (set up 3 parallel samples) and screened the samples with different screen diameters. The screen hole diameters were 2, 1, 0.5, 0.25, 0.1, and 0.075 mm, respectively.
7. X-ray diffraction test: The test instrument adopted the X-ray diffractometer with the model of D8 produced by Brooke Company of Germany, and the scanning incidence angle was 10~70°. After drying and grinding, the samples were tested by X-ray diffraction to explore the changes of aging time on the internal chemical products of the samples.
8. Electron microscope test: The test instrument adopted a S570 scanning electron microscope generated by Hitachi of Japan. About a 0.5 cm3 block sample, sprayed gold on the fresh section, had an SEM test carried out to observe the evolution of chemical reaction products and microstructure in the sample after aging time.
2.3. Three-Dimensional (3D) Fracture Image Processing
To determine the appropriate indicators to describe the geometric characteristics of crack development in the samples, the cracks were quantified. Presently, the plane crack rate is widely used as the quantitative index of soil crack development. Accordingly, numerous scholars have determined the crack rate index of expansive soil through high-definition photo observation and computer image digital processing technology. However, the plane crack rate cannot describe the development of cracks into the soil. Therefore, this study employed the numerical analysis function of the MATLAB software, and determined the volume crack rate of the sample using the threshold of the image as the research object through the three-dimensional layer using integration [33].
To reduce the influence of the container boundary on soil cracking, the quantitative analysis was performed on the middle part of the sample (a size of 18 cm × 18 cm was selected). First, the image was divided, its size was adjusted, the lime efflorescence interface was removed, and other pretreatment processes were performed using Photoshop, image pro plus 6.0, and other software. The three-dimensional calculation principle of the soil sample and crack distribution is shown in Figure 4. A MATLAP software was used to extract the characteristic parameters of the three-dimensional (3D) volume fracture rate, and process the electron microscope image. Figure 5 shows a processed three-dimensional image.
Taking the gray image threshold as the medium, the image is divided into regions, and the zero product is the whole to obtain the crack volume, as shown in Formula (1).
where S is the area of each pixel. If the unit pixel is selected, S = 1 and M is the maximum gray value of the image; M = 255, the gray level corresponding to the ith pixel of Di. N is the total number of image pixels.
Since the sample is of standard shape, the soil can be regarded as a solid with equal cross-section. Equation (2) is the total volume of soil mass.
where, S (255) is defined as the cross-sectional area obtained by scanning when the image is all white including all areas of pores and soil particles.
Equation (3) is the volume crack rate of soil mass.
3. Results
3.1. Effect of Aging on the Volume Crack Rate of the Samples
Figure 6 shows the curve demonstrating the variation in the volume crack rate of the samples with different lime content, particle size, and aging time. In this study, the volume crack rates of the samples were analyzed and discussed after five dry and wet cycles. Figure 7 shows the three-dimensional crack diagram of the aged samples with different lime content and particle size after 6, 72, and 120 h aging, and five dry–wet cycles.
3.1.1. Effect of the Aging Time on the Volume Crack Rate of the Samples
At an aging time of 6 h, the volume crack rate of the sample reached a peak (Figure 6 and Figure 7). With an increase in the aging time, the volume crack rate of the sample first decreased, and then stabilized. With an increase in the aging time from 6 to 48 h, the volume crack rate of the samples decreased rapidly; however, with a further increase in the aging time beyond 48 h, the volume crack rate decreased gradually and gradually stabilized. At the initial aging stage, as the hydration reaction progressed, the lime content of the samples decreased rapidly, and the expansion cracking effect induced by the dry–wet cycle decreased, which resulted in a decrease in the volume crack rate. With an increase in the aging time, the lime content of the sample decreased gradually, and the reduction rate of the volume crack rate decreased. With an increase in the lime content, the aging time of the sample increased. The stable volume crack rates of the samples with a lime content of 10, 20, and 30% were observed at aging times of 48, 72, and 120 h, respectively. In addition, the stable volumetric crack rates of the samples with a lime particle size of 0.01–0.074, 0.074–0.5, and 0.5–2 mm were observed at 72, 120, and 120 h, respectively.
3.1.2. Effect of the Lime Content on the Volume Crack Rate of the Samples
The volume crack rate of the samples increased with increasing lime content (Figure 6a). In addition, the volume crack rates of the 6 h-aged samples with lime contents of 10, 20, and 30% after five dry–wet cycles were 4.4, 6.0, and 54.0%, respectively (Figure 7). Among the samples, the sample with a lime content of 30% exhibited the highest volume crack rate. This could be attributed to the fact that the high lime content in the soil and the insufficient aging time prevented the complete reaction of lime with water. During the dry–wet cycle, the unreacted CaO reacted with water and released a large amount of heat, which resulted in the expansion of the sample, and the uplifting and cracking of the sample. With an increase in the aging time, the influence of the lime content on the crack development of the samples gradually decreased. At an aging time of 120 h, there was no significant difference in the volume crack rate of the samples with different lime content.
3.1.3. Effect of the Lime Particle Size on the Volume Crack Rate of the Samples
At the initial aging stage, the volume crack rate of the sample increased with the increasing lime particle size (Figure 6b). At an aging time of 6 h, the volume crack rates of the samples with lime particle sizes of 0.01–0.074, 0.074–0.5, and 0.5–2 mm after five dry and wet cycles were 6.1, 7.6, and 25.0%, respectively (Figure 7d–f,j–o). In addition, a lime particle size of 0.5–2 mm exhibited a significant effect on the volumetric crack rate of the sample. Further, with an increase in the lime particle size, there was a decrease in the specific surface area of CaO in contact with water and the hydration reaction rate. In addition, the hydration between CaO and water resulted in the expansion and cracking of the sample. It is worth noting that at an aging time of 72 h, the rate of decrease in the volume crack rate of the sample with a lime particle size of 0.5–2 mm was higher than those of the samples with other lime particle sizes. This may be attributed to the fact that the expansion cracking effect of the sample induced by the hydration reaction at an aging time of 72 h was small, and the fact that there was an increase in the amount of CaCO3 crystals produced in the 0.5–2 mm sample, which facilitated the bonding of soil particles to lime. In addition, the static pressure compaction enhanced the mechanical properties of lime soil and weakened crack development in the soil.
3.2. Effect of Aging on the Expansion of the Samples
To analyze the expansion deformation of the samples, the expansion height of the sample was measured, and the expansion rate was compared to the thickness of the sample. The expansion rates of the samples with different aging times, lime content, and particle size after five dry–wet cycles are shown in Figure 8.
3.2.1. Effect of the Aging Time on the Expansion of the Samples
At an aging time of 6 h, the volume crack rate of the sample reached a peak (Figure 8). With an increase in the aging time, the expansion rate of the sample decreased, and then stabilized (except the 20%–0.01–0.074 mm sample). The optimum expansion rate of the 20%–0.01–0.074 mm sample was observed at 24–48 h, after which the expansion rate increased slightly. This may be attributed to the cementation of clay particles with carbonate materials at the initial aging stage, which resulted in an agglomeration effect; however, the dry–wet cycle induced the dissolution of cemented materials owing to the weak intergranular cementation. Consequently, the expansion rate of the sample increased instead of decreasing. With an increase in the aging time, the intergranular cementation in the samples increased, and the expansion rate decreased. With a further increase in the aging time to 72–120 h, the change in the expansion rate of the samples stabilized. In addition, with an increase in the lime content and particle size of the samples, the reasonable aging time of the sample increased. The stable expansion rates of the 30%–0.01–0.074 mm, 20%–0.074–0.5 mm, and 20%–0.5–2 mm samples were observed at an aging time of 120 h.
3.2.2. Effect of the Lime Content on the Expansion of the Samples
At a constant aging time, the expansion rate of the sample increased with an increase in the lime content (Figure 8a). At an aging time of 6 h, the expansion rates of the samples with a lime content of 10, 20, and 30% were 6.0, 15.1, and 31.0%, respectively. In addition, the expansion rate of the 30% lime content sample was 5.17 and 2.51 times higher than those of the 10 and 20% lime content samples, respectively. Furthermore, at a low aging time, there was no notable expansion in the samples during the dry–wet cycles with an increase in the lime content. Furthermore, with an increase in the aging time, the influence of the lime content on the sample decreased gradually. At an aging time of 120 h, the expansion rates of the samples with different lime contents were similar.
3.2.3. Effect of the Lime Particle Size on the Expansion of the Samples
At the initial aging stage, the expansion rate of the sample first increased with an increase in the lime particle size (Figure 8b). At an aging time of 6 h, the expansion rate of samples with a particle size of 0.5–2 mm after five dry–wet cycles was 1.52 and 1.15 times higher than those of the 0.01–0.074 and 0.074–0.5 mm samples, respectively. At an aging time of 72–120 h, the decrease in the expansion rate of the samples with a lime particle size of 0.5–2 mm was higher than those of the samples with a lime particle size of 0.01–0.074 and 0.074–0.5 mm. This may be attributed to the decrease in the sample expansion effect induced by the hydration reaction at an aging time of 72–120 h, and the increase in the CaCO3 crystal content of the 0.5–2 mm sample. In addition, the fine clay particles in the sample were wrapped by calcified crystals and silicates, and there was a decrease in the clay content, which resulted in a decrease in the liquid plastic limit [30] and expansion rate of the sample.
3.3. Effect of Aging on the Shrinkage of the Samples
Figure 9 shows the curve demonstrating the change in the shrinkage of the samples with different lime content, particle size, and aging time after five dry–wet cycles. Figure 9a shows the curve demonstrating the change in the shrinkage of the samples with different lime content and aging time, and Figure 9b shows the curve displaying the change in the shrinkage of the samples with a different lime particle size and aging time.
3.3.1. Effect of Aging Time on the Shrinkage of the Samples
At an aging time of 6 h, the shrinkage of the samples increased and reached a peak (Figure 9). The shrinkage of a sample corresponds to its water holding capacity. At a low aging time, a hydration reaction occurred in the sample during the dry–wet cycle, expansion cracking occurred, there was severe internal damage of the soil, and a deterioration in the water holding capacity of the sample, resulting in a significant shrinkage of the samples. With an increase in the aging time, the shrinkage of the samples decreased, and then stabilized. The optimum shrinkage of the 20%–0.01–0.074 mm sample was observed at an aging time of 24–48 h, after which there was a slight decrease in the shrinkage of the sample. This may be attributed to the weak cementation between the clay particles and carbonates in the sample at the initial aging stage, the expansion and cracking phenomenon of the sample caused by the dry–wet cycle, and the damaged internal structure of the sample. In addition, the sample exhibited a poor water holding capacity, which resulted in a reduction in the shrinkage rate of the sample, which was either significantly reduced or even almost constant. With an increase in the aging time, there was an enhancement in the intergranular cementation and a reduction in the shrinkage of the sample. With a further increase in the aging time to 72–120 h, the shrinkage deformation of the sample stabilized. The required aging time for the shrinkage of the samples increased with an increase in the lime particle size and content. In addition, the change in the shrinkage of the 30%–0.01–0.074 mm, 20%–0.074–0.5 mm, and 20%–0.5–2 mm samples was stable after aging for 120 h.
3.3.2. Effect of the Lime Content on the Shrinkage of the Samples
At the initial aging stage, the shrinkage of the sample increased with an increase in the lime content (Figure 9a). At an aging time of 6 h and lime content of 10, 20, and 30%, the shrinkage rates of the samples after five dry–wet cycles were 3.9, 12.5, and 29.1%, respectively. At a low aging time, with an increase in the lime content of the samples, the wet–dry cycle induced a notable damage in the microstructure of the sample, and severe internal damage, which resulted in a poor water holding capacity and large shrinkage. With an increase in the aging time to 72–168 h, the shrinkage of the 20%–0.01–0.074 mm sample was less than that of the 10%–0.01–0.074 mm sample. This may be attributed to the fact that the 20%–0.01–0.074 mm sample produced a higher amount of carbonate materials and clay particles, which formed a more stable cementation during aging. In addition, there was a reduction in the liquid plastic limit of the sample, which resulted in a decrease in the shrinkage of the sample. With an increase in the aging time, the effect of the lime content on the shrinkage of the sample decreased gradually. With an increase in the aging time to 120 h, the shrinkage rates of the samples with lime contents of 10, 20, and 30% were 0.8, 0.1, and 2.1%, respectively.
3.3.3. Effect of the Lime Particle Size on the Sample Shrinkage
At the initial aging stage, the shrinkage rate of the sample increased with increasing lime particle size (Figure 9b). At an aging time of 6 h, the shrinkage of the samples with a lime particle size of 0.5–2 mm and 0.074–0.5 mm was 2.23 and 1.6 times higher than that of the samples with a particle size of 0.01–0.074 mm. In addition, the result revealed that a lime particle size of 0.5–2 mm had a notable effect on the shrinkage of the sample. At an aging time of 72–120 h, the shrinkage reduction rate of the samples with a lime particle size of 0.5–2 mm was higher than those of the samples with lime particle sizes of 0.01–0.074 and 0.074–0.5 mm. This may be attributed to the low clay content in the 0.5–2 mm sample. With an increase in the aging time, there was a gradual decrease in the effect of the lime particle size on the shrinkage of the sample. With an increase in the aging time to 120 h, the lime particle size had no significant effect on the shrinkage of the sample.
3.4. Effect of Aging on the pH of the Samples
Figure 10 shows the curve revealing the change in the pH of the samples with a different lime content, particle size, and aging time. Figure 10a shows the curve displaying the change in the pH of the samples with a different lime content and aging time, and Figure 10b shows the curve with the change in the pH of the samples with a different lime particle size and aging time.
3.4.1. Effect of the Aging Time on the pH of the Samples
With an increase in the aging time, the pH of the samples first increased, and then decreased (Figure 10). At an aging time of 24–48 h, the pH of the samples increased and reached a peak. In addition, the CaO in the lime soil samples rapidly reacted with water to produce a large amount of Ca(OH)2 within a short time, which resulted in an increase in the pH of the sample. With an increase in the aging time, a part of the Ca(OH)2 carbonized with CO2 in the air to form CaCO3 crystals, which consumed a part of the OH− in the sample, resulting in a rapid decline in the pH value of the sample. At an aging time of 48–72 h, there was a significant increase in the pH reduction rate of the sample. With a further increase in the aging time and gradual decrease in the Ca(OH)2 content, the OH− consumed by the crystallization precipitation of CaCO3 was relatively limited, which resulted in a gradual decrease in the reduction rate of the pH values of the samples.
3.4.2. Effect of the Lime Content on the pH of the Samples
At the initial aging stage, the pH of the samples increased with increasing lime content (Figure 10a). The pH of the samples with 10 and 20% lime content reached a peak after 24 h, and the peak pH of the samples was 12.36 and 12.42, respectively. In addition, the sample with a lime content of 30% reached a pH peak of 12.52 after 48 h. With an increase in the lime content, the required aging time of the sample and the generation of Ca(OH)2 increased, resulting in an increase in the pH peak point of the sample. This may be attributed to the carbonation reaction of the increased Ca(OH)2 generated in the sample containing a lime content of 20%, which consumed a part of the OH− in the sample, and rapidly reduced the pH value of the sample. With an increase in the aging time, the CaO hydration reaction of the sample containing a lime content of 30% progressed. In addition, although there was a continuous generation of carbonization products in the sample, there was no significant difference between the generation and consumption of OH− in the sample, thus decreasing the reduction rate of the pH of the sample.
At an aging time of 6–48 h, the pH of the samples decreased with increasing lime particle size (Figure 10b). In addition, the required aging time for the peak pH of the sample increased with an increase in the lime particle size, and the required aging times for the pH peak point of the samples with a lime particle size of 0.01–0.074, 0.074–0.5, and 0.5–2 mm were 24, 48, and 48 h, respectively. With an increase in the lime particle size, the specific surface area of the sample in contact with water decreased, the rate of the hydration reaction decreased, the required aging time increased, and the amount of OH− in the sample was generally low, resulting in a reduction in the pH peak point. At an aging time of 72–168 h, there was a significant decrease in the pH of the 20%–0.01–0.074 mm sample. This may be attributed to the small lime particle size of the sample, fast hydration reaction rate, increased Ca(OH)2 generation, occurrence of the carbonization reaction, consumption of some OH−, and the high pH reduction rate.
3.5. Effect of Aging on the Particle Distribution of the Samples
The particle grading curves of the samples with a different lime content, particle size, and aging time are shown in Figure 11. The particle grading curves of the samples with different lime contents and aging times are shown in Figure 11a–c. The particle grading curves of the samples with different lime particle sizes and aging times are shown in Figure 11b,d,e.
3.5.1. Effect of the Aging Time on the Particle Size of the Samples
The effect of the aging time on the particle size of the lime soil samples was observed in the particle size range from 0.01–0.5 mm (Figure 11). With an increase in the aging time, the content of particles with a size of 0.01–0.1 mm decreased, whereas that of particles with a size of 0.1–0.5 mm increased. After the lime aging treatment, the soil particles exhibited a notable agglomeration effect, in which small particles were cemented together to form large particles, and a relatively stable bond was formed between these particles. In addition, there was a chemical reaction between lime and soil particles, which resulted in the “modification” of the site soil, the reduction of clay particles, and the reduction of the liquid plastic limit of the samples [34,35,36]. Consequently, there was a reduction in the crack expansion deformation capacity of the sample and the expansion cracking effect induced by the dry–wet cycle.
3.5.2. Effect of the Lime Content on the Particle Size of the Samples
During aging, the proportion of particles with a size of 0.01–0.1 mm gradually decreased with increasing lime content, whereas there was a continuous increase in the content of particles with a size of 0.25–0.5 mm. In addition, small particles bonded together to form medium particles (Figure 11a–c). It is worth noting that the particle size of the sample containing a lime content of 30% decreased by 0.5–1 mm, and some large particles were transformed into medium particles, which may be attributed to the excessive lime content of the sample. At the initial aging stage, tremendous heat was generated by CaO during the digestion process, resulting in a sudden increase in temperature, which resulted in the disintegration of large particles and the increase in the content of the medium-sized particles.
3.5.3. Effect of the Lime Particle Size on the Particle Size of the Samples
At a constant aging time and lime content, there was a gradual increase in the particle size of the aged lime soil samples with increasing lime particle size (Figure 11b,e,f). The influence of the lime particle size on the particle size distribution of the soil samples was concentrated in the particle size range of 0.01–0.5 mm. Particularly, with an increase in the lime particle size, the size of particles with a size of 0.1–0.5 mm increased rapidly, and then stabilized. In addition, the particle size of lime soil with a particle size of 0.01–0.1 mm decreased gradually with the increasing lime particle size.
4. Discussion
4.1. Effect of pH on the Dry Shrinkage Cracking of the Samples
For the insufficiently aged sample, during the dry–wet cycle, CaO reacted with water to produce Ca(OH)2, and this process was accompanied with the release of tremendous heat, which resulted in the uplifting and cracking of the sample. During aging, the change in the pH of the sample was closely related to the occurrence of the CaO hydration reaction and the content of Ca(OH)2. To further explore the internal mechanism involved in the effect of pH on the cracking of lime soil, nine groups of representative samples were selected for an XRD analysis to explore the formation and change in the internal products of the samples with a different lime content and particle size under a different aging time. For this analysis, samples with a lime content of 20 and 30%, lime particle size of 0.01–0.074 mm, and aging time of 6, 48, 72, and 168 h, were selected. In addition, samples with a lime content of 20%, lime particle size of 0.5–2 mm, and aging times of 6, 48, 72, and 168 h were prepared. Figure 12 shows the XRD results, and Figure 13 shows the fitting curve of the XRD results.
1. At the initial aging stage, a large amount of CaO rapidly reacted with water to form Ca(OH)2. Accordingly, the CaO content decreased with an increase in the aging time. With an increase in the lime content, the time required for the consumption of CaO increased. The CaO content of the 20%–0.01–0.074 mm sample after 72 h aging was 0.8%, whereas that of the 30%–0.01–0.074 mm sample decreased to 0.1% after 120 h aging. With an increase in the lime particle size, the time required for the consumption of CaO increased. At an aging time of 120 h, the CaO content of the 20%–0.5–2 mm sample decreased to 0.2%.
2. With an increase in the aging time, the Ca(OH)2 content first increased and then decreased. In addition, with an increase in the lime content and particle size, the required aging time for the peak Ca(OH)2 content increased. For example, the aging times required for the peak Ca(OH)2 content in the 20%–0.01–0.074 mm, 30%–0.01–0.074 mm, and 20%–0.5–2 mm samples were 48, 72, and 72 h, respectively.
3. Ca(OH)2 carbonized with the CO2 in air to form CaCO3, which was attached to the surface of Ca(OH)2 [37]. CaCO3 crystals exhibited a low diffraction peak intensity, low CO2 content in natural air, slow carbonization reaction, and limited carbonization products. In addition, CaO, SiO2, and Al2O3 reacted to form albite, which consumed part of CaO and SiO2, resulting in the reduction of the diffraction peaks of CaO and SiO2 in the sample.
Figure 14 shows the fitting curve of the correlation between the pH and Ca(OH)2 content of the samples. There was a good positive correlation between the pH and Ca(OH)2 content of the samples during aging (Figure 14). With an increase in the aging time, the pH and Ca(OH)2 content of the samples increased, and then decreased. In addition, the amount of Ca(OH)2 produced by the hydration reaction of CaO and the pH of the sample increased. Further, when the peak pH was attained, a large amount of CaO was transformed into Ca(OH)2. With an increase in the aging time, a small amount of CaO continued to react to form Ca(OH)2. Consequently, a part of Ca(OH)2 was carbonized to form CaCO3, which consumed a part of Ca(OH)2, thus decreasing the pH of the sample.
4.2. Effect of the Particle Distribution on the Dry Shrinkage Cracking of the Samples
To further explore the internal mechanism involved in the effect of the particle distribution on the cracking of the lime soil, nine groups of representative samples were selected for an SEM analysis at a magnification of 500 and 2000X. The SEM was performed to observe the effects of the aging time, lime content, and particle size on the microstructure of the samples. The SEM test results are shown in Figure 15. Figure 15a–f show the SEM images of the samples with a lime content of 20 and 30% and particle size of 0.01–0.074 mm at aging times of 6, 72, and 120 h. Figure 15g–i shows the SEM images of the samples with a lime particle size of 0.5–2 mm and lime content of 20% at aging times of 6, 72, and 120 h. The SEM observation revealed that:
1. The aging time had a significant effect on the structures of the particles in the sample (Figure 15). At an aging time of 6 h, the digested Ca(OH)2 exhibited a disordered morphology. In addition, during digestion, CaO generated tremendous heat, which resulted in a sudden increase in the temperature of the samples, and an uneven heat distribution, which affected the growth on the surface of the Ca(OH)2 crystals. Furthermore, from a macro-scale perspective, the soil was susceptible to cracking. With an increase in the aging time, the soil particles exhibited a gradually regular shape, a notable agglomeration effect, and the aggregates and clay fine particles were wrapped by calcified crystals and silicates. In addition, small particles were cemented together to form larger particles, and a relatively stable bond was formed between these particles. This is one of the important reasons for the weakening of the degree of cracks in the soil [38,39].
2. With an increase in the lime content, there was a general increase in the particle size of the lime soil (Figure 15a–f). Particularly, the particle size of the sample with 30% lime content was larger than that of the sample with 20% lime content. With an increase in the lime content, the soil particles exhibited a notable agglomeration reaction with lime. In addition, some Ca(OH)2 grains were wrapped on the surface of CaO, which was not completely hydrated during digestion, thus controlling the hydration reaction of CaO. With an increase in the aging time to 120 h, the Ca(OH)2 crystals gradually dissolved and recrystallized, and the crystals exhibited a uniform and regular distribution.
3. An increase in the lime particle size affected the size distribution of lime soil particles during aging (Figure 15a–c,g–i). The aged lime soil particles with a large particle size were mainly large and medium particles, and there were few fine particles. During the hydration of CaO to Ca(OH)2, CaO with a large specific surface area formed Ca(OH)2 particles in the liquid phase system, after which the particles were deposited on the surface of the large grains. Some Ca2+ reacted with CO2 in the liquid phase to form CaCO3, which was attached to the surface of Ca(OH)2 and blocked a part of the surface pore structure, which resulted in an increase in the particle size of the soil samples.
4.3. Effects of pH and Particle Size on the Reasonable Aging Time of the Lime Soil Samples
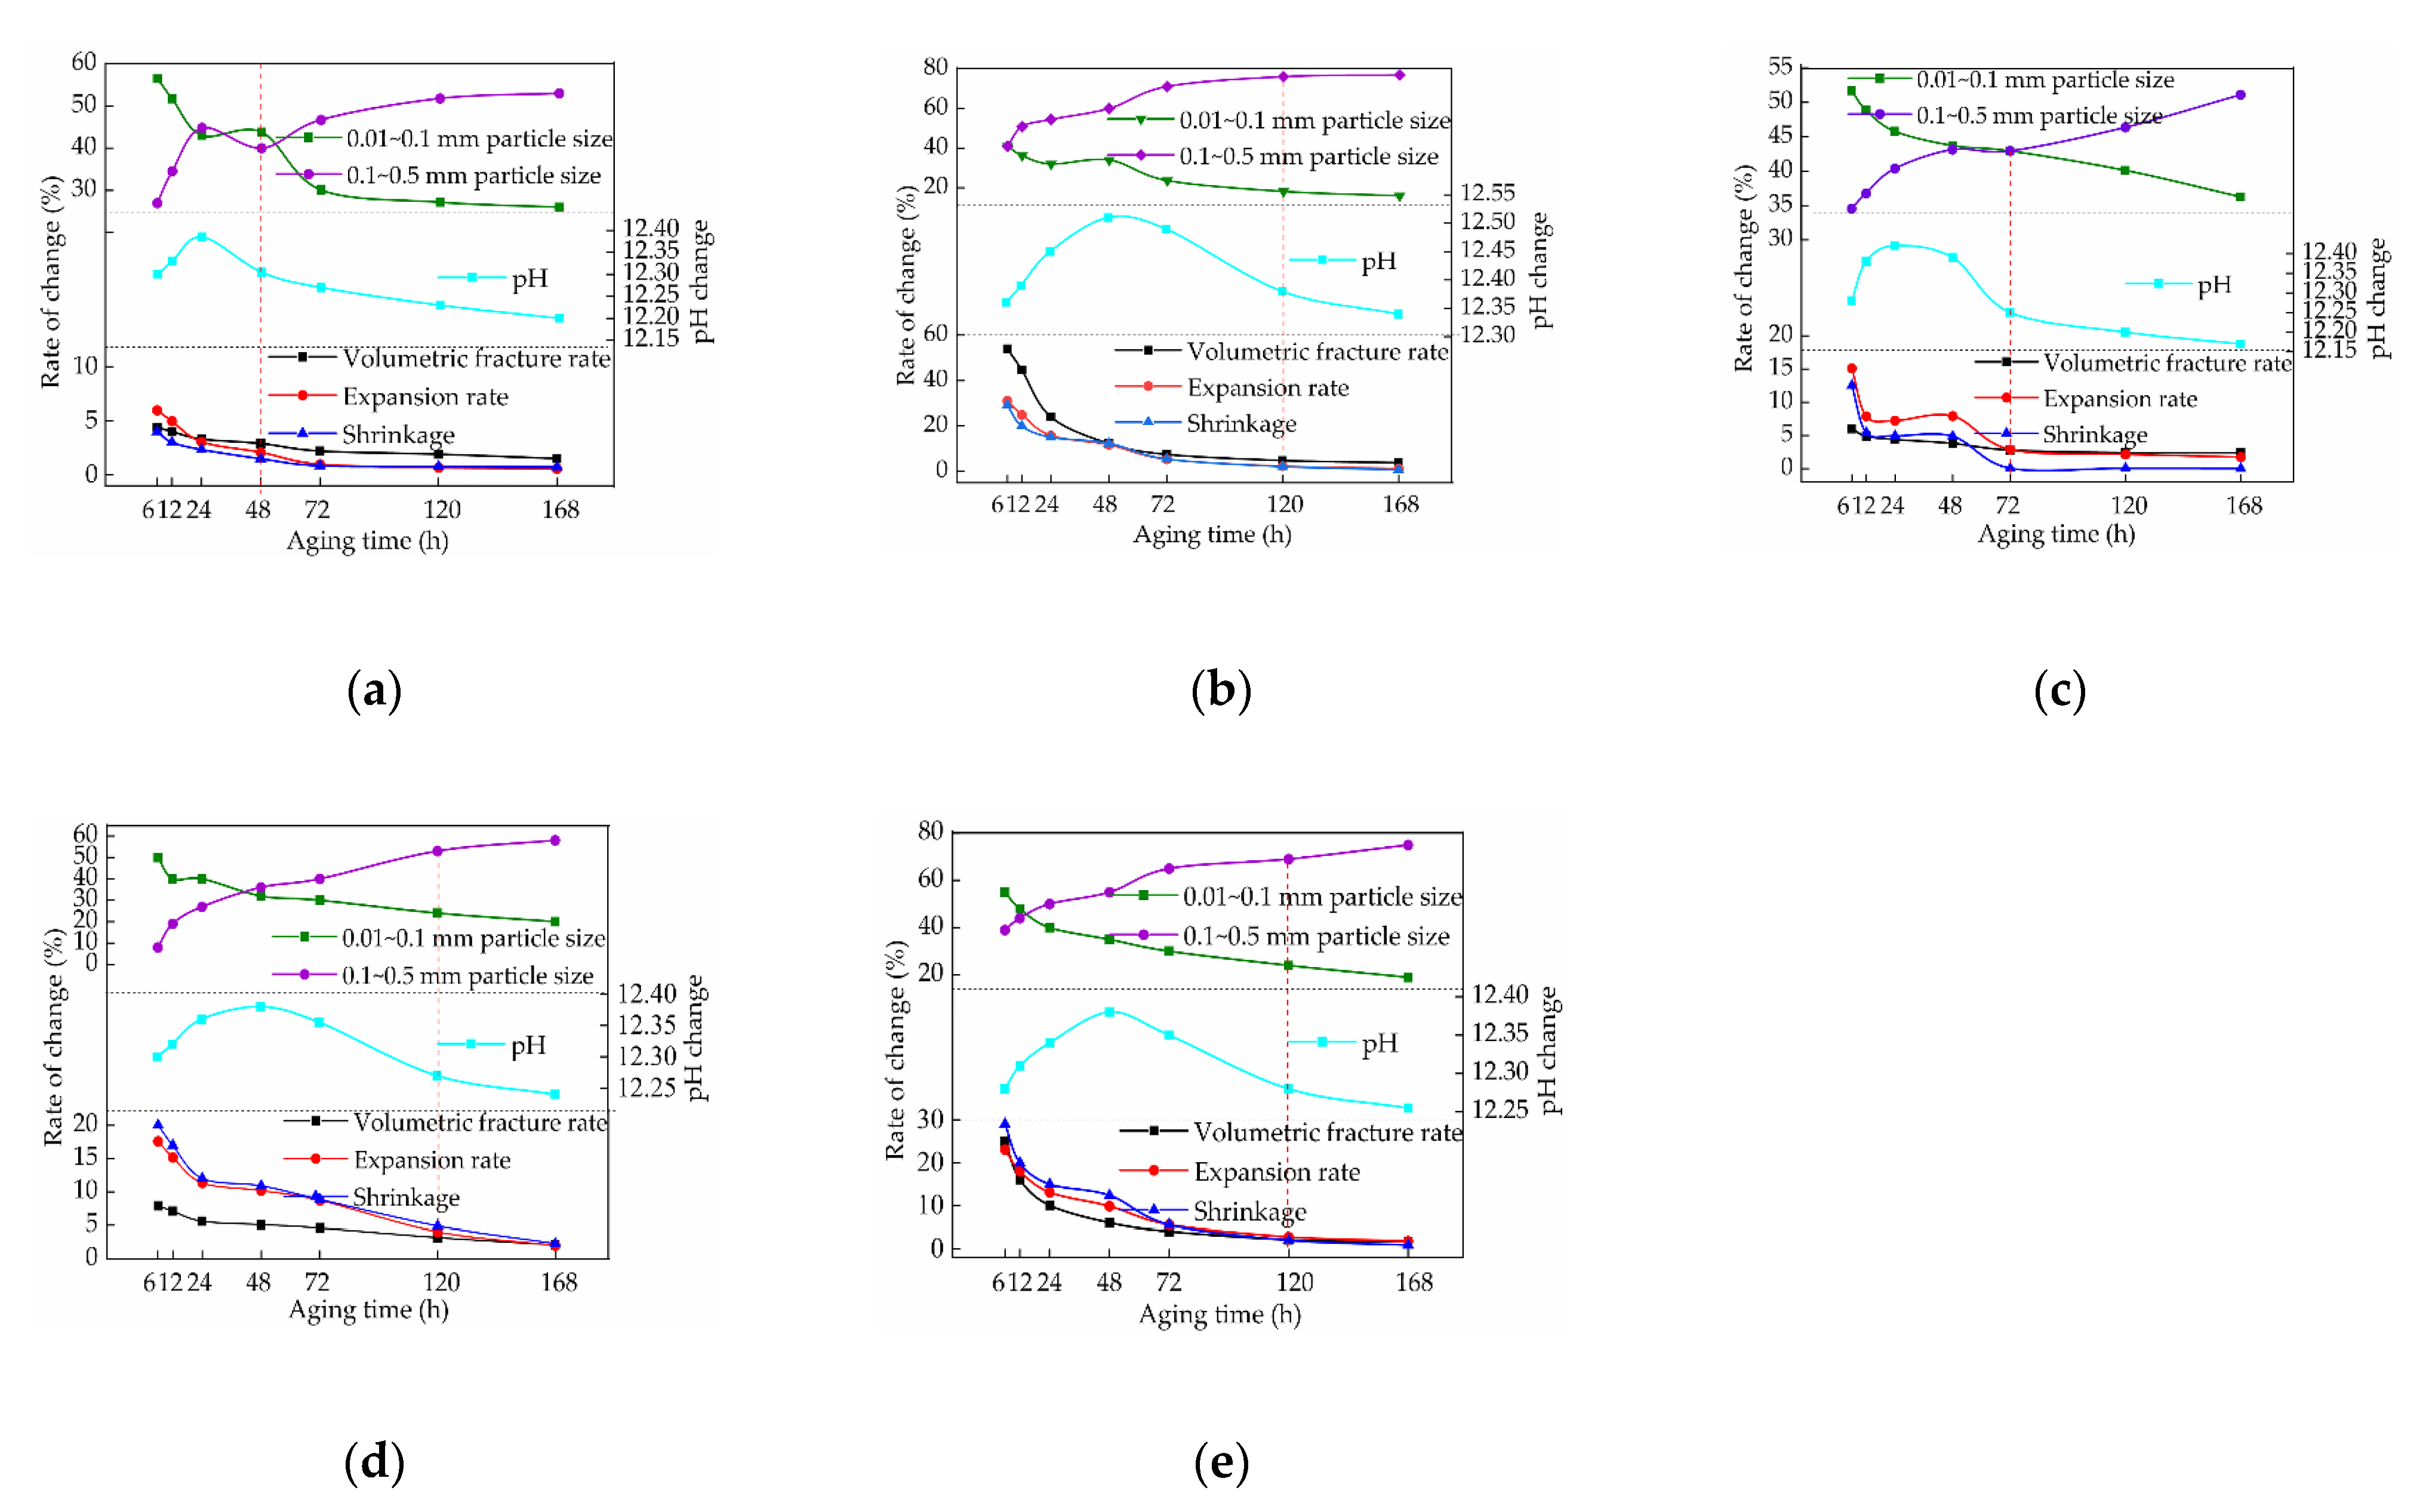
The reasonable aging time is an important factor for the restoration of earthen sites. The test results revealed that the lime content, particle size, and aging time of the samples affected the characteristic parameters of the samples, such as volume crack rate, expansion and contraction rate, pH, and particle size distribution. Volume crack rate and expansion shrinkage rate are macro characterization parameters that affect the dry shrinkage cracking of the samples. In addition, the pH and particle size distribution are internal factors affecting lime soil cracking. The analysis of the aforementioned characteristic parameters enabled the determination of the reasonable aging time of the samples with a different lime content and particle size. The volume crack, expansion, and shrinkage rates of the sample after five dry–wet cycles were investigated. The aging time affected the particle size of the lime soil samples containing lime particles with a size range of 0.01–0.5 mm. The results of the analysis of the characteristic parameters of the samples with a different lime content and aging time are shown in Figure 16a–c. The characteristic parameters of the samples with a different lime particle size and aging time are shown in Figure 16b,d,e.
With an increase in the aging time, the volume crack and expansion shrinkage rates of the samples with different lime contents decreased, and then stabilized (Figure 16a–c). In addition, the changes in the 10%–0.01–0.074 mm, 20%–0.01–0.074 mm, and 30%–0.01–0.074 mm samples were stable at aging times of 48, 72, and 120 h, respectively. Furthermore, the pH of the samples with different lime contents increased, and then decreased with the increasing aging time. The pH of the 10%–0.01–0.074 mm, 20%–0.01–0.074 mm, and 30%–0.01–0.074 mm samples decreased significantly at 48, 72, and 120 h, respectively, and the corresponding pH decline rates were 0.65, 1.1, and 0.88%, respectively. At this time, the lime soil aging process was over.
The stable volume crack and expansion shrinkage rates of the 20%–0.01–0.074 mm, 20%–0.074–0.5 mm, and 20%–0.5–2 mm samples were observed at aging times of 72, 120, and 120 h, respectively (Figure 16b,d,e). At these aging times, the pH of the samples exhibited a notable decline, and the pH decline rates were 1.1, 0.69, and 0.57%, respectively.
With an increase in the aging time, the content of the particles with a size of 0.01–0.1 mm decreased, and that of the particles with a size of 0.1–0.5 mm increased (Figure 16a–c). Furthermore, particles with a size of 0.01–0.1 mm were observed in the 10%–0.01–0.074 mm, 20%–0.01–0.074 mm, and 30%–0.01–0.074 mm samples at an aging time of 48, 72, and 120 h, respectively. In addition, there was no significant difference between the decrease and the increase in the content of particles with a size of 0.1–0.5 mm, and the difference was 0–13%. Furthermore, there was a small difference between the decrease in the content of particles with a size of 0.01–0.1 mm and the increase in the content of particles with a size of 0.1–0.5 mm in the 20%–0.01–0.074 mm, 20%–0.074–0.5 mm, and 20%–0.5–2 mm samples at 72, 120, and 120 h, respectively, and the difference was 2–11% (Figure 16b,d,e).
These results indicate that the reasonable aging time of the samples increased with increasing lime content. The reasonable aging times of the 10%–0.01–0.074 mm, 20%–0.01–0.074 mm, and 30%–0.01–0.074 mm samples were 48, 72, and 120 h, respectively. This indicates that the reasonable aging time of the samples increased with the increasing lime particle size. The reasonable aging time of the 20%–0.01–0.074 mm, 20%–0.074–0.5 mm, and 20%–0.5–2 mm samples were 72, 120, and 120 h, respectively.
The changes in the pH and particle size of the samples affected the dry shrinkage cracking of the sample. With an increase in the aging time, a large amount of CaO reacted with water to form Ca(OH)2, and the pH of the samples increased and reached a peak. With an increase in the aging time, the pH of the samples exhibited a notable decreasing trend (decreasing rate of 0.48–0.80%). At this time, the aging process of lime soil was over. With an increase in the aging time, the content of particles with a particle size of 0.01–0.1 mm decreased and that with a particle size of 0.1–0.5 mm increased. The decrease in the content of the particles with a particle size of 0.01–0.1 mm in the sample reaching the reasonable aging time was consistent with the increase in the content of the particles with a size of 0.1–0.5, and the difference between the two particle sizes was 0–13%. With a further increase in the aging time, the size of the large particles increased, whereas that of the small particles decreased; thus, this reduced the soil non-uniformity coefficient and affected the mechanical properties of lime soil.
5. Conclusions
In this study, the effects of the different aging time, lime content, and particle size on the dry shrinkage properties of lime soil were investigated using a dry–wet cycle, screening, and pH detection tests. In addition, the micro-scale change in the particle structure and the formation of new substances were analyzed using an SEM and XRD analysis, and the internal factors causing the micro-scale cracking of lime soil were discussed. The following observations were made in this study.
1. The reasonable aging time of the samples can be determined by pH and particle size distribution. At the reasonable aging time, the pH of the samples exhibited a notable decreasing trend (the decreasing rate was 0.57–1.1%). Simultaneously, the contents of CaO and Ca(OH)2 crystals in the sample decreased and gradually stabilized. The reasonable aging time can improve the particle agglomeration effect of lime soil. The decrease in the content of particles with a size of 0.01–0.1 mm was consistent with the increase in the content of particles with a size of 0.1–0.5 mm, and the difference in the particle size was 0–13%.
2. At the initial aging stage, with an increase in the aging time, the volume crack and expansion shrinkage rates of the samples increased with the increasing lime content and particle size, decreased, and then stabilized. With an increase in the lime content, the aging time of the samples increased. In addition, with an increase in the aging time, the decline rate of the volume crack and expansion/shrinkage rates increased with the increasing lime particle size. Furthermore, the decline rate in the volume crack and expansion/shrinkage rates of the 20%–0.5–2 mm sample was higher than that of the 20%–0.01–0.074 mm, and 20%–0.074–0.5 mm samples.
3. The reasonable aging times of the 10%–0.01–0.074 mm, 20%–0.01–0.074 mm, and 30%–0.01–0.074 mm samples were 48, 72, and 120 h, respectively. In addition, the reasonable aging times of the 20%–0.01–0.074 mm, 20%–0.074–0.5 mm, and 20%–0.5–2 mm samples were 72, 120, and 120 h, respectively. The research results provide a reasonable aging time for different proportions of lime soil. In addition, the moisture content, humidity, and temperature during the aging process all have an impact on the shrinkage and cracking of lime soil, and further research is needed.
Author Contributions
Funding acquisition, J.Y.; Writing—original draft preparation, Y.C.; Test design and implementation, Y.C.; Data curation, Y.C.; Put forward ideas, J.Y. and Y.C.; Writing—review and editing, J.Y., Y.C., S.W., X.Y., Y.Z. and L.Z.; Supervision, W.L., H.G. and H.S.; All authors have read and agreed to the published version of the manuscript.
Funding
The research was supported by the National Natural Science Foundation of China (51978634), the Discipline Cultivation Project of Henan University (2019ylzdcg05) and the Science and Technology Development Plan of Henan Province (212102310287, 212102310271).
Institutional Review Board Statement
Not applicable.
Informed Consent Statement
Not applicable.
Data Availability Statement
The data provided in this study can be obtained from the second author Chen Ying.
Conflicts of Interest
The authors declare that the work is original research that has not been published previously and is not under consideration for publication elsewhere. No conflicts of interest exist in the submission of this paper, and the paper is approved by all authors for publication.
References
- Wei, G.; Germinario, C.; Grifa, C.; Ma, X. Characterization of ancient building lime mortars of Anhui Province of China: A multi-analytical approach. Archaeometry 2020, 62, 888–903. [Google Scholar] [CrossRef]
- Mascolo, M.C.; Colantuono, A.; Vecchio, S.D.; Mascolo, G. Self-Assembled 3D Portlandite Crystals upon Aging of Lime Putty. J. Comput. Theor. Nanosci. 2017, 23, 5938–5940. [Google Scholar] [CrossRef]
- Yang, Y.; Zhang, N.; Zhang, L.; Rong, H.; Wei, C.J. Effect of modified materials on hygrothermal properties of raw soil blocks. J. Bulid. Mater. 2021, 24, 313–317. [Google Scholar]
- Giulia, G.; Costanza, C.; Manuela, C.; Dimitri, D.; Michaël, P.; Giacomo, R.; Enza, V. Multi-scale analysis of the mechanical improvement induced by lime addition on a pyroclastic soil. Eng. Geol. 2017, 221, 193–201. [Google Scholar]
- Branco, F.C.; Belgas, M.D.; Mendes, C.; Pereira, L.; Ortega, J.M. Mechanical Performance of Lime Mortar Coatings for Rehabilitation of Masonry Elements in Old and Historical Buildings. Sustainability 2021, 13, 3281. [Google Scholar] [CrossRef]
- Yue, J.W.; Lin, J.; Wang, Y.F.; Liu, T.J.; Zhang, Y.F.; Wang, S.Y.; Wang, W.Z. Study on improvement of soil water physical properties of Kaifeng imitation site. Adv. Eng. Sci. 2020, 52, 46–55. [Google Scholar]
- Cecconi, M.; Cambi, C.; Carrisi, S.; Deneele, D.; Vitale, E.; Russo, G. Sustainable Improvement of Zeolitic Pyroclastic Soils for the Preservation of Historical Sites. Appl. Sci. 2020, 10, 899. [Google Scholar] [CrossRef] [Green Version]
- Lee, G.; Park, J.H.; Pham, K.V.A.; Lee, C.H.; Lee, K. Experimental Investigation of Traditional Clay Brick and Lime Mortar Intended for Restoration of Cultural Heritage Sites. Appl. Sci. 2021, 11, 6228. [Google Scholar] [CrossRef]
- Arizzi, A.; Viles, H.; Cultrone, G. Experimental testing of the durability of lime based mortars used for rendering historic buildings. Constr. Build. Mater. 2012, 28, 807–818. [Google Scholar] [CrossRef]
- Kong, D.; Chen, J.; Wan, R.; Liu, H. Study on restoration materials for historical silty earthen Sites based on lime and starch ether. Adv. Mater. Sci. Eng. 2020, 6, 2850780. [Google Scholar] [CrossRef]
- Consoli, N.C.; Marin, E.; Samaniego, R.; Filho, H.; Cristelo, N. Field and laboratory behaviour of fine-grained soil stabilized with lime. Can. Geotech. J. 2020, 57, 1–19. [Google Scholar] [CrossRef]
- Stoltz, G.; Cuisinier, O.; Masrouri, F. Multi-scale analysis of the swelling and shrinkage of a lime-treated expansive clayey soil. Appl. Clay Sci. 2012, 61, 44–51. [Google Scholar] [CrossRef]
- Cui, Y.J.; Tang, A.M.; Xu, M.N. Effects of the maximum soil aggregates size and cyclic wetting–drying on the stiffness of a lime-treated clayey soil. Géotechnique 2011, 61, 421–429. [Google Scholar]
- Zhang, S.B.; Xie, J.B.; Jiang, S.; Shi, L.F.; Wang, S.; Wu, Y.C. Study on the development law of dry shrinkage cracks in lime improved expansive soil. Contrib. Technol. 2018, 47, 1247–1249. [Google Scholar]
- Elert, K.; Rodriguez, N.C.; Pardo, E.S. Lime mortars for the conservation of historic buildings. Stud. Conserv. 2002, 47, 62–75. [Google Scholar]
- Grilo, J.; Santos, S.A.; Faria, P. Mechanical and mineralogical properties of natural hydraulic lime metakaolin mortars in different curing conditions. Constr. Build. Mater. 2014, 51, 287–294. [Google Scholar] [CrossRef]
- Cui, K.; Feng, F.; Chen, W.W.; Wang, X.H.; Cheng, F.Q. Study on physical compatibility of fissure grouting slurry stone in soil sites with quicklime as admixture. Rock. Soil. Mech. 2019, 40, 4627–4636. [Google Scholar]
- State Administration of Cultural Relics. Code for Design of Protection and Reinforcement of Soil Sites in Dry Environment: GB/T 36747—2018; State Administration of Market Supervision and Administration; China National Standardization Administration: Beijing, China, 2018; pp. 1–16.
- Mascolo, G.; Mascolo, M.C.; Vitale, A.; Marino, O. Microstructure evolution of lime putty upon aging. J. Cryst. Growth 2010, 312, 2363–2368. [Google Scholar] [CrossRef]
- Margalha, M.G.; Silva, A.S.; Maria, D.R.V.; Ball, R.J.; Allen, G.C. Microstructural Changes of Lime Putty during Aging. J. Mater. Civ. Eng. 2013, 25, 1524–1532. [Google Scholar] [CrossRef]
- Maafi, N.; Akchiche, M.; Sara, R. Wetting and Drying Compacted Soil-Lime Mixtures. In Proceedings of the International Congress and Exhibition “Sustainable Civil Infrastructures: Innovative Infrastructure Geotechnology”, Sharm El Sheikh, Egypt, 15–19 July 2017; Springer: Cham, Switzerland, 2017. [Google Scholar]
- Wei, G.F.; Zhang, B.J.; Fang, S.Q. Study on lime aging mechanism and its application in cultural relics protection. J. Bulid. Mater. 2012, 15, 96–102. [Google Scholar]
- Beruto, D.T.; Barberis, F.; Botter, R. Calcium carbonate binding mechanism in the setting of calcium and calcium–magnesium putty lime. J. Cult. Herit. 2005, 6, 253–260. [Google Scholar] [CrossRef]
- Kang, S.H.; Wang, H.; Jong, K.; Won, K.; Yang, H. Effects of Amount of Slaking Water on Physical and Chemical Properties of Handmade Hydrated Lime used for Preservation of Architectural Heritage. J. Archttectural Inst. Korea Struct. Constr. 2019, 35, 142–149. [Google Scholar]
- Khattab, S.; Hussein, Y.A. On the Durability of fine Grained Soils Stabilized with Lime. Al-Rafadain Eng. J. 2012, 20, 85–92. [Google Scholar] [CrossRef]
- Gu, L.; Liu, R.J.; Guo, Z.W. Effect of lime digestion conditions on calcium hydroxide activity. C Power Sci. Technol. 2012, 18, 62–69. [Google Scholar]
- Sweeney, D.A.; Wong, D.; Fredlund, D.G. Effect of lime on highly plastic clay with special emphasis on aging. Transp. Res. Rec. 1988, 1190, 13–23. [Google Scholar]
- Hengique, H.M.; Santos, L.C.; Parreira, P.M. Production of milk of lime for sugar cane industry: Study of factors influencing lime slaking. Mater. Sci. Forum. 2010, 660–661, 437–442. [Google Scholar] [CrossRef]
- Pakbaz, M.S.; Farzi, M. Comparison of the effect of mixing methods (dry vs. wet) on mechanical and hydraulic properties of treated soil with cement or lime. Appl. Clay Sci. 2014, 105–106, 156–169. [Google Scholar] [CrossRef]
- Tan, Y.Z.; Yu, B.; Zheng, A.; Fu, W.; Zhang, H.; Wan, Z. Long term carbonation effect of lime stabilized red clay strength. J. Bulid. Mater. 2013, 34, 73–79. [Google Scholar]
- Jha, A.K.; Sivapullalah, P.V. Susceptibility of strength development by lime in gypsiferous soil—A micro mechanistic study. Appl. Clay Sci. 2015, 115, 9–50. [Google Scholar] [CrossRef]
- Li, X.M.; Lu, G.Y.; Zhang, H.Y.; Yi, S.; Ren, K.S. Strength characteristics and micro mechanism of lime metakaolin improved silty sand. J. Bulid. Mater. 2020, 20, 1–14. [Google Scholar]
- Feng, H.P.; Ma, D.L.; Liu, Q.Y.; Ye, C.L. Quantitative calculation method of 3D apparent porosity of soil based on SEM images. J. Bulid. Mater. 2019, 41, 574–580. [Google Scholar]
- Moretti, L.; Confificconi, M.; Natali, S.; Andrea, A. Statistical analyses of SEM-EDS results to predict the quantity of added quicklime in a treated clayey soil. Constr. Build. Mater. 2020, 10, 2569–2574. [Google Scholar] [CrossRef]
- Jha, A.K.; Sivapullaiah, P.V. Lime Stabilization of Soil: A Physico-Chemical and Micro-Mechanistic Perspective. Indian. Geotech. J. 2019, 50, 339–347. [Google Scholar] [CrossRef]
- Priyadarshee, A.; Chandra, S.; Kumar, V. Performance of grass ash with mix of black cotton soil and lime. Innov. Infrastruct. Solut. 2021, 6, 1–13. [Google Scholar] [CrossRef]
- Wang, Y.J.; Cui, Y.J.; Tang, A.M.; Tang, C.S.; Benahmed, N. Changes in thermal conductivity, suction and microstructure of a compacted lime-treated silty soil during curing. Eng. Geol. 2016, 202, 114–121. [Google Scholar] [CrossRef] [Green Version]
- Wang, D.X.; He, F.J.; Zhu, J.Y. Performance and mechanism of CO2 carbonated slag-CaO- MgO-solidified soils. Acta. Geotech. 2019, 41, 2197–2206. [Google Scholar]
- Wang, Y.; Cui, Y.J.; Tang, A.M.; Tang, C.S.; Benahmed, N. Effects of aggregate size on water retention capacity and microstructure of lime-treated silty soil. Géotech. Lett. 2015, 5, 269–274. [Google Scholar] [CrossRef]
Figure 1.
Particle grading curve of the site soil.

Figure 2.
Test flow chart.

Figure 3.
Test process of the samples: (a) dry–wet cycle test of sample; (b) expansion and shrinkage test of sample.
Figure 3.
Test process of the samples: (a) dry–wet cycle test of sample; (b) expansion and shrinkage test of sample.

Figure 4.
Calculation principle of soil particle and pore distribution [33].
Figure 4.
Calculation principle of soil particle and pore distribution [33].
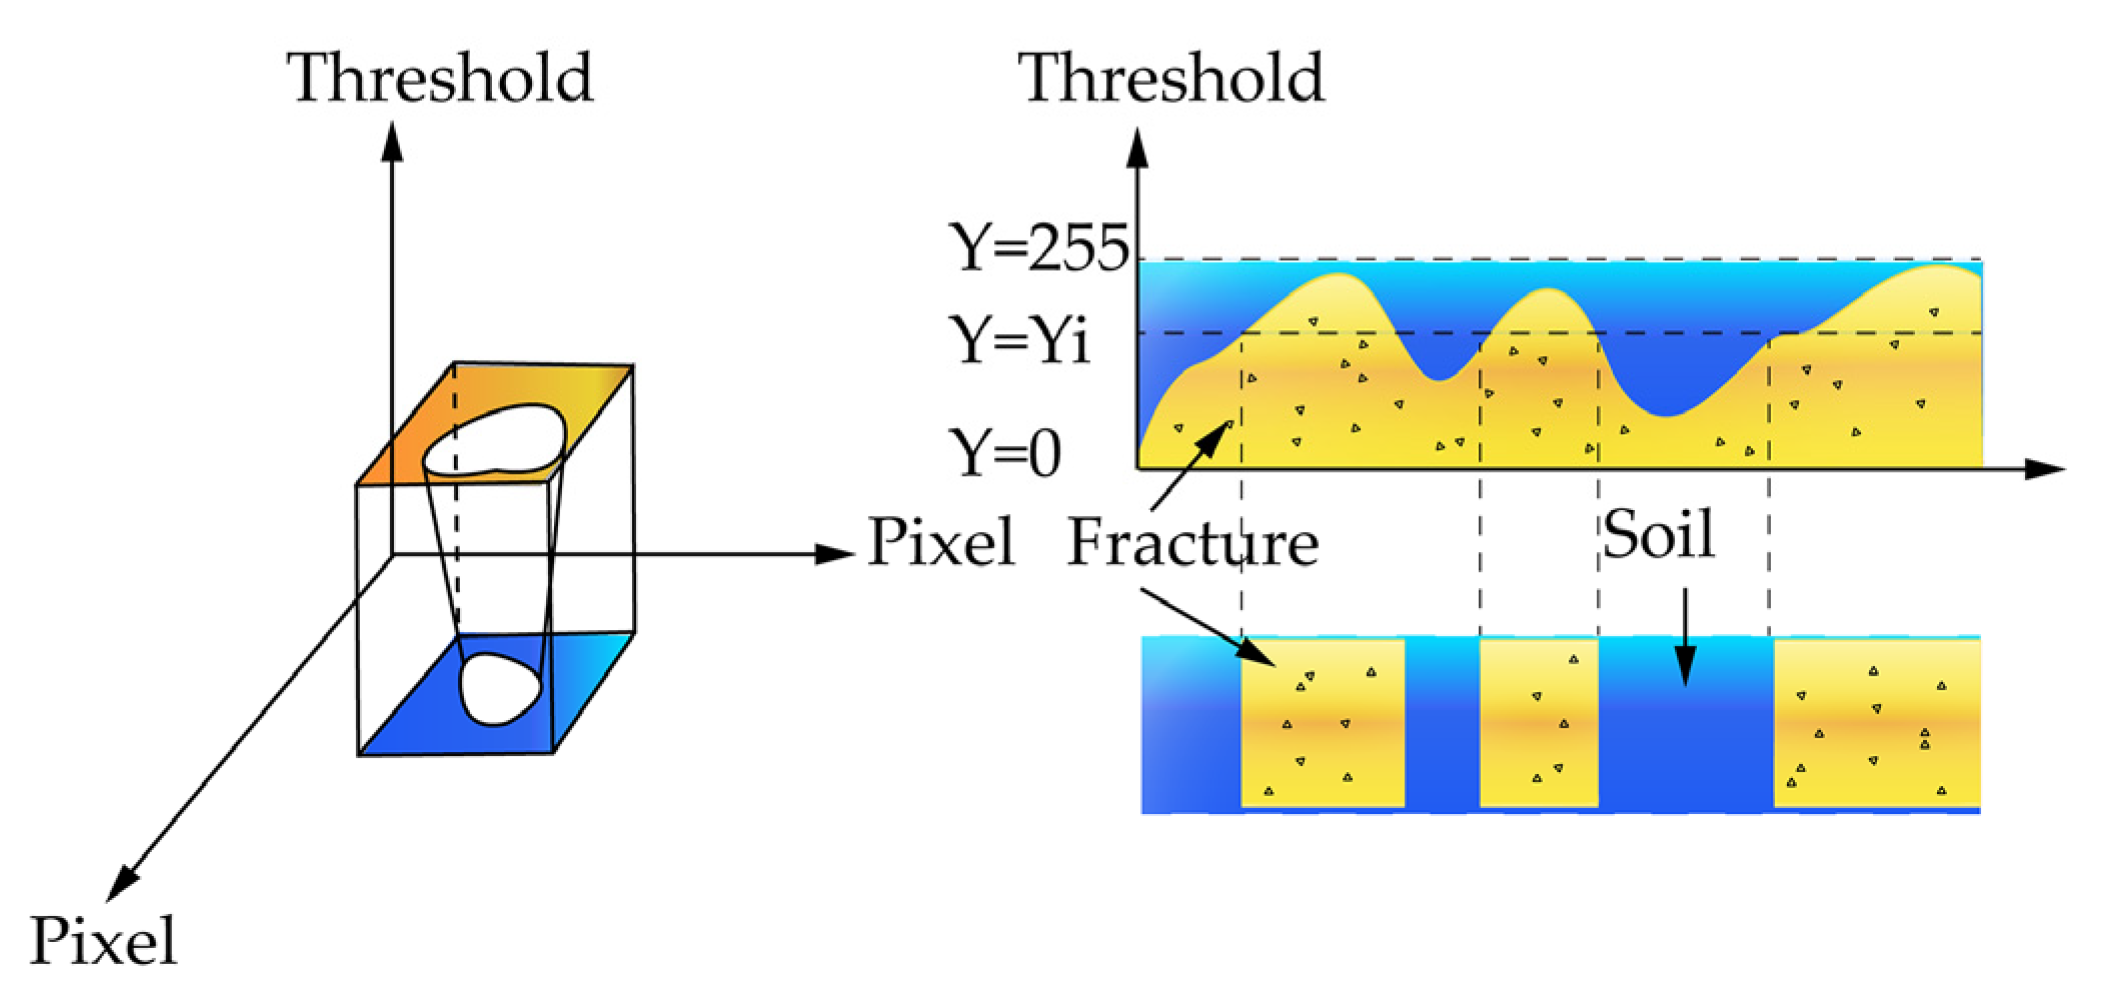
Figure 5.
Three-dimensional (3D) image processing.

Figure 6.
Change in the volume crack rate of the samples after five dry–wet cycles under different influencing factors: (a) curve showing the relationship between the lime content, aging time, and volume crack rate of the sample, and (b) curve showing the relationship between the lime particle size, aging time, and volume crack rate.
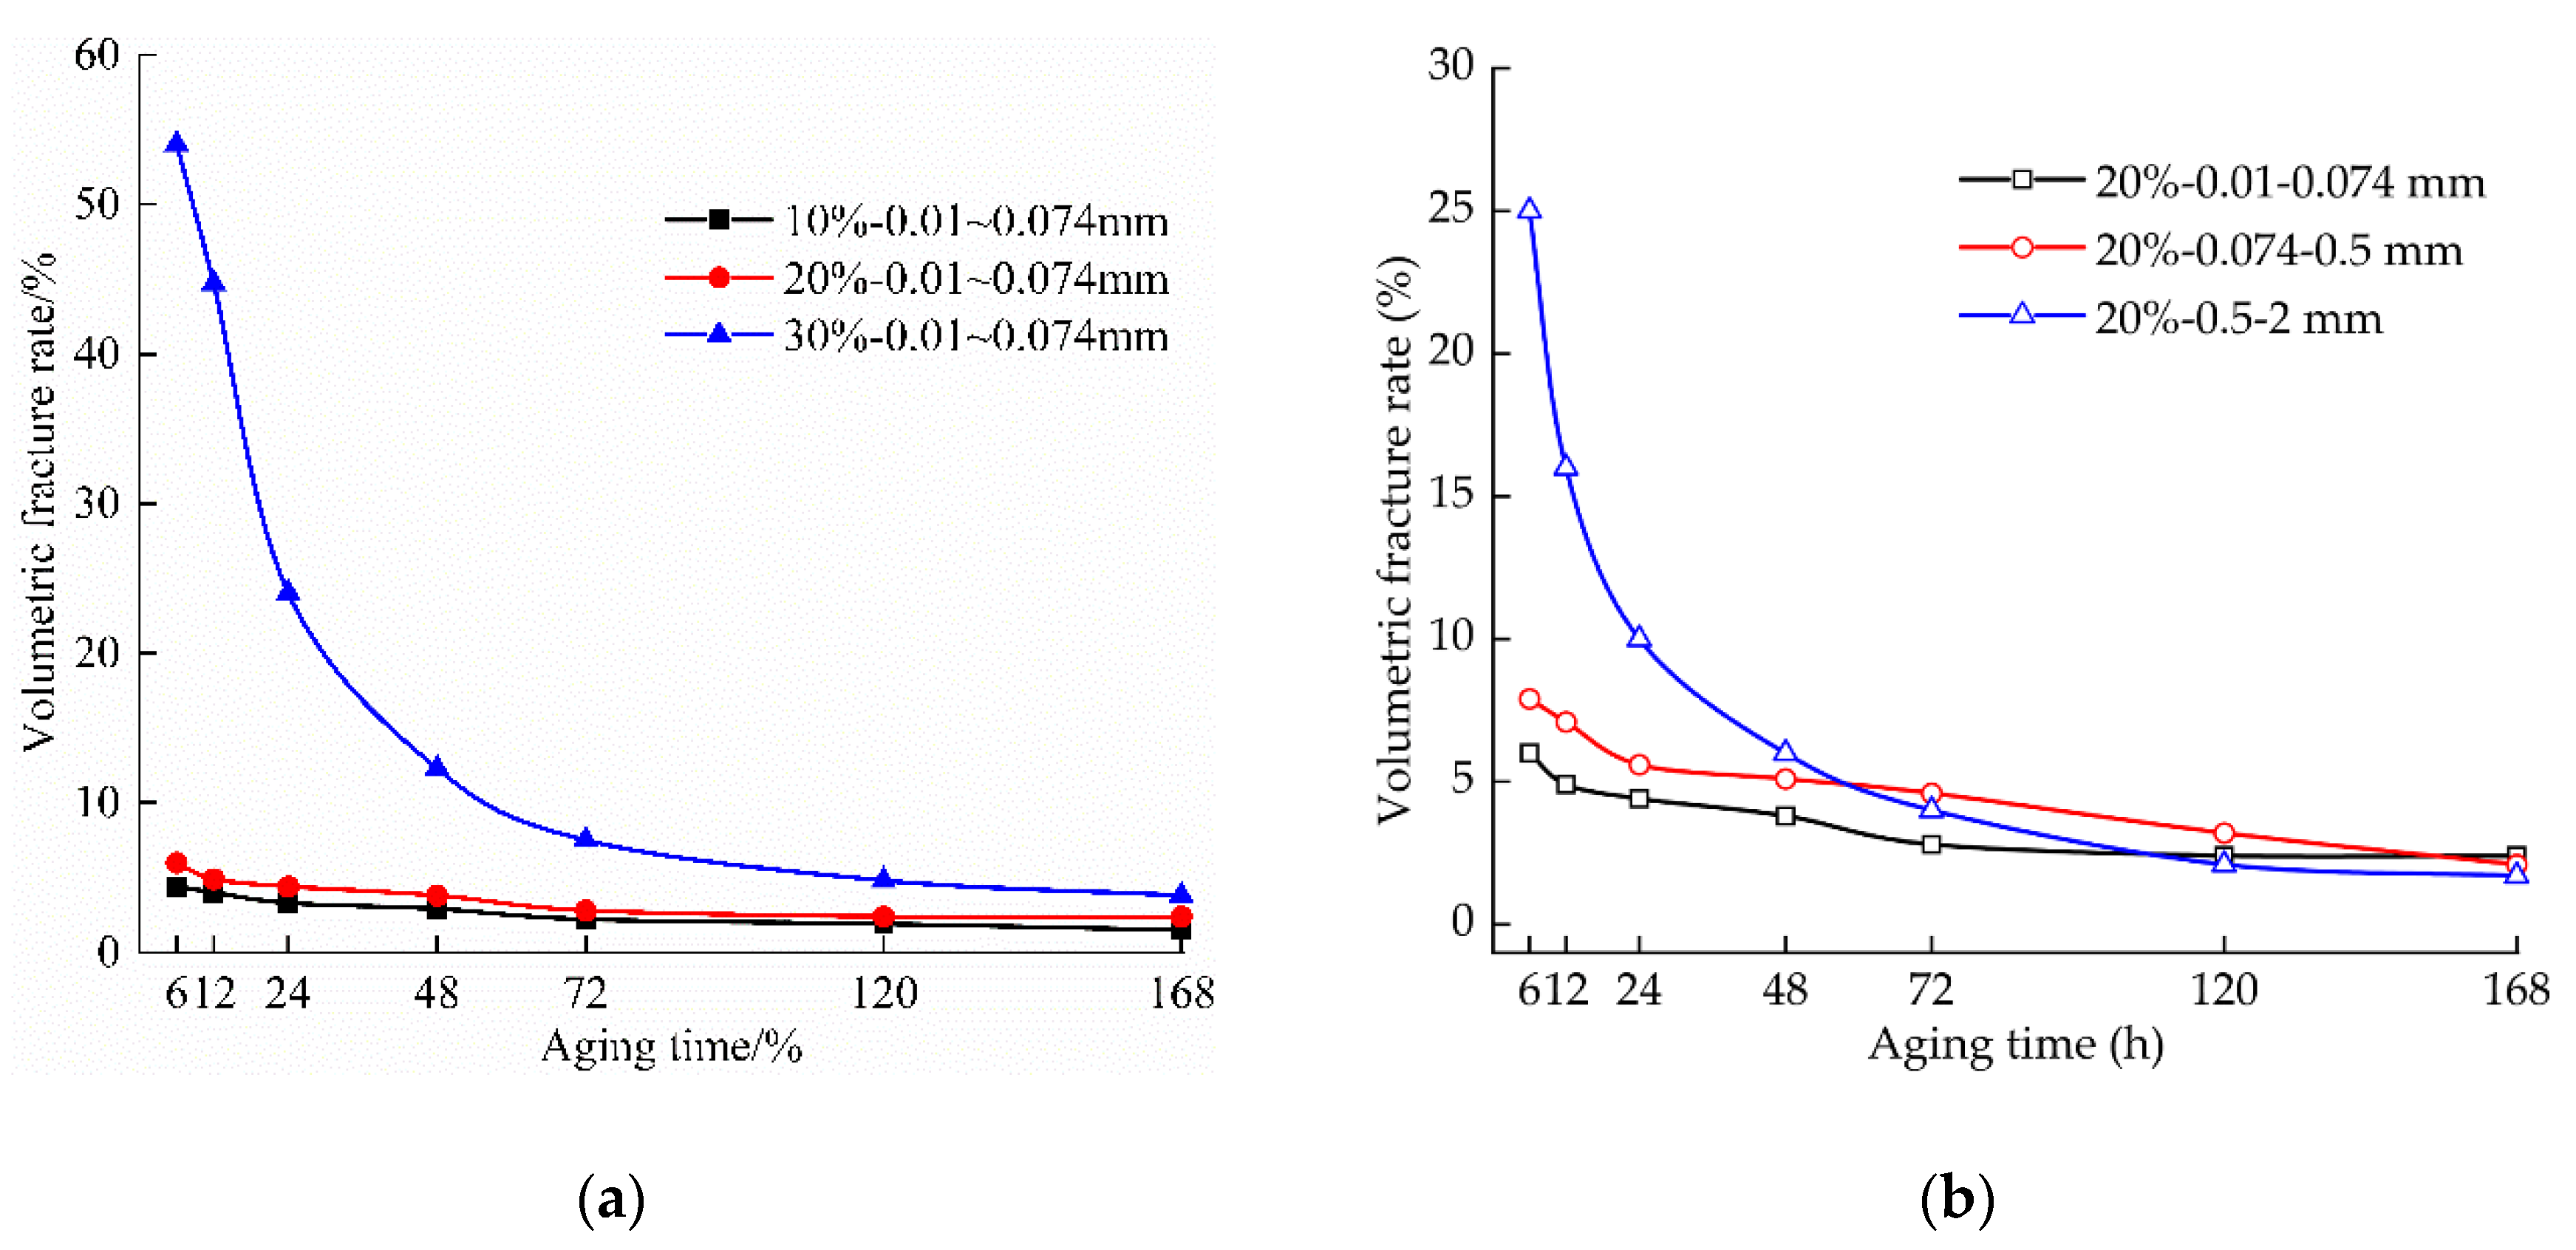
Figure 7.
Three-dimensional fracture diagram of the samples with different lime content, particle size, and aging time after five dry–wet cycles: (a) 10%–0.01–0.074 mm–6 h; (b) 10%–0.01–0.074 mm–72 h; (c) 10%–0.01–0.074 mm–120 h; (d) 20%–0.01–0.074 mm–6 h; (e) 20%–0.01–0.074 mm–72 h; (f) 20%–0.01–0.074 mm–120 h; (g) 30%–0.01–0.074 mm–6 h; (h) 30%–0.01–0.074 mm–72 h; (i) 30%–0.01–0.074 mm–120 h; (j) 20%–0.074–0.5 mm–6 h; (k) 20%–0.074–0.5 mm–72 h; (l) 20%–0.074–0.5 mm–120 h; (m) 20%–0.5–2 mm–6 h; (n) 20%–0.5–2 mm–72 h; and (o) 20%–0.5–2 mm–120 h. Re corresponds to the ratio of the total volume of the crack to the total volume of the sample.

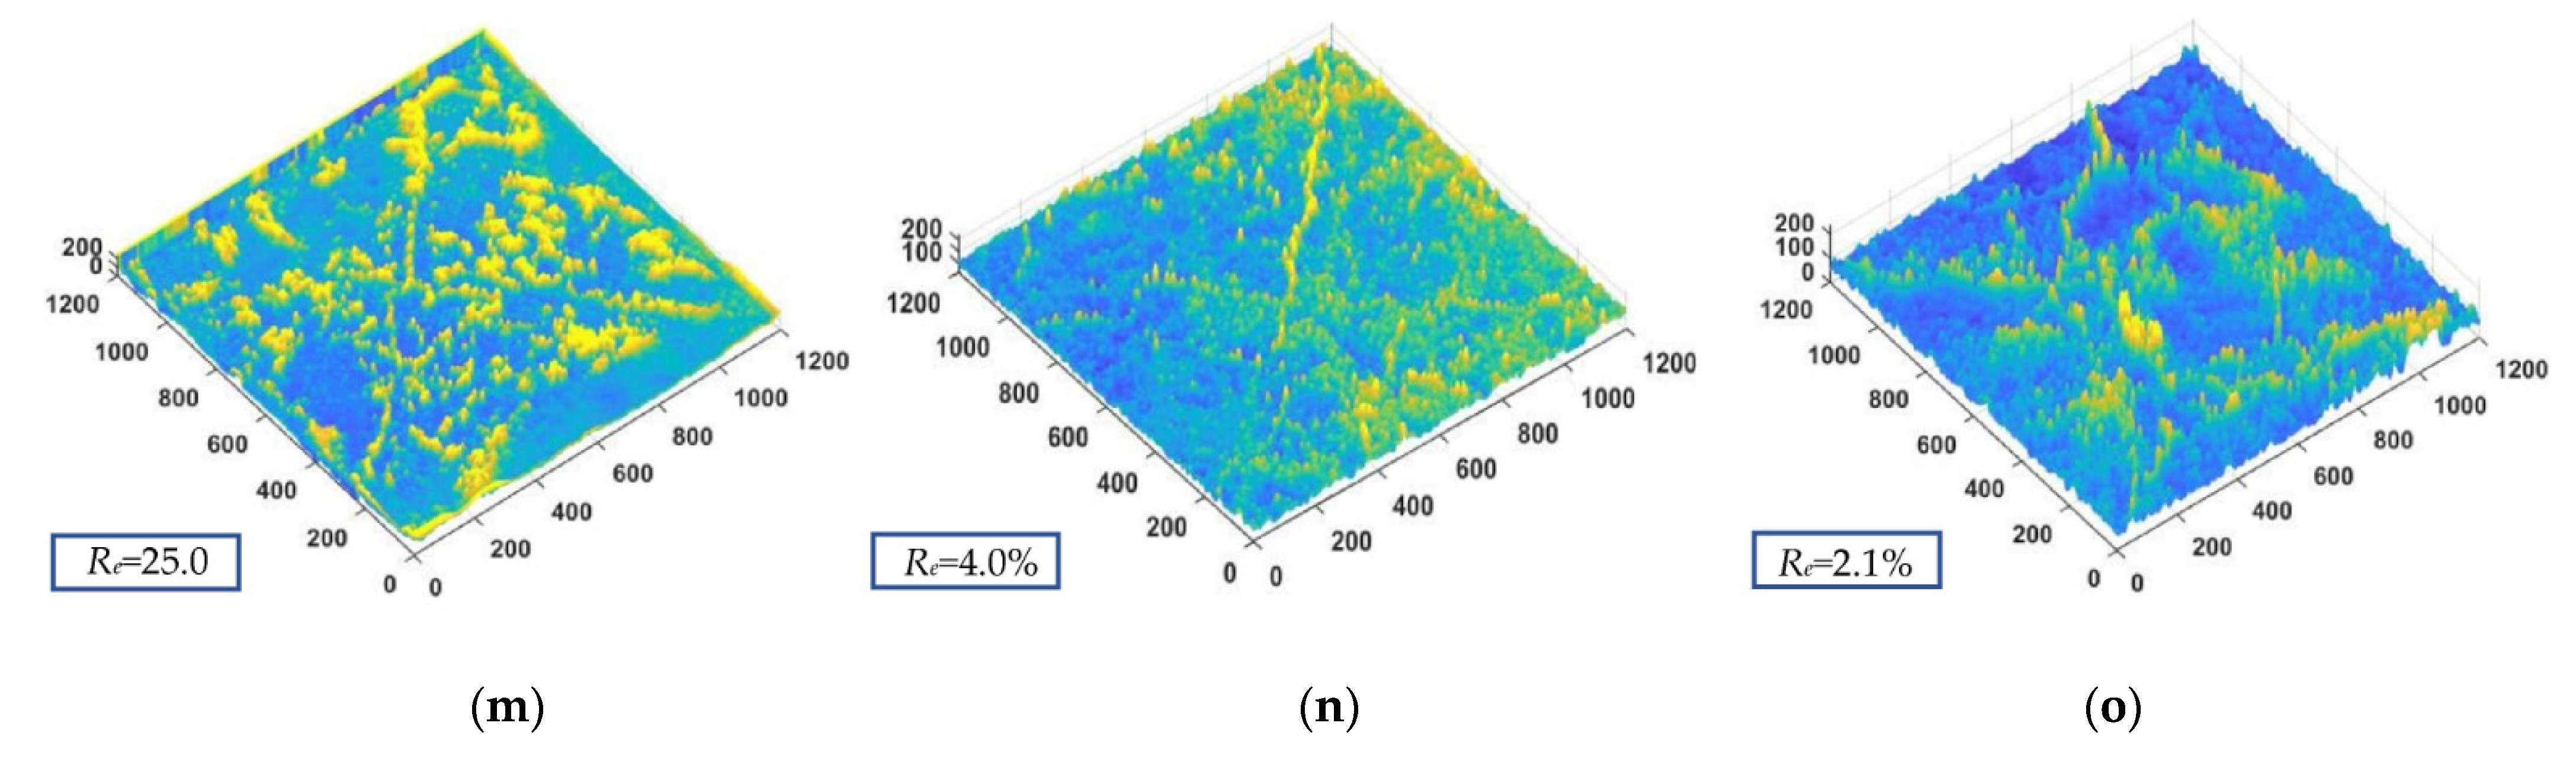
Figure 8.
Change in the expansion rate of the samples after five dry–wet cycles under different influencing factors: (a) curve showing the relationship between the lime content, aging time, and expansion rate of the samples; (b) curve showing the relationship between the lime particle size, aging time, and expansion rate.
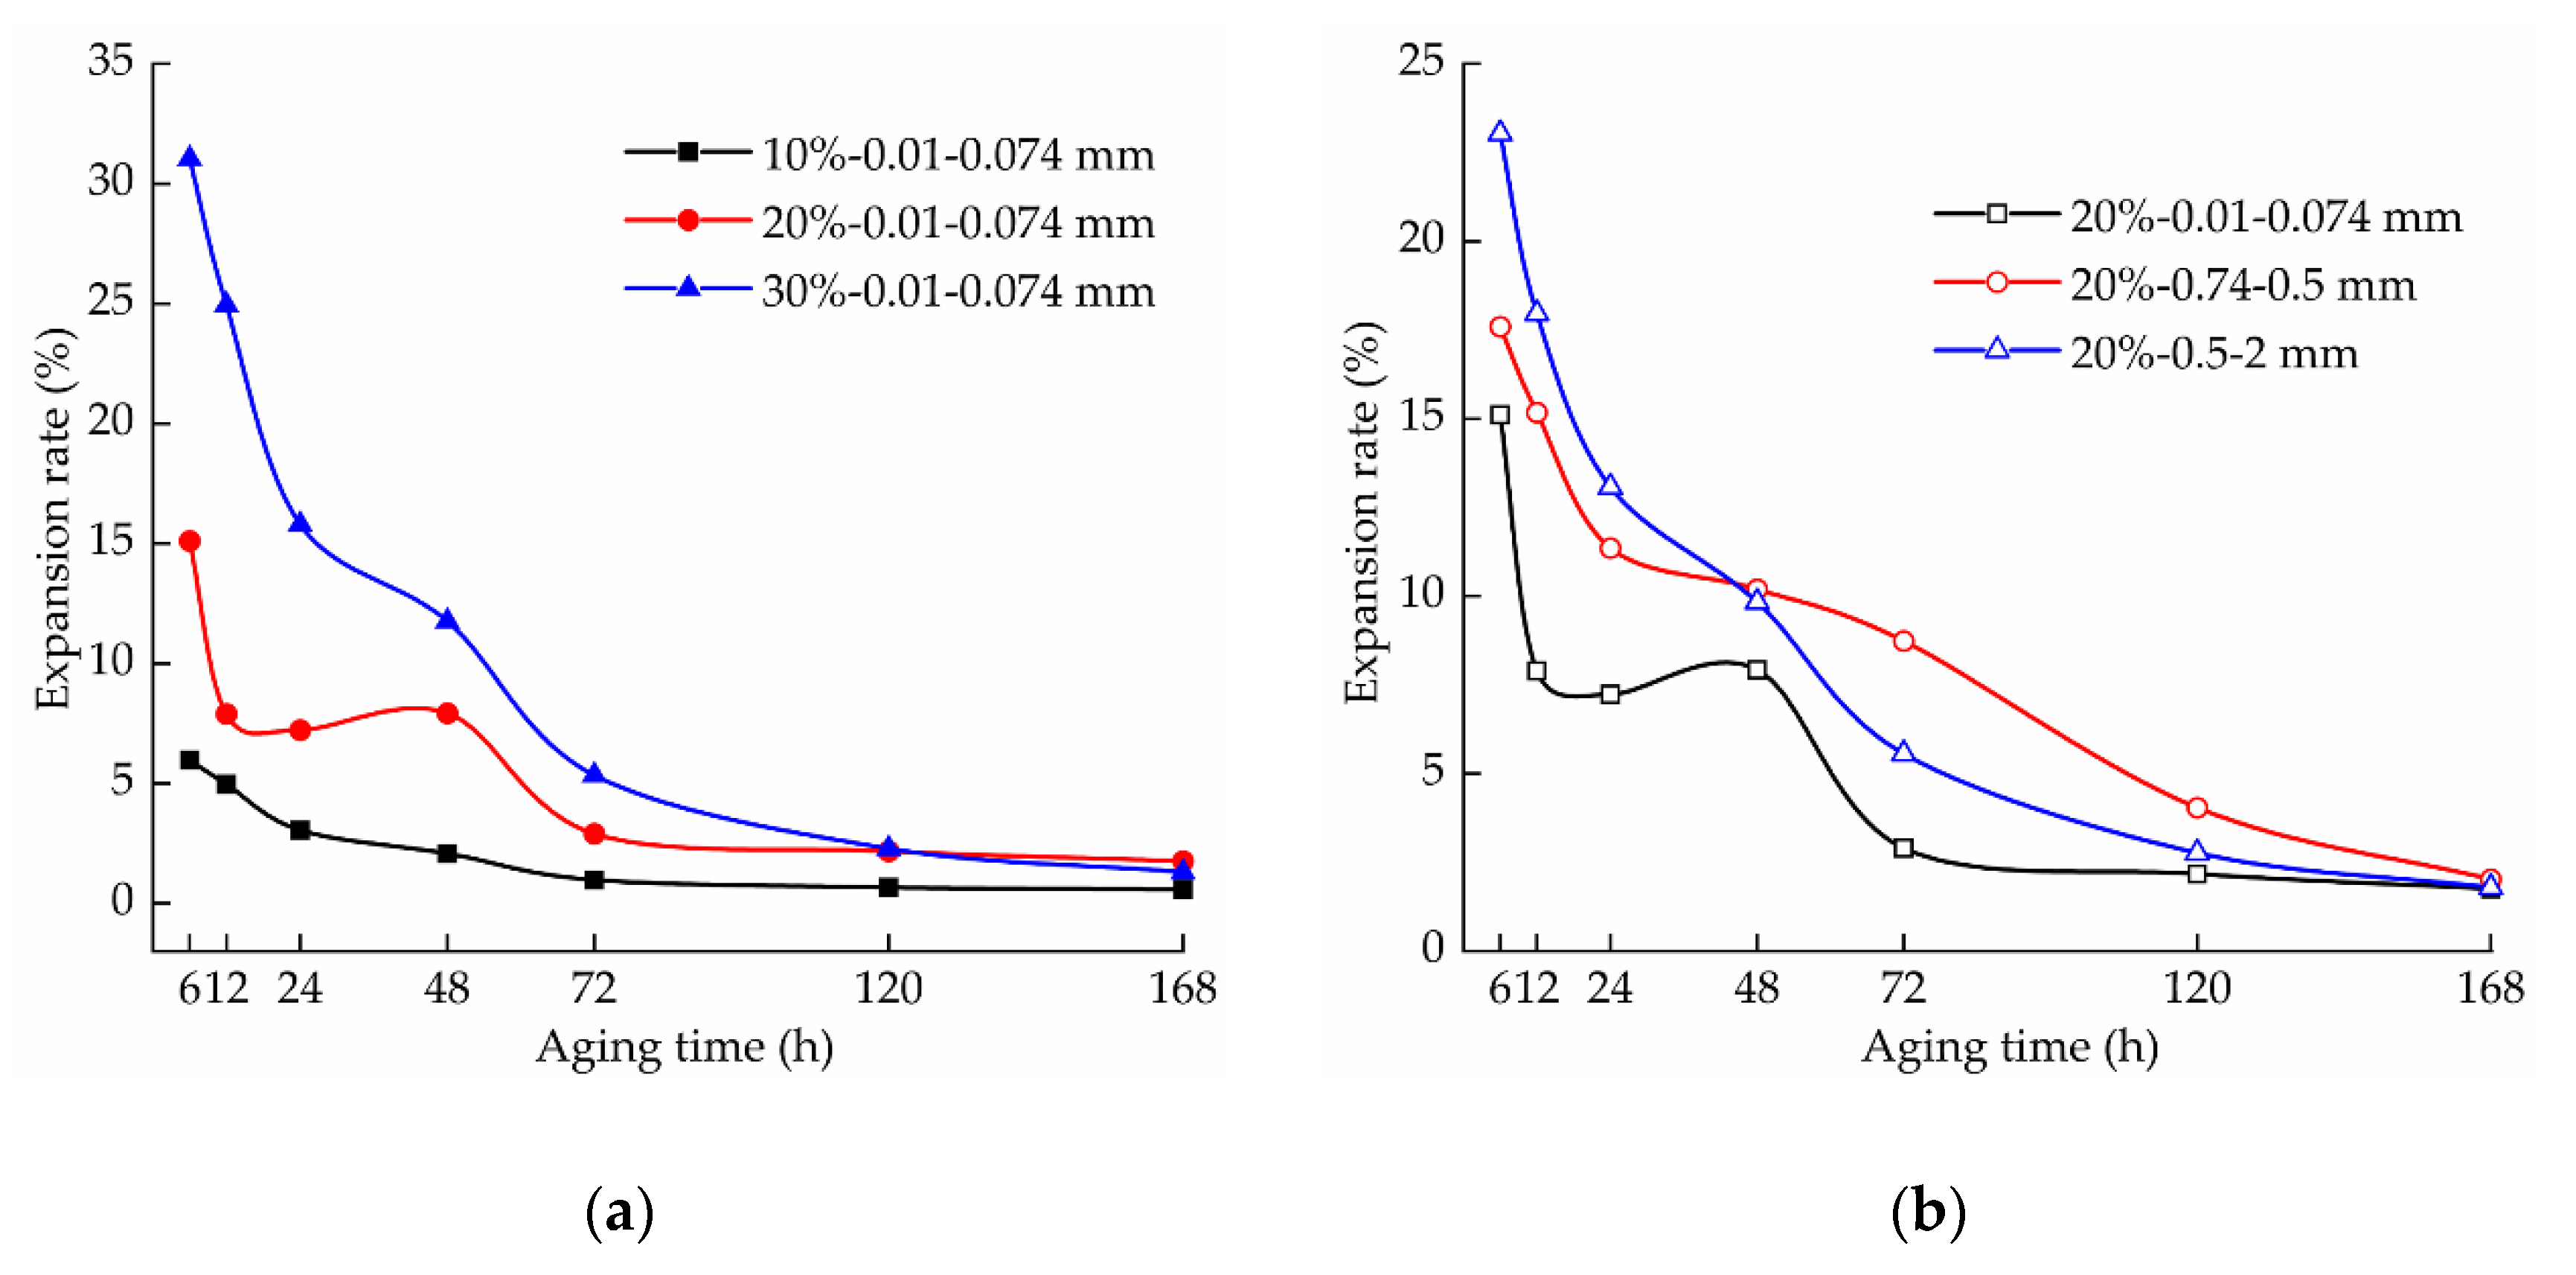
Figure 9.
Changes in the shrinkage rate of the samples after five dry–wet cycles under different influencing factors: (a) curve showing the relationship between the lime content, aging time, and shrinkage rate; (b) curve showing the relationship between the lime particle size, aging time, and shrinkage.
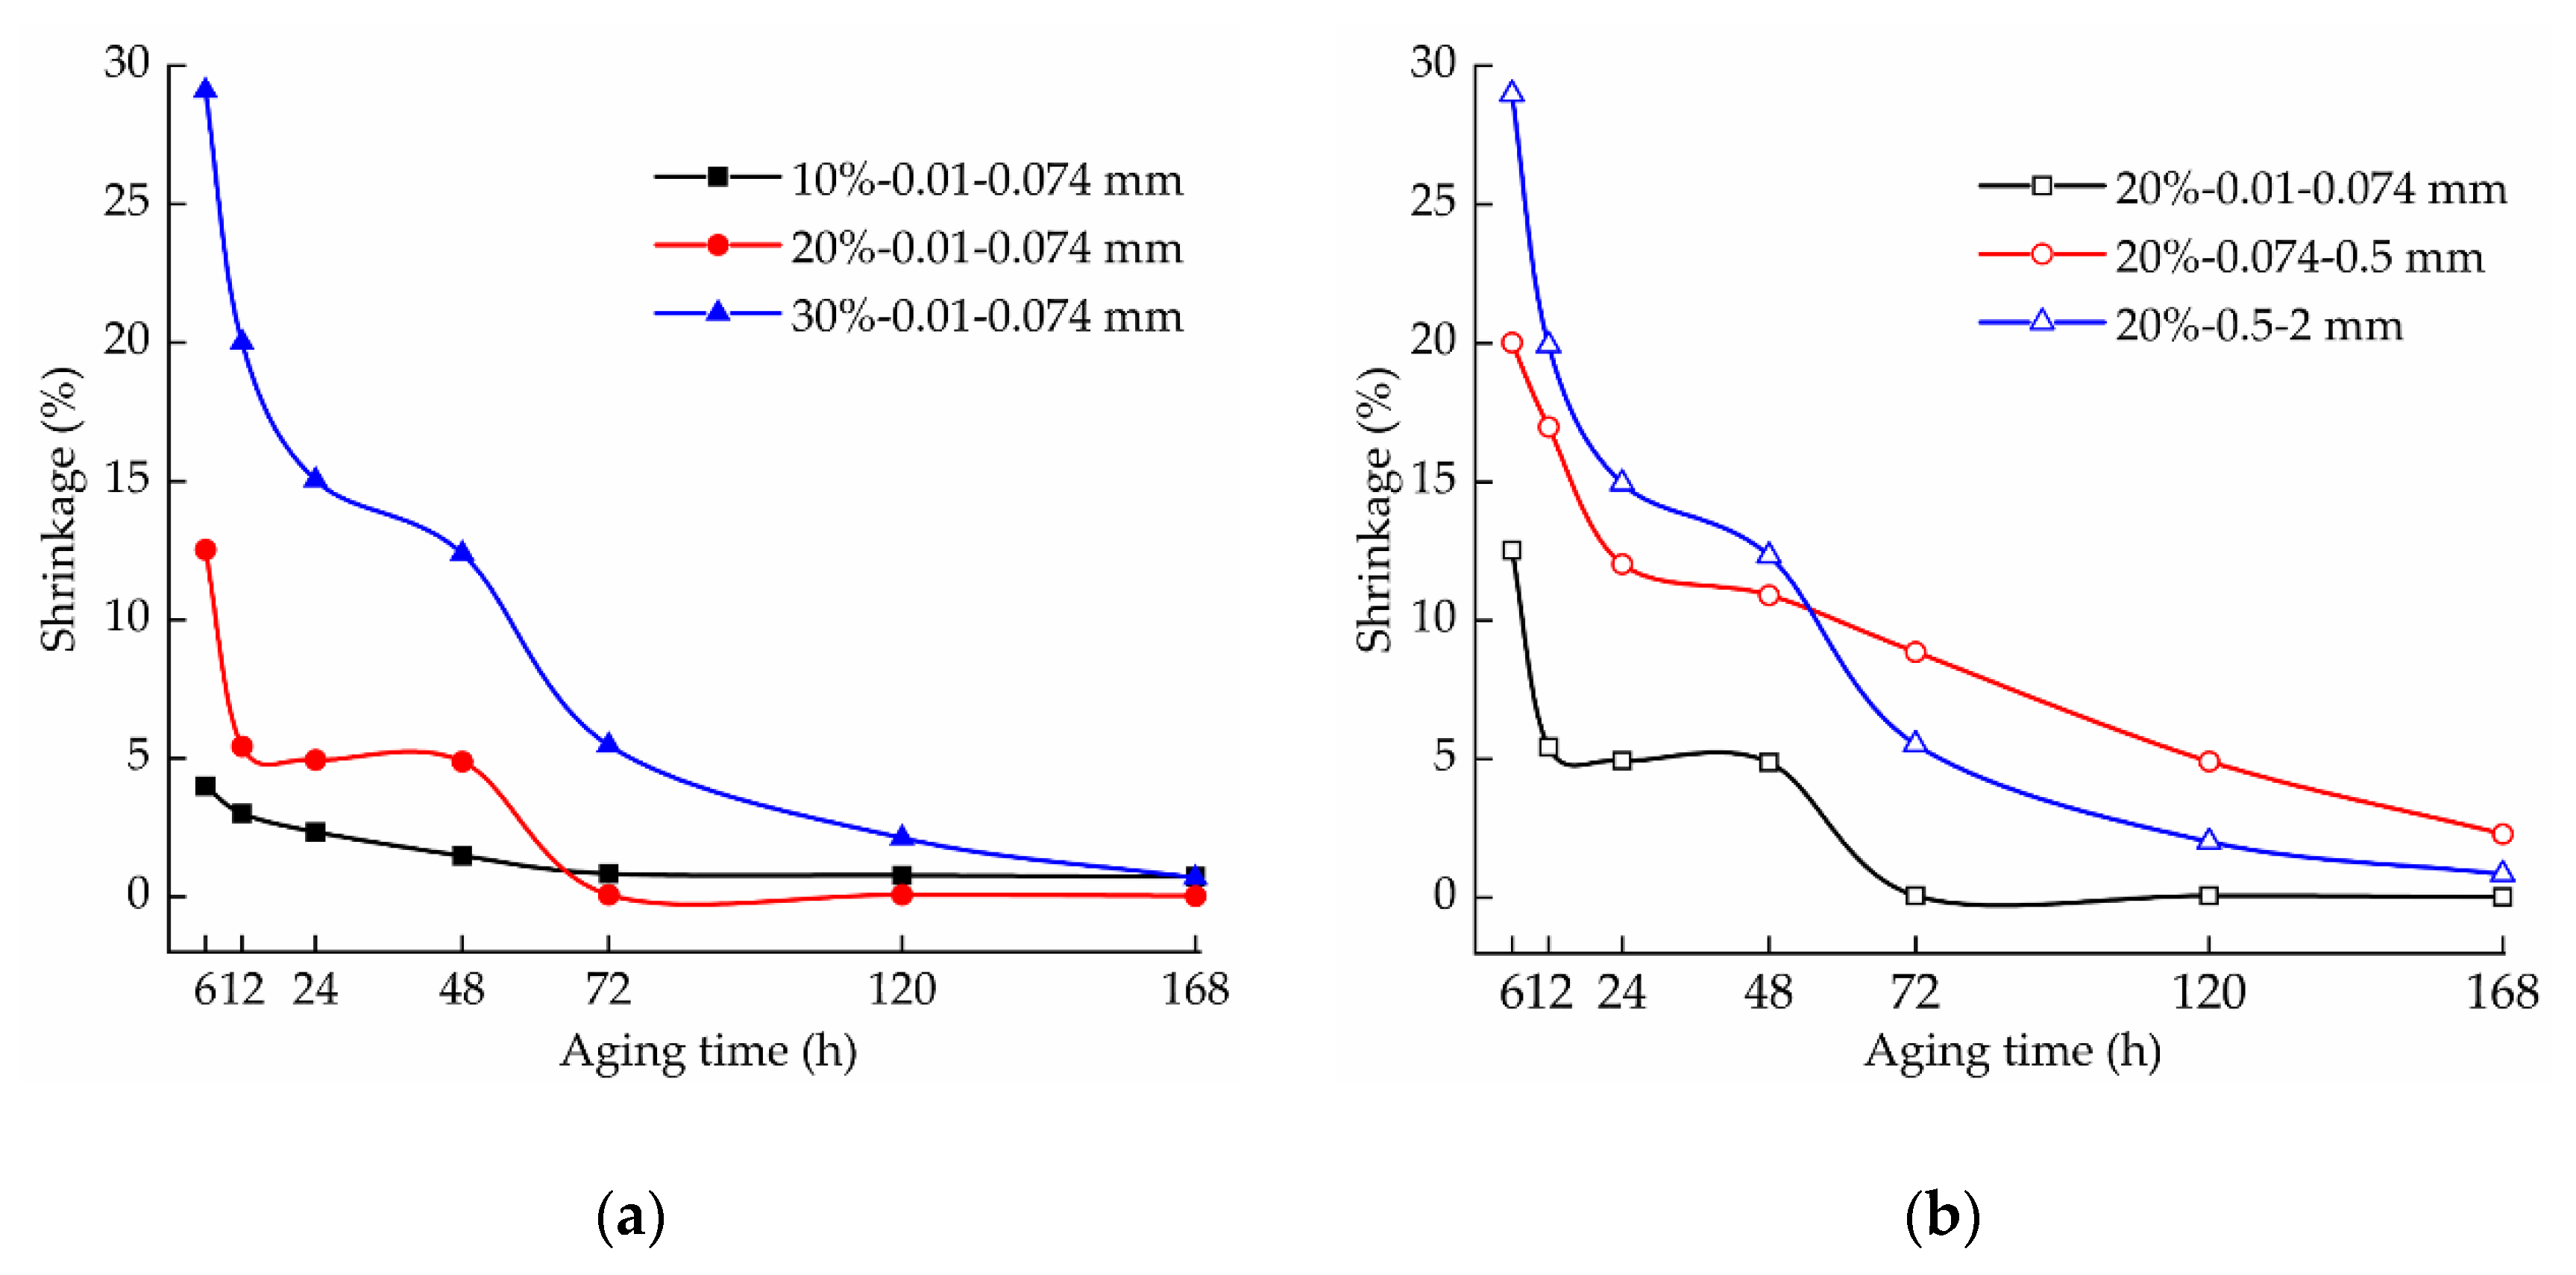
Figure 10.
Changes in the pH of the samples under different influencing factors: (a) curve showing the relationship between the lime content, aging time, and pH rate of the samples; (b) curve showing the relationship between the lime particle size, aging time, and pH of the samples.
Figure 10.
Changes in the pH of the samples under different influencing factors: (a) curve showing the relationship between the lime content, aging time, and pH rate of the samples; (b) curve showing the relationship between the lime particle size, aging time, and pH of the samples.

Figure 11.
Particle gradation curves of the samples with a different lime content, particle size, and aging time: (a) 10%–0.01–0.074 mm; (b) 20%–0.01–0.074 mm; (c) 30%–0.01–0.074 mm; (d) 20%–0.074–0.5 mm; and (e) 20%–0.5–2 mm.
Figure 11.
Particle gradation curves of the samples with a different lime content, particle size, and aging time: (a) 10%–0.01–0.074 mm; (b) 20%–0.01–0.074 mm; (c) 30%–0.01–0.074 mm; (d) 20%–0.074–0.5 mm; and (e) 20%–0.5–2 mm.
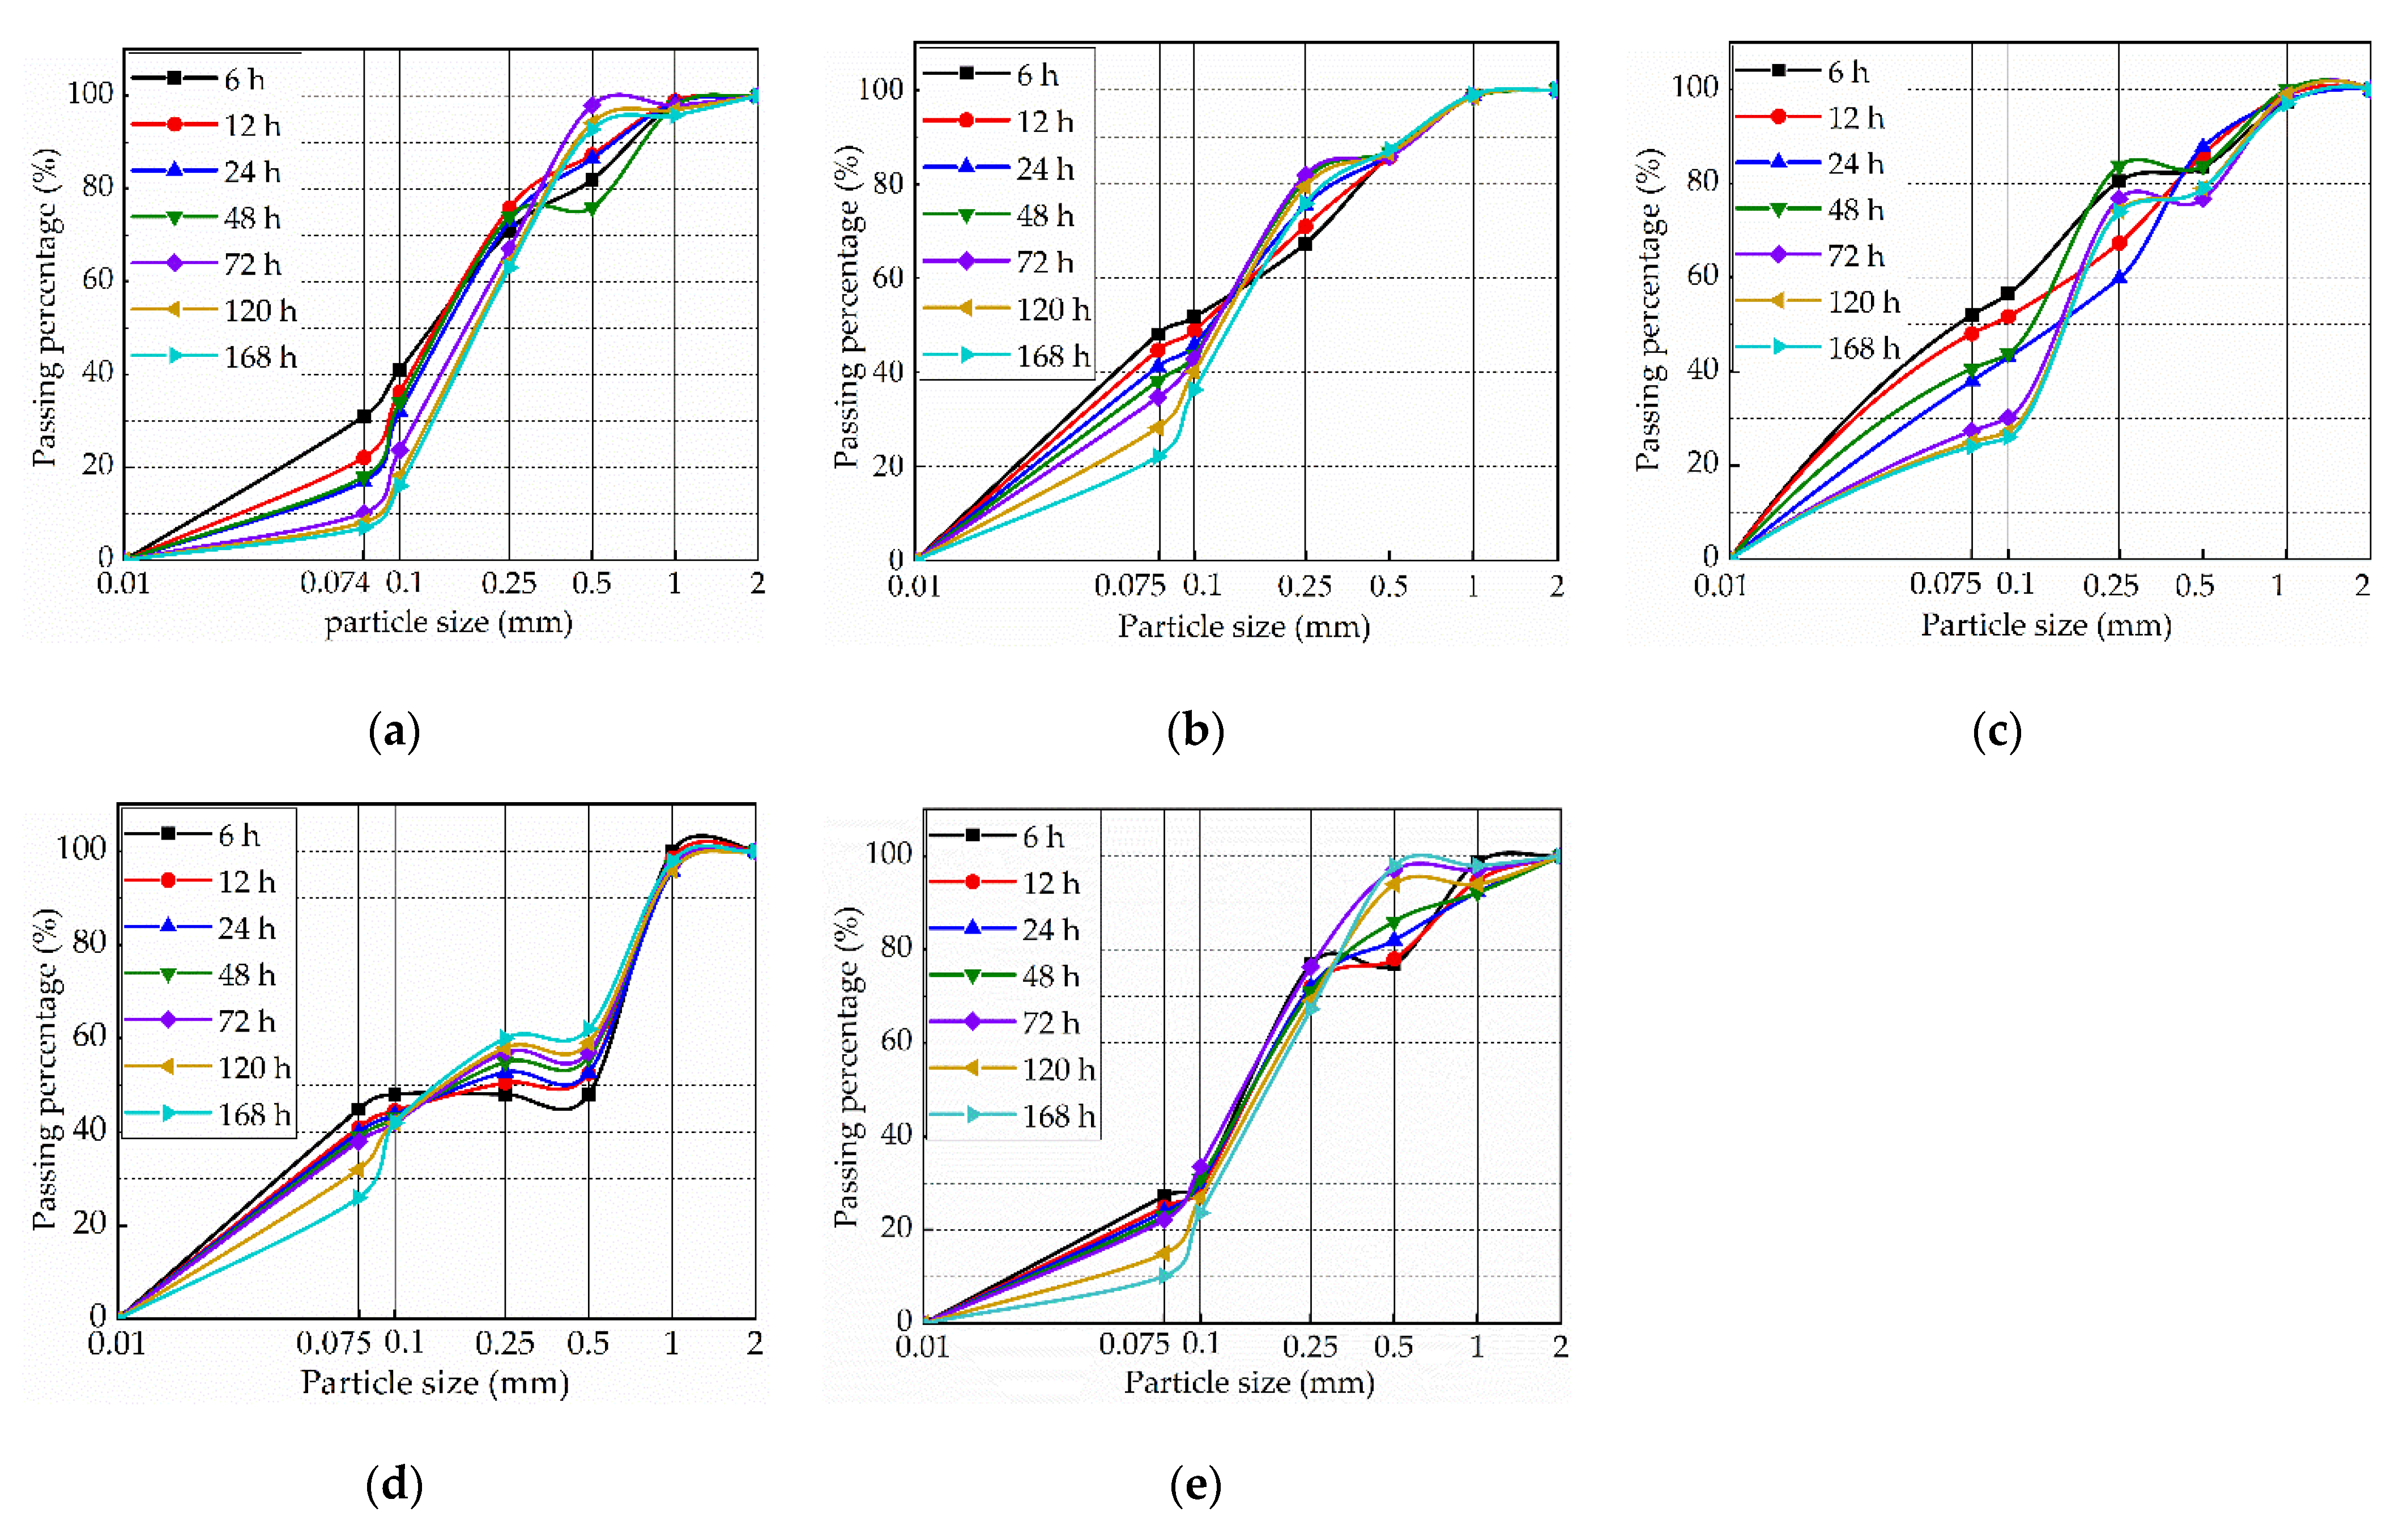
Figure 12.
X-ray diffraction test results of the samples.

Figure 13.
Fitting curve of the X-ray diffraction test results.
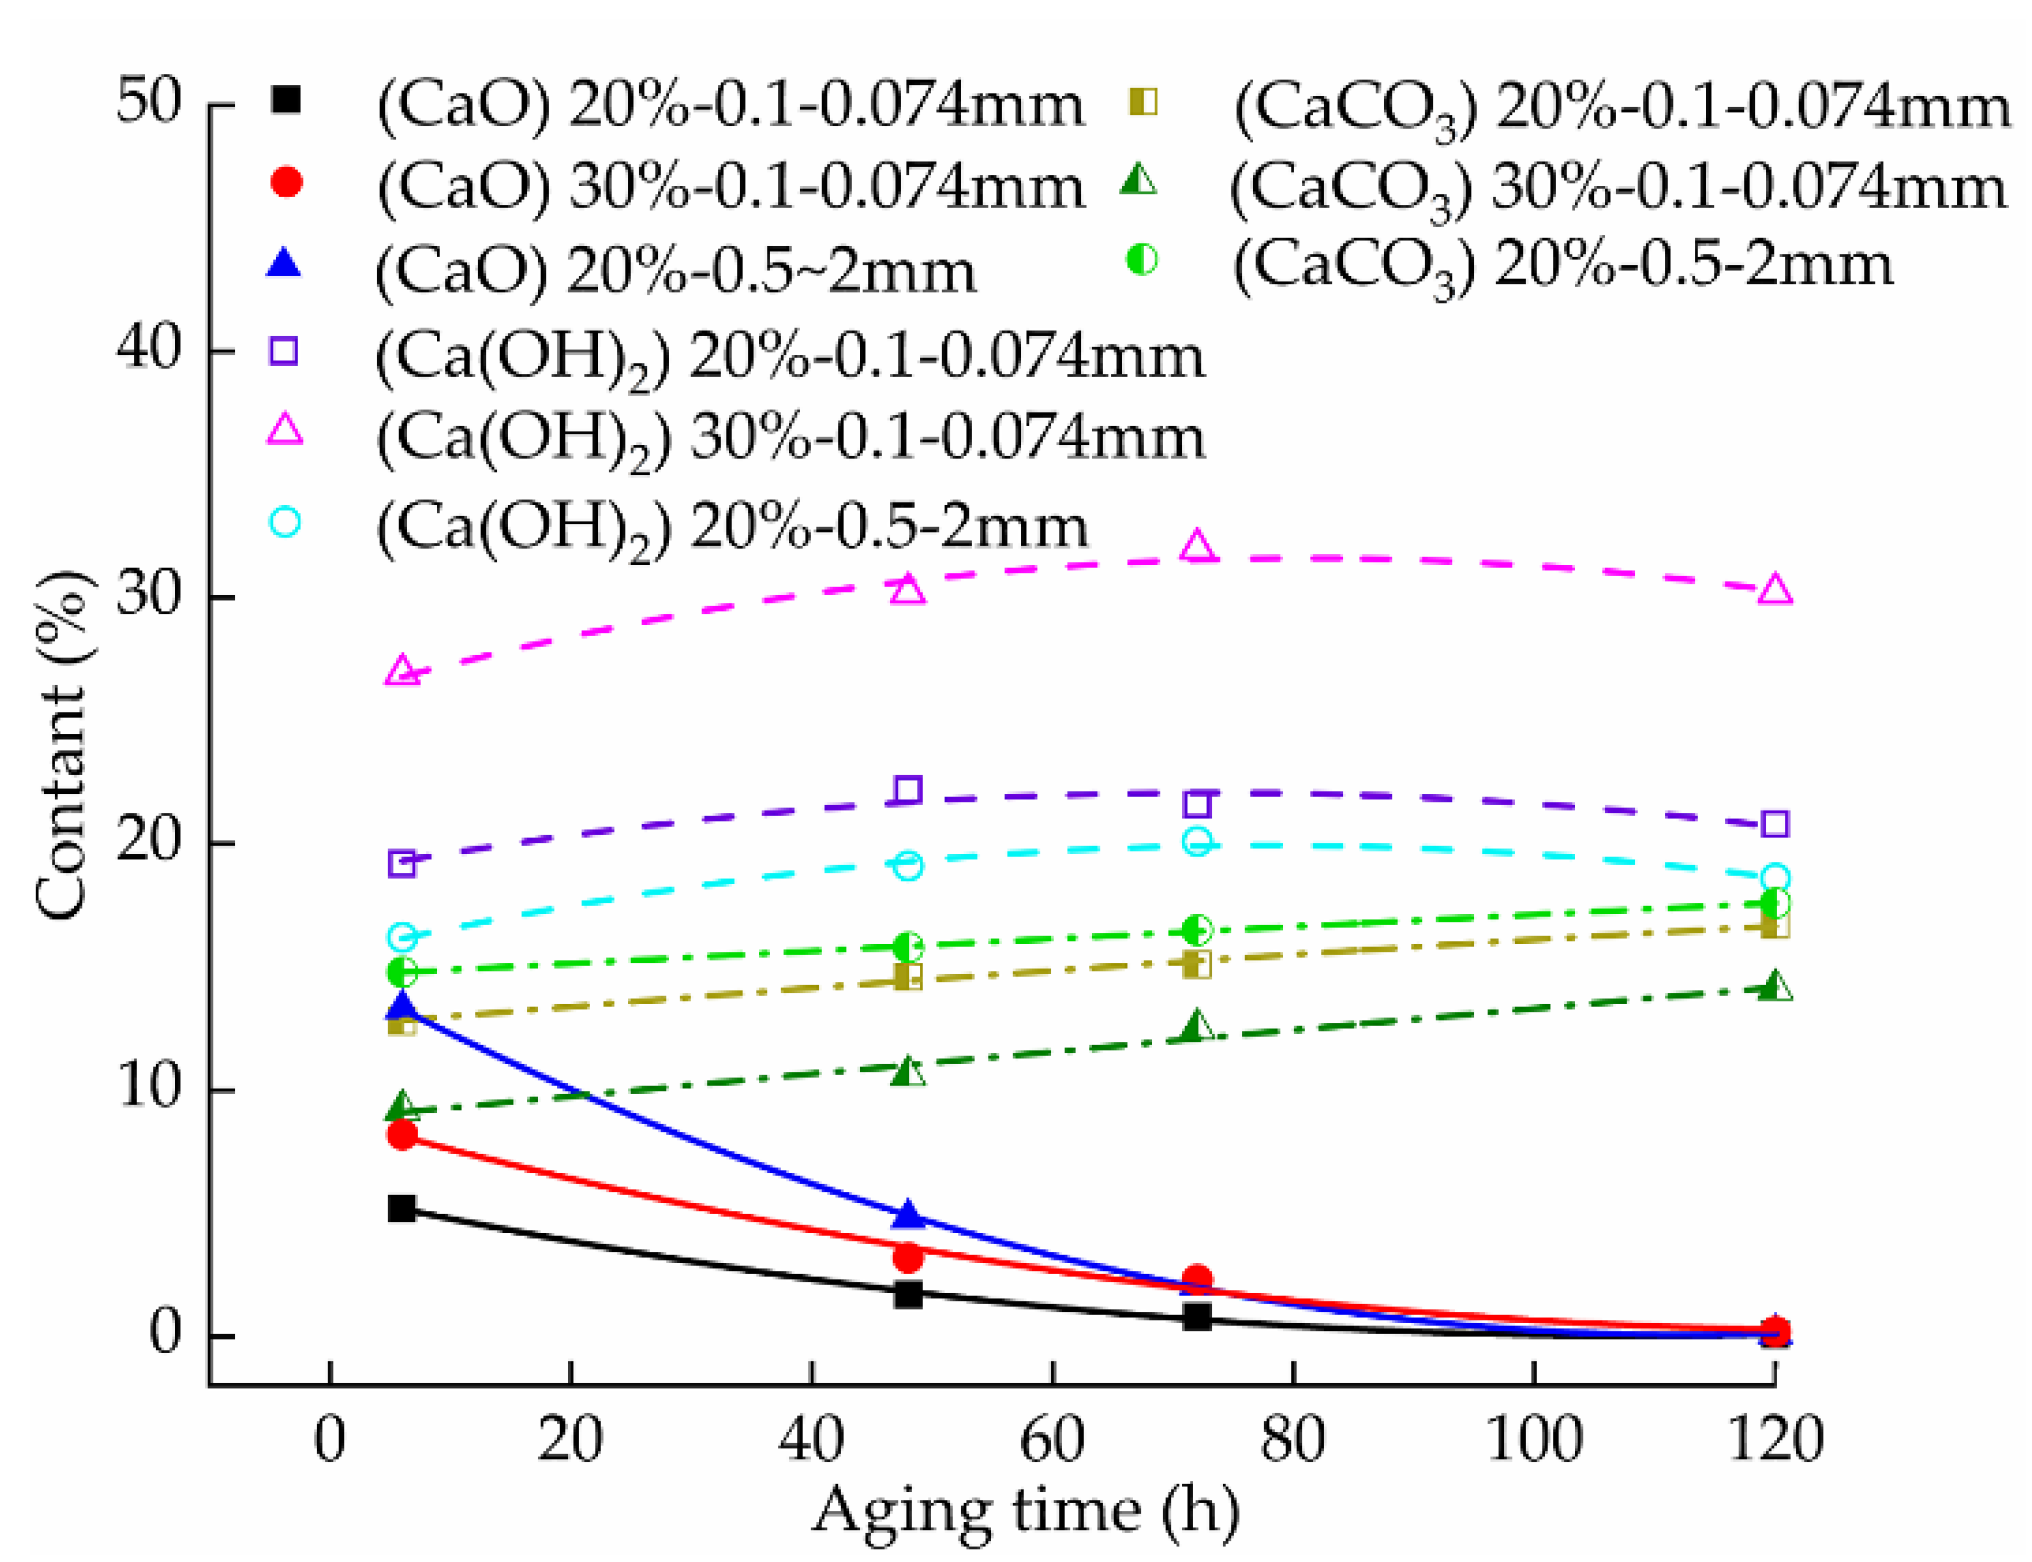
Figure 14.
Fitting curve of the correlation between the pH and Ca(OH)2 content of the samples.
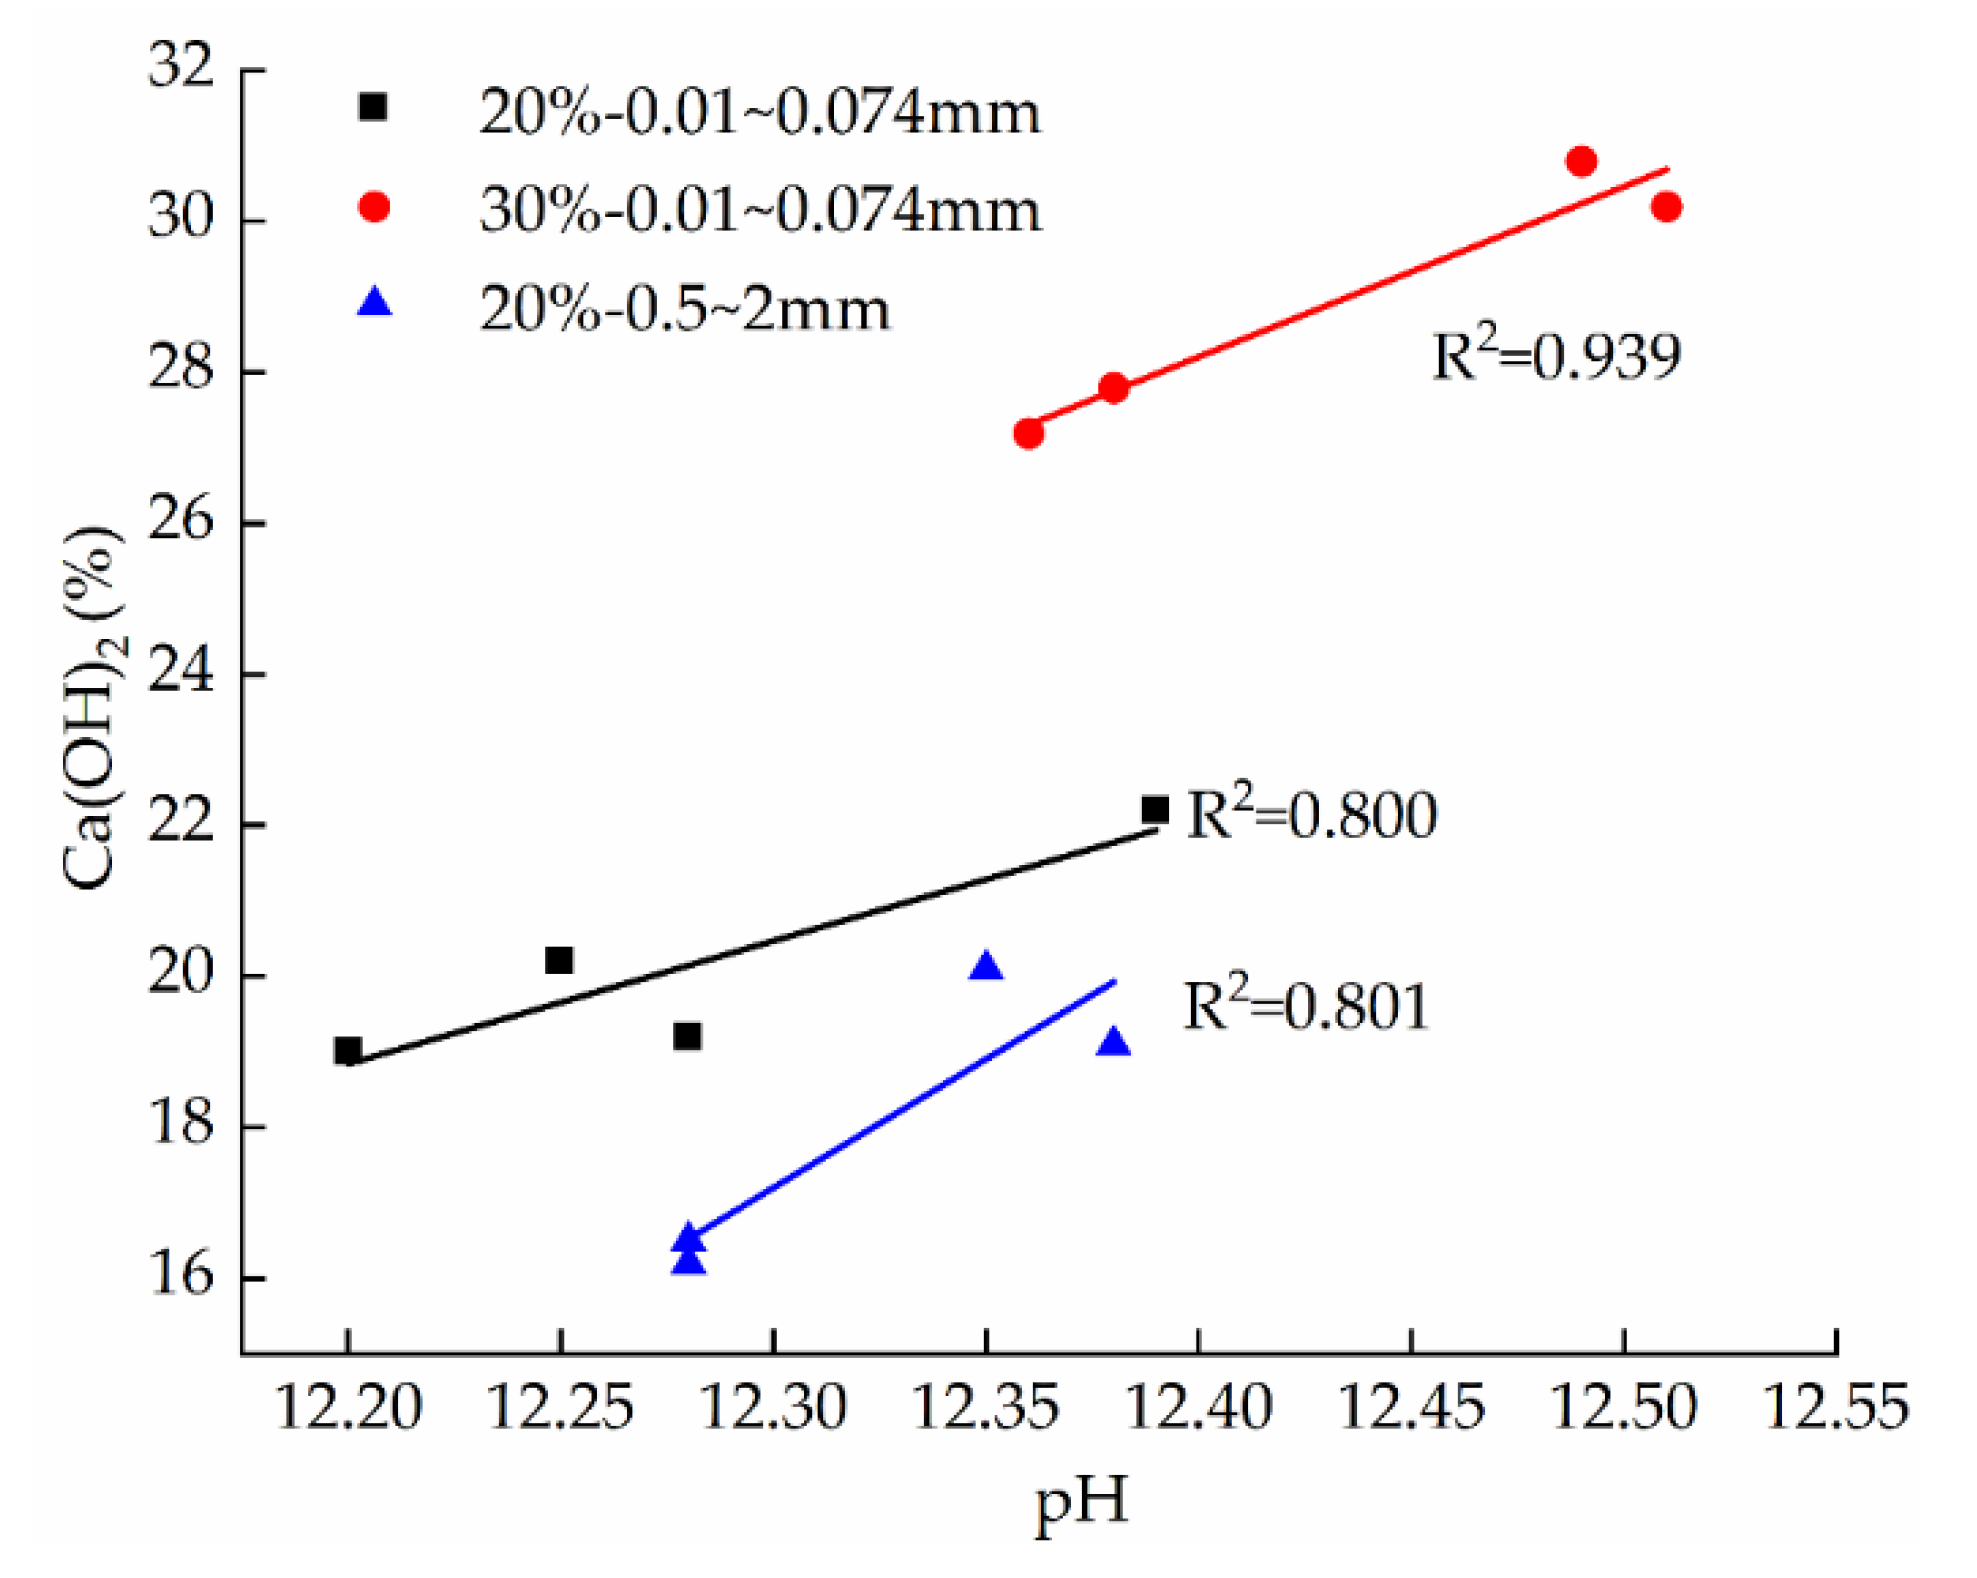
Figure 15.
Scanning electron microscopy (SEM) images of the samples with different lime content, particle size, and aging time: (a) 20%–0.01–0.074 mm–6 h; (b) 20%–0.01–0.074 mm–72 h; (c) 20%–0.01–0.074 mm–120 h; (d) 30%–0.01–0.074 mm–6 h; (e) 30%–0.01–0.074 mm–72 h; (f) 30%–0.01–0.074 mm–120 h; (g) 20%–0.5–2 mm–6 h; (h) 20%–0.5–2 mm–72 h; and (i) 20%–0.5–2 mm–120 h.


Figure 16.
Effect of aging time on the characteristic parameters of the samples: (a) 10%–0.01–0.074 mm; (b) 20%–0.01–0.074 mm; (c) 30%–0.01–0.074 mm; (d) 20%–0.01–0.074 mm; and (e) 20%–0.010.074 mm.
Figure 16.
Effect of aging time on the characteristic parameters of the samples: (a) 10%–0.01–0.074 mm; (b) 20%–0.01–0.074 mm; (c) 30%–0.01–0.074 mm; (d) 20%–0.01–0.074 mm; and (e) 20%–0.010.074 mm.

Table 1.
Test parameters.
| Lime Content (%) | Lime Particle Size (mm) |
|---|---|
| 10 | 0.01–0.074 |
| 20 | |
| 30 | |
| 20 | 0.074–0.5 |
| 20 | 0.5–2 |
Publisher’s Note: MDPI stays neutral with regard to jurisdictional claims in published maps and institutional affiliations. |
© 2021 by the authors. Licensee MDPI, Basel, Switzerland. This article is an open access article distributed under the terms and conditions of the Creative Commons Attribution (CC BY) license (https://creativecommons.org/licenses/by/4.0/).
Share and Cite
MDPI and ACS Style
Yue, J.; Chen, Y.; Zhao, L.; Wang, S.; Su, H.; Yang, X.; Gao, H.; Zhang, Y.; Li, W. Effects of Aging on the Dry Shrinkage Cracking of Lime Soils with Different Proportions. Appl. Sci. 2022, 12, 145. https://doi.org/10.3390/app12010145
AMA Style
Yue J, Chen Y, Zhao L, Wang S, Su H, Yang X, Gao H, Zhang Y, Li W. Effects of Aging on the Dry Shrinkage Cracking of Lime Soils with Different Proportions. Applied Sciences. 2022; 12(1):145. https://doi.org/10.3390/app12010145
Chicago/Turabian StyleYue, Jianwei, Ying Chen, Limin Zhao, Siyuan Wang, Huicong Su, Xue Yang, Huijie Gao, Yiang Zhang, and Wenhao Li. 2022. "Effects of Aging on the Dry Shrinkage Cracking of Lime Soils with Different Proportions" Applied Sciences 12, no. 1: 145. https://doi.org/10.3390/app12010145
Note that from the first issue of 2016, this journal uses article numbers instead of page numbers. See further details here.