Article

Multi-Source Data Fusion Method for the Truss Structure Stability Measurement of Space Telescope

1
Changchun Institute of Optics Fine Mechanics and Physics, Chinese Academy of Sciences, Changchun 130033, China
2
University of Chinese Academy of Sciences, Beijing 100049, China
*
Authors to whom correspondence should be addressed.
Appl. Sci. 2022, 12(11), 5562; https://doi.org/10.3390/app12115562
Submission received: 18 April 2022 / Revised: 23 May 2022 / Accepted: 23 May 2022 / Published: 30 May 2022
(This article belongs to the Topic Innovation of Applied System)

Abstract

:
It is necessary for large aperture space telescopes to achieve high measurement accuracy for mechanical reference mounting surfaces, complex deformation conditions, and difficulty in describing spatial geometric properties. In this manuscript, we propose a measurement method for evaluating the deformation of the trusses structure by fusing multiple sources of data. The multi-source data are obtained from the theodolite, laser tracker, and photogrammetry systems. The datum alignment of the laser tracker and photogrammetry coordinate systems is achieved by establishing the transition coordinate system method of the datum platform, and the alignment accuracy (3σ) is about 8.8″, 5.1″ and 4.2″. Using the laser tracker to establish the relationship between the cubic mirror coordinate system and the geometric coordinate system of the mounting part, the fast and high-precision measurement of the mounting angle of the cubic prism is realized, and the measurement accuracy reaches 2″. The data from multiple sources are fused through datum transfer and alignment to establish a cosine matrix transfer chain between the mechanical characteristic coordinate system of each component and the transition coordinate system of the datum platform, and the Eulerian rotation angle is obtained to describe the angular relationship between the components after solving. Based on the Monte Carlo mathematical error modeling analysis, the datum transfer and alignment simulations were carried out, and related experiments were conducted. The experiments show that the transfer error (3σ) of the XYZ rotation angle is less than 20.6″ after the datum transfer, the maximum error is within 3″ compared to the simulation results, and the deviation of the comparison photographic measurement data is less than 7.6″. The datum transfer method combined with photogrammetry can describe the deformation trend of large-size trusses under different load conditions more objectively and reasonably.

1. Introduction

In recent years, the demand for optical space exploration has led to the development of space optical telescopes in the direction of multi-functionality with tens of meters or even longer focal lengths, five meters or even larger apertures, splicing, and in-orbit assembly to meet their requirements for high resolution and diversification of measurement objects [1,2,3]. At present, off-axis space telescopes usually adopt a composite truss support structure, which has poor stability compared with traditional material structure. Therefore, in the integration process of the space telescope, corresponding stability measurement experiments are required for mechanical structure deformation under different loads [4,5].
In terms of datum transfer, a wide range of spatial coordinate measuring instruments were used in the 6.5 m diameter JWST project. Coordinate alignment of the Integrated Science Instrument Module (ISIM) was done using the Unified Spatial Metrology Network (USMN) technique, with an accuracy of 0.26 mm for rigid body change position measurements and 0.002° for angular accuracy after relational fitting. In addition, the theodolite and laser tracker system was used as the main position and orientation measurement device in the vacuum cryogenic test and gravity release test experiments [6,7,8,9,10,11,12,13]. Mitchell. J et al. proposed a laser tracker sensor data fusion alignment algorithm for large-scale precision metrology to trim various error sources into the measurement data to improve measurement accuracy [14]. Predmore. C.R proposed the Mahalanobis distance-based surveying adjustment method to improve measurement equipment-transited accuracy and applied it to ground-based large millimeter telescope 3 m × 5 m magnitude panel assembly in inspection [15]. Zhao. G et al. combined photogrammetry and laser tracker to measure common points based on an image calibration method to control the laser tracker transfer error to 0.02 mm at 6-m range [16]. Liu. W.L et al. combined the radial basis function and best least-squares neural network method to reduce the average error of coordinate transformation between the laser tracker and coordinate measuring machine (CMM) to 0.054 mm within 1 m3 [17]. Wang. W et al. proposed a warp collimation virtual prism method to solve the spacecraft mounting angle [18].
The current state of research and experimental applications indicate that: (1) The increased sensitivity to misalignment during the integration of space telescopes requires test accuracy on the order of arcseconds. (2) Due to the anisotropy and complex deformation patterns of the special process composites widely used in the lightweight design of space telescopes truss structure, it is difficult for the existing data fusion measurement methods to balance sampling density and measurement accuracy. (3) As a result, relatively high measurement accuracy and high sampling density at larger scales are required, while the measurement uncertainty introduced by the underlying measurement means is not significantly reduced.
In view of the above problems, combined with the needs of space telescope truss structure stability test experiments, the paper proposes to establish the relationship between the cubic prism coordinate system and the geometric coordinate system of the mounting components by the laser tracker. This method improves the accuracy from 10″ to 2″ compared to the conventional method of fitting the plane normal vector and enables fast and high-precision measurement of the cubic prism mounting angle. Based on the design model of the truss structure, the transfer process of the coordinate system reference of the truss structure is analyzed and simulated based on the Monte Carlo mathematical model, which is verified by the stability test experiment of the truss structure. After datum transfer, the transfer error (3σ) of XYZ coordinate axis rotation angle is less than 20.6″, and the deviation of coordinate system datum transfer simulation is less than 3″ compared with experimental results. The deviation of photogrammetry data is less than 7.6″ compared with the experimental results after the datum transfer of theodolite and laser tracker after the common datum of multi-source data.

2. Measurement Model

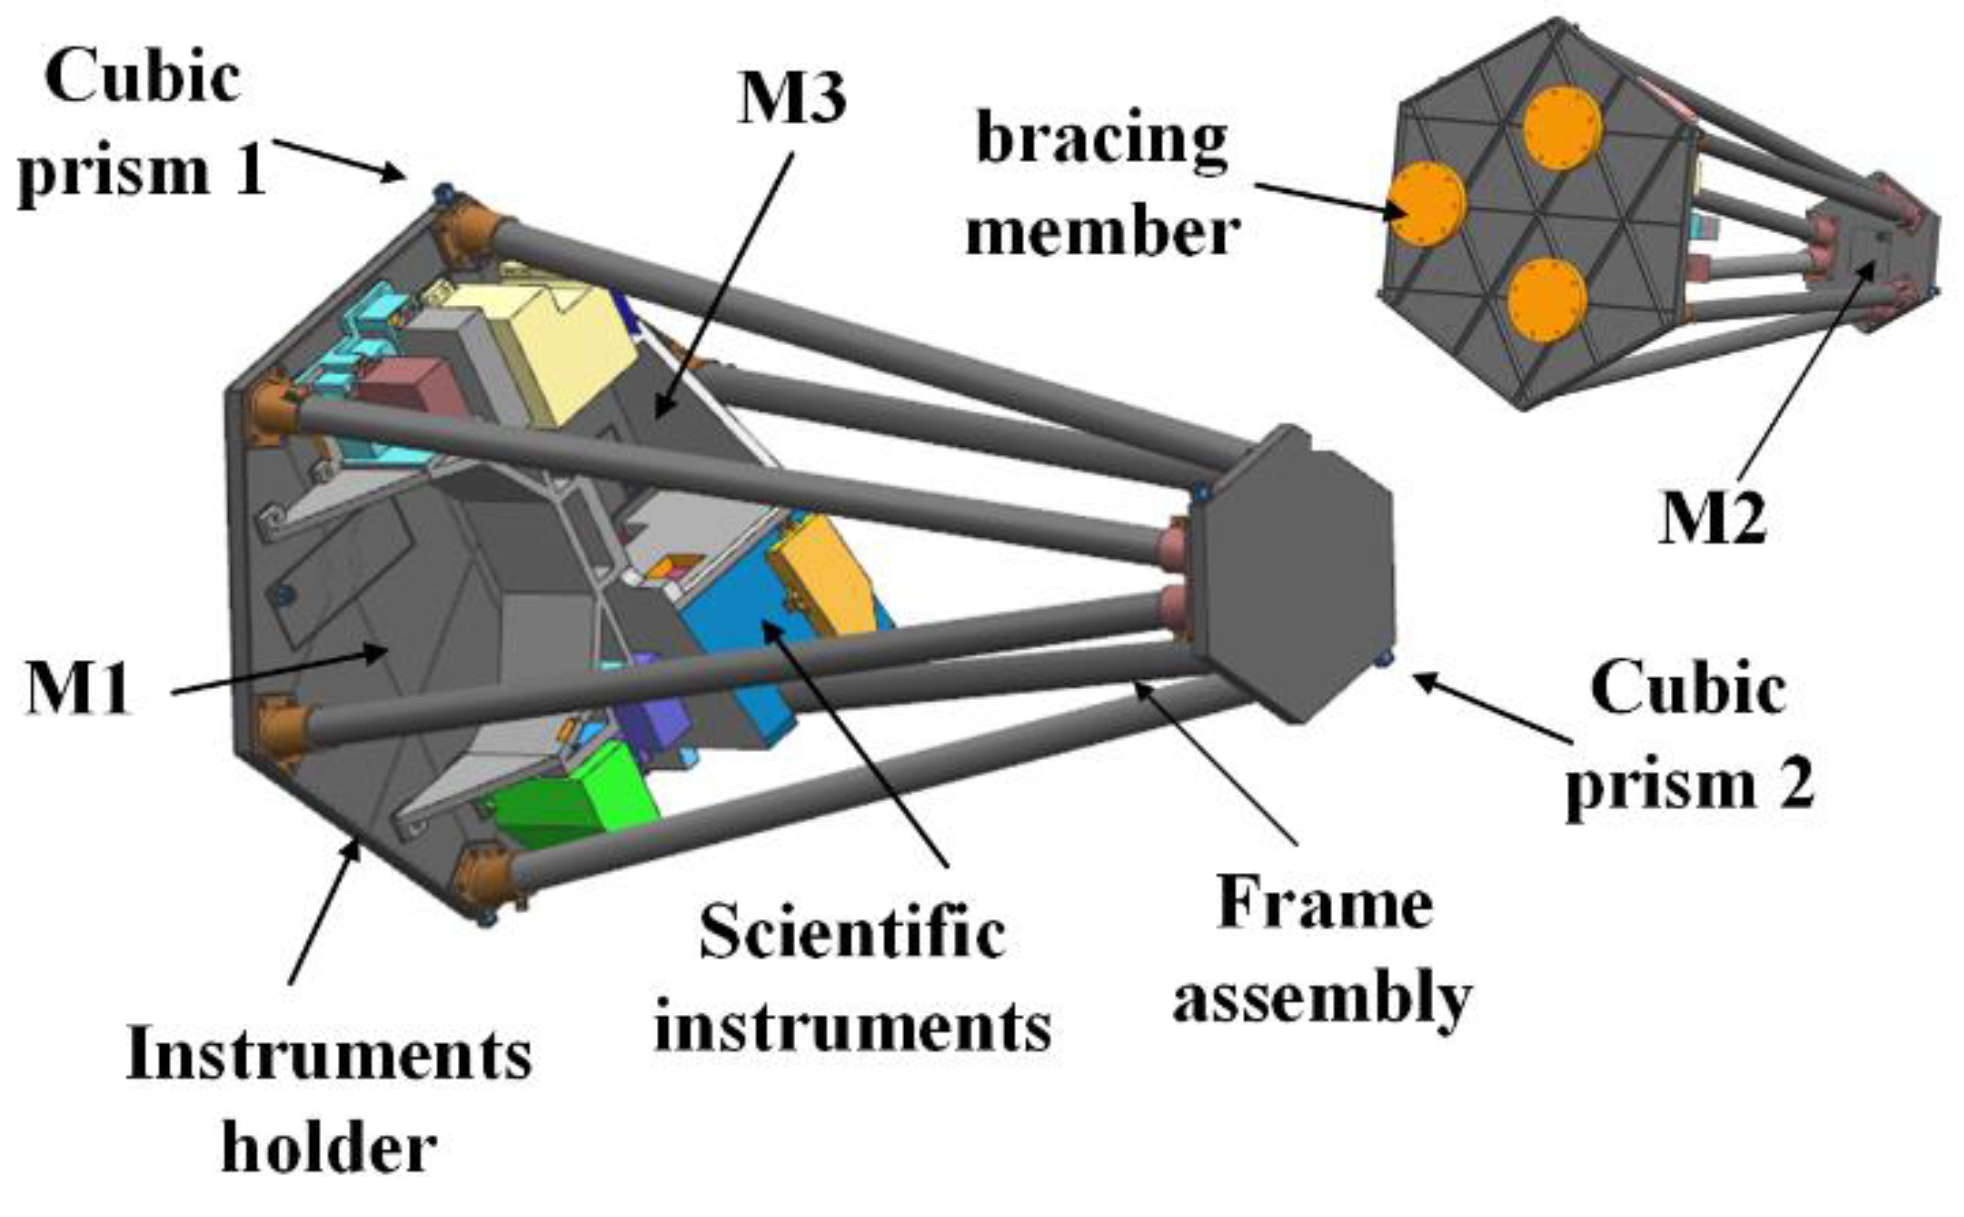
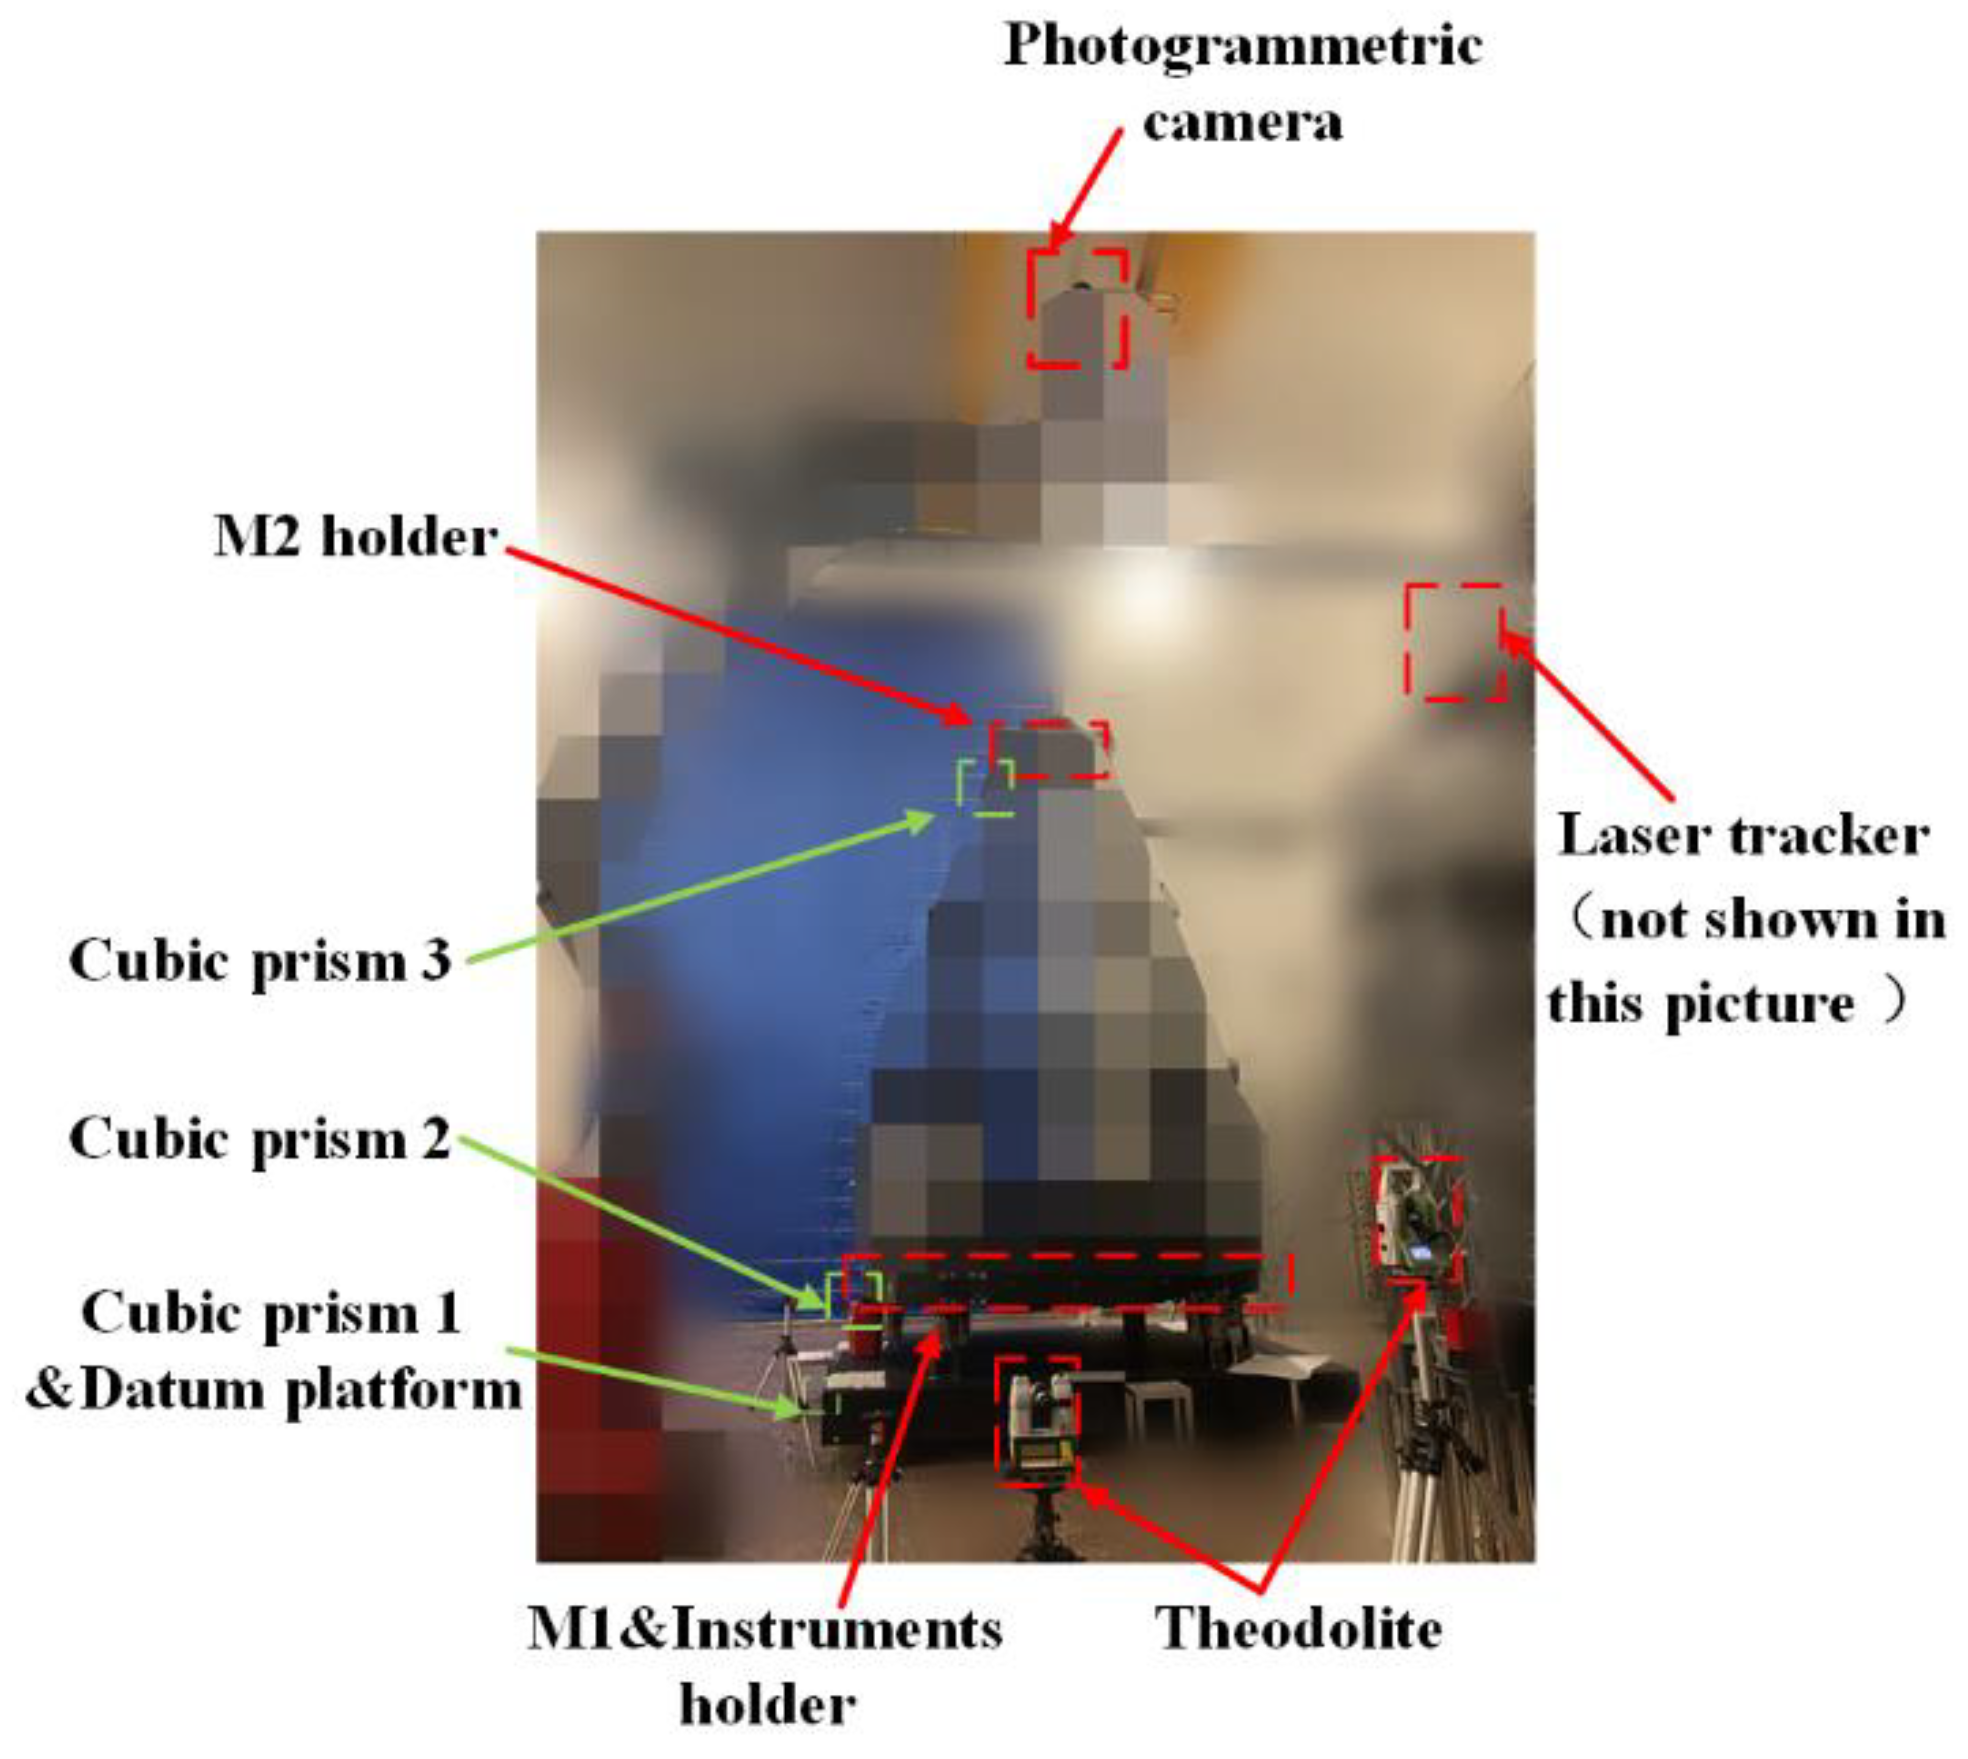
2.1. Test Subject Overview

Figure 1 shows a typical model of the structure of an off-axis reflector telescope optical system using a truss configuration for analysis and verification in this paper. The overall size of the model is approximately 4 m × 4 m × 5 m. The M1&Instruments holder, M2 holder, and truss structure are all carbon fiber composite materials. M1, M2, and M3 represent the primary, secondary, and tertiary mirror positions of the silicon carbide reflector in the optical load, respectively. The datum platform is 4 m × 4 m × 0.5 m granite with a flatness of 0.005 mm.

2.2. Analysis of Measurement Requirement

According to the sensitivity matrix analysis method of optical systems [19,20,21,22], optical misalignment is defined as the deviation of the ideal position of the optical element from the actual position. For the optical system shown in Figure 1, M1 is used as the test mount reference, and the sensitivity matrix A is obtained from M2 and M3 to form the out-of-tune quantities as shown in Table 1. Dx, Dy, and Dz represent the wave image difference in λ/mm for a 1 mm variation in the X, Y, and Z directions, respectively. Tx and Ty represent the wave image difference in λ/° for a 1° variation in the X and Y directions, respectively.
He et al. have analyzed the sensitivity curves of M1, M2, and M3 in the optical machine structure of off-axis reflecting telescopes [20]. According to the sensitivity matrix A and the sensitivity curve, M1 is most sensitive in Dx, Tx, and Ty. M2 is most sensitive in Dz. As for Dy, M1 and M2 are equally sensitive. As for Dx, Dy, and Dz, M2 is much more sensitive than M3. As for Tx and Ty, M2 is about 3–5 times more sensitive than M3. In summary, the variation in sensitivity between M1 and M2 is much greater than the variation in sensitivity between M1 and M3. As both M1 and M2 are mounted on the M1&Instruments holder (as in Figure 1), the above model can be simplified to a common reference for M1 and M3. Using M1 as a reference, the wave aberration assignments for each dimension of M2 and the mounting tolerance requirements are shown in Table 2.
As can be seen from Table 2, the M2 mounting tolerance requirements are very demanding in terms of measurement accuracy, and it is difficult to meet the tolerance requirements for measurement accuracy based on the existing measurement equipment and sampling density. Therefore, it is necessary to combine the existing equipment to improve the measurement and mounting accuracy as much as possible and to leave a sufficient margin for the wavefront correction method to eliminate the deformation [23,24,25].

3. Datum Transfer

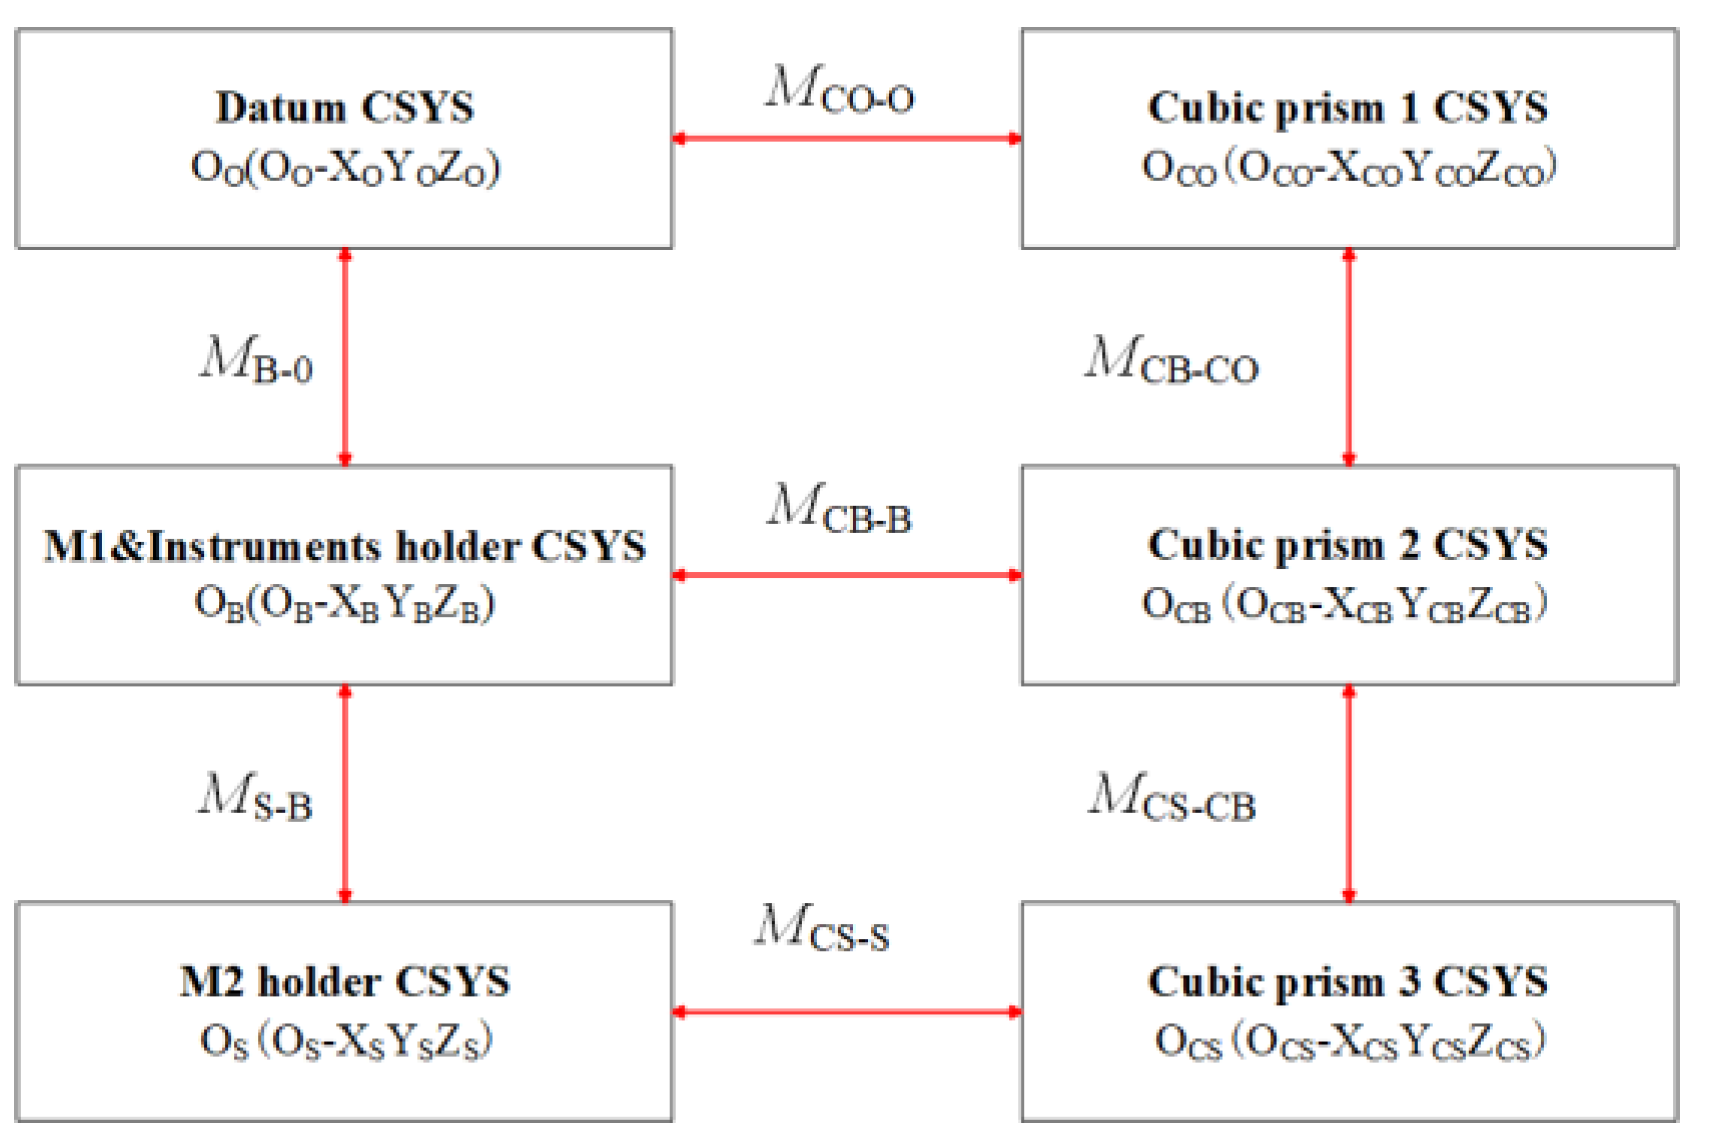
3.1. Systematic Coordinate System

The results of ground-mounted stability testing of optical loads in space have a serious impact on their in-orbit imaging quality. Currently, commonly used geometric measurements to assess truss deformation mainly include instruments such as a theodolite, laser tracker, and industrial photogrammetry [26]. Figure 2 shows a spatial coordinate measurement system composed of each instrument.
As shown in Figure 2, the coordinate system is established as follows: The M1&Instruments holder coordinate system OB (OB-XBYBZB), the origin of the coordinate system OB located at the intersection of three mutually perpendicular planes. The ZB is the direction of the optical axis, the YB axis is the direction of the line connecting M1 and M3, and the XB is determined by means of a right-handed coordinate system. In the datum platform coordinate system OO (OO-XOYOZO), the origin of the coordinate system OO is located at the intersection of the three mutually perpendicular planes, and the direction of the coordinate axes is the direction normal to the three planes. The M2 holder coordinate system OS (OS-XSYSZS) is established in a similar way to the datum platform coordinate system. The angular relationship between the M1&Instruments holder and the M2 holder can be described by the rotation angles α, β, and γ of the OB and OS systems with respect to the OO system. If the manufacturing error and installation error of the cubic prism are ignored, the coordinate system OCO (OCO-XCOYCOZCO) of cubic prism 1 is parallel to the OO system, and the coordinate system OCB (OCB-XCBYCBZCB) of cubic prism 2 is parallel to the OB system. The XCS, YCS, and ZCS vectors in the coordinate system OCS (OCS-XCSYCSZCS) of the cubic prism 3 can be represented relative to the OS by the cosine matrix MCS-S.

3.2. Transformation Matrix

There are various mathematical expressions to quantify the relationship between the design, measurement, and reference coordinate systems that need to be defined and calculated during the testing and assembly of spacecraft. As shown in Figure 3, the principle of cosine matrix coordinate transformation can be used to derive the attitude relationships between the components, provided that the mechanical design coordinate system of each component is known. As in (1) and (2), the M2 holder can be characterized by the datum platform or the M1&Instruments holder. As in (3), the M1&Instruments holder can be characterized by the datum platform.
P S = M S B × M B O × P O = M C S S × M C S C B × M C B C O × M C O O × P O
P S = M S B × P B = M C S S × M C S C B × M C B B × P B
P B = M B O × P O = M C B B × M C B C O × M C O O × P O
where: PS is the coordinate vector in the M2 holder coordinate system. PB is the coordinate vector in the M1&Instruments holder coordinate system. PO is the coordinate vector in the datum platform coordinate system. MS-B is the transformation matrix caused by the change in angle of the M2 holder with respect to the M1&Instruments holder. MCB-CO and MCS-CB are the transformation matrices between the cubic prism 1 coordinate system, the cubic prism 2 coordinate system, and the cubic prism 3 coordinate system, respectively. MCS-S, MCB-B, and MCO-O are installation angle transformation matrices of the cubic prism coordinate system with respect to the respective installation design coordinate system.
After defining the respective coordinate systems and the transfer matrices between them, the respective transformation matrix forms are solved [27,28,29]. Assuming that the M2 holder and the M1&Instruments holder are rigid bodies, the transformation angle between them is described by the Kardan rotation relationship (X-Y-Z rotation sequence). Rotation α about the X-axis, rotation β about the Y-axis, and rotation γ about the Z-axis, the MS-B, can be expressed as (5).
{ R o t z = [ cos γ sin γ 0 sin γ cos γ 0 0 0 1 ] R o t Y = [ cos β 0 sin β 0 1 0 sin β 0 cos β ] R o t X = [ 1 0 0 0 cos α sin α 0 sin α cos α ]
M S B = R o t Z R o t Y R o t X = [ cos β cos γ cos β sin γ sin β cos α sin γ + sin α sin β cos γ cos α cos γ sin α sin β sin γ sin α cos β sin α sin γ cos α sin β cos γ sin α cos γ + cos α sin β sin γ cos α cos β ] = [ c 11 c 12 c 13 c 21 c 22 c 23 c 31 c 32 c 33 ]
Since the transformation angle of the M2 holder with respect to the M1&Instruments holder is very small, the rotation angles α, β, and γ can be found by solving (6).
The MB-O can be solved in the same way. In the actual measurement process, the M1&Instruments holder and the M2 holder are designed and manufactured from composite materials and they are not rigid bodies. Therefore, the overall deformation needs to be described and evaluated in conjunction with the photogrammetry system.
{ α = arctan ( c 23 c 33 ) β = arcsin ( c 13 ) γ = arctan ( c 12 c 11 )

3.3. Multi-Source Data Datum Alignment

The principle of the cubic prism method of creating mirror plane vectors is shown in Figure 4a. The laser beam is reflected by the cubic prism to point A, the coordinates of the virtual point B and the actual point A in the mirror are measured, and the line AB is the normal coordinate system vector [30].
It is easy to prove from the reflection theorem that the mirrored reflection point A (xa, ya, za) and the virtual point, obtained after measurement, form the vector A B (e1, e2, e3), which is the normal direction of the cubic mirror at that surface, where:
e 1 = x a x b | A B |
e 2 = y a y b | A B |
e 3 = z a z b | A B |
Similarly, the normal vector C D (m1, m2, m3) in the direction of the other perpendicular of the cubic mirror is obtained. The above-normal vectors are cross multiplied to obtain the normal vectors P (p1, p2, p3) perpendicular to the vectors A B and C D to establish the cubic prism coordinate system L1. The simulation of this method is described in Section 4.1.
As in Figure 4b, in the cubic prism coordinate system L1, use the laser tracker to aim at the surface feature point C n , n 3 on the datum platform. Using (xn, yn, zn), n = 1, 2, 3...n, to fit the plane equation.
E = i = 1 n ( a 1 x i + a 2 y i + a 3 z i ) 2
To minimize the target variable E, we make the partial derivatives equal to zero.
{ 2 ( a 1 x i + a 2 y i + a 3 z i ) x i = 0 2 ( a 1 x i + a 2 y i + a 3 z i ) y i = 0 2 ( a 1 x i + a 2 y i + a 3 z i ) z i = 0
By solving the above equation, we can get Q (a1, a2, −1). After the unitization of the vectors, the surface normal vector of the datum platform is obtained. Similarly, the datum platform coordinate system L2 can be established. The angle between the cubic prism and the datum platform can be described by calculating the cosine matrix M between the cubic prism coordinate system L1 and the datum platform coordinate system L2.
As shown in Figure 5, photogrammetry and laser trackers are used to illuminate the target sphere holders at the corners of the reference platform. Multiple source data datum alignment can be achieved by replacing the laser tracker target ball and the photogrammetric target ball. The simulation of this method is described in Section 4.2.

4. Error Simulation and Analysis

4.1. Cubic Prism Coordinate System Error

As described in Section 3.1, in the process of establishing the cubic prism coordinate system, the measurement error accumulated between the actual and virtual points measured by the laser tracker affects the accuracy of the vector creation. This will result in the direction of the established vector not being parallel to the direction of the actual cubic prism normal vector, which in turn will affect the accuracy of the vector establishment of the cubic prism coordinate system. The point measurement error of a laser tracker falls into the category of random error and therefore the point measurement error can be described by a Gaussian normal distribution. The cubic mirror normal vector N (e1, e2, e3) is related to the two-point linking vectors A B (n1, n2, n3) by:
N ( e 1 , e 2 , e 3 ) = F G a u s s ( A B ( n 1 , n 2 , n 3 ) )
We establish a spatial plane in the simulation software, set the incident ray length to 5 m, and use the cosine relationship to limit the incident ray angle to 60°, 45°, and 30°, aimed at the space plane (simulating a cubic prism surface). The effect of the length of the reflected light on the accuracy of the coordinate system established by the cubic mirror is calculated for laser tracker and cubic prism positions (length of incident ray) of 1 m, 2 m, and 4 m according to (7)–(9). Figure 6a–c show the error curves established for the cubic prism vector for different incident ray length conditions. The horizontal coordinate is the length of the reflected ray, and the vertical coordinate is the angular error in the establishment of the coordinate system.
As can be seen from the simulation data, when the length of the reflected light is in the range 0.5–2 m, an increase in the angle of incidence has a more sensitive effect on the error established by the cubic prism vector.
As the reflected ray grows as the position of the receiver changes, the laser tracker measurement error increases, but the error established by the cubic mirror vector gradually decreases and converges to approximately 2″. In the experiments, this method was well validated by comparing the autocollimator measurement data.

4.2. Datum Alignment Error

According to the description in Section 3, we obtain the datum plane by fitting the feature points by the least-squares method. The reference platform coordinate system is established with the normal direction of the plane as the coordinate axis, and the angular error of the coordinate system establishment is simulated. The measurement of feature points can be equated to the measurement of spatial point coordinates. According to the laser tracker and photogrammetric error distribution model, the spatial point coordinate measurement can be described by a normally distributed error.
Assuming the measuring device is at 2 m, the laser tracker error is approximately 27 μm (3σ), and the photogrammetric error is approximately 15 μm (3σ), substitute into (10) and (11). We have designed a simple equivalent model, imported the feature points into the simulation software, and added the above errors to simulate the datum alignment errors during real measurements. The probability distribution curves of the angular error of the coordinate system after datum alignment are shown in Figure 7a–c. The horizontal coordinates are the angular errors in the X, Y, and Z axes (expressed as Eulerian rotation angles) and the vertical coordinates are the probabilities.
The simulation results show that when the measuring equipment is 2 m away from the reference platform, the error distribution of the X, Y, and Z axes of the coordinate system presents three different forms during the alignment process between the laser tracker and the photogrammetric reference. The limiting errors (3σ) are approximately 8.8″, 5.2″, and 4.2″.

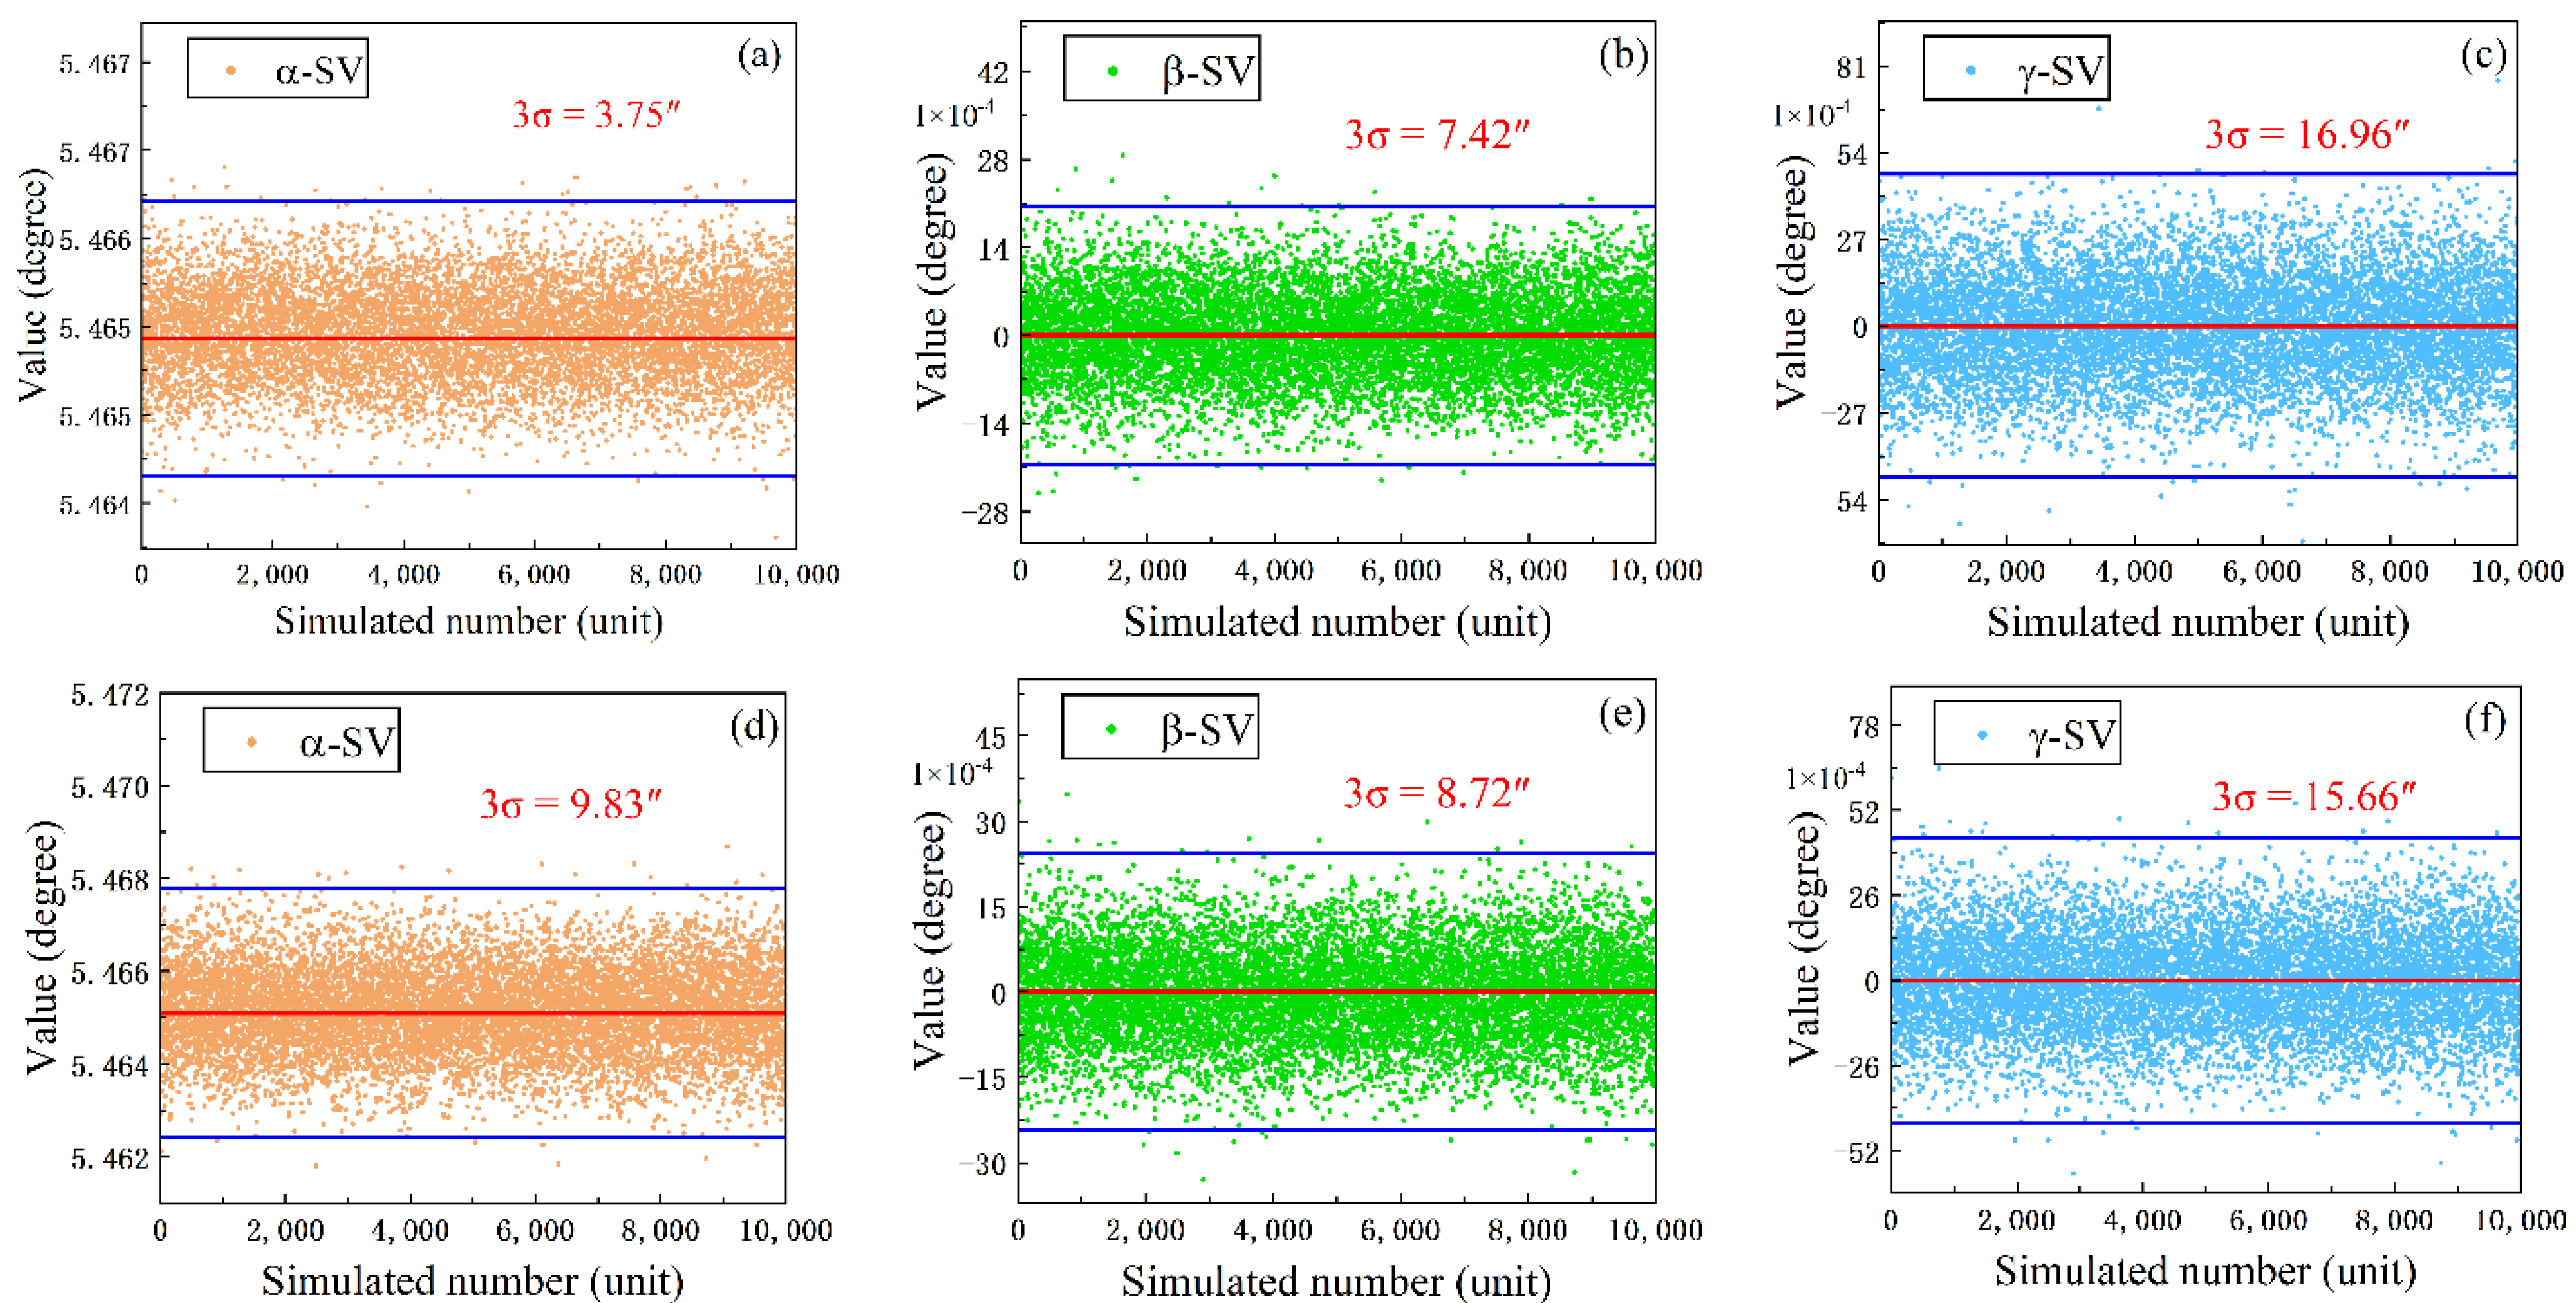
4.3. Datum Transfer Error

The accuracy of the datum transfer can be affected by several errors. The four single variables are added term by term to the equivalent model in Section 4.2. The effect of a single error source on the transfer accuracy is analyzed by the simulation to obtain an error sensitivity ranking, which in turn allows the control of each error source. Figure 8a–d show the error of the X, Y, and Z coordinate axis vectors when theodolite collimation error, laser tracker collimation error, laser tracker reflective target sphere manufacturing eccentricity error, and cubic prism coordinate system establishment error are applied to the datum transfer, respectively. The horizontal coordinates are the range of error values, and the vertical coordinates are the axis transfer errors.
As a result of the analysis, when the measurement error of the theodolite varies within 5″, the X-axis turning angle transfer error varies within 0.5″, and the Y-axis and Z-axis transfer error gradually increases within 8.5″ and 12.7″. As the laser tracker aiming error varies from within 0.05 mm, the XYZ axis angular transfer error gradually increases in the 4.1″, 6.5″, and 2.8″ ranges. As the cubic prism coordinate system establishment error varies within 5″, the XYZ axis angular transfer error gradually increases within 2.8″, 3.5″, and 11.2″.
In summary, every single error has a different degree of influence on the accuracy of the coordinate axis transfer. The most significant effect on the Z-axis rotation is caused by errors in the measurement of the theodolite and errors in the establishment of the cubic prism coordinate system. Laser tracker collimation error and reflective target ball manufacturing eccentricity error have the most significant effect on the Y-axis rotation angle.
As the role of each error has a certain distribution interval, it is necessary to ensure that the total error accumulated after the benchmark transfer is within the design allowable range, and the simulation process is as follows:
(1)
Set the simulation model parameters as the theoretical values for the simulation scenario, including mechanical feature points, the azimuth of the M1&Instruments holder to the M2 holder, and the mounting error of each component.
(2)
Calculation of the theoretical values of the attitude angles of the M1&Instruments holder and the M2 holder according to the theoretical parameters of the simulation set in step (1), in combination with the computer model.
(3)
Transfer simulation based on the effect of each measurement error to obtain the angular values containing random errors between the datum platform, the M1&Instruments holder, and the M2 holder.
(4)
The results of the calculation in step (3) are compared with the theoretical true value in step (2) to produce a simulation error value for the datum transfer process.
The theoretical values of the simulation were obtained from the computer theoretical model as shown in Table 3.
The mathematical model of the transformation matrix is established by computer simulation and brought into the above simulation parameters. Simulation of the datum transfer relationship in (1), (2), and (3) gives the theoretical angular values of the datum platform, the M1&Instruments holder, and the M2 holder. The angular values in the above transfer process are all constants. The Monte Carlo mathematical model is used for benchmark transfer simulation. The errors listed in Table 4 were selected and brought into the transfer chain with the appropriate expectation and standard deviation, and the root-mean-square synthesis law was met between the errors.
According to the error values listed in Table 4, we generate 10,000 sets of normally distributed random numbers for simulation in each error dimension. After the calculation of (6), we get rotation α around the X-axis, rotation β around the Y-axis, and rotation γ around the Z-axis, as shown in Figure 9a–i. The horizontal coordinate is the number of simulations, and the vertical coordinate is the value of the angle of rotation of each axis. SV is the angle value obtained from the simulation. The red line represents the theoretical rotation angle value, and the blue line represents the limit deviation (3σ).
As can be seen in Figure 9, the simulated values of the rotation angle are distributed in a normal distribution pattern around the theoretical true value. After the transfer of (1), the XYZ coordinate transfer errors (3σ) are 3.75″, 7.42″, and 16.96″. After the transfer of (2), the XYZ coordinate transfer errors (3σ) are 9.83″, 8.72″, and 15.66″. After the transfer of (3), the XYZ coordinate transfer errors (3σ) are 13.50″, 13.50″, and 13.39″. Analysis can be obtained by (1)–(3), XYZ coordinate axis rotation angle error are within 17″, and different transfer on the coordinate axis transfer accuracy of different impact.

5. Experiment Verification

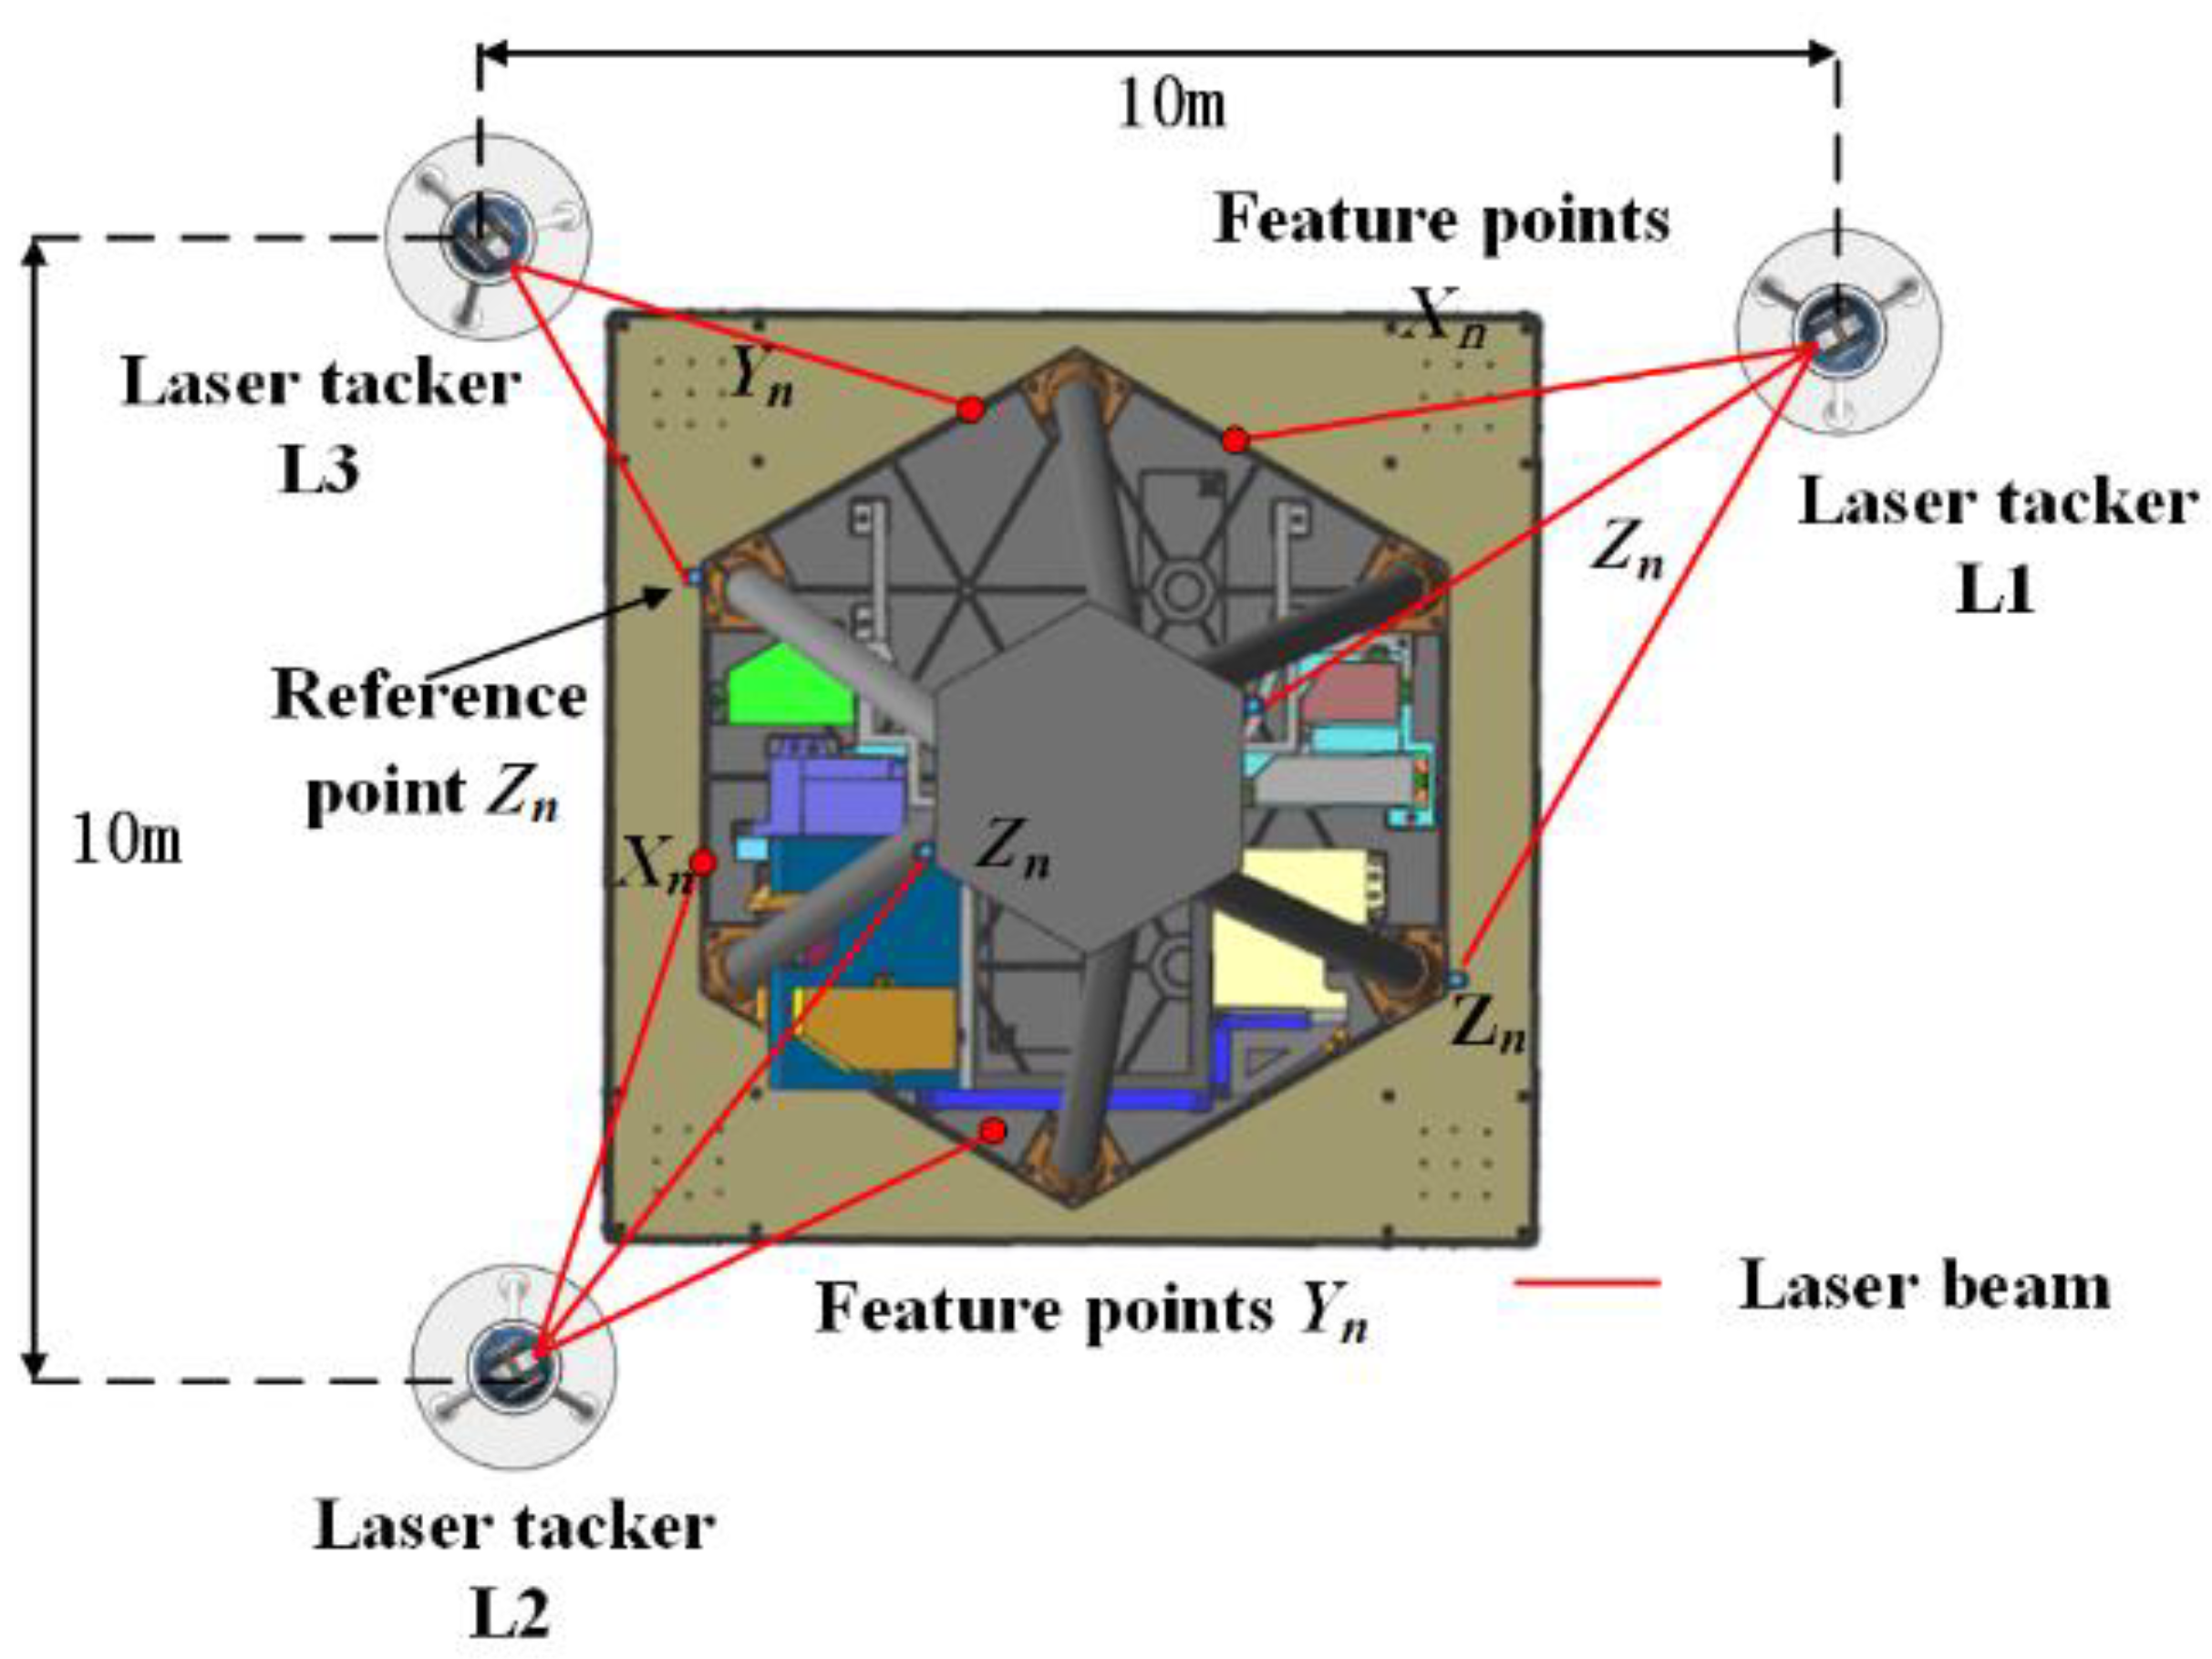
5.1. Experimental Programme

The correctness of the multi-source data datum alignment and transfer method and the validity of the simulation accuracy in the truss structure stability experiment are verified. The truss structure is placed in a constant temperature clean assembly laboratory, and the structure is placed above a 3 m × 3 m × 0.5 m granite datum platform. Standard target spheres are placed at the corners of the datum platform for coordinate system datum alignment. We use a reference prism to transfer the coordinate system to solve the problem of a single instrument station not being able to take into account the entire measurement site due to the limitations of the measurement site. All our experiments are carried out in an ISO7-compliant laboratory, with room temperature variations within 20° ± 0.5°. Before the experiment, we had placed the experimental truss structure for 24 h.
Four Leica TM6100A electronic theodolites were placed in the site as shown in Figure 10. T1 and T2 are placed at approximately 3 m and 2 m from the truss structure, collimating the cubic prism 2 on the M1&Instruments holder. T3 and T4 are placed at approximately 6 m from the truss structure, collimating the cubic prism 3 on the M2 holder. The transformation matrix MCS-CB from cubic prism 2 to cubic prism 3 is obtained through the theodolite intersection measurement principle. Similarly, the transformation matrix MCB-CO for cubic prism 1 to cubic prism 2 is obtained. As shown in Figure 11, the Leica AT960 laser tracker was placed at about 2.5 m in the truss structure. In turn, the characteristic points Xn, Yn (n = 1, 2, 3...) and the measuring datum Zn (n = 1, 2, 3...) on the surface of the truss structure are measured. The M1&Instruments holder coordinate system OB (OB-XBYBZB), the M2 holder coordinate system OS (OS-XSYSZS), and the datum platform coordinate system OO (OO-XOYOZO) are established. The transformation matrices MCS-S, MCB-B, and MCO-O are obtained by the method described in Section 3.3.
We use a laser tracker to correlate the reference cubic prism coordinate system with the truss structure coordinate system. We use theodolite to associate the datum cubic prism coordinate system with the truss structure measurement cubic prism coordinate system. The specific experimental setup is as follows.
As shown in Figure 12a,b, we photographed the measurement targets attached to the surface of the truss structure at Ln (n = 1, 2, 3...8) stations with a handheld CIM-3 camera at approximately 2 m, 5 m, and 8 m from the ground at a total of 24 camera positions. Multiple digital images taken from different angles are resolved by bundle adjustment to obtain accurate XYZ coordinate values. Alignment of photogrammetric data to the datum transfer test data by the method described in Section 3.2.
The datum coordinate system transfer was carried out in the stability experiments, and Figure 13 illustrates how the individual coordinate system datums were transferred during the experiments. Experimental verification of the correctness of the datum transfer mathematical model and the repeatability of the datum transfer. Figure 14 shows the experimental site. Figure 15 shows the flow of the experiment.
In the experiment, the actual mounting angles of cubic prism 1, 2, and 3 were measured using the method described in Section 3.1. The spatial coordinates of the feature points of the truss structure were measured using the laser tracker, and transfer relationships is established between feature points and cubic prism. The transfer relation between cubic prisms is measured by theodolite. Photogrammetry is used to obtain the coordinates of the measurement points on the surface of the truss structure to obtain the overall deformation trend. The measured data is datum aligned in the processing software, fitted, and analyzed to solve for the cosine matrix of the M1&Instruments holder OB, the M2 holder OS, and the datum platform OO, and substituted into the mathematical model to inverse solve for the rotational relationship between the coordinate systems of the components.

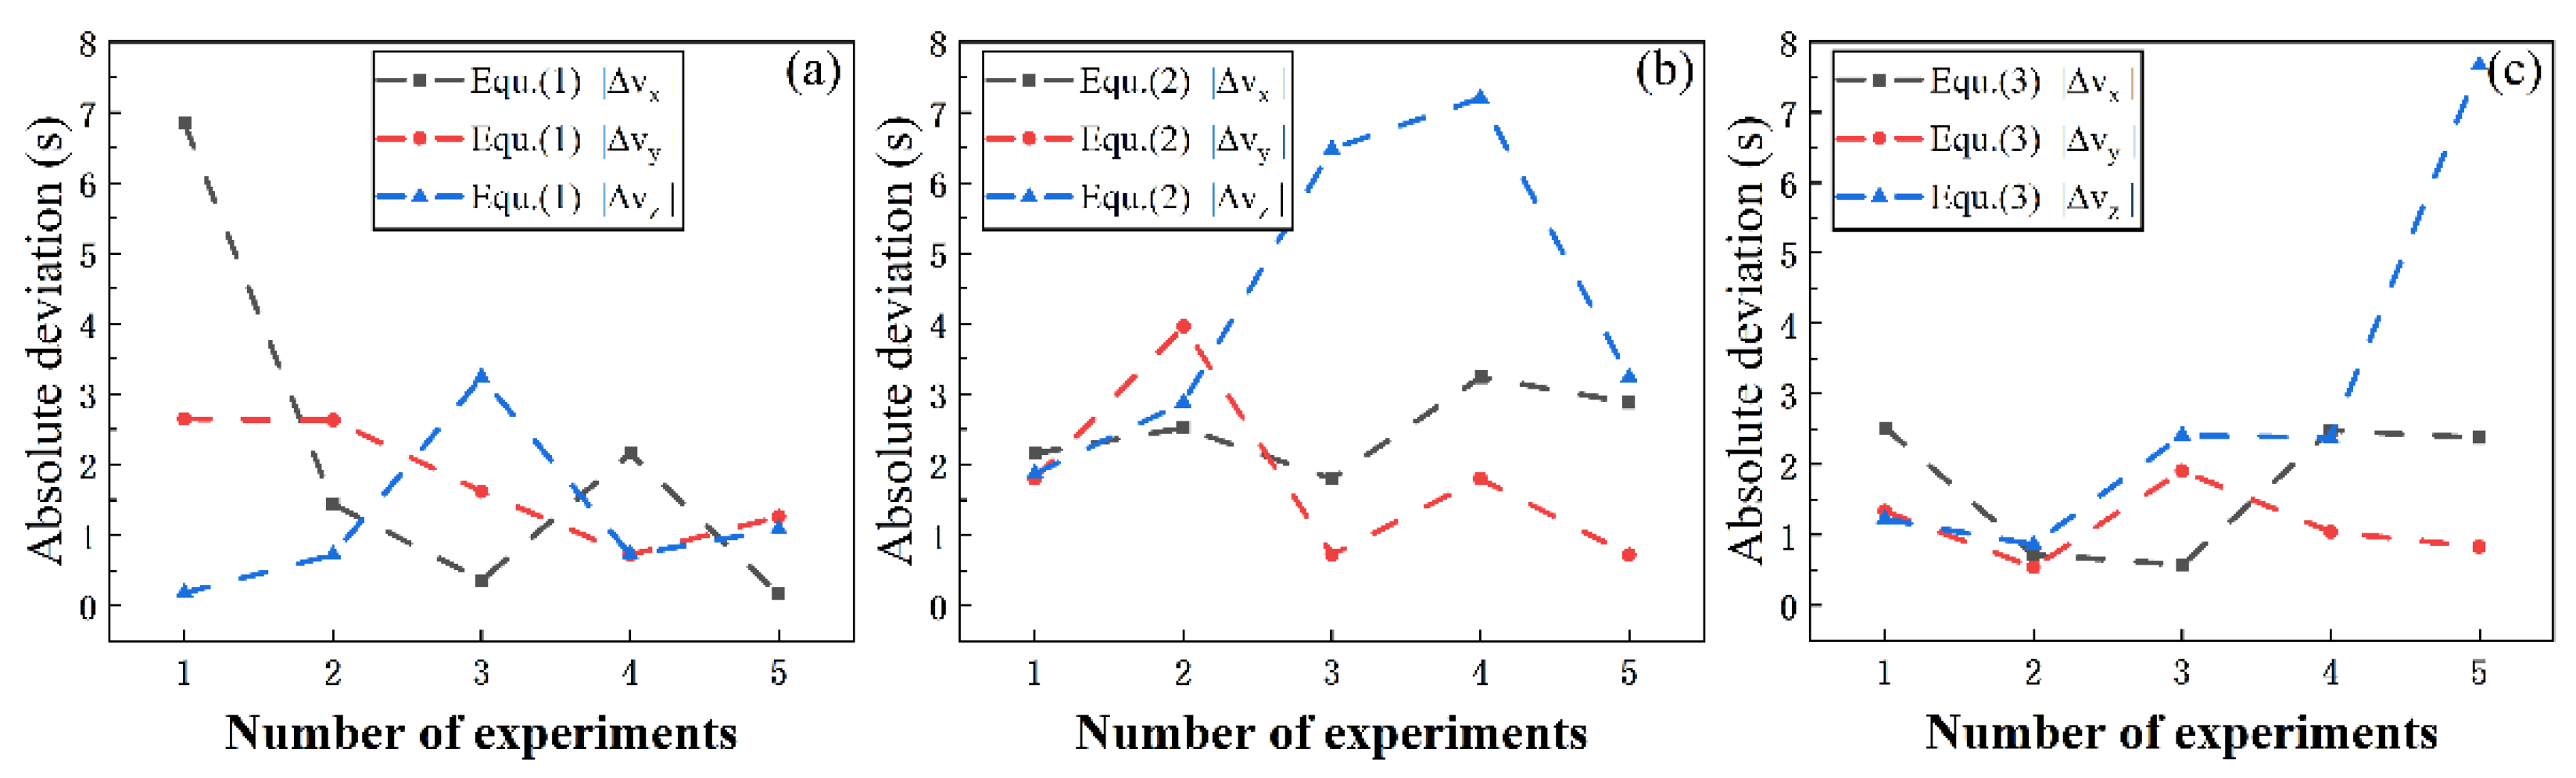
5.2. Results and Discussion

The cubic prism mounting angle was measured after the experimental environment was set up as shown in Table 5. The theodolite and laser tracker data after datum transfer are compared with the photogrammetric data. After datum alignment, the measurement data are calculated to obtain the rotation angle of the XYZ coordinate axis as shown in Figure 16a–i. The horizontal coordinate is the number of experiments and the vertical coordinate is the angle of rotation of the coordinate axis.
According to the Grubbs criterion, there is no gross error in the experimental data. Based on the analysis of the experimental data, the transfer errors (3σ) of the XYZ axis rotation angles for (1) are 13.9″, 13.1″, and 18.3″; (2), 8.2″, 14.3″, and 20.6″; (3), 18.1″, 19.8″, and 13.7″. For the analysis of the experimental data, the rotation angles of the XYZ axes obtained from the photogrammetric data are used as a reference. The maximum error of XYZ axis rotation angle calculated from theodolite and laser tracker data relative to photogrammetric data is less than 7.6″ (Figure 17a–c, horizontal coordinates are the number of experiments and vertical coordinates are the absolute deviations). The experimental results deviate from the simulated calculated values due to errors in machining, installation, personnel, and stress release during measurement of the truss structure. The error is within acceptable limits against the engineering requirements. The datum transfer experiment of the coordinate system of the truss structure verifies the effectiveness of the datum alignment method in the stability measurement experiment of the space telescope. On the other hand, the angle of rotation of each axis is solved by datum transfer and, combined with photogrammetry data, provides a good description of the deformation of the structural features of the truss structure.

6. Conclusions

To solve the problems such as the high accuracy requirement of space telescope truss structure stability measurement, complex deformation conditions of test objects in assembly, and difficulty in describing the spatial geometric characteristics of test objects, we propose the following innovations: (1) Use the laser tracker to establish the relationship between the coordinate system of the cubic prism and the coordinate system of the mounting component. Compared to the traditional method of fitting a plane vector, the accuracy is improved from 10″ to 2″, enabling fast and highly accurate measurement of the cubic mirror mounting angle, which is the biggest innovation of this article. (2) A datum platform was set up to achieve datum alignment of multiple sources of data and to establish a mathematical model of the errors. The coordinate axis datum alignment errors (3σ) obtained from simulation analysis is 8.8″, 5.2″, and 4.2″. The Monte Carlo method is used to analyze the coordinate system datum transfer errors and to conduct experiments. The experimental results show that the datum transfer error (3σ) of the XYZ axis rotation angle is less than 20.6″, and the maximum error is within 3″ compared to the simulation results. The maximum error of XYZ axis rotation angle calculated from theodolite and laser tracker data relative to photogrammetric data is less than 7.6″. It provides a reference for other space load datum transfer and high precision stability measurement.

Author Contributions

Resources, C.L.; validation, J.L., C.Y., C.J. and Y.L.; visualization, J.W.; writing—original draft, T.X.; writing—review and editing, X.H. and X.Z. All authors have read and agreed to the published version of the manuscript.

Funding

This work was supported in part by the National Natural Science Foundation of China under Grant 12003033 and Grant 61875190.

Institutional Review Board Statement

Not applicable.

Informed Consent Statement

Not applicable.

Data Availability Statement

The study did not report any data.

Conflicts of Interest

The authors declare no conflict of interest.

References

  1. Werner, M. The Spitzer Space Telescope. Opt. Eng. 2012, 51, 7. [Google Scholar] [CrossRef]
  2. Feinberg, L.; Cohen, L.; Dean, B.; Hayden, W.; Howard, J.; Keski-Kuha, R. Space telescope design considerations. Opt. Eng. 2012, 51, 9. [Google Scholar] [CrossRef]
  3. Fan, K.; Luo, J.; He, X.; Li, C.H.; Zhang, X.H. The Measurement of PSF Ellipticity of an Unobstructed Off-Axis Space Telescope: Error Analysis. IEEE Access 2021, 9, 120730–120743. [Google Scholar] [CrossRef]
  4. An, M.X.; Zhang, L.H.; Xu, S.Y.; Dong, J.H. Design, analysis, and testing of kinematic mount for astronomical observation instrument used in space camera. Rev. Sci. Instrum. 2016, 87, 9. [Google Scholar] [CrossRef]
  5. Kunt, C.O.; Johnston, J.; Bartoszyk, A.; Hendricks, S. Development and sizing of the JWST integrated science instrument module (ISIM) metering structure. Proc. SPIE 2006, 6273, 627322. [Google Scholar]
  6. Acton, D.S.; Coppock, E.; Wells, C.; Knight, J.S.; Chonis, T.S.; Coyle, L.E.; Smith, K.; Lajoie, C.-P.; Perrin, M.D.; Hadaway, J.B. Wavefront sensing and controls demo during the cryo-vac testing of JWST. Proc. SPIE 2018, 10698, 106983p. [Google Scholar]
  7. Irvin, R.; Rohrbach, S.O.; Seals, L.; Skelton, D.L. Optomechanical modeling of the Optical Telescope Element and Integrated Science Instrument Module (OTIS) cryo-vacuum test for the James Webb Space Telescope (JWST). Proc. SPIE 2018, 10698, 1069806. [Google Scholar]
  8. Kimble, R.A.; Davila, P.S.; Diaz, C.E.; Feinberg, L.D.; Glazer, S.D.; Jones, G.S.; Marsh, J.M.; Matthews, G.W.; McGuffey, D.B.; O’Rear, P.H.; et al. The integration and test program of the James Webb Space Telescope. Proc. SPIE 2012, 8442, 84422K. [Google Scholar]
  9. Kimble, R.A.; Feinberg, L.D.; Voyton, M.F.; Lander, J.A.; Knight, J.S.; Waldman, M.; Whitman, T.; Costas, M.B.V.; Reis, C.A.; Yang, K. James Webb Space Telescope (JWST) optical telescope element and integrated science instrument module (OTIS) cryogenic test program and results. Proc. SPIE 2018, 10698, 1069805. [Google Scholar]
  10. Klaassen, P.D.; Geers, V.C.; Beard, S.M.; O’Brien, A.D.; Cossou, C.; Gastaud, R.; Coulais, A.; Schreiber, J.; Kavanagh, P.J.; Topinka, M.; et al. MIRISIM: A simulator for the Mid-Infrared Instrument on JWST. Mon. Not. Roy. Astron. Soc. 2021, 500, 2813–2821. [Google Scholar] [CrossRef]
  11. Lightsey, P.A.; Atkinson, C.; Clampin, M.; Feinberg, L.D. James Webb Space Telescope: Large deployable cryogenic telescope in space. Opt. Eng. 2012, 51, 19. [Google Scholar] [CrossRef] [Green Version]
  12. Lunt, S.R.; Wells, C.; Rhodes, D.; DiAntonio, A. Use of close range photogrammetry in James Webb Space Telescope alignment testing under cryogenic conditions. J. Astron. Telesc. Instrum. Syst. 2020, 6, 20. [Google Scholar] [CrossRef]
  13. Matthews, G.; Scorse, T.; Kennard, S.; Spina, J.; Whitman, T.; Texter, S.; Atkinson, C.; Young, G.; Keski-Kuha, R.; Marsh, J.; et al. JWST Telescope Integration and Test Status. Proc. SPIE 2014, 9143, 914305. [Google Scholar]
  14. Mitchell, J.; Spence, A.; Hoang, M.; Free, A. Sensor fusion of laser trackers for use in large-scale precision metrology. Proc. SPIE 2004, 5263, 57–65. [Google Scholar]
  15. Predmore, C.R. Bundle adjustment of multi-position measurements using the Mahalanobis distance. Precis. Eng. 2010, 34, 113–123. [Google Scholar] [CrossRef]
  16. Zhao, G.; Zhang, C.; Jing, X.; Sun, Z.; Zhang, Y.; Luo, M. Station-transfer measurement accuracy improvement of laser tracker based on photogrammetry. Measurement 2016, 94, 717–725. [Google Scholar] [CrossRef]
  17. Liu, W.L.; Li, Y.W. A novel method for improving the accuracy of coordinate transformation in multiple measurement systems. Meas. Sci. Technol. 2017, 28, 10. [Google Scholar] [CrossRef]
  18. Wang, W.; Guo, J.Y.; Tao, L.; Liu, H.M. A New Method of Spacecraft Assembly Integration Alignment TestBased on Virtual Cubic Prism. In Proceedings of the 3rd International Conference on Information Science and Control Engineering (ICISCE), Beijing, China, 8–10 July 2016; pp. 77–82. [Google Scholar]
  19. Gong, D.; Wang, H.; Tian, T.Y. Computer-aided Alignment of off-axis three-mirror imaging spectrometer system. Proc. SPIE 2013, 8910, 89100Z. [Google Scholar]
  20. He, X.; Luo, J.; Wang, J.X.; Zhang, X.H.; Liu, Y.C. Improvement of a computer-aided alignment algorithm for the nonsymmetric off-axis reflective telescope. Appl. Optics 2021, 60, 2127–2140. [Google Scholar] [CrossRef]
  21. Hvisc, A.M.; Burge, J.H. Alignment analysis of four-mirror spherical aberration correctors. Proc. SPIE 2008, 7018, 1819. [Google Scholar]
  22. Zhao, X.T.; Jiao, W.C.; Liao, Z.B.; Wang, Y.; Chen, J.Y. Study on computer-aided alignment method of a three-mirror off-axis aspherical optical system. Proc. SPIE 2010, 7656, 76566. [Google Scholar]
  23. Engel, C.; Liotard, A.; Michau, V.; Engel, C.; Ferrari, M.; Hugot, E.; Escolle, C.; Bonnefois, A.; Bernot, M.; Bret-Dibat, T.; et al. The Lam Space Active Optics Facility. Proc. SPIE 2017, 10563, 105632X. [Google Scholar]
  24. Wang, F.; Li, H.; Yang, F. Ability of the Thin Mirror Active Optics to Correct Optical Astigmation. Acta Photonica Sinica 2010, 39, 871–875. [Google Scholar] [CrossRef]
  25. Sun, Y.; Wang, K.; Wang, W.; Zhou, P.; Gu, Z.; Dong, J.; Xu, S. Active optics system prototype applied on a passive large aperture off-axis LEO space telescope. Opt. Eng. 2018, 57, 8. [Google Scholar] [CrossRef]
  26. Guan, X.; Xu, Y.M.; Xing, C. A Method for Rapid Measurement of the Deformation and Spatial Attitude of Large Radar Antennas Inside Radomes. IEEE Access 2021, 9, 64686–64695. [Google Scholar] [CrossRef]
  27. Liao, T.T. Modeling and analysis of laser shaft alignment using 4 × 4 homogeneous coordinate transformation matrix. Measurement 2009, 42, 157–163. [Google Scholar] [CrossRef]
  28. Lou, Y.M.; Hu, J.M. Coordinate transformation of three-dimensional image in integral imaging system illuminated by a point light source. Optik 2021, 226, 7. [Google Scholar] [CrossRef]
  29. Shi, Z.; Zhao, W.G.; Yang, L.B.; Xun, Y.; Li, Q.Y.; Zhang, Y.Y. Research and Experiment of Repairable Space Telescope Interface System. IEEE Access 2020, 8, 225097–225108. [Google Scholar] [CrossRef]
  30. Yang, Z.; Shen, Y.; Deng, Y.; Li, C. Rapid cubic prism collimation and attitude measurement method based on laser tracker. Infrared Laser Eng. 2018, 47, 1017001. [Google Scholar] [CrossRef]
Figure 1. A typical model of an off-axis space telescope truss structure.
Applsci 12 05562 g001
Figure 2. Definition of the measurement coordinate system.
Applsci 12 05562 g002
Figure 3. Coordinate system transfer relations.
Applsci 12 05562 g003
Figure 4. Datum alignment of theodolite and laser tracker: (a) principle of cubic prism to create mirror vectors; (b) alignment of the cubic prism coordinate system with the datum platform coordinate system.
Applsci 12 05562 g004
Figure 5. Datum alignment of the laser tracker and photogrammetry system.
Applsci 12 05562 g005
Figure 6. The error in the establishment of the cubic prism vector as a function of the length of the reflected ray. (a) error curve for incident ray at 1 m; (b) error curve for incident ray at 2 m; (c) error curve for incident ray at 4 m.
Applsci 12 05562 g006
Figure 7. Simulation of angular errors in the establishment of a multi-source data datum alignment coordinate system. (a) probability distribution curve of the angular error in the X-axis. (b) probability distribution curve of the angular error in the Y-axis. (c) probability distribution curve of the angular error in the Z-axis.
Applsci 12 05562 g007
Figure 8. The effect of a single error on transmission accuracy: (a) theodolite collimation error; (b) laser tracker collimation error; (c) laser tracker reflective target sphere manufacturing eccentricity error; (d) cubic prism coordinate system establishment error.
Applsci 12 05562 g008
Figure 9. Distribution of rotation angle simulation values: (ac) corresponds to (1); (df) corresponds to (2); and (gi) corresponds to (3).
Applsci 12 05562 g009aApplsci 12 05562 g009b
Figure 10. Diagram of theodolite angle intersection measurement.
Applsci 12 05562 g010
Figure 11. Diagram of laser tracker coordinate acquisition.
Applsci 12 05562 g011
Figure 12. Diagram of the photogrammetric coordinate acquisition. (a) distribution of camera angle positions; (b) distribution of camera height positions.
Applsci 12 05562 g012
Figure 13. Coordinate system transfer method.
Applsci 12 05562 g013
Figure 14. The experimental site. (Due to the protection of intellectual property rights, we are reluctant to release specific design details of the truss structure at this time.).
Applsci 12 05562 g014
Figure 15. Experimental flow diagram.
Applsci 12 05562 g015
Figure 16. The rotation angles of the truss structure in XYZ directions are measured by two kinds of instruments: (ac) corresponds to (1); (df) corresponds to (2); (gi) corresponds to (3).
Applsci 12 05562 g016aApplsci 12 05562 g016b
Figure 17. Deviation of rotation angle measured by theodolite and laser tracker relative to photogrammetry: (a) corresponds to (1); (b) corresponds to (2); (c) corresponds to (3).
Applsci 12 05562 g017
Table 1. Off-axis triple-reverse optical system sensitivity matrix A.
ReflectorDxDyDzTxTy
M10.57611.3374.38153.6192.55
M20.39551.3248.98227.357.531
M30.0233−0.0145−0.090811.781.474
Table 2. M2 wave aberration and mounting tolerance requirements.
ProjectsDxDyDzTxTy
RMS (λ)0.0010.0040.0010.0080.003
Tolerance requirements ±0.01 mm±0.07 mm±0.001 mm±2″±2″
Table 3. Simulated theoretical values.
Angular RelationshipsSymbolsTheoretical Value
Cubic prism 1 [ α 1 , β 1 , γ 1 ] [ 0 ° , 0 ° , 0 ° ]
Cubic prism 2 [ α 2 , β 2 , γ 2 ] [ 0 ° , 0 ° , 0 ° ]
Cubic prism 3 [ α 3 , β 3 , γ 3 ] [ 39.7452 ° , 33.0246 ° , 82.2410 ° ]
OO to OB [ α O B , β O B , γ O B ] [ 0 ° , 0 ° , 0 ° ]
OB to OS [ α B S , β B S , γ B S ] [ 5.4651 ° , 0 ° , 0 ° ]
OCO to OCB [ α 12 , β 12 , γ 12 ] [ 0 ° , 0 ° , 0 ° ]
OCB to OCS [ α 23 , β 23 , γ 23 ] [ 43.2448 ° , 35.2348 ° , 82.0328 ° ]
Table 4. Datum transfer error estimation and assignment.
InstrumentSources of Errorμ
TheodoliteCollimation error0 Δ c = ± 1
Cubic prism introduces error0 Δ c p = ± 4
Cubic prism goniometric error0 Δ g = ± 3.5
Mutual aiming error0-
Focusing error0-
Laser trackerDistance measurement error0 Δ d = ± 5.5
Reflector manufacturing errors0 Δ r = ± 1.7
PhotogrammetryCoordinate point measurement error0 Δ ph 30 μ m
Coordinate system errorsCubic prism coordinate system error0 Δ tl = ± 3
Datum alignment error0 Δ lp = ± 6
Table 5. Cubic prism mounting angle.
Angular RelationshipsSymbolsTheoretical Value
cubic prism 1 [ α 1 , β 1 , γ 1 ] [ 0.0198 ° , 0.0903 ° , 0.7164 ° ]
cubic prism 2 [ α 2 , β 2 , γ 2 ] [ 0.0220 ° , 0.2857 ° , 0.0536 ° ]
cubic prism 3 [ α 3 , β 3 , γ 3 ] [ 39.6879 ° , 32.3428 ° , 83.0320 ° ]
Publisher’s Note: MDPI stays neutral with regard to jurisdictional claims in published maps and institutional affiliations.

