
Infrared Dim and Small Target Detection Based on the Improved Tensor Nuclear Norm

1
School of Electrical Electronics and Computer Science, Guangxi University of Science and Technology, Liuzhou 545006, China
2
School of Microelectronics and Materials Engineering, Guangxi University of Science and Technology, Liuzhou 545006, China
3
Institute of Optics and Electronics, Chinese Academy of Sciences, Chengdu 610209, China
*
Author to whom correspondence should be addressed.
Appl. Sci. 2022, 12(11), 5570; https://doi.org/10.3390/app12115570
Submission received: 27 April 2022
/
Revised: 24 May 2022
/
Accepted: 27 May 2022
/
Published: 30 May 2022
(This article belongs to the Special Issue Structured Sparse Signal Processing for Infrared and Terahertz Systems)
Abstract
:In the face of complex scenes with strong edge contours and high levels of noise, suppressing edge contours and noise levels is challenging with infrared dim and small target detection algorithms. Many advanced algorithms suffer from high false alarm rates when facing this problem. To solve this, a new anisotropic background feature weight function based on the infrared patch tensor (IPT) model was developed in this study to characterize the background airspace difference features by effectively combining the local features with the global features to suppress the strong edge contours in the structural tensor. Secondly, to enhance the target energy in the a priori model, an improved high-order cumulative model was proposed to establish the local significance region of the target as a way to achieve energy enhancement of the significant target in the structural tensor. Finally, the energy-enhanced structural tensor was introduced into the partial sum of the sensor nuclear norm (PSTNN) model as a local feature information weight matrix; the detection results were obtained by solving the model with the help of ADMM. A series of experiments show that the algorithm in this paper achieves better detection results compared with other algorithms.
1. Introduction
The dim and small target detection algorithm is widely used in the military for guidance, e.g., regarding anti-missiles and early warning operations. It is also widely used in civilian fields, such as medical cancer detection, astronomical observations, and space debris monitoring. At present, target points with no fixed texture or shape features in an image, an SNR below 5 dm, and a target scale size between 2 × 2 and 9 × 9 are known as dim and small targets [1]. Because of the above characteristics of dim and small targets, in the detection process, the algorithm has difficulty distinguishing the noise and clutter in the background of the infrared image from the target, giving the final detection results a high false alarm rate. Therefore, further research on dim and small target detection algorithms is of great importance.
In recent years, domestic and foreign scholars have conducted a series of studies on dim and small target detection algorithms; these can be divided into three main types: those based on traditional spatiotemporal filtering, those based on neural networks, and those based on the low rank and sparse theory. Representative algorithms of traditional filtering methods are top-hat filtering [2,3], two-dimensional least mean square filtering [4,5], and anisotropic diffusion filtering [6,7]. The top-hat algorithm is mainly used to obtain the target image by opening and closing the original image through the structural element. Many scholars have made a series of improvements to the structural elements to achieve good results. Bai [2] used different information from the target and neighborhood to build two related structural elements to improve top-hat filtering. Deng [3] suppressed the background information in the image with the help of adaptive ring structure elements and enhanced the target signal by local entropy. The top-hat algorithm can effectively suppress the effect of impulse noise on the detection effect in the process of target detection, but this type of algorithm causes the loss of the target signal contour when the opening and closing operations are performed by the structural elements. The two-dimensional least mean square filtering algorithm mainly uses information from the image neighborhood range to obtain the prediction value; it then traverses the whole image to obtain the prediction image by adaptively updating the prediction value through the error between the prediction value and the real value. Finally, it generates a target image showing the difference between the original image and the prediction image. Cao [4] employed pairs of neighborhood information in four directions to obtain the predicted values. Li [5] used the master view method on this basis and took the domain information in eight directions to predict the central image element information. This method avoids the influence of TDMLS anisotropy on the detection results and improves the detection effect, but this type of algorithm has difficulty making accurate predictions about non-smooth backgrounds, resulting in an unsatisfactory detection effect. The anisotropic filtering algorithm uses the difference in gradients between the target image element and the background image in each direction to model the background through a diffusion function. Fan [6] improved the diffusion function based on the traditional anisotropic filtering algorithm and combined it with the idea of high-order energy accumulation, leading to an increase in the target point energy. Based on further improvement of the diffusion function, Li [7] established a new search pipe diameter weight function; the combination of the anisotropy algorithm and pipe filtering algorithm was shown to achieve a better detection effect in the case of a large background span, but in a large edge contour area block, the background of the gradient difference in each direction has a small difference, so the detection effect is not ideal. The traditional filtering method only uses the local feature information of the target to predict the background or highlight information by filtering without using the global properties of the image, so the false alarm rate of the detection effect is often high under complex and variable scenes.
Numerous scholars have explored the regularity of the distribution of dim and small targets and used the ability of neural networks to approximate any function to apply neural networks to dim and small target detection. Zhao [8] constructed GAN models based on U-net networks to learn the features of dim and small targets, predict the target intensity, and obtain better detection results. Qian [9] integrated the guiding image filter and convolutional neural network into particle filtering. The guiding image filter was shown to effectively retain the edge characteristics of the image; the convolutional neural network was able to effectively extract the target features, while the particle filtering algorithm could retain the sample information to produce a good detection effect. However, this type of algorithm requires a large number of samples to train the detection model to obtain good detection results, and because the target does not have a fixed shape and texture characteristics, the actual scene is also complex and variable. Thus, often, models pre-trained for the actual application of the results are not ideal.
In recent years, infrared dim and small target detection based on the low-rank and sparse theory has received significant attention. The method considers global information about the target and background and divides the original image into three parts: the low-rank background image, sparse target image, and noise signal. The expression of this theoretical model is:
where , , , represent the original image, the target image, the background image, and the noise signal, respectively. Based on the low-rank and sparse theory, Gao [10] conducted an analysis to obtain the characteristics of the local block image of the background image and the approximate linear correlation of the block image. The original image was transformed into a block matrix through a sliding window, and the IPI model was obtained. The model expression is as follows:
where , , , denote the original block image, background block image, target block image, and noise block image, respectively.
Based on the IPI model, many scholars have improved the model to achieve better results [11,12,13,14,15]. Wang [12] proposed a full-variance principal component tracking model based on the IPI model by using full variance to constrain the model, which achieved better detection results in scenes with few edge contours. Zhang [13] achieved better detection results through the construction of a new dim and small target detection model that combines the L1 and L2 norms to address the problem of leaving background residuals in the target image due to the defects of the nuclear norm and the L1 norm. Based on the IPI model, Zhang [14] transformed the NP-hard problem into a convex optimization problem by strengthening the constraints on the target image through the norm while reducing the constraints on the background image to obtain better detection results. Although many scholars have improved the IPI model, in scenes containing many complex edge contours, there are still some contours in the background image that remain in the sparse target image, resulting in a high final false alarm rate. To solve the above problem, some scholars have extended the IPI model to the tensor domain. Dai [16] proposed a robust infrared patch tensor model (RIPT) with a combination of the local prior and nonlocal prior before transforming the target and background image separation problem into a weighted robust tensor recovery problem. Zhang [17] proposed a new non-convex low-rank constraint based on the IPT model by combining the tensor nuclear norm part with the L1 norm to effectively suppress the background images. Xie [18] replaced the traditional nuclear norm with a weighted Schatten p-norm (WSN) based on a two-dimensional low-rank and sparse model to obtain each low-rank component more accurately. This model can better achieve the low-rank assumption of the original image. Sun [19] introduced the weighted Schatten p-norm number (WSN) into the IPT model on this basis to achieve the deep mining of partial information in the time domain relative to the two-dimensional low-rank and sparse models. Sun [20] combined multi-subspace learning with IPT to better preserve the low-rank components in the original image compared with the traditional IPT model. Although many scholars have improved the IPT model, the recovery results of sparse components are still unsatisfactory due to the large target contours and energy loss in the case of highly nonuniform cases or images with many edge contours in the background.
To solve the problems associated with infrared dim and small target detection—by separating target and background images from highly nonuniform and contour-rich scenes and enhancing the target confidence—this paper proposes an infrared dim and small target detection method based on the improvement of the a priori tensor nuclear norm of local background features. The main contributions of this paper are as follows:
First, to deeply explore the local prior information of the image, this paper improves the traditional local prior model and introduces the improved prior model as a weight matrix into the infrared dim and small target detection model to obtain better detection results.
Second, to effectively suppress backgrounds with more edge contours, this paper establishes a new anisotropic background feature weight function to effectively characterize the background features of the prior model and avoid the influence of edge contours in the prior model on target detection.
Third, to enhance the prior information of local features, this paper constructs an improved high-order cumulative model to build the local significance region of the target, which effectively enhances the significance target in the structure tensor.
2. Singular Value Decomposition of a Tensor
The expression for the tensor singular value decomposition is
where denotes the original tensor, and are both orthogonal tensors, and is the F-diagonal tensor. The schematic diagram of the singular value decomposition of the third-order tensor is shown in Figure 1.
The above procedure for calculating the third-order tensor singular value decomposition is shown in Algorithm 1. Based on , some scholars have defined the number of tube fibers with non-zero as the tensor tubal rank of the tensor [21], whose expression is .
| Algorithm 1: T-SVD for tensor . |
Input |
1. Compute |
2. compute each frontal slice of , and from as follows: |
For do |
end for |
3. Compute |
4. Compute |
5. Compute |
Output T-SVD components , , and of |
3. Infrared Patch Tensor (IPT) Model
3.1. Model Construction Method
A three-dimensional tensor can better characterize the structural information in an image compared with a two-dimensional matrix to improve the detection capability of the infrared dim and small target algorithm and the robustness of the algorithm under different complex environments. Scholars have extended the IPI model from a two-dimensional matrix to a tensor domain, and the construction process of the tensor image is shown in Figure 2. To better mine the correlation information between image blocks, Dai [16] proposed an IPT model with the following expression.
where represent the input tensor image, the background tensor image, the target tensor image, and the noise tensor image, respectively.
3.2. Structural Tensor Description
The structure tensor is commonly used in image processing fields, such as feature extraction and corner point detection, to obtain the gradient directions in a specified neighborhood at a point as well as the degree of coherence of these directions. Compared with gradients, the structure tensor not only enables structural analysis and direction estimation of images but also obtains richer local structural features [22]. Suppose the original image is D, then the classical linear structure tensor is computed as:
where denotes a Gaussian kernel function with variance , ∗ denotes the convolution operation, ⊗ denotes the Kronecker product, ∇ denotes the gradient, denotes a Gaussian smoothing filter with variance on the original image, and denotes the gradient of in the (x,y) direction. The linear structure tensor is a positive definite symmetric. There are two non-negative eigenvalues of the structure tensor at each image element position in the image . For in the image, the two eigenvalues are calculated as follows [22]:
where ; when and are different cases, the local characteristics of the reflected image are also different; when , the image has a small change in the gray value around the point; when , the change in the image in the vertical direction is much smaller than the change in this direction, and the difference is significant, which is consistent with the characteristics of the edge; when , the image has a relatively large change in the gray value at the point, and there are two vertical directions, which are consistent with the characteristics of the corner point.
3.3. A Priori Model Construction Based on the Structural Tensor
The traditional infrared dim and small target detection algorithm can only process local feature information, ignoring the global information of the image, resulting in unsatisfactory background modeling and target extraction. The infrared dim and small target detection algorithm based on a low rank and sparse theory build the target and background models from the global information through the characteristics of the low rank in the background and the sparse theory in the target. The algorithm has better robustness, but in complex scenes, there are strong noise signals and edge contours; the strong noise signals and edges are also globally sparse, leading to a high signal-to-noise ratio in the final obtained target image. For different structure tensor situations under different local features, Dai [16] proposed a local feature extraction method to introduce local features as weights into the IPT model and a reweighted infrared block tensor (RIPT) model to realize the combination of local features and global features, where the local feature weights are calculated as follows:
where is the local structure weight, are the maximum and minimum values of , respectively, and h is a stretching parameter. The above local feature weights can only describe the background information and cannot describe the target information; Zhang [17] proposed a new local feature extraction method based on this to consider both the target signal and the background information where the structure weights are calculated as follows:
where denotes the position of the image element point in the image; is the corner point intensity function, which is used to describe the weight value function of the corner point feature information, as shown in Figure 3b; is the maximum feature value ; and it is used to describe the weight value function of the background feature information, as shown in Figure 3c. The final a priori weight value function is obtained by multiplying these two weight value functions together, as follows [17]:
where denotes the final a priori weight function, as shown in Figure 3d.
4. Construction of the a Priori Model in This Paper
In scenes with large edge contours in the background, the simple maximum cannot fully utilize the local feature information in the background, and the background contour region is not well suppressed. This study addresses the deficiencies in the literature [17] in terms of addressing situations with more edge contour backgrounds by establishing a new anisotropic background feature weight function to characterize the background space difference features as a way to achieve the suppression of edge contours in backgrounds of complex scenes and enhance the significant target features in the structure tensor by improving high-order accumulation. A new anisotropic background feature weight function is calculated as follows: for an image , the eigenvalue is calculated as . First, each anisotropy filter is applied to [7], and the calculation procedure is as follows:
K represents the feature value obtained by the calculation, is the gray value of the image element at position in the image, step is the step between image elements, and k is a constant. The mean value of the two largest numbers in is t. According to the above idea, we can obtain the values of after anisotropic filtering as , respectively, and the final weight function of the new background features is as follows:
is the minimum value of . This weight function is shown in Figure 4b; the target feature still uses the corner point intensity function to describe it, and the final improved a priori weight function is obtained as:
This weight function is shown in Figure 4d.
Finally, the weights W are normalized, and the normalization formula is [17]:
where denotes the gray value of the image element at position of the weighted image and are the maximum and minimum gray values of the weighted image , respectively. Comparing Figure 3 above with Figure 4, we can see that the a priori model proposed by Zhang et al. to describe the background feature information is not ideal for strong edge contour suppression in complex scenes due to the simple operation of taking the maximum value [17], and there is still a large amount of edge information in the final weight map. In contrast, the algorithm proposed in this paper combines the traditional spatiotemporal filtering idea with anisotropic filtering to describe the background information and it achieves a better suppression effect on the edge contour in the original image. However, because the background image description is obtained as the minimum value of after anisotropic filtering, this leads to a loss of energy for the target point in the final weight image. Thus, when constructing the block tensor from the weight matrix W to enhance the energy strength of the target point in the a priori model, this study combined the idea of regional saliency [23,24] and high-order accumulation to enhance the target energy [25]. As shown in Figure 4, since there is still a small amount of noise and part of the edge contour region in the weight image, the direct use of high-order accumulation for energy enhancement will result in the enhancement of a small amount of noise and a small edge contour region in the weight matrix. Thus, we propose an improved high-order accumulation model to establish the local significance region of the target as a judge of whether the region is energy-enhanced or not, and the judgment basis is calculated as shown below:
where represents the similarity between the cur frontal slice and the cur + 1 frontal slice of tensor ,and r represents the cur frontal slice and the cur + 1 frontal slice of tensor . The above equation shows that when the similarity between the frontal slice and the slice of the tensor is high, there is a visually redundant area, i.e., the two slices may be empty or the background area may only have a small amount of low-energy noise and may also be a continuous edge contour area, which can be judged by setting a reasonable threshold to avoid the noise and edge contour energy from being enhanced during high-order accumulation.
The improved high-order accumulation enhancement model first creates block images by sliding a window for the weight matrix and then performs high-order accumulation after judging the level of similarity among the adjacent block images. The improved high-order accumulation target local significance region discrimination model is shown below:
where , M is the length of the cumulative block image and M = 3 in this paper; represents the cut frontal slice of tensor , represents the t block image representation when the tensor image is constructed by sliding window; represents the similarity between tensor blocks and blocks; and represents the set threshold value.
A previous study [17] proposed a reweighting strategy, where the next weight value is calculated from the current weight value, which greatly improves the accuracy and speed of the minimization problem for the norm. The RIPT model and the PSTNN model also use this strategy to speed up the convergence of the model in order to speed up the operation of the law. Therefore, in order to speed up the operation of the algorithm, our model also uses the reweighting strategy by increasing the sparse weights .
where denotes the target tensor in iteration k, and is a very small number to prevent the denominator from being 0. Combined with the local structural prior weights, the tensor form of the final weights obtained can be expressed by:
where ⊙ denotes the Hadamard product and denotes the reciprocal of all elements in tensor . In summary, the local prior model was constructed in this study, where the block tensor is the weight tensor.
5. Construction and Solution of the Infrared Dim and Small Target Detection Model
5.1. Construction of the Model
A previous study [17] obtained good detection results using the PSTNN to constrain the background part of the infrared image; the PSTNN was calculated as follows:
where denotes the frontal slice i of tensor after the Fourier transform. The infrared dim and small target detection model constructed was also used in this study, and the model is as follows [17]:
where ⊙ denotes the Hadamard product, and represents the original tensor block image, the background tensor block image, and the target tensor block image, respectively. The flow chart of the model is shown in Figure 5. During the operation of the algorithm, we learned that the number of sparse components in the target tensor block image does not change after several iterations, so two bases were used as the judgment conditions for stopping the iteration, representing a relative error of (, where is a given threshold) and .
5.2. Solving the Model
For convex optimization problems, the ADMM [26] algorithm is usually used to solve the model, and the detailed solution procedure of this model was referred to in a previous study [17]; the Lagrangian function of the above Equation (24) is:
where y denotes the Lagrangian multiplier, denotes the inner product of the tensor, denotes the inner product of the tensor, and denotes the penalty factor. The overall flow of the solution algorithm is shown in Algorithm 2.
| Algorithm 2: Flow chart of the algorithm solution. ADMM solver to the proposed model. |
Initialization: |
while not converge do |
1. update by |
2. Update by |
3. Update by |
4. Fix the others and update by Equations (20) and (21): |
5. Update by |
6. Check the convergence conditions: or |
7. Update |
end while |
Output |
6. Results and Analysis
In this section, in order to verify the superiority of this algorithm compared with other algorithms and the robustness of this algorithm in different scenes, the detection effect of this algorithm was compared with nine advanced algorithms in the field of dim and small target detection on six sequences of representative images; the dim and small target detection effect of this algorithm was analyzed in 16 different single-frame image scene experiments; the ROC curves of this algorithm and other algorithms on six sequences were drawn and analyzed.
6.1. Evaluation Indicators
In order to better compare the performance of this algorithm with that of other algorithms, some evaluation metrics commonly used in the field of infrared dim and small target detection were used in this study to objectively evaluate the performance of this algorithm in terms of background suppression, target energy enhancement, and noise cancellation. Two evaluation metrics, the background suppression factor (BSF) and the signal-to-noise ratio (SNR), were introduced in the paper. The BSF is mainly used to evaluate the effect of the background image predicted by the algorithm by identifying the difference between the image and the original image. The calculation formula is as follows:
where and are the mean squared differences between the input image and the difference image, respectively. The signal-to-noise ratio can be used to evaluate the contrast between the target and the noise energy obtained by the algorithm to verify the detection and background estimation effects of the algorithm, as follows:
where is the mean gray value of target region , is the mean gray value of the background region, and is the standard deviation of the gray value of the background region. The calculation results for the nine classical algorithms and the algorithm described in this paper for the three evaluation metrics in six scenes are shown in Table 1 and Table 2.
To further investigate the performance of these algorithms, ROC curves were plotted for six scenes, where the horizontal axis is the detection rate (Pd) and the vertical axis is the false alarm rate (Pf), as shown in Equation (25). NTDT is the number of real targets detected; NFDT is the number of false alarm targets detected; NT is the total number of real targets present in the image; NP is the total number of targets detected in the image.
6.2. Analysis of Single-Frame Detection Results
Since this paper proposed a single-frame detection algorithm, to verify that the algorithm is robust under different scenes, we used 16 different scenes to verify the robustness of the algorithm, and the experimental results are as follows. Figure 6 shows the original images of the 16 scenes; Figure 7 shows the detection results of the algorithm in 16 scenes and the difference graph of the detection results. From Figure 7, we can see that the algorithm presented in this paper has a good clutter suppression effect and shows good detection performance in different scenes.
6.3. Sequence Image Detection Experiments
In order to better demonstrate the performance of the algorithm in this paper, six sequences of infrared images were used. The backgrounds of the six sequences were complex, including grass, forest, bright road, clouds, buildings, etc. The target size was small, and there were no color information or fixed texture features [27]. These characteristics meet the application requirements for actual scenes, so the detection effect observed for these six sequences of scenes is of great practical significance. Representative images of the six scenes are shown in Figure 8; the specific descriptions are shown in Table 3.
In order to highlight the detection effect, we took out a frame in six sequences and compared the detection results for the algorithm presented in this paper with those of nine algorithms in terms of the absolute average difference weighted by cumulative directional derivatives (Aadcdd) [28], the generalized structure tensor(GST) [29], via the non-convex tensor fibered rank (VNTFR) [30], the facet kernel and random walker (FKRW) [31], the multiscale patch-based contrast measure (MPCM) [32], Anisotropy [33], the top-hat, the self-regularized weighted sparse (SRWS) [34], and the PSTNN. The detection results obtained without any processing and the three-dimensional plots of the detection results are shown in Figure 9, Figure 10, Figure 11, Figure 12, Figure 13, Figure 14 and Figure 15.
From the detection results, it can be seen that the Aadcdd algorithm obtains the weighting coefficients for the average absolute gray difference by accumulating the directional derivatives, which makes up for the high false alarm rate defect caused by the average absolute gray difference in the face of a high-intensity structural background; however, as shown in Figure 10, the algorithm still produces an unsatisfactory suppression effect for the background when there is a large area of highlighted contours in the background. The GST algorithm models the dim and small target by the second conjugate of the two-dimensional Gaussian. The GST algorithm models the dim and small target by the second symmetric derivative of the two-dimensional Gaussian, but the suppression effect is not satisfactory in the face of strong noise, as shown in Figure 10, Figure 11 and Figure 13. The VNTFR algorithm approximates the tensor fiber rank by tensor fiber kernel parametrization of the log operator based on the IPT model and suppresses the noise jointly with the hyperlocal variation and the PSTNN algorithm. The PSTNN algorithm is used as a non-convex approximation of the tensor rank by PSTN, but it can be seen from Figure 9, Figure 10, Figure 11, Figure 12, Figure 13 and Figure 14 that the background is not further suppressed by the two algorithms in the local prior, resulting in a small number of contours in the final target image when facing a strong edge contour background. The FKRW algorithm achieves clutter suppression and target enhancement by the local contrast descriptor (NLCD). The FKRW algorithm achieves clutter suppression and target enhancement by the local contrast descriptor (NLCD), but the effect of strong edge contour suppression by this descriptor is not satisfactory, as shown in Figure 10, Figure 11 and Figure 12. The top-hat, MPCM, and anisotropy algorithms are sensitive to noise and edges, resulting in a high false alarm rate in the final result. The SRWS algorithm constrains the sparse terms in the model using the overlapping edge information (OEI) in the background structure and then extracts the clutter by multiple subspaces. The SRWS algorithm constrains the sparse terms in the model using the background structure overlapping edge information (OEI) and then extracts the clutter through multiple subspaces, but the algorithm still cannot completely suppress it in the face of strong noise, as shown in (10), (11) and (13). As shown in (9)–(14), this paper suppresses the background in the a priori model based on the PSTNN algorithm and further enhances the target energy by combining the idea of high-order accumulation, which achieves better results compared with the remaining nine algorithms.
To quantitatively compare the effect of this paper’s algorithm with the remaining nine algorithms, the global signal-to-noise ratio and background suppression factor were used as evaluation indexes to evaluate the algorithm presented in this paper, and the results are shown in Table 1 and Table 2. The maximum values are marked in bold in the table; we can see that the algorithm presented in this paper has a great advantage in terms of the global signal-to-noise ratio and background suppression of the difference map in six sequences compared to the other nine algorithms.
In addition, the running speed of the algorithm is an important metric to evaluate the algorithm. The average single frame running time for all methods is shown in Table 4. From the table, we can see that compared with similar algorithms of VATF, SRWS, and PSTNN, the running speed of the proposed model in this paper is significantly reduced. Although the algorithm in this paper does not outperform the rest of the traditional spatiotemporal filtering algorithms in terms of running time, this drawback is acceptable in terms of overall performance.
To further compare the performance of the algorithm presented in this paper with the other nine algorithms, we used ROC curves; the ROC curves are shown in Figure 15 below.
As shown in Figure 15a–f, compared with the other nine algorithms, the algorithm presented in this paper still obtains a better target detection effect in terms of noise and edge contour suppression in the detection of sequence images based on the combination of the PSTNN model and the a priori model. As shown in Figure 15b–e, the anisotropic algorithm is unable to effectively separate the target and contours when performing background modeling in the face of the highlighted background contours, resulting in a lower detection rate. As shown in Figure 15f, the GST algorithm is unable to effectively detect the target point when the target point is submerged in the cloud layer, resulting in effective edge suppression when facing the junction edge of the cloud layer and the empty background at the same time. This leads to a high false alarm rate and a low detection rate in this scene. Figure 15a–f show that the algorithm presented in this paper allows a high rate of detection when there is a lower false alarm rate; compared with other algorithms, the detection rate of this algorithm is the highest in all six sequential scenes with the same false alarm rate. In summary, the algorithm presented in this paper has high levels of robustness and stability.
7. Summary
To reduce the interference caused by the strong edge contour background and the high level of noise present in the process of infrared dim and small target detection, the model presented in this paper further processed the structure tensor information based on the IPT model, combining local features with global features. This was done by establishing a new anisotropic background feature weight function to describe the background feature information, achieving the suppression of strong edge contours in the structure tensor. Secondly, an improved high-order cumulative target local saliency region discrimination model was proposed to perform energy enhancement on the saliency targets in the structure tensor; finally, energy enhanced structure tensor information was introduced into the PSTNN model as a weight matrix for decomposition to obtain the final target signal. Through experimental verification, the signal-to-noise ratio and background suppression factor of the algorithm in this paper are above 14 and 424, respectively, in different scenes; it is known by the ROC curve that the detection rate of the algorithm in this paper reaches 1 after the false alarm rate of 0.3 in six scenes. Compared with other advanced algorithms, the algorithm in this paper outperforms other algorithms in all three evaluation indexes, so the algorithm in this paper is effective.
Author Contributions
Conceptualization, A.W. and X.F.; methodology, A.W., X.F. and Q.H.; software, A.W., X.F. and Q.H.; validation, A.W.; formal analysis, A.W., H.C., X.F. and Q.H.; investigation, A.W., X.F. and Q.H.; resources, X.F. and Q.H.; data curation, A.W.; writing—original draft preparation, A.W. and X.F.; writing—review and editing, A.W., X.F., H.C., Q.H. and Z.X. All authors have read and agreed to the published version of the manuscript.
Funding
This work was partially supported by the National Natural Science Foundation of China under grant 62001129, the Guangxi Natural Science Foundation (2021GXNSFBA075029), the National Natural Science Foundation of China under grant 12174076, and the Guangxi Natural Science Foundation (2021GXNSFDA196001).
Data Availability Statement
Infrared raw images from https://doi.org/10.11922/sciencedb.902, accessed on 26 April 2022.
Conflicts of Interest
The authors declare no conflict of interest.
Abbreviations
The following abbreviations are used in this manuscript:
| Aadcdd | absolute average difference weighted by cumulative directional derivatives |
| GST | Generalized-structure-tensor |
| VNTFR | via non-convex tensor fibered rank |
| FKRW | facet kernel and random walker |
| MPCM | multiscale patch-based contrast measure |
| SRWS | self-regularized weighted sparse |
| PSTNN | partial sum of the tensor nuclear norm |
References
- Bo, L.; Bo, W.; Sun, G.; Yin, X.; Pu, H.; Liu, C.; Song, Y. A fast detection method for small weak infrared target in complex background. Proc. Spie 2016, 30, 100301V. [Google Scholar]
- Bai, X.; Zhou, F. Analysis of new top-hat transformation and the application for infrared dim small target detection. Pattern Recognit. 2010, 43, 2145–2156. [Google Scholar] [CrossRef]
- Deng, L.; Zhang, J.; Xu, G.; Zhu, H. Infrared small target detection via adaptive M-estimator ring top-hat transformation. Pattern Recognit. 2020, 112, 107729. [Google Scholar] [CrossRef]
- Cao, Y.; Liu, R.M.; Yang, J. Small Target Detection Using Two-Dimensional Least Mean Square (TDLMS) Filter Based on Neighborhood Analysis. Int. J. Infrared Millim. Waves 2008, 29, 188–200. [Google Scholar] [CrossRef]
- Li, H.; Wang, Q.; Wang, H.; Yang, W.K. Infrared small target detection using tensor based least mean square. Comput. Electr. Eng. 2021, 91, 106994. [Google Scholar] [CrossRef]
- Fan, X.; Xu, Z.; Zhang, J.; Huang, Y.; Peng, Z. Dim small targets detection based on self-adaptive caliber temporal-spatial filtering. Infrared Phys. Technol. 2017, 85, 465–477. [Google Scholar] [CrossRef]
- Li, J.; Fan, X.; Chen, H.; Li, B.; Min, L.; Xu, Z. Dim and Small Target Detection Based on Improved Spatio-Temporal Filtering. IEEE Photonics J. 2022, 14, 1–11. [Google Scholar] [CrossRef]
- Zhao, B.; Wang, C.; Fu, Q.; Han, Z. A Novel Pattern for Infrared Small Target Detection with Generative Adversarial Network. IEEE Trans. Geosci. Remote Sens. 2021, 59, 4481–4492. [Google Scholar] [CrossRef]
- Qian, K.; Zhou, H.; Qin, H.; Rong, S.; Zhao, D.; Du, J. Guided filter and convolutional network based tracking for infrared dim moving target. Infrared Phys. Technol. 2017, 85, 431–442. [Google Scholar] [CrossRef]
- Gao, C.; Meng, D.; Yang, Y.; Wang, Y.; Zhou, X.; Hauptmann, A.G. Infrared Patch-Image Model for Small Target Detection in a Single Image. IEEE Trans. Image Process. 2013, 22, 4996–5009. [Google Scholar] [CrossRef]
- Wang, X.; Peng, Z.; Zhang, P.; He, Y. Infrared Small Target Detection via Nonnegativity-Constrained Variational Mode Decomposition. IEEE Geoence Remote Sens. Lett. 2017, 14, 1700–1704. [Google Scholar] [CrossRef]
- Wang, X.; Peng, Z.; Kong, D.; Zhang, P.; He, Y. Infrared dim target detection based on total variation regularization and principal component pursuit. Image Vis. Comput. 2017, 63, 1–9. [Google Scholar] [CrossRef]
- Zhang, L.; Peng, L.; Zhang, T.; Cao, S.; Peng, Z. Infrared Small Target Detection via Non-Convex Rank Approximation Minimization Joint l2,1 Norm. Remote Sens. 2018, 10, 1821. [Google Scholar] [CrossRef] [Green Version]
- Zhang, T.; Wu, H.; Liu, Y.; Peng, L.; Yang, C.; Peng, Z. Infrared Small Target Detection Based on Non-Convex Optimization with Lp-Norm Constraint. Remote Sens. 2019, 11, 559. [Google Scholar] [CrossRef] [Green Version]
- Wu, A.; Fan, X.; Chen, H.; Min, L.; Xu, Z. Infrared Dim and Small Target Detection Algorithm Combining Multiway Gradient Regularized Principal Component Decomposition Model. IEEE Access 2022, 10, 36057–36072. [Google Scholar] [CrossRef]
- Dai, Y.; Wu, Y. Reweighted Infrared Patch-Tensor Model With Both Nonlocal and Local Priors for Single-Frame Small Target Detection. IEEE J. Sel. Top. Appl. Earth Obs. Remote Sens. 2017, 10, 3752–3767. [Google Scholar] [CrossRef] [Green Version]
- Zhang, L.; Peng, Z. Infrared Small Target Detection Based on Partial Sum of the Tensor Nuclear Norm. Remote Sens. 2019, 11, 382. [Google Scholar] [CrossRef] [Green Version]
- Xie, Y.; Qu, Y.; Tao, D.; Wu, W.; Yuan, Q.; Zhang, W. Hyperspectral Image Restoration via Iteratively Regularized Weighted Schatten p-Norm Minimization. IEEE Trans. Geosci. Remote Sens. 2016, 54, 4642–4659. [Google Scholar] [CrossRef]
- Sun, Y.; Yang, J.; Li, M.; An, W. Infrared Small Target Detection via Spatial-Temporal Infrared Patch-Tensor Model and Weighted Schatten p-norm Minimization. Infrared Phys. Technol. 2019, 102, 103050. [Google Scholar] [CrossRef]
- Sun, Y.; Yang, J.; An, W. Infrared Dim and Small Target Detection via Multiple Subspace Learning and Spatial-Temporal Patch-Tensor Model. IEEE Trans. Geosci. Remote Sens. 2020, 59, 3737–3752. [Google Scholar] [CrossRef]
- Zhang, Z.; Ely, G.; Aeron, S.; Hao, N.; Kilmer, M. Novel methods for multilinear data completion and de-noising based on tensor-SVD. In Proceedings of the IEEE Conference on Computer Vision and Pattern Recognition, Columbus, OH, USA, 23–28 June 2014. [Google Scholar]
- Gao, J.; Guo, Y.; Lin, Z.; Wei, A.; Li, J. Robust Infrared Small Target Detection Using Multiscale Gray and Variance Difference Measures. IEEE J. Sel. Top. Appl. Earth Obs. Remote Sens. 2018, 11, 5039–5052. [Google Scholar] [CrossRef]
- Deng, H.; Liu, J.; Chen, Z. Infrared small target detection based on modified local entropy and EMD. Chin. Opt. Lett. 2010, 8, 24–28. [Google Scholar] [CrossRef] [Green Version]
- Buades, A.; Coll, B.; Morel, J.M. A non-local algorithm for image denoising. In Proceedings of the IEEE Computer Society Conference on Computer Vision and Pattern Recognition (CVPR 2005), San Diego, CA, USA, 20–25 June 2005. [Google Scholar]
- Fan, X.; Xu, Z.; Zhang, J.; Huang, Y.; Peng, Z.; Wei, Z.; Guo, H. Dim small target detection based on high-order cumulant of motion estimation. Infrared Phys. Technol. 2019, 99, 86–101. [Google Scholar] [CrossRef]
- Boyd, S.; Parikh, N.; Chu, E.; Peleato, B.; Eckstein, J. Distributed Optimization and Statistical Learning via the Alternating Direction Method of Multipliers. Found. Trends Mach. Learn. 2010, 3, 1–122. [Google Scholar] [CrossRef]
- Hui, B.W.; Song, Z.Y.; Fan, H.Q. A dataset for infrared image dim-small aircraft target detection and tracking under ground/air background. Sci. Data Bank 2019. [Google Scholar] [CrossRef]
- Aghaziyarati, S.; Moradi, S.; Talebi, H. Small infrared target detection using absolute average difference weighted by cumulative directional derivatives. Infrared Phys. Technol. 2019, 101, 78–87. [Google Scholar] [CrossRef]
- Gao, C.Q.; Tian, J.W.; Wang, P. Generalised-structure-tensor-based infrared small target detection. Electron. Lett. 2008, 44, 1349–1351. [Google Scholar] [CrossRef]
- Kong, X.; Yang, C.; Cao, S.; Li, C.; Peng, Z. Infrared Small Target Detection via Nonconvex Tensor Fibered Rank Approximation. IEEE Trans. Geosci. Remote Sens. 2022, 60, 1–21. [Google Scholar] [CrossRef]
- Qin, Y.; Bruzzone, L.; Gao, C.; Li, B. Infrared Small Target Detection Based on Facet Kernel and Random Walker. IEEE Trans. Geosci. Remote Sens. 2019, 57, 7104–7118. [Google Scholar] [CrossRef]
- Wei, Y.; You, X.; Li, H. Multiscale patch-based contrast measure for small infrared target detection. Pattern Recognit. 2016, 58, 216–226. [Google Scholar] [CrossRef]
- Perona, P.; Malik, J. Scale-space and edge detection using anisotropic diffusion. IEEE Trans. Pattern Anal. Mach. Intell. 2002, 12, 629–639. [Google Scholar] [CrossRef] [Green Version]
- Tz, A.; Zp, A.; Hao, W.A.; Yh, A.; Cl, B.; Cy, A. Infrared small target detection via self-regularized weighted sparse model. Neurocomputing 2021, 420, 124–148. [Google Scholar]
Figure 1.
Schematic diagram of the singular value decomposition of the third-order tensor.

Figure 2.
Infrared tensor image construction process.
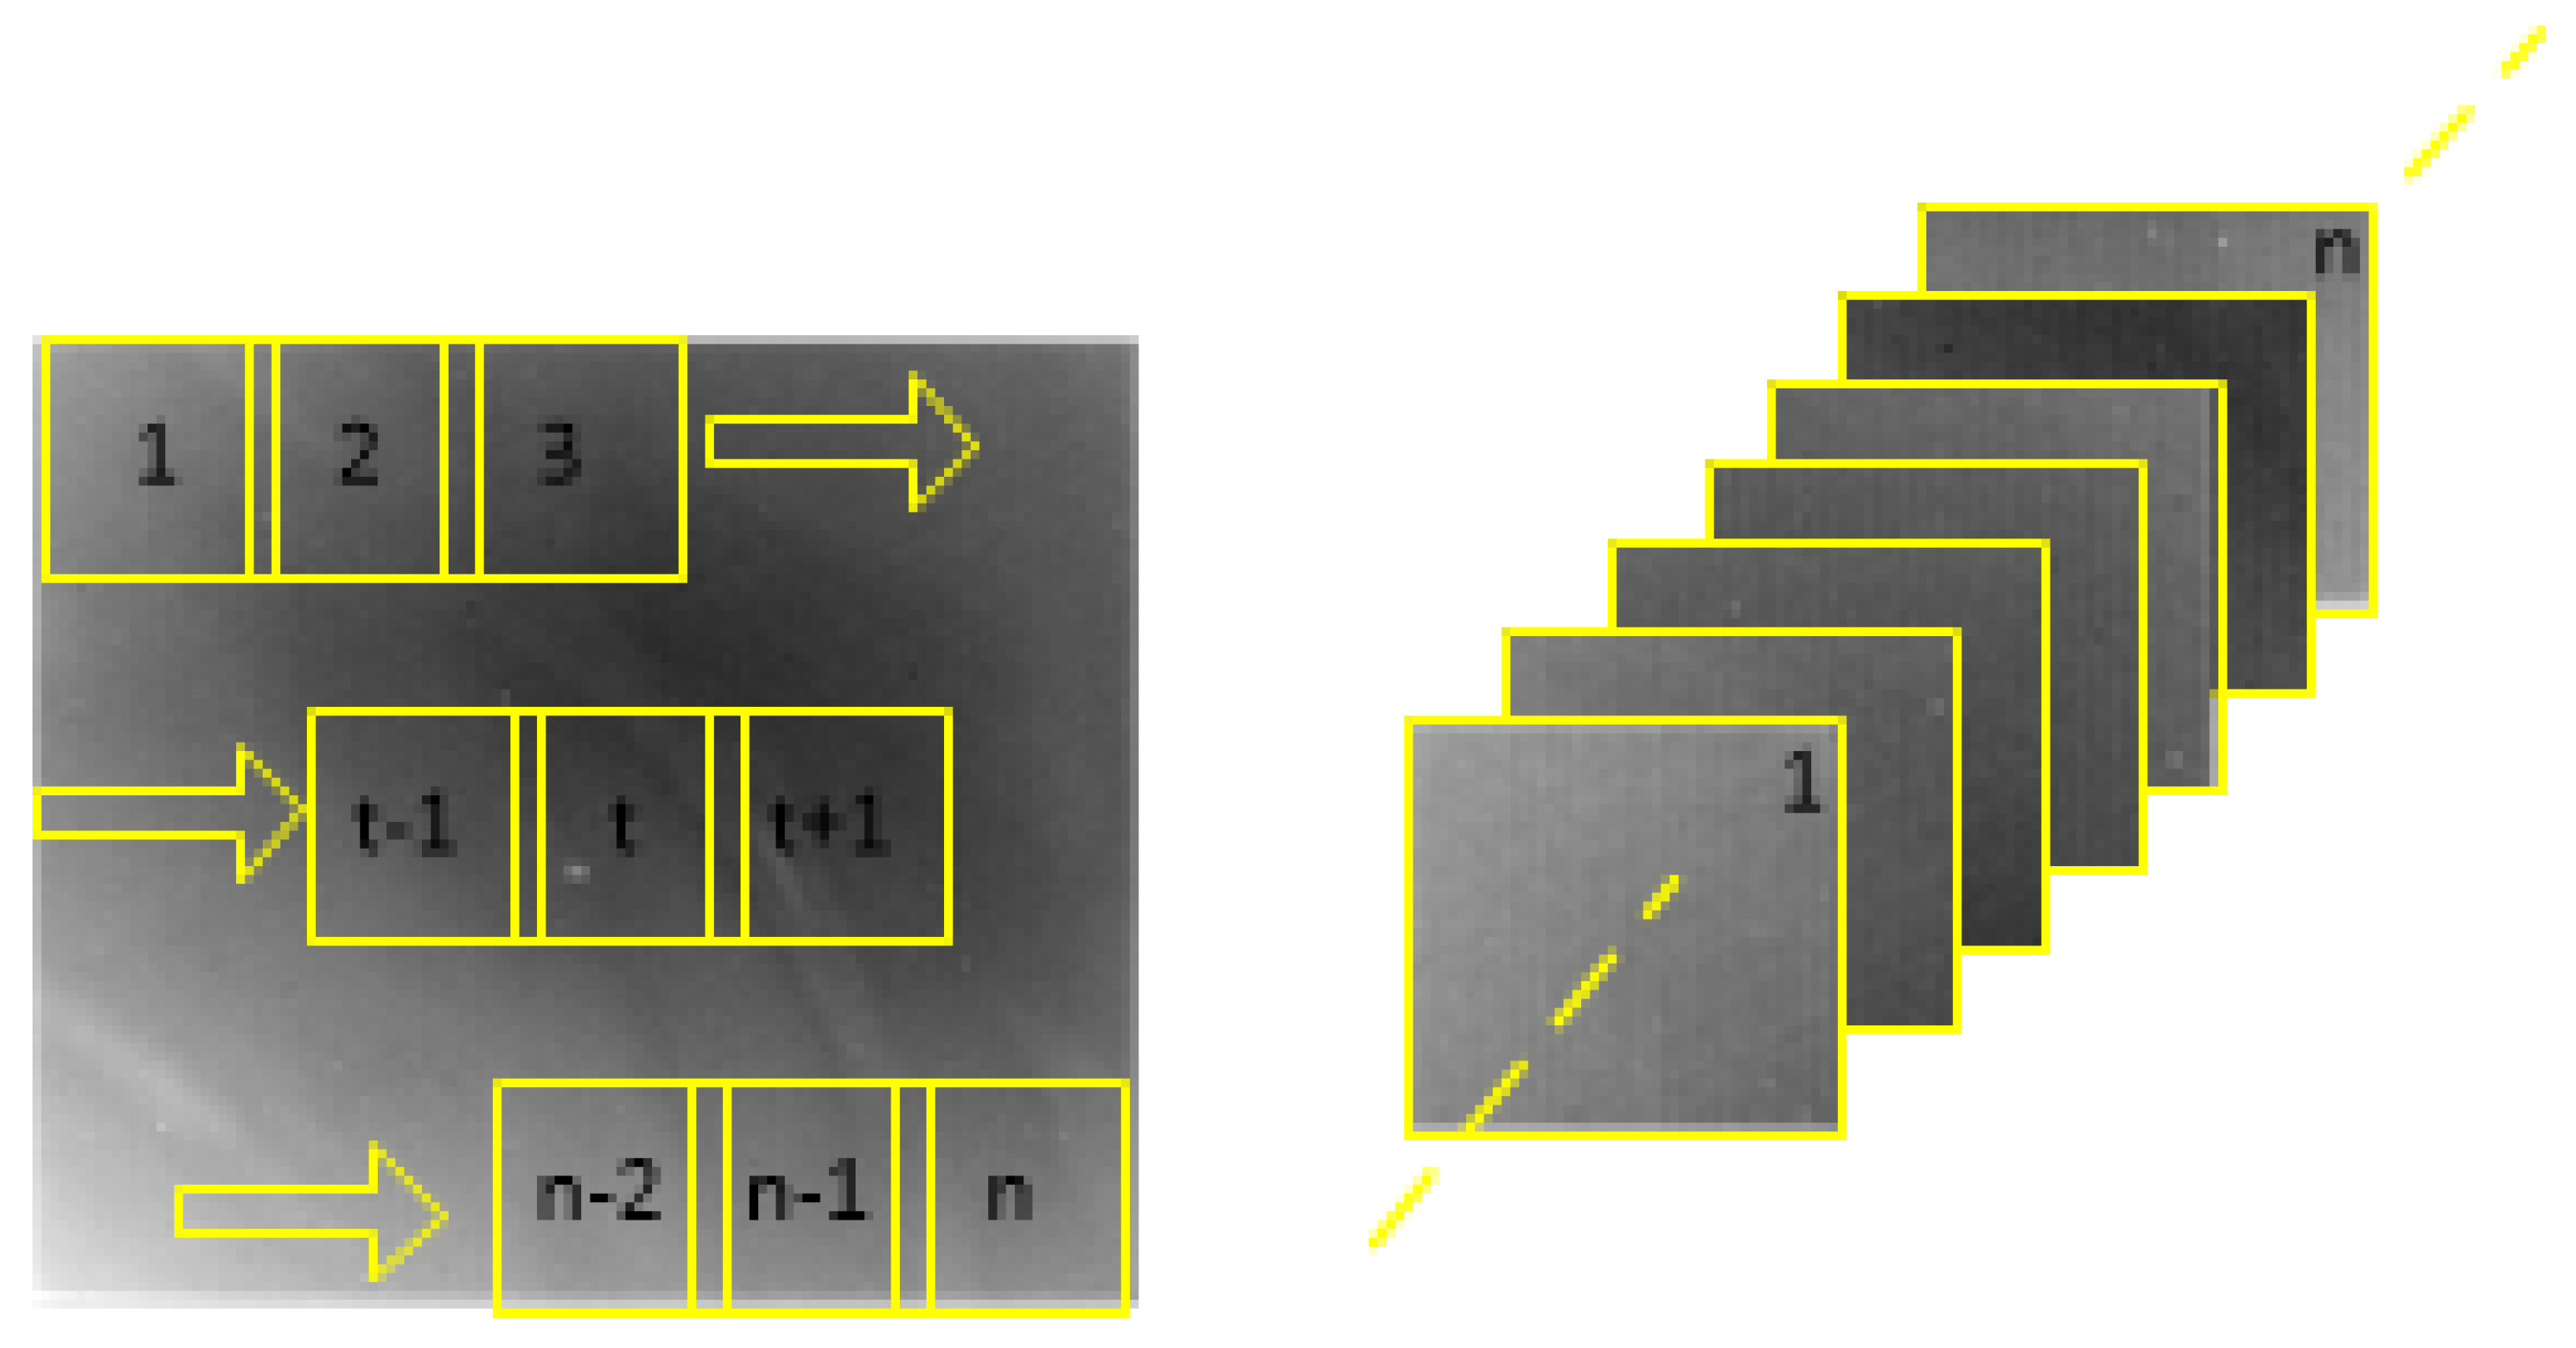
Figure 3.
Local a priori extraction method proposed by the PSTNN algorithm. (a) Infrared image containing dim and small targets; (b) weighted image describing corner point information; (c) weighted image describing background information; (d) final obtained weighted image.
Figure 3.
Local a priori extraction method proposed by the PSTNN algorithm. (a) Infrared image containing dim and small targets; (b) weighted image describing corner point information; (c) weighted image describing background information; (d) final obtained weighted image.
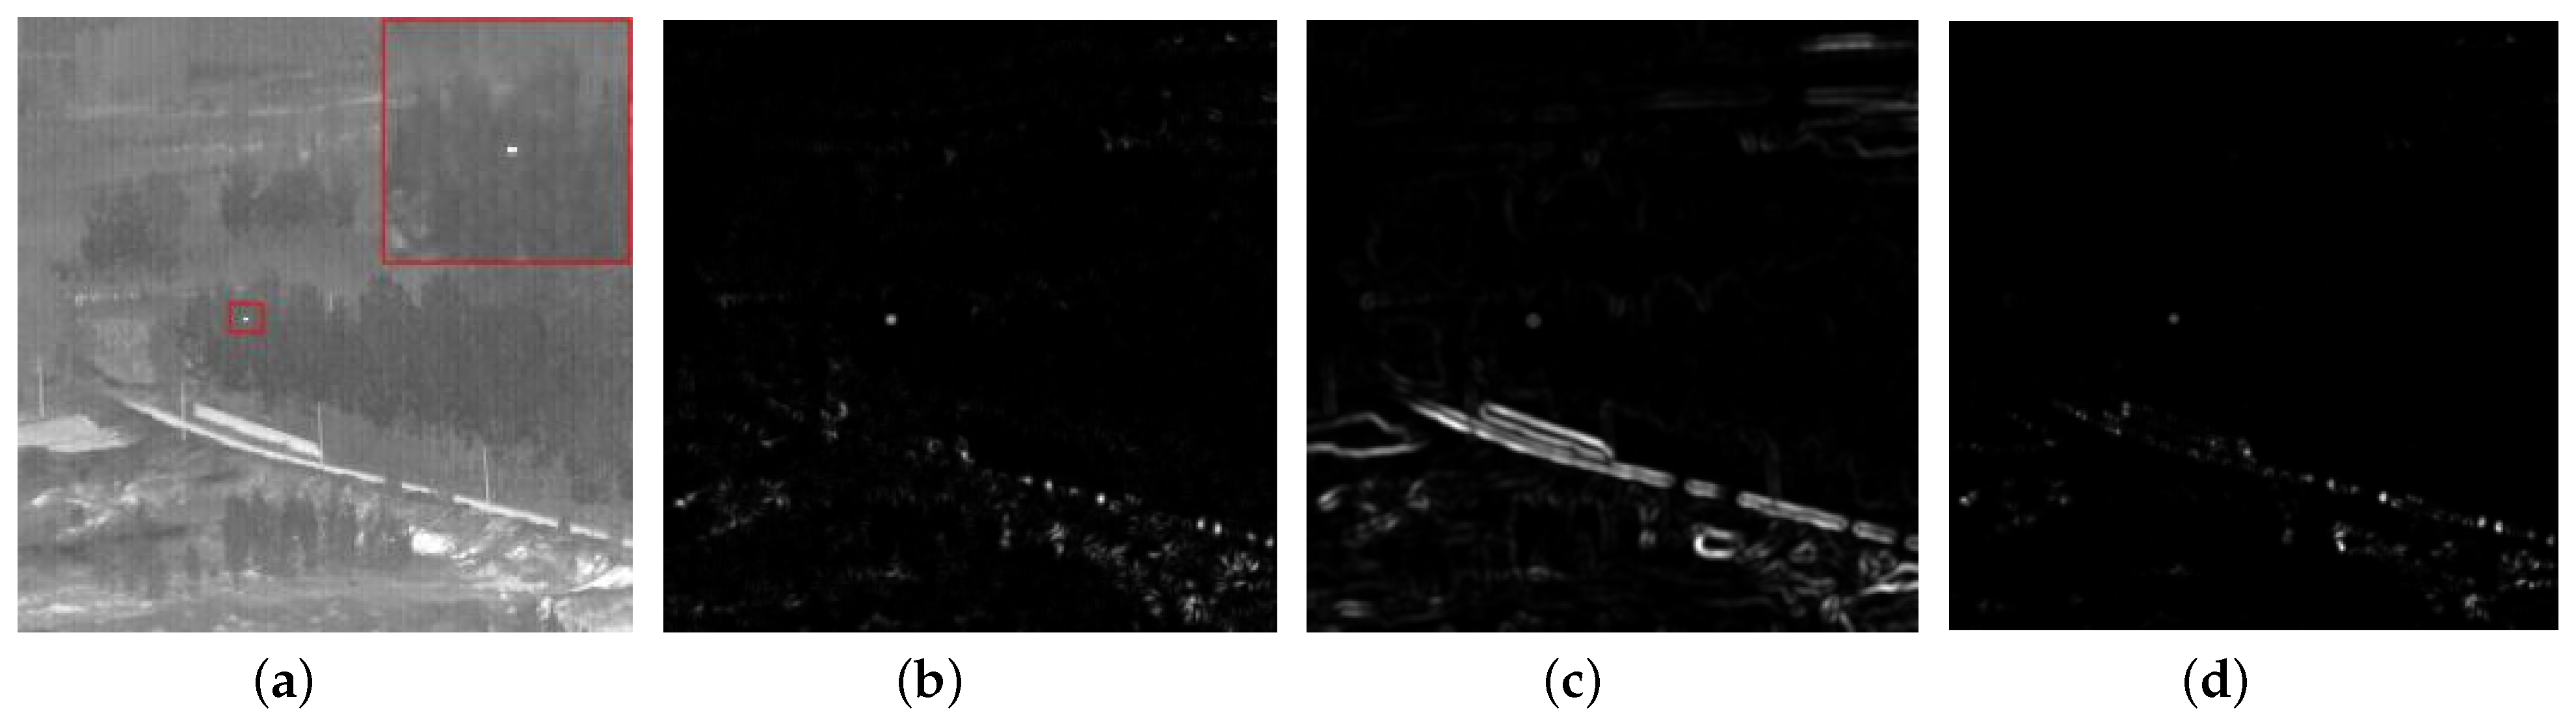
Figure 4.
The local a priori extraction method proposed by the algorithm in this paper. (a) Infrared image containing dim and small targets; (b) weighted image describing corner point information; (c) weighted image describing background information; (d) final weighted image obtained.
Figure 4.
The local a priori extraction method proposed by the algorithm in this paper. (a) Infrared image containing dim and small targets; (b) weighted image describing corner point information; (c) weighted image describing background information; (d) final weighted image obtained.
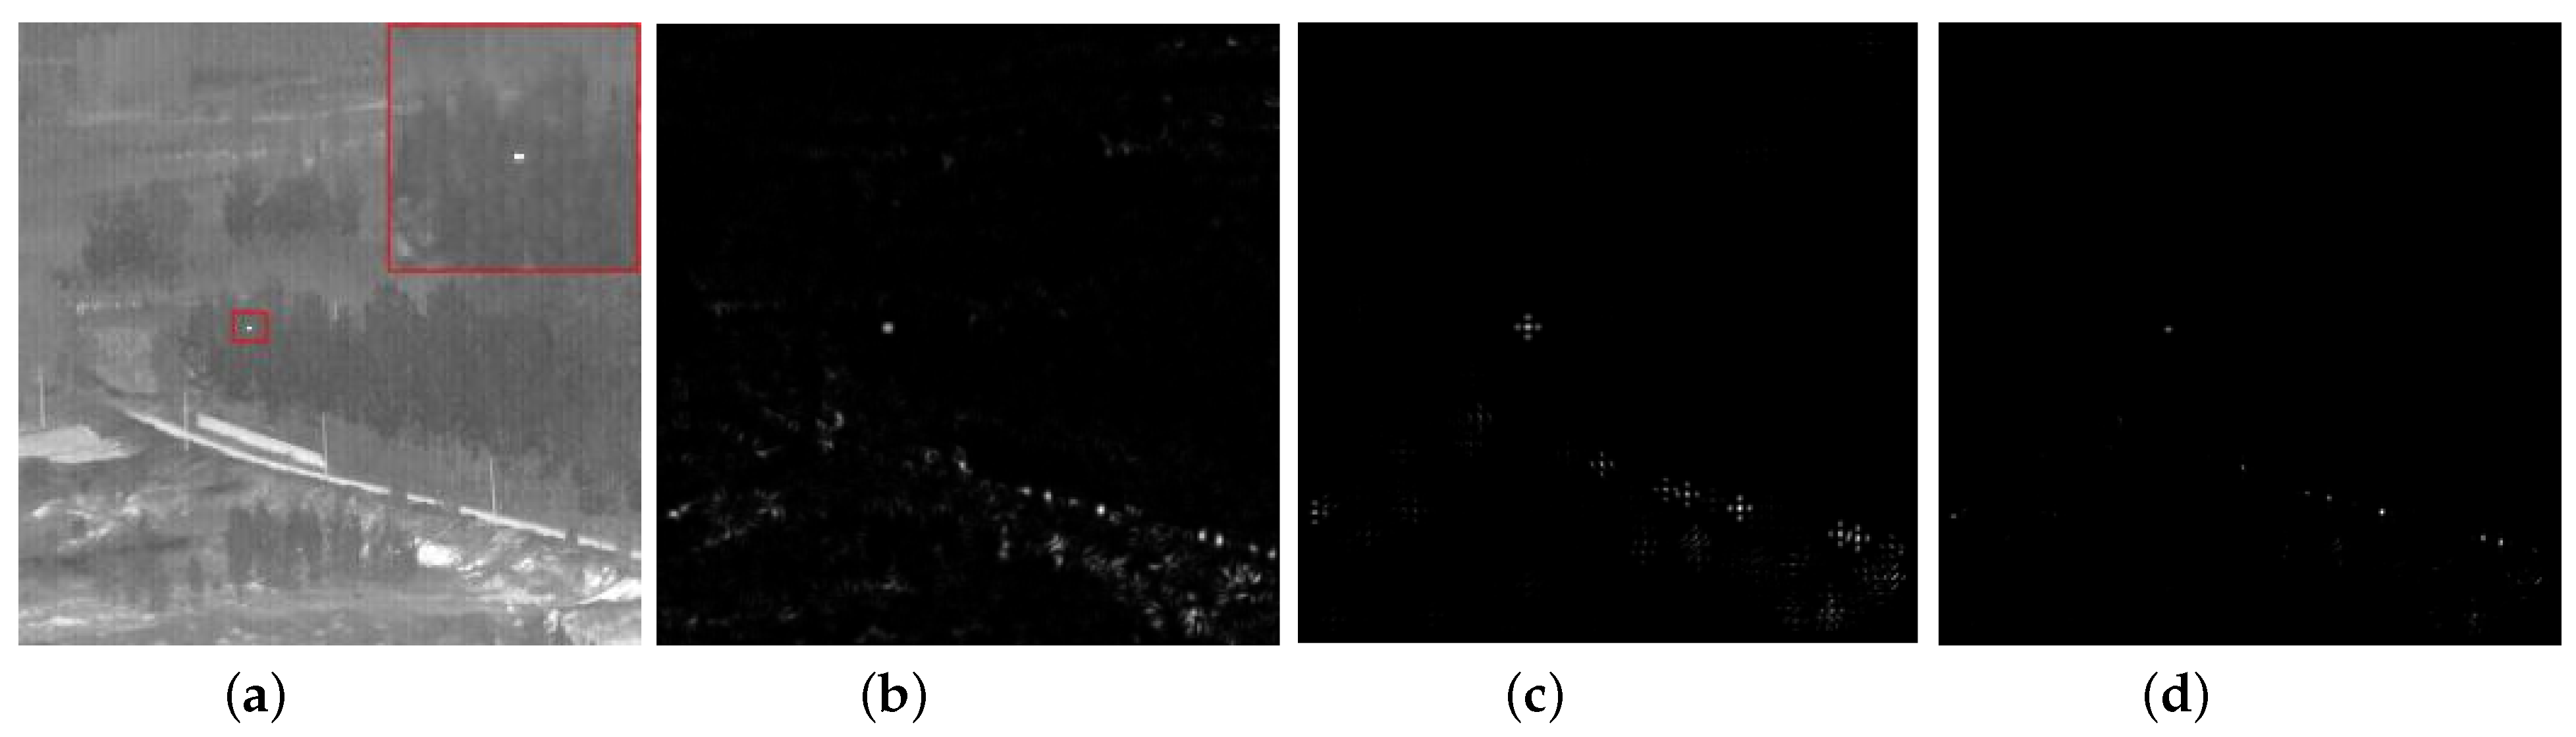
Figure 5.
Flowchart of the model presented in this paper.
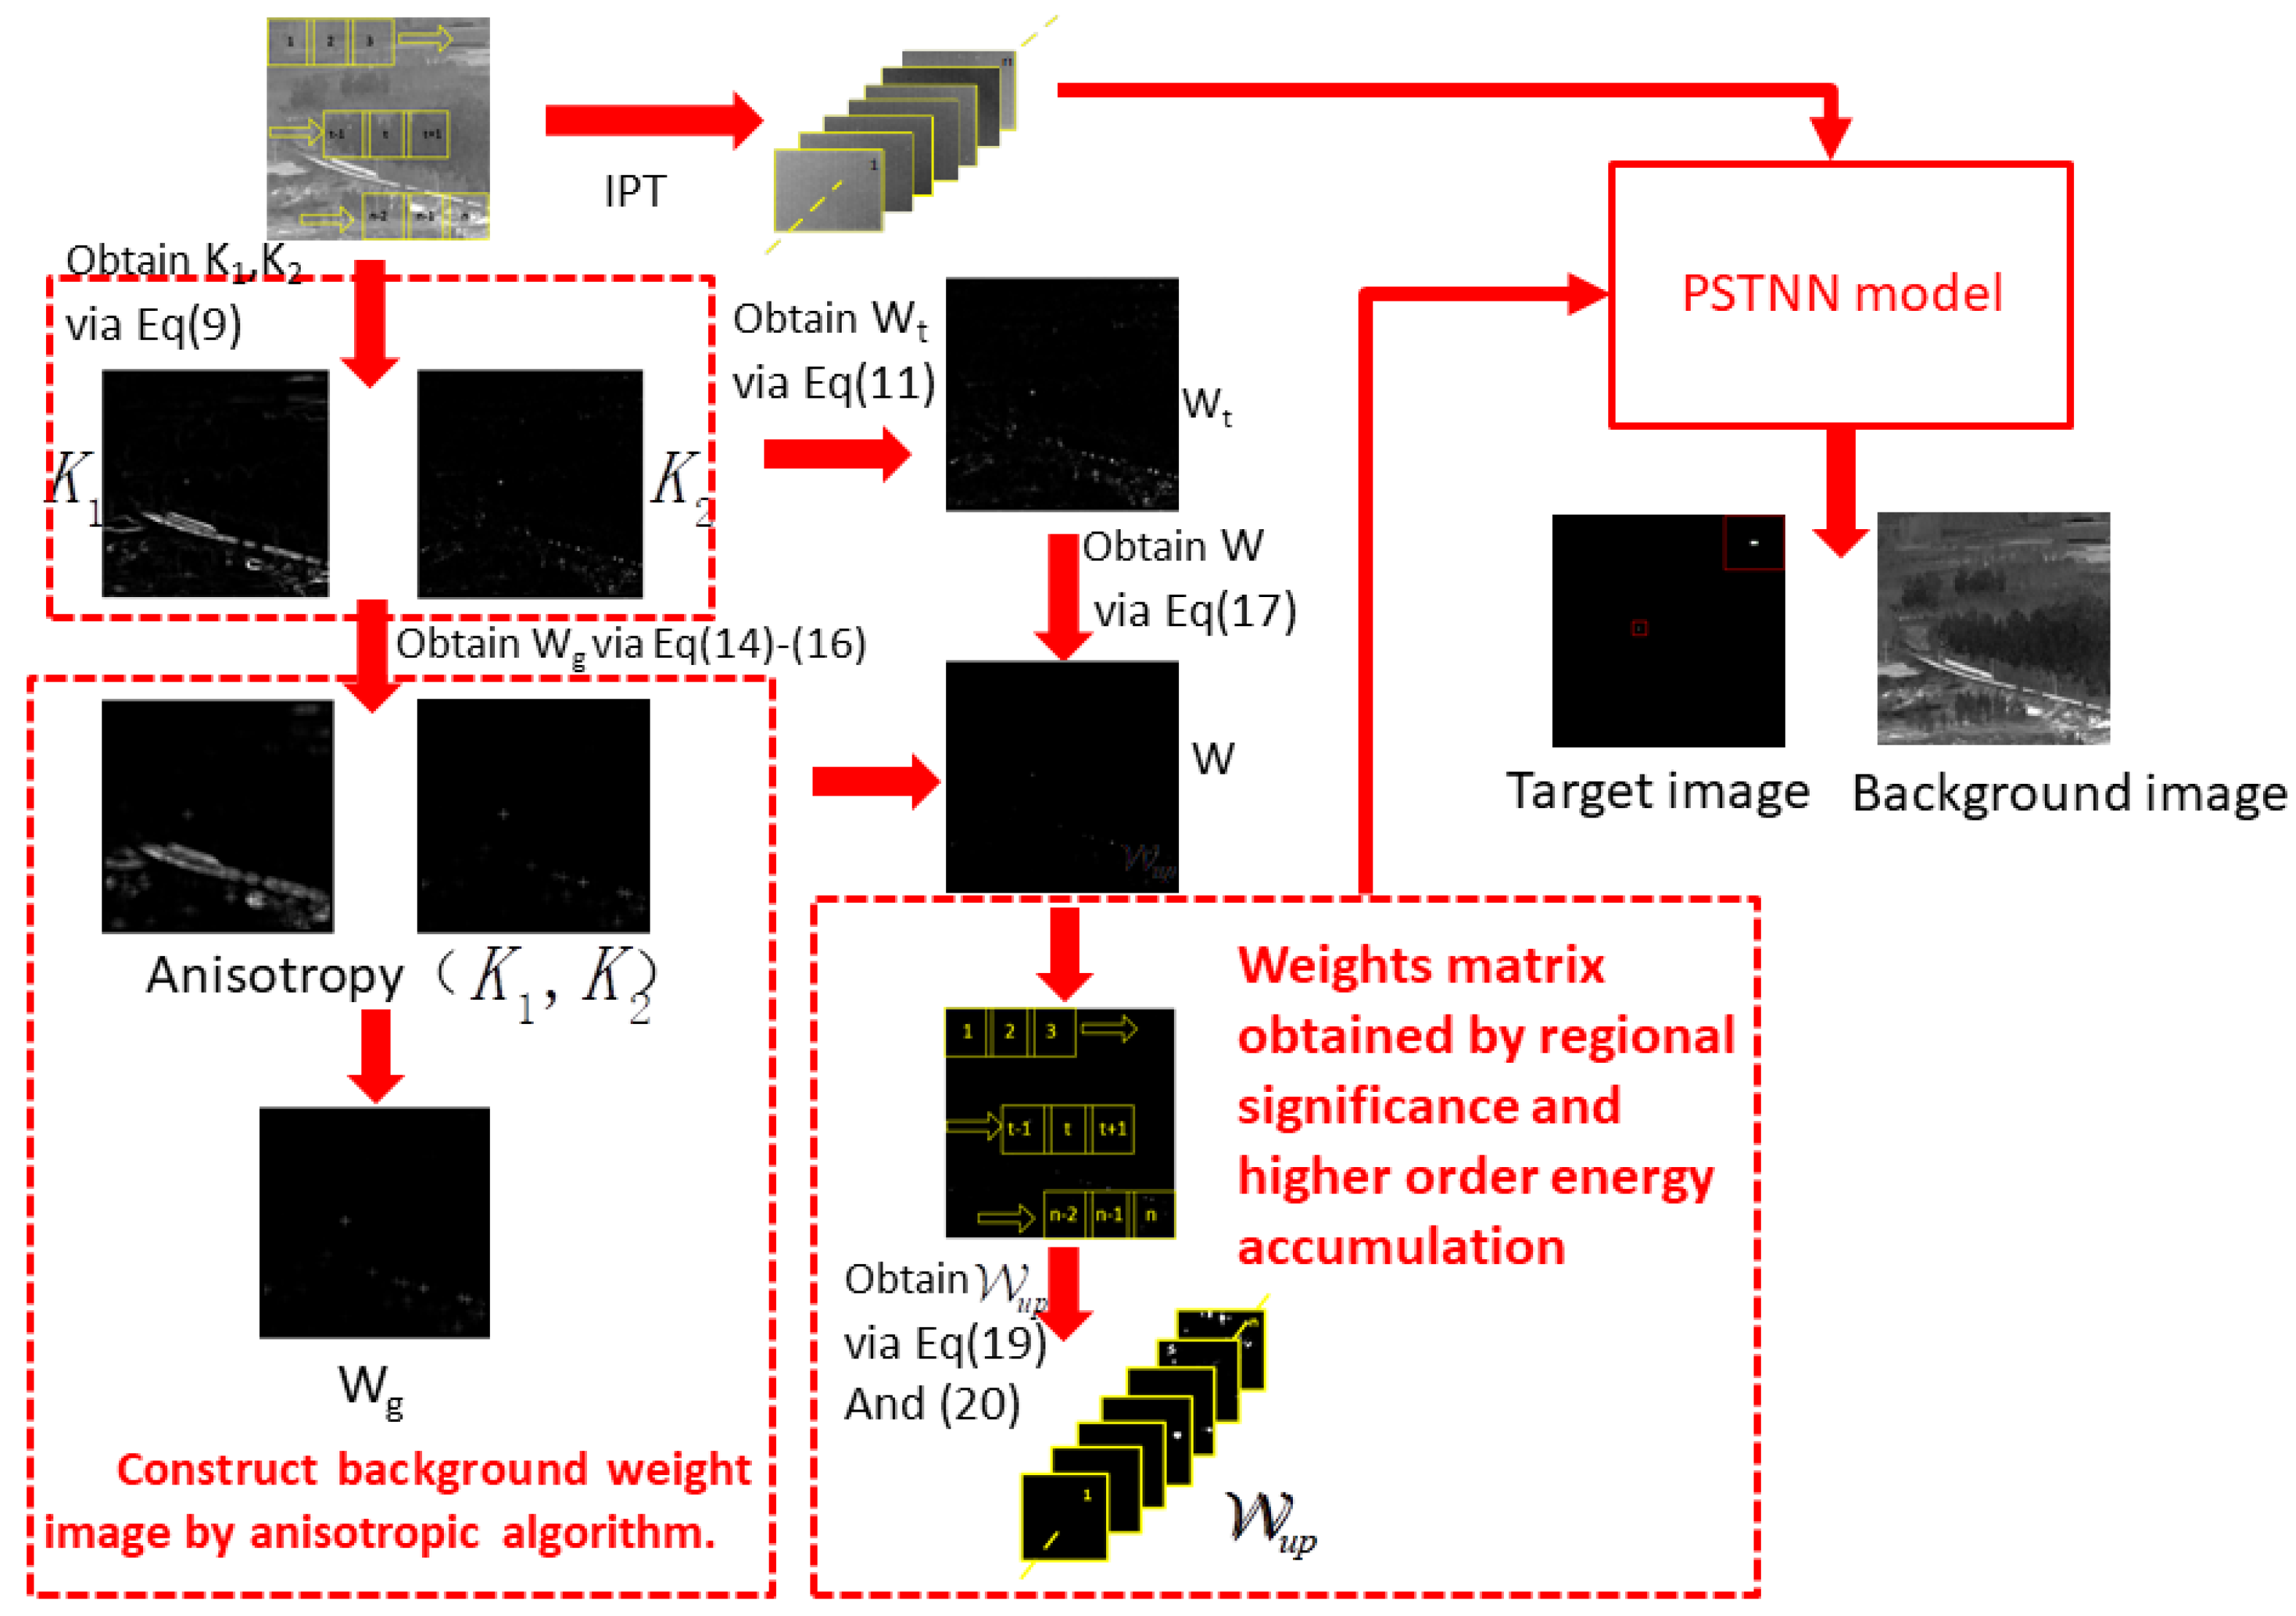
Figure 6.
(a–p) Sixteen different infrared dim and small target scenes.
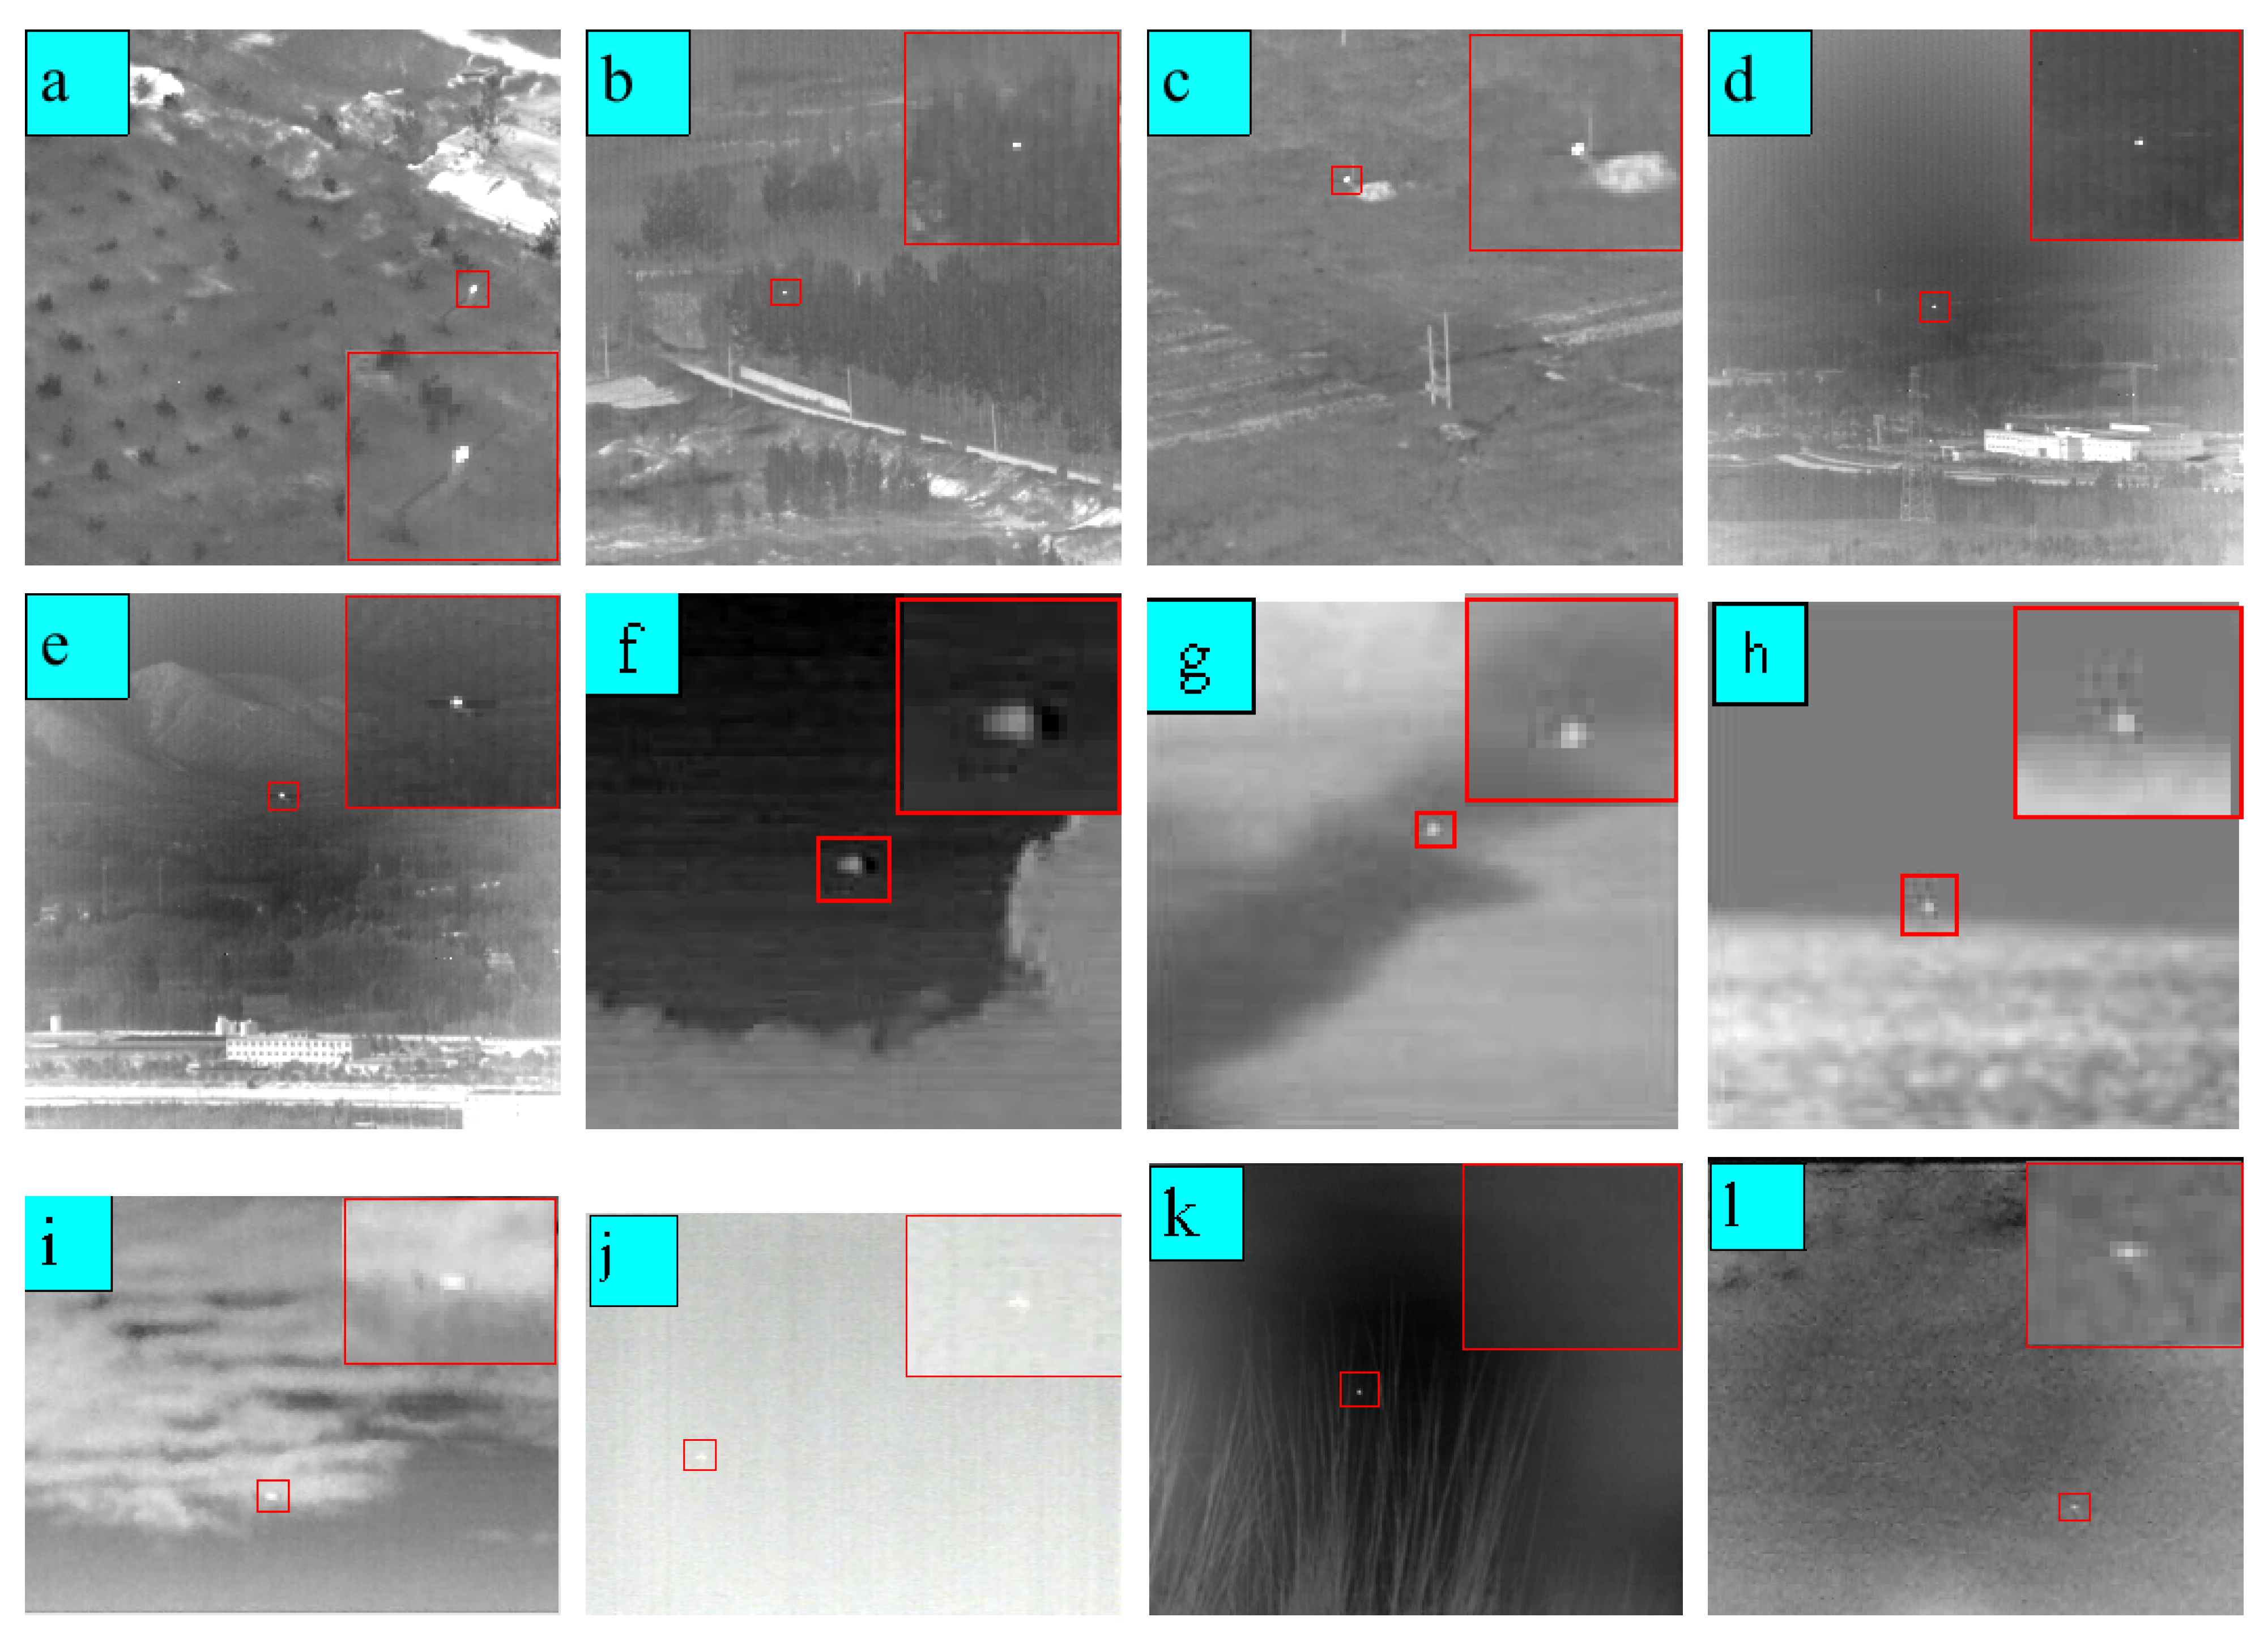
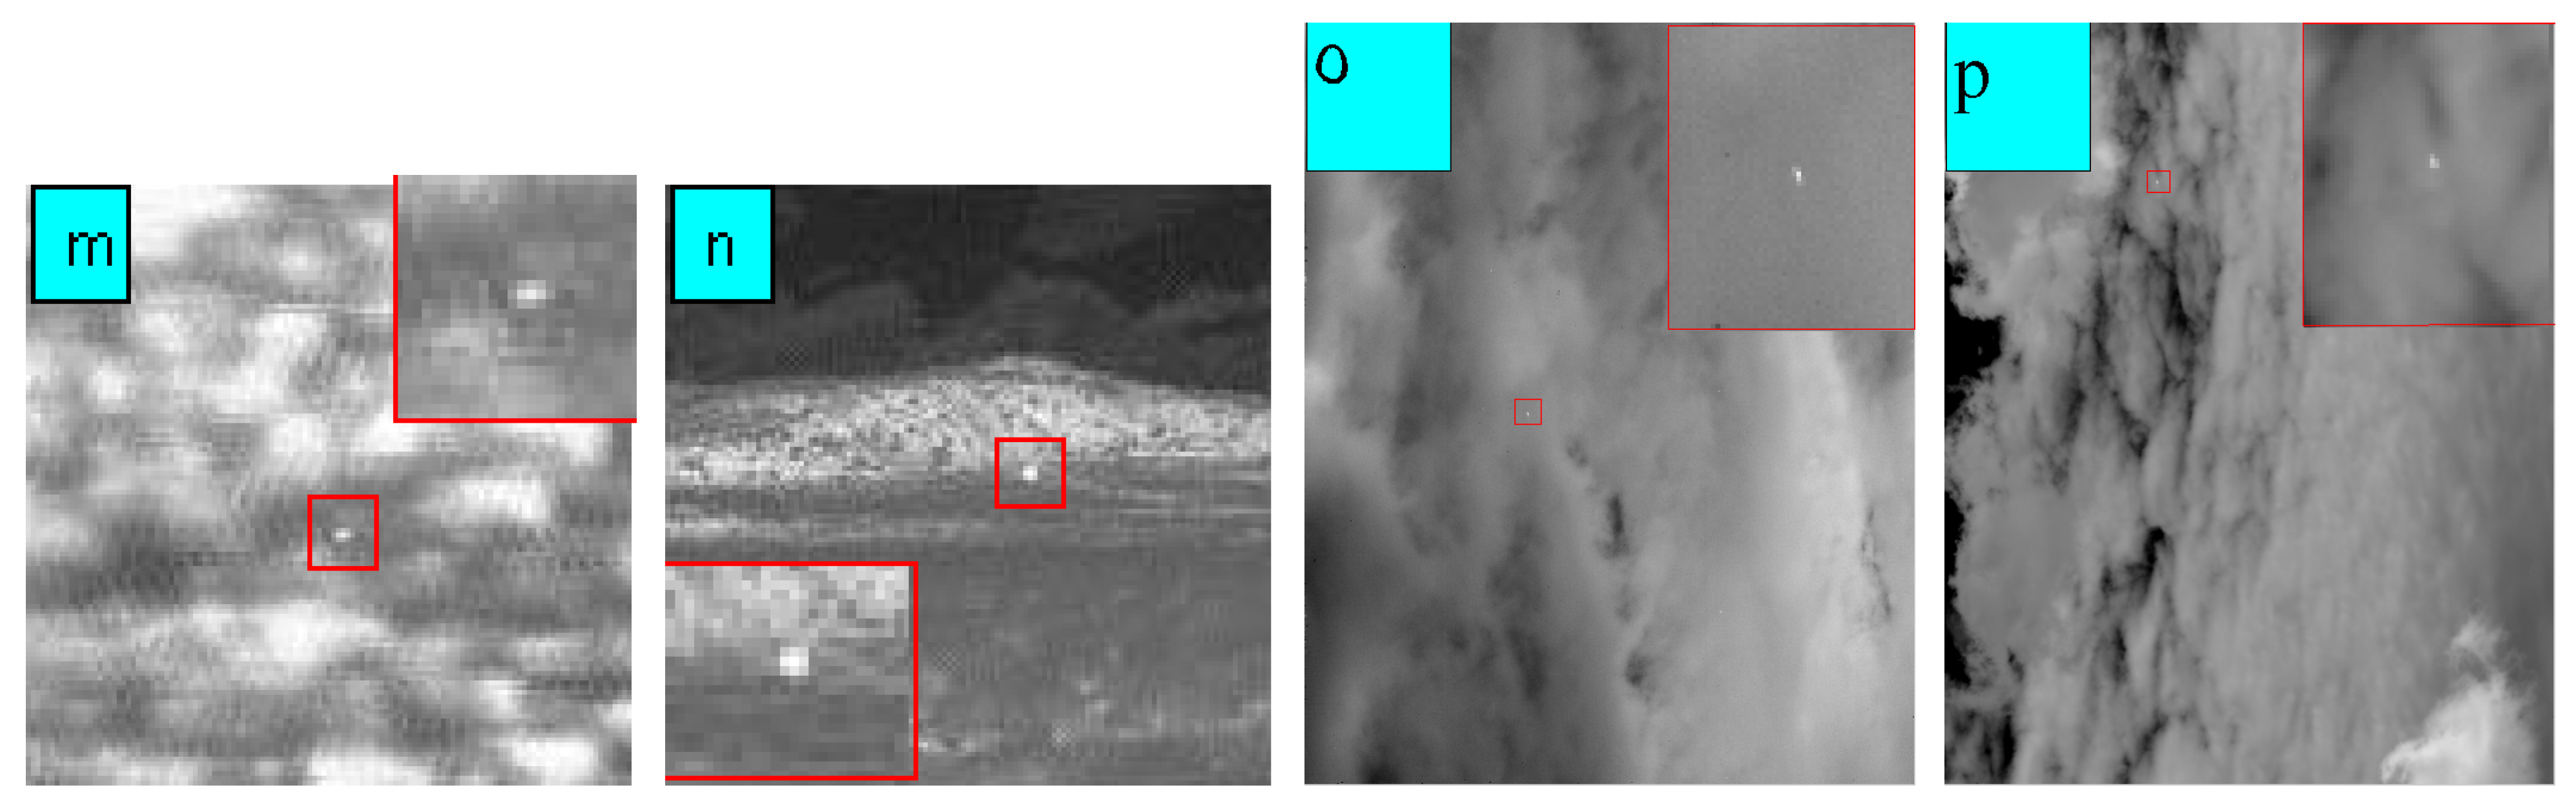
Figure 7.
Detection results of the algorithm in this paper under 16 scenes. (a–p) are the detection results in 16 scenes, and the following is the three-dimensional map of the detection results.
Figure 7.
Detection results of the algorithm in this paper under 16 scenes. (a–p) are the detection results in 16 scenes, and the following is the three-dimensional map of the detection results.
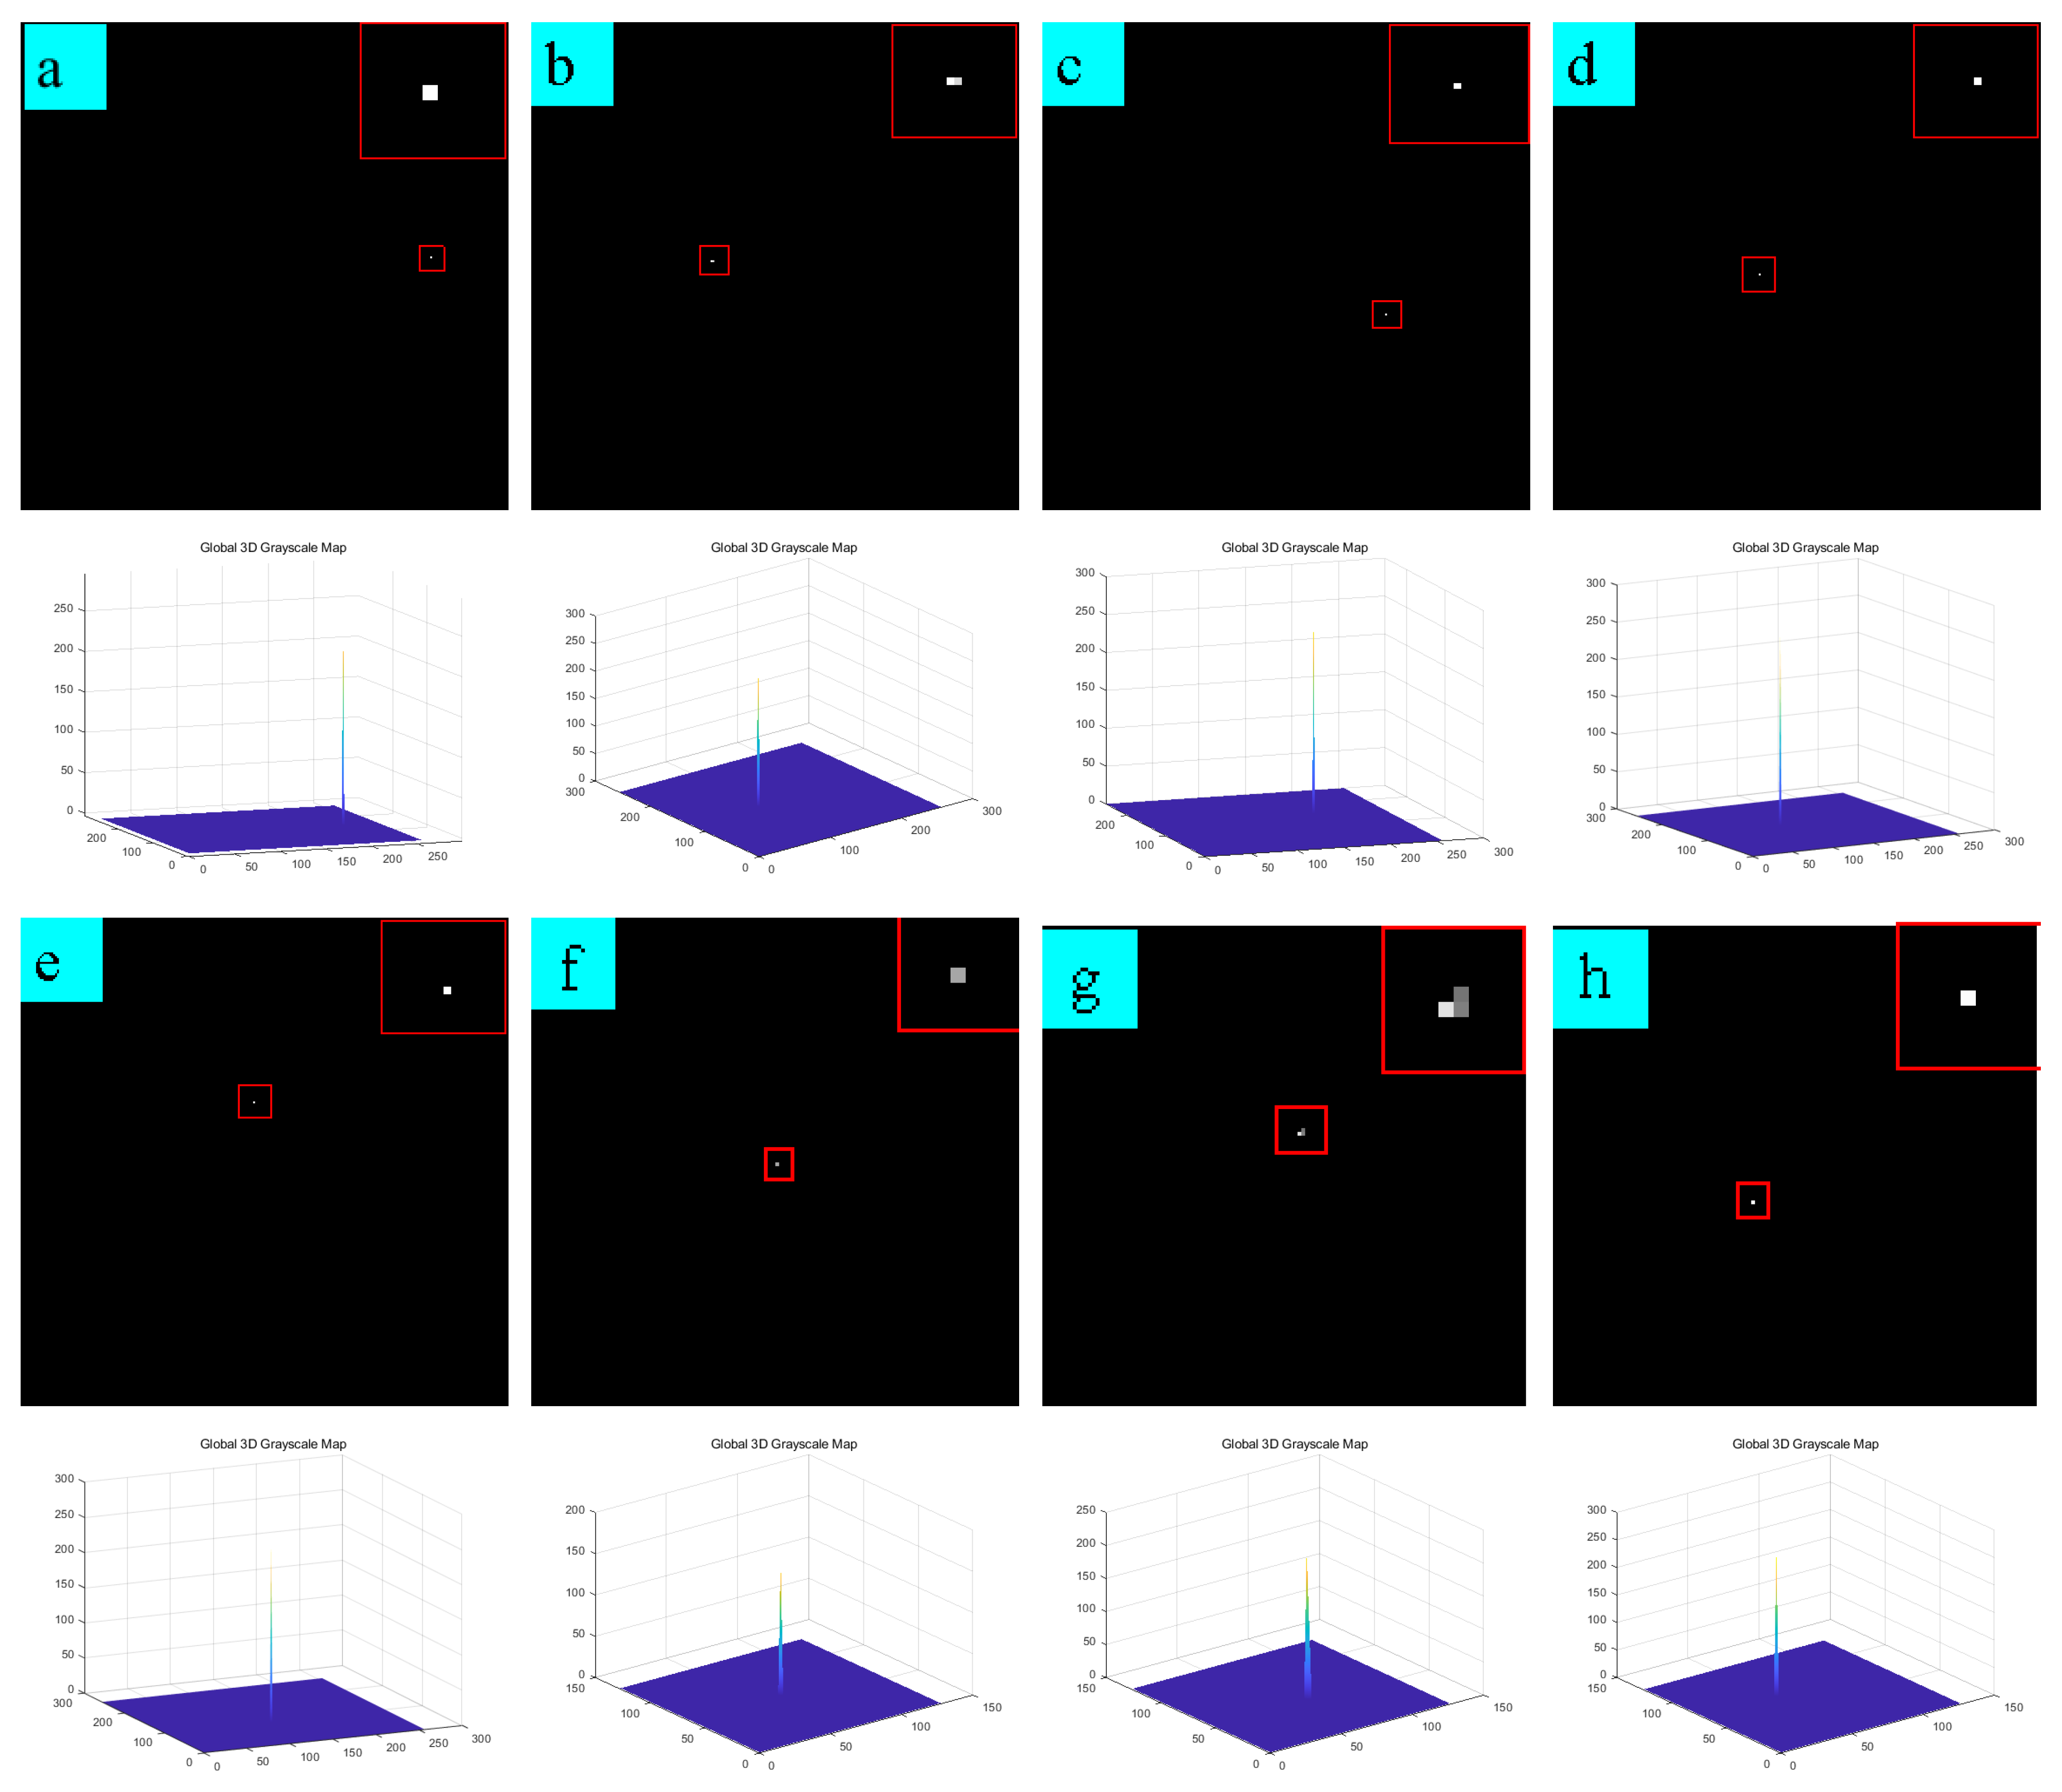
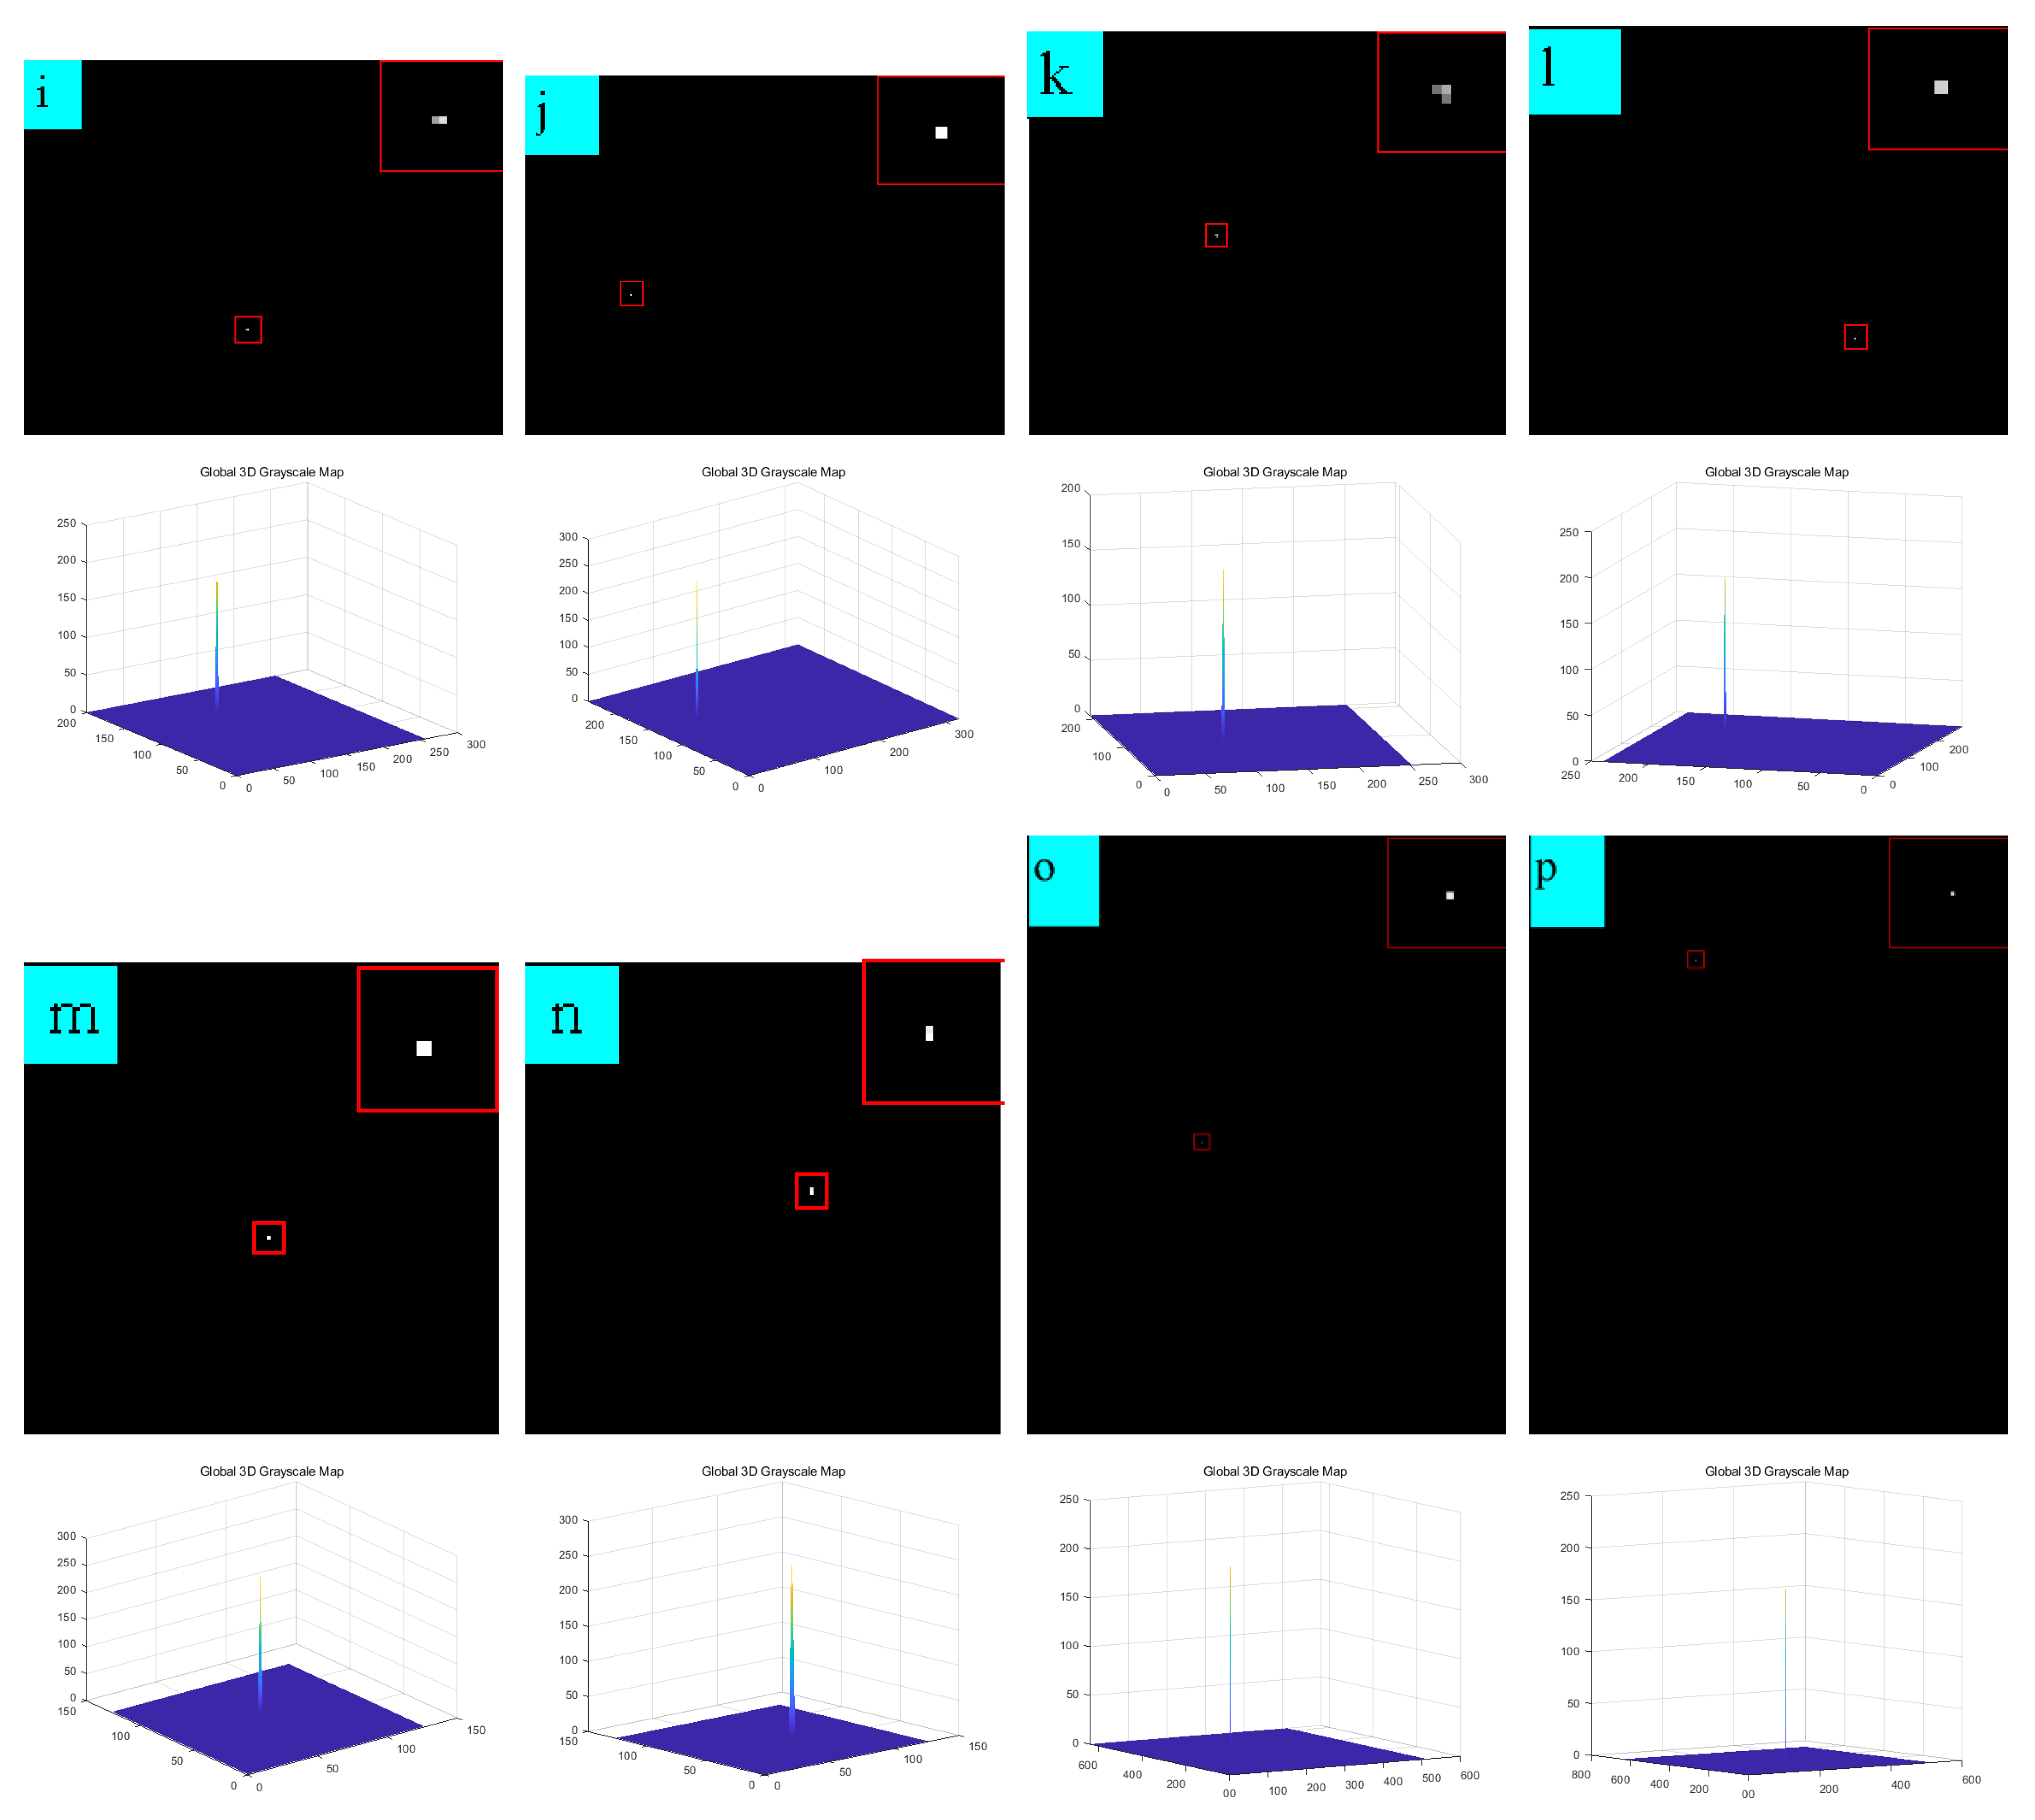
Figure 8.
(a–f) show representative images of the six sequences.

Figure 9.
Detection results of sequence 1.
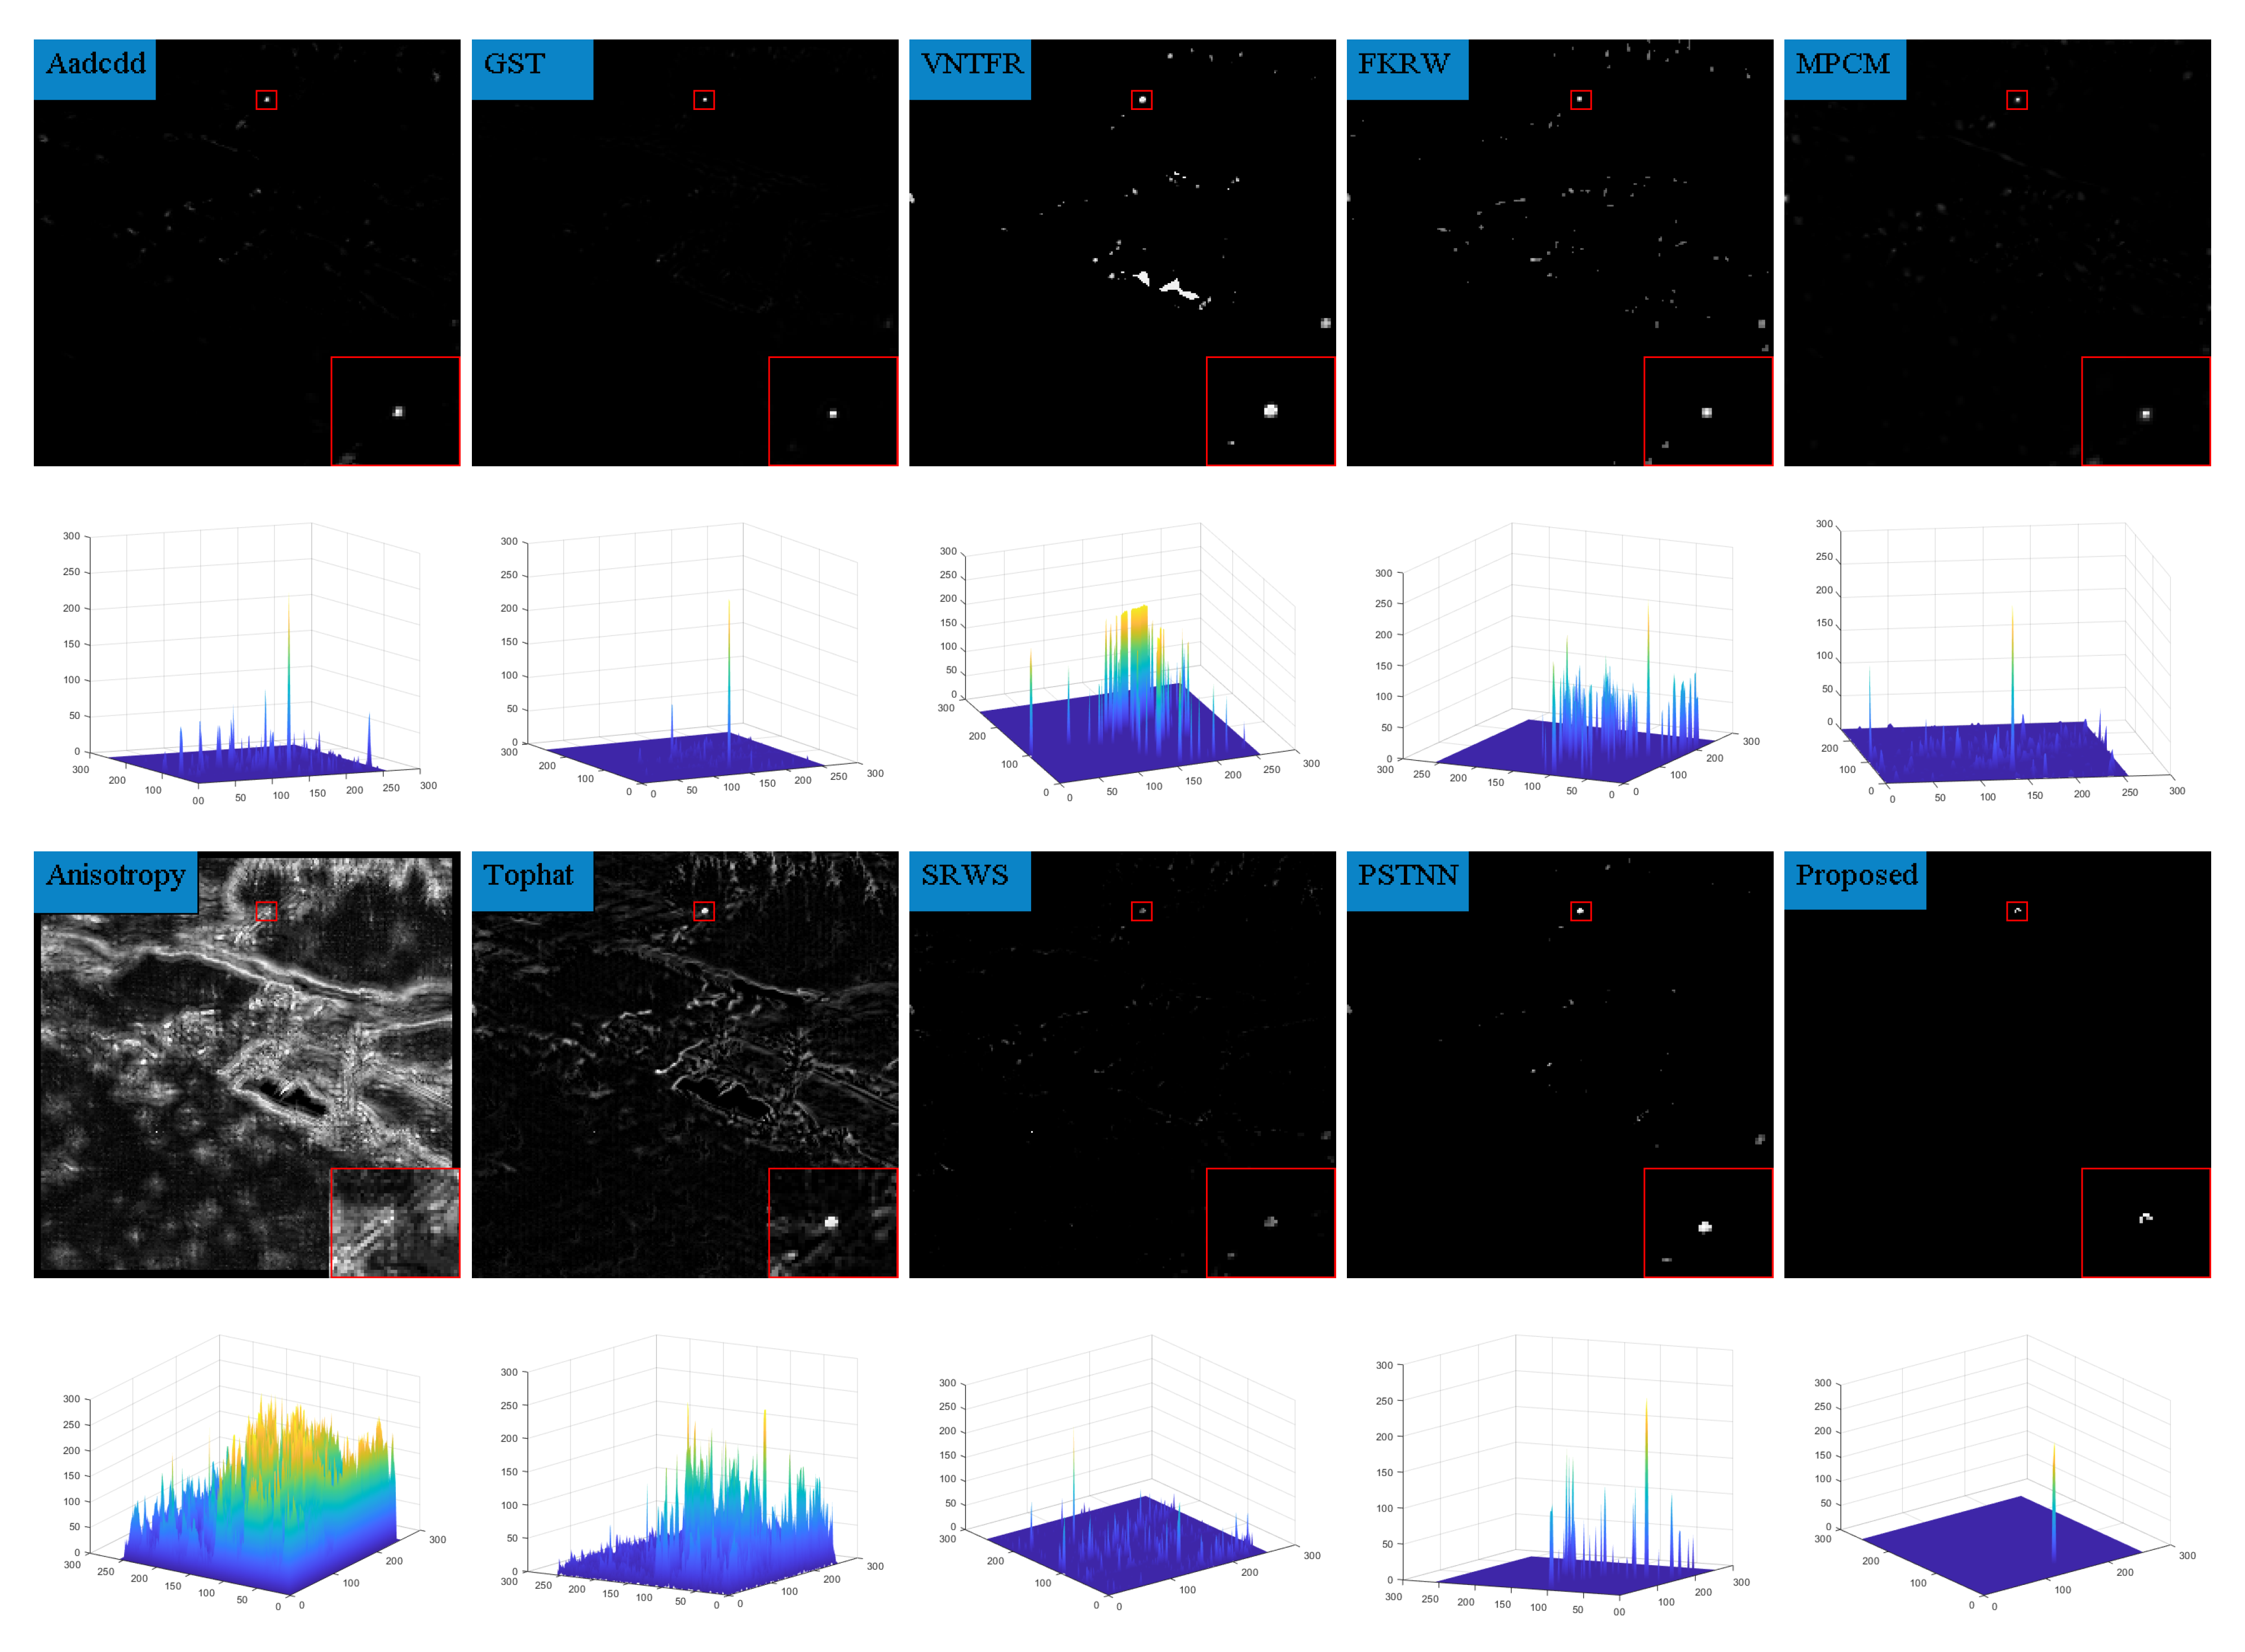
Figure 10.
Detection results of sequence 2.
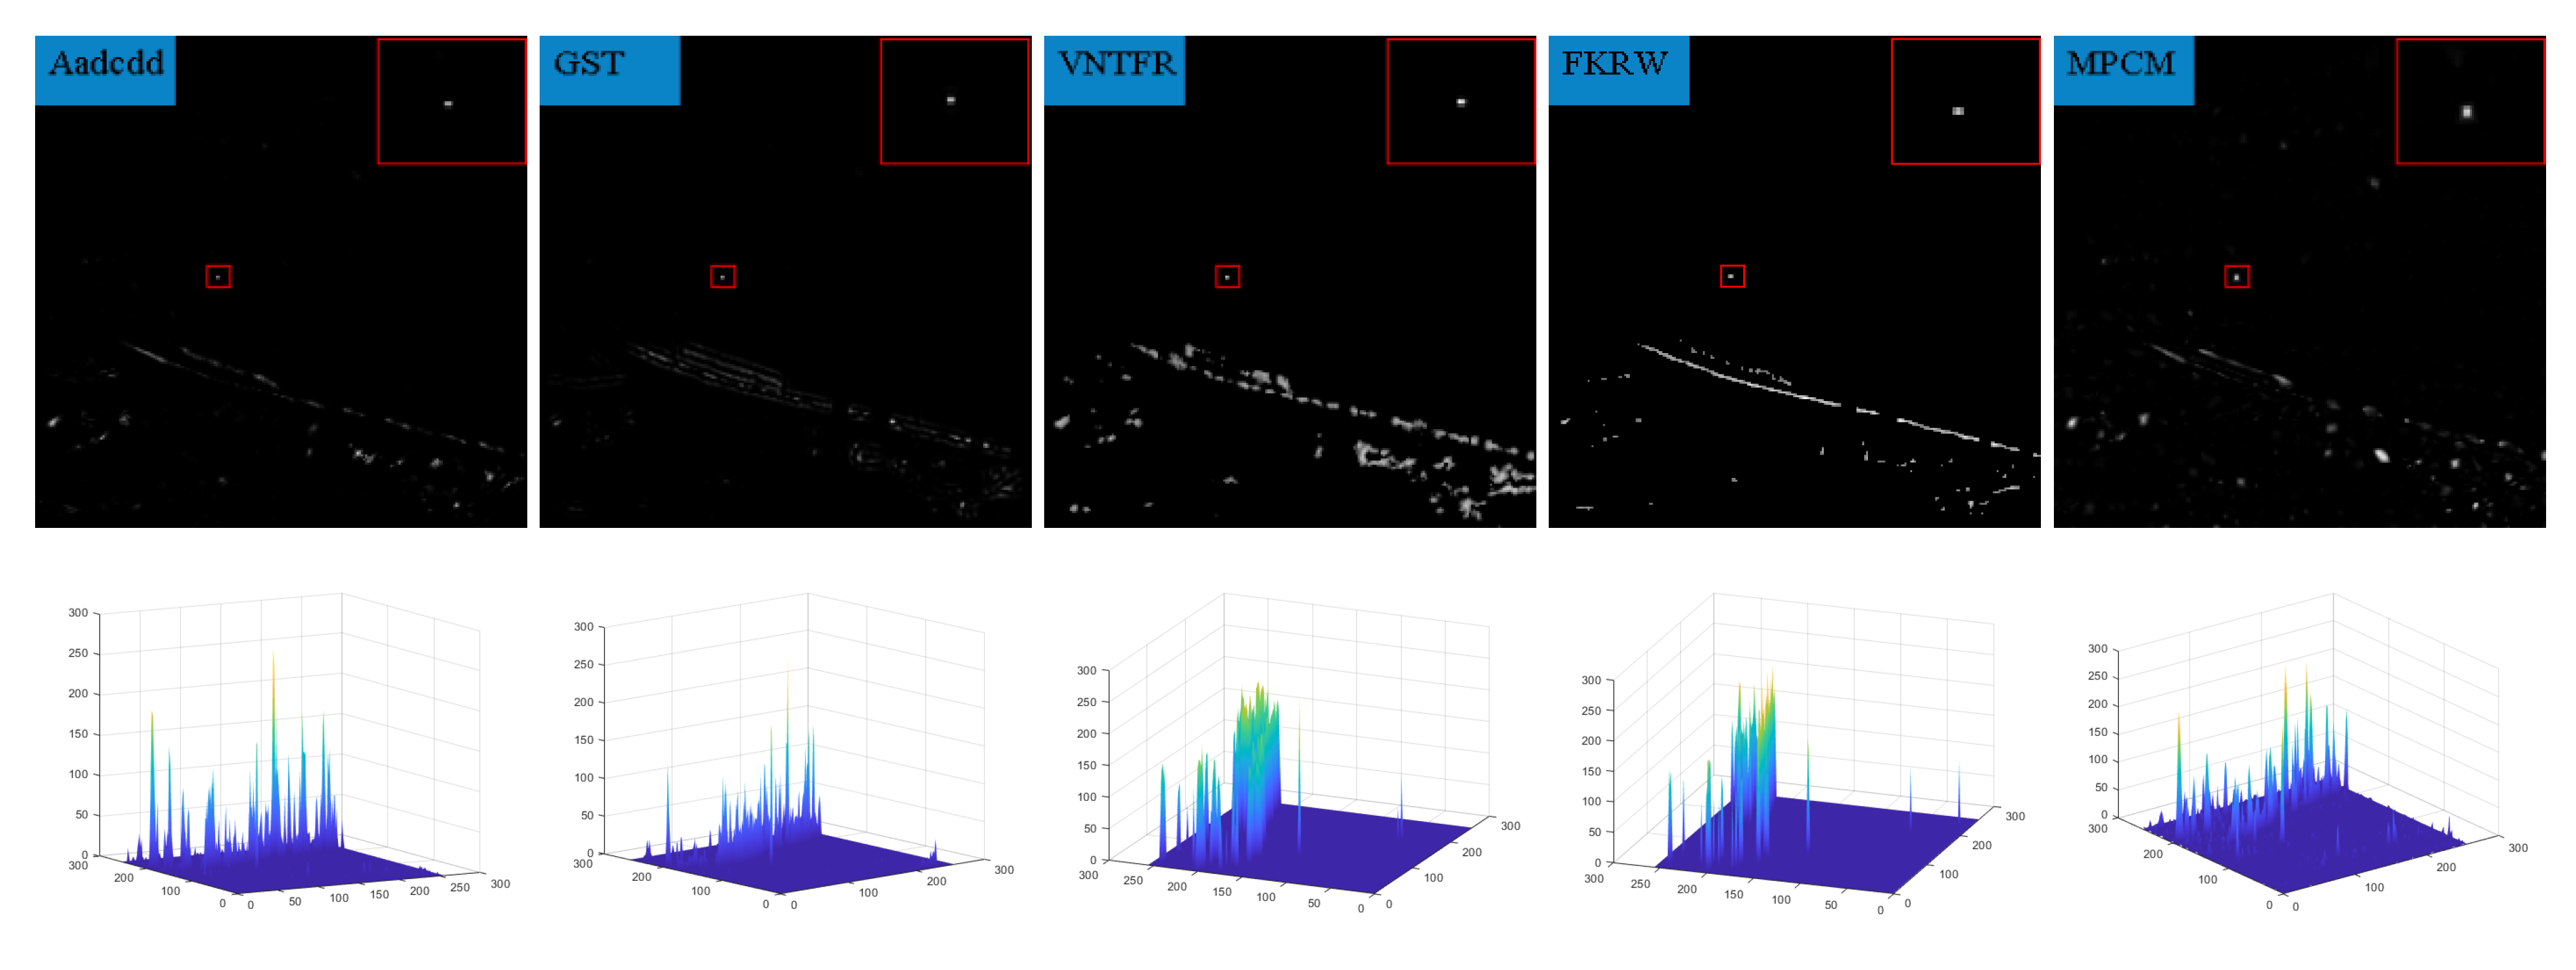
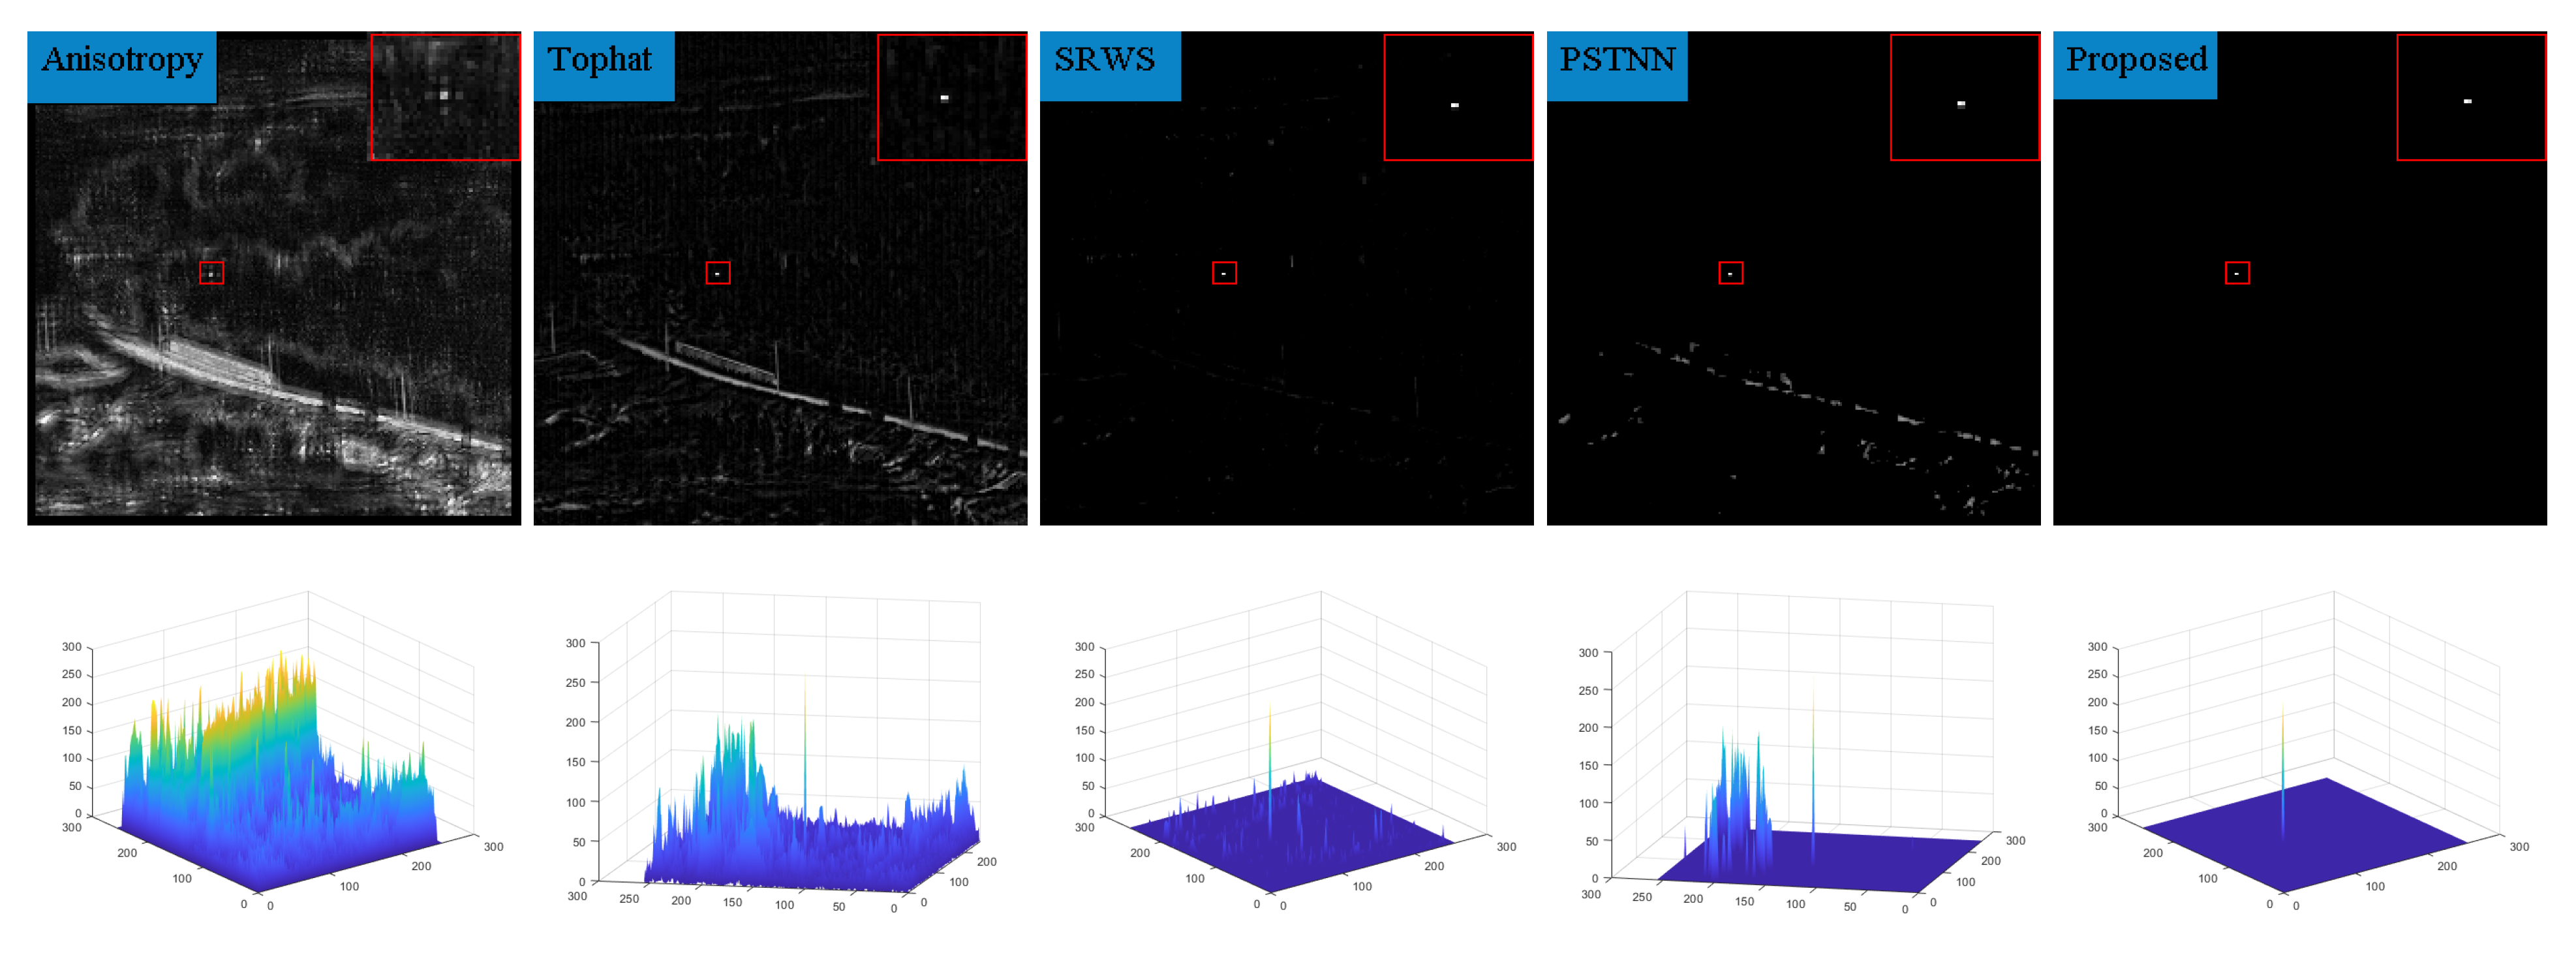
Figure 11.
Detection results of sequence 3.

Figure 12.
Detection results of sequence 4.

Figure 13.
Detection results of sequence 5.
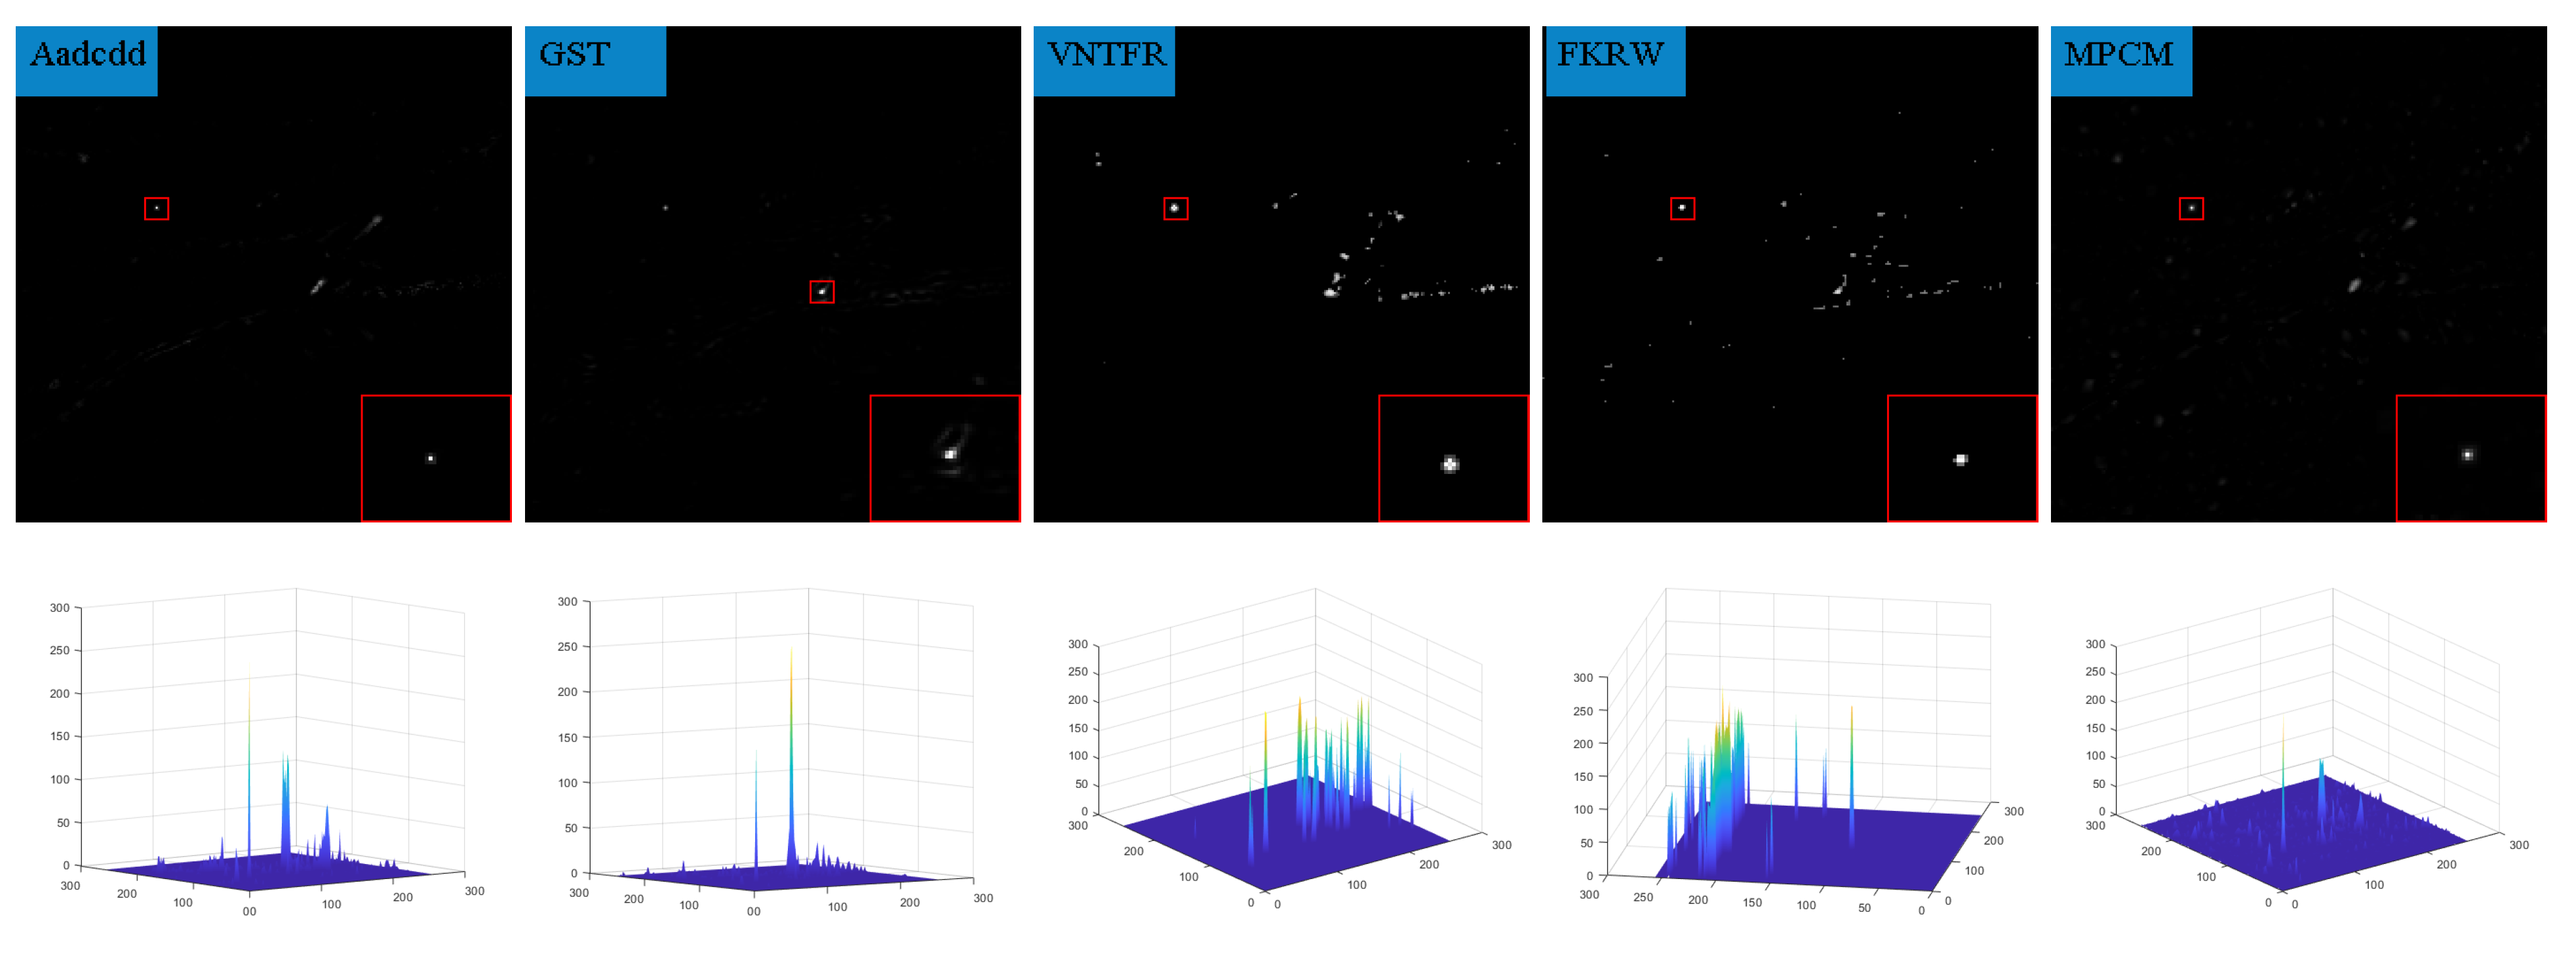
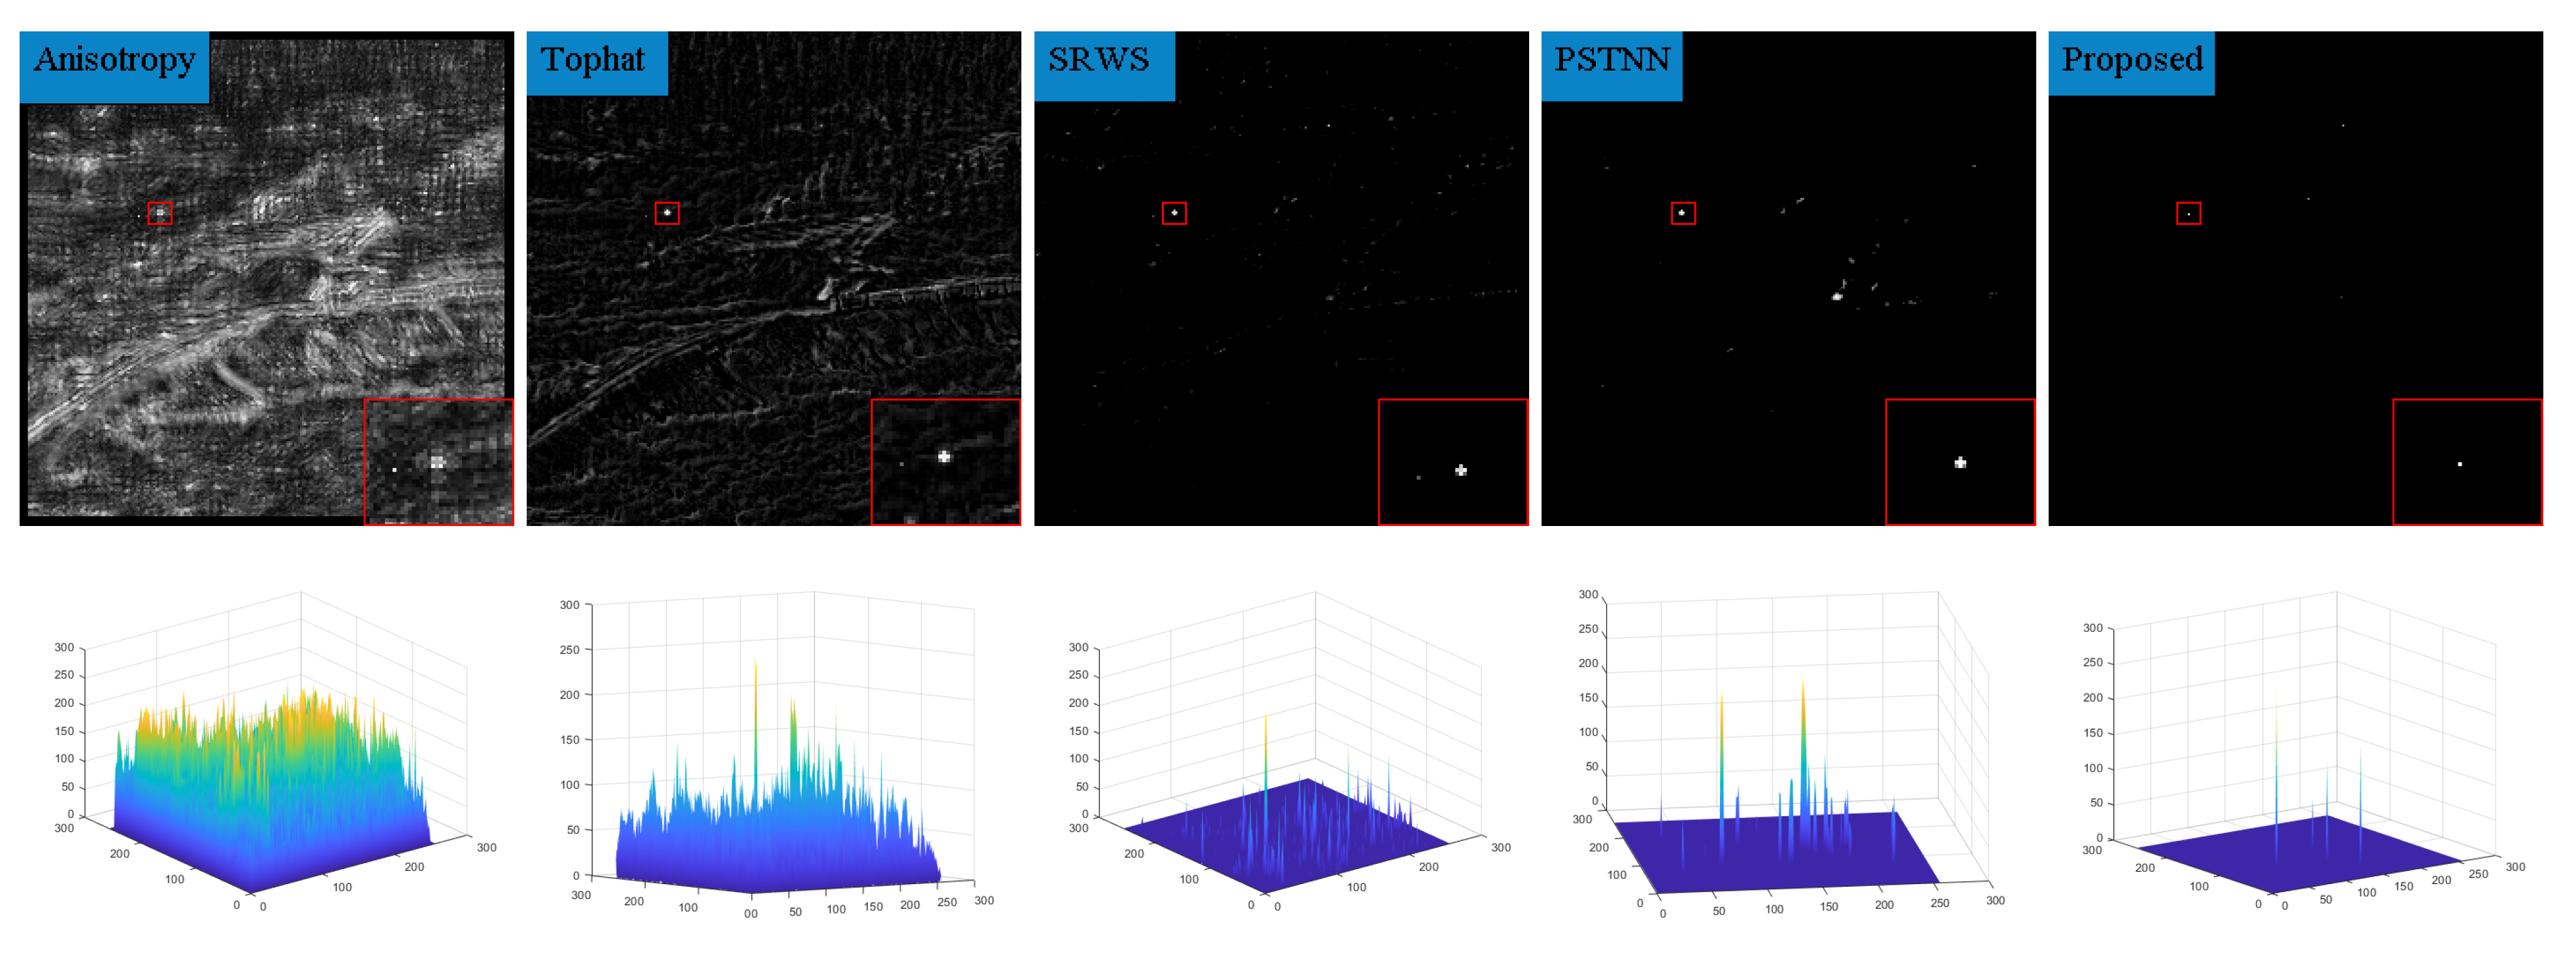
Figure 14.
Detection results of sequence 6.
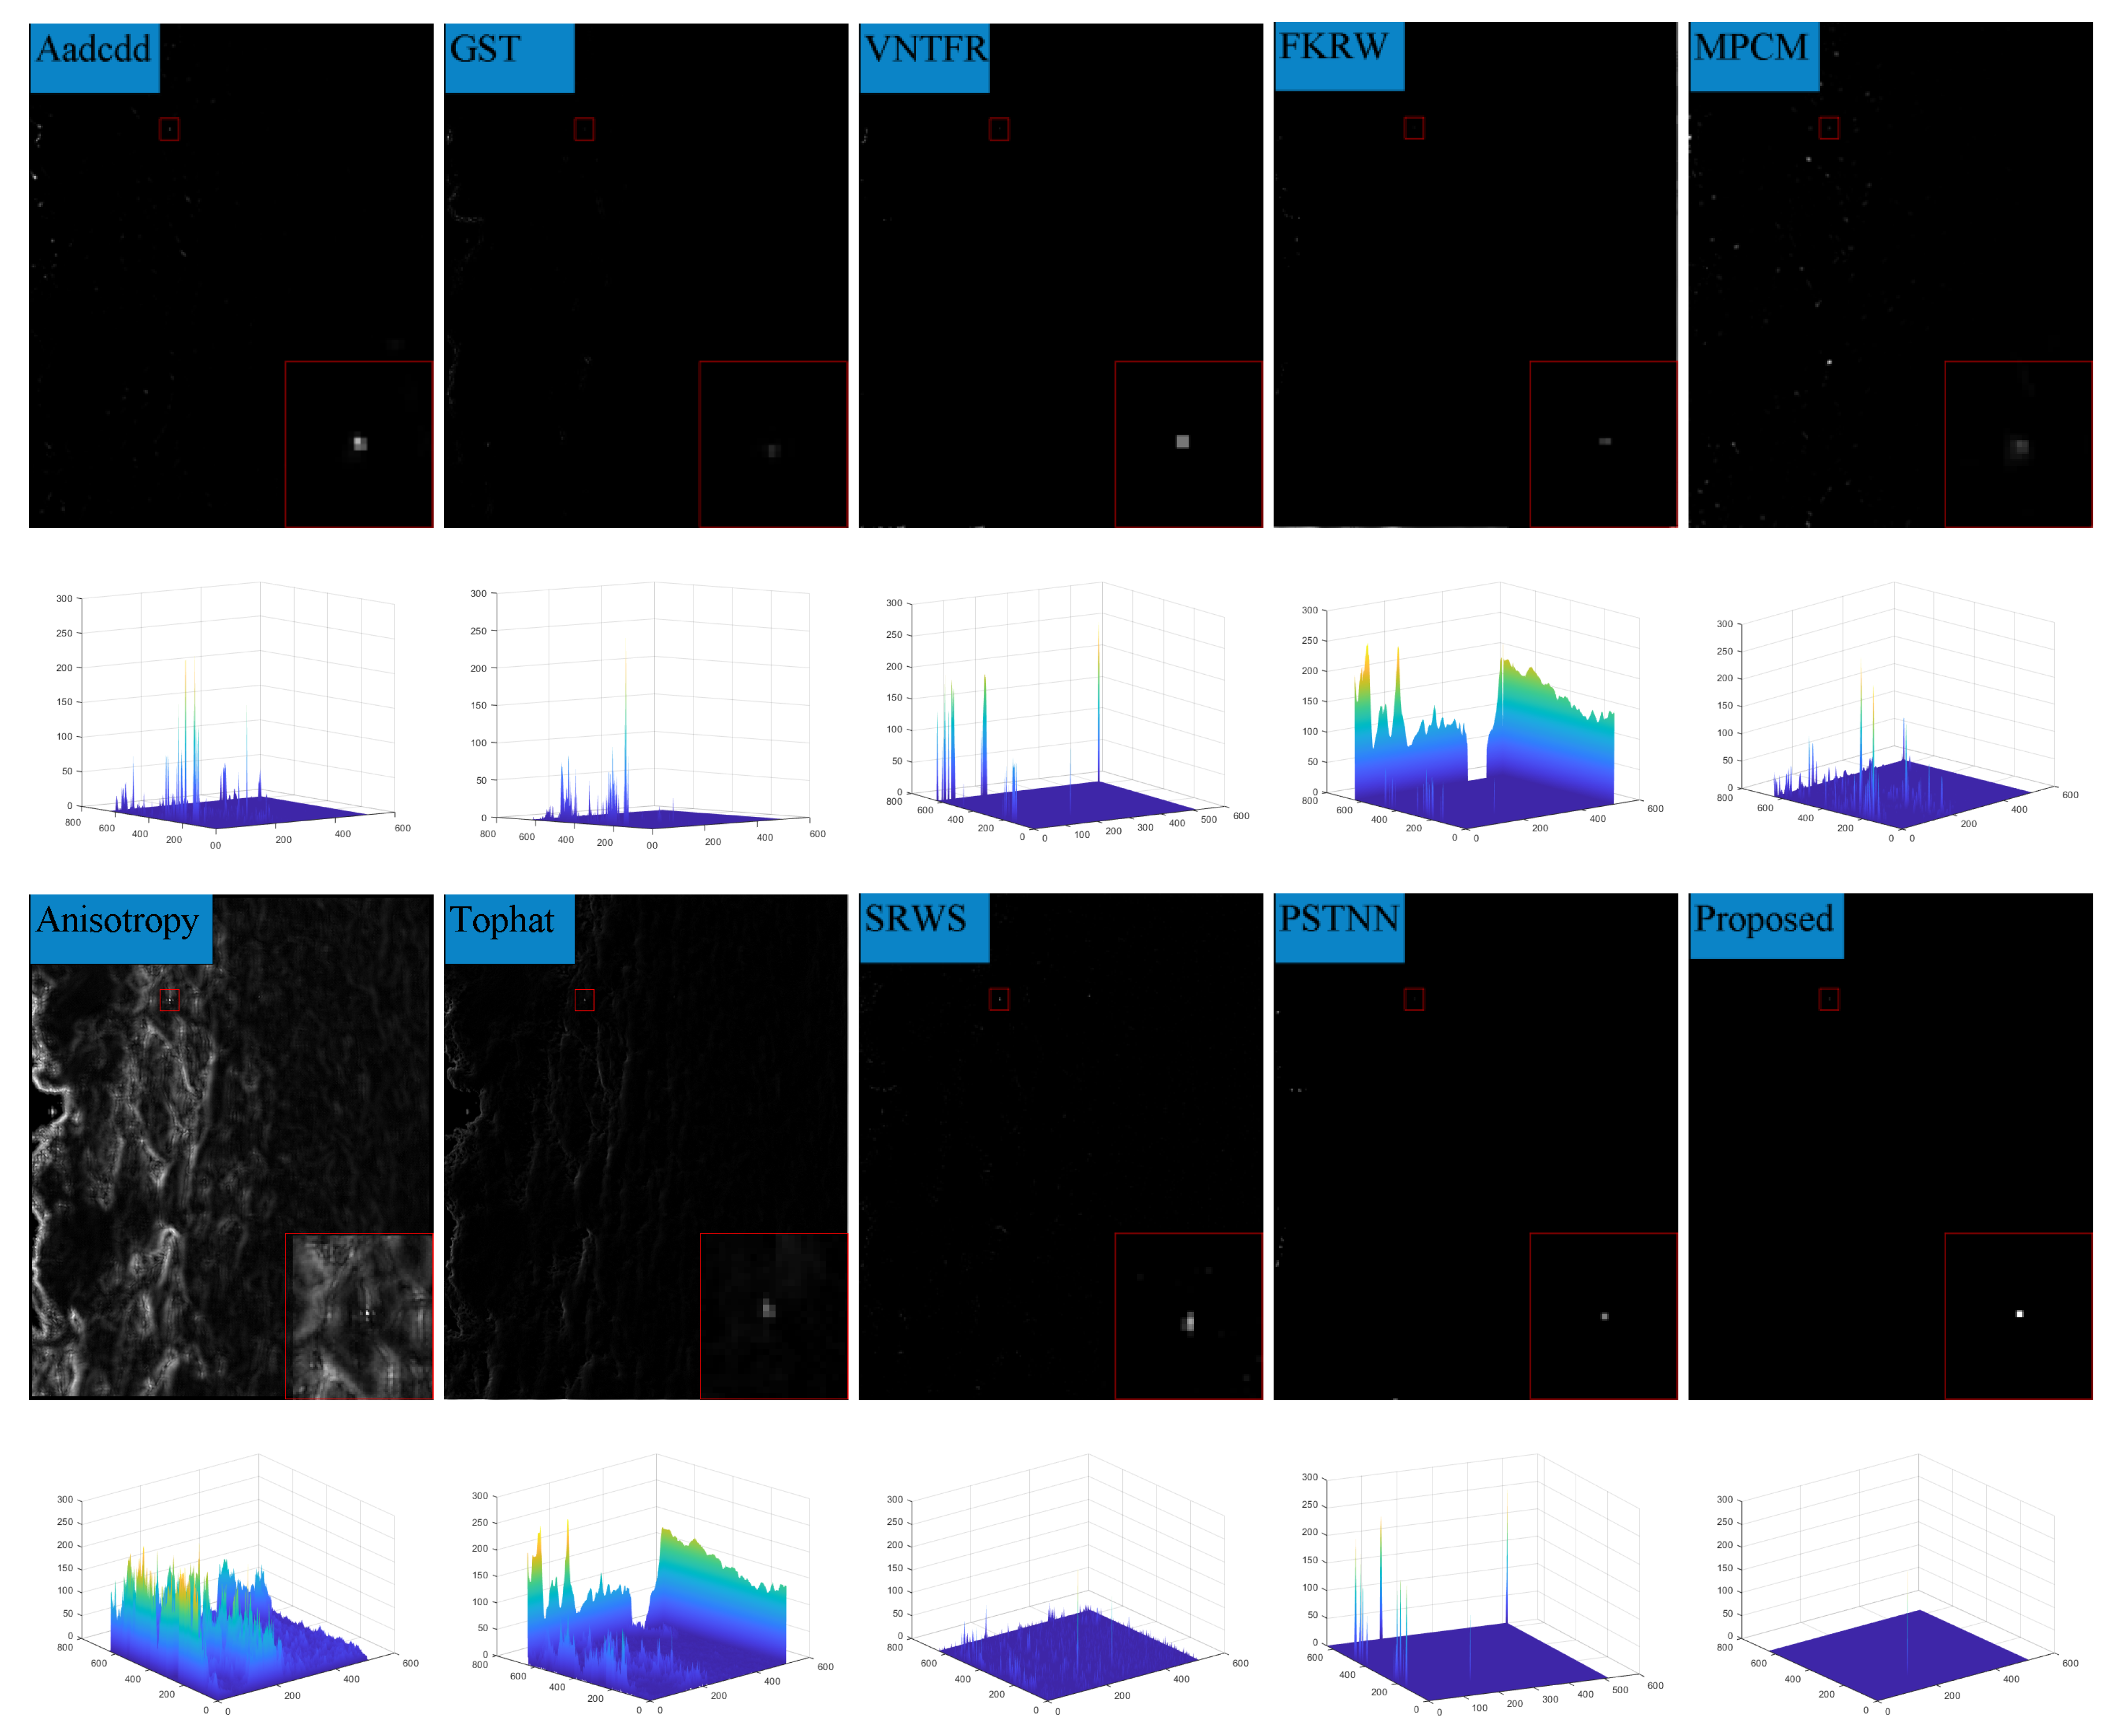
Figure 15.
(a–f) represents the ROC curves for the ten algorithms under six scenarios.


Table 1.
Scene 1–3 Bsf and SNR.
| Method | Scene 1 | Scene 2 | Scene 3 | |||
|---|---|---|---|---|---|---|
| Bsf | SNR | Bsf | SNR | Bsf | SNR | |
| Anisotropy | 24.79 | 2.17 | 16.87 | 2.15 | 29.45 | 2.94 |
| Top_hat | 67.26 | 8.84 | 39.13 | 6.14 | 76.07 | 6.92 |
| mpcm | 424.01 | 13.94 | 75.83 | 11.64 | 316.09 | 14.07 |
| GST | 640.39 | 15.30 | 124.10 | 10.46 | 217.61 | 10.21 |
| VATF | 92.30 | 10.54 | 35.83 | 6.24 | 78.51 | 6.26 |
| FKWR | 187.01 | 11.39 | 46.23 | 7.06 | 73.58 | 7.24 |
| SRWS | 1.43 | 11.95 | 1.04 | 13.92 | 1.91 | 14.51 |
| Aadcdd | 428.21 | 14.49 | 113.59 | 9.05 | 246.90 | 11.21 |
| PSTNN | 307.94 | 15.07 | 87.53 | 9.62 | 186.54 | 10.65 |
| Proposed | 744.35 | 16.92 | 469.04 | 16.03 | 827.34 | 14.54 |
Table 2.
Scene 4–6 Bsf and SNR.
| Method | Scene 4 | Scene 5 | Scene 6 | |||
|---|---|---|---|---|---|---|
| Bsf | SNR | Bsf | SNR | Bsf | SNR | |
| Anisotropy | 31.93 | 5.92 | 23.65 | 3.17 | 29.73 | 5.93 |
| Top_hat | 80.27 | 8.86 | 57.09 | 8.93 | 80.31 | 5.92 |
| mpcm | 365.00 | 15.77 | 334.98 | 14.35 | 261.97 | 9.75 |
| GST | 473.14 | 14.38 | 407.67 | 12.63 | 489.30 | 8.76 |
| VATF | 53.78 | 6.85 | 132.99 | 13.46 | 369.76 | 7.92 |
| FKWR | 103.34 | 10.44 | 173.07 | 12.27 | 87.48 | 1.20 |
| SRWS | 1.68 | 15.23 | 1.04 | 15.17 | 1.70 | 16.68 |
| Aadcdd | 574.57 | 15.28 | 403.66 | 12.87 | 347.99 | 13.71 |
| PSTNN | 223.49 | 12.59 | 221.20 | 14.92 | 408.40 | 8.68 |
| Proposed | 513.87 | 16.22 | 424.06 | 16.13 | 1753.70 | 18.04 |
Table 3.
Descriptions of the sequence images.
| Sequence | Size/Pixels | Length/Frames | Description of Sequence |
|---|---|---|---|
| Seq. 1 | 256 × 256 | 100 | The target is in the shape of a dot, and the background of the picture is grass. |
| Seq. 2 | 256 × 256 | 59 | The target is in the shape of a dot, and the background of the picture is a tree and a bright road. |
| Seq. 3 | 256 × 256 | 100 | The target is in the shape of a dot with a bright building in the background of the picture. |
| Seq. 4 | 256 × 256 | 100 | The target is in the shape of a dot with a dark mountain and bright buildings in the background. |
| Seq. 5 | 256 × 256 | 100 | The target is in the shape of a dot; the background of the picture is a forest and a bright bare field. |
| Seq. 6 | 513 × 641 | 55 | The target is in the shape of a dot; the background of the picture is a large cloud layer and the target is submerged in the cloud layer. |
Table 4.
Average single frame run time for all methods. (Unit: seconds).
| Method | Scene 1 | Scene 2 | Scene 3 | Scene 4 | Scene 5 | Scene 6 |
|---|---|---|---|---|---|---|
| Anisotropy | 0.030574 | 0.02761 | 0.027462 | 0.027965 | 0.026676 | 0.055889 |
| Top_hat | 0.076485 | 0.078233 | 0.07718 | 0.07832 | 0.078751 | 0.219467 |
| mpcm | 0.233488 | 0.237644 | 0.234299 | 0.260856 | 0.229161 | 1.204722 |
| GST | 0.013985 | 0.013881 | 0.013755 | 0.013982 | 0.015546 | 0.030258 |
| VATF | 1.266642 | 1.231002 | 1.223736 | 1.258206 | 1.365244 | 5.830361 |
| FKWR | 0.210284 | 0.178647 | 0.203463 | 0.225881 | 0.121728 | 0.572601 |
| SRWS | 2.709106 | 2.65044 | 2.66639 | 3.104156 | 2.903653 | 377.7915 |
| Aadcdd | 0.025507 | 0.036414 | 0.036629 | 0.033213 | 0.038618 | 0.151683 |
| PSTNN | 0.3873 | 0.404629 | 0.414345 | 0.407923 | 0.325582 | 1.659501 |
| Proposed | 0.253116 | 0.221659 | 0.224719 | 0.221864 | 0.204717 | 1.146247 |
Publisher’s Note: MDPI stays neutral with regard to jurisdictional claims in published maps and institutional affiliations. |
© 2022 by the authors. Licensee MDPI, Basel, Switzerland. This article is an open access article distributed under the terms and conditions of the Creative Commons Attribution (CC BY) license (https://creativecommons.org/licenses/by/4.0/).
Share and Cite
MDPI and ACS Style
Fan, X.; Wu, A.; Chen, H.; Huang, Q.; Xu, Z. Infrared Dim and Small Target Detection Based on the Improved Tensor Nuclear Norm. Appl. Sci. 2022, 12, 5570. https://doi.org/10.3390/app12115570
AMA Style
Fan X, Wu A, Chen H, Huang Q, Xu Z. Infrared Dim and Small Target Detection Based on the Improved Tensor Nuclear Norm. Applied Sciences. 2022; 12(11):5570. https://doi.org/10.3390/app12115570
Chicago/Turabian StyleFan, Xiangsuo, Anqing Wu, Huajin Chen, Qingnan Huang, and Zhiyong Xu. 2022. "Infrared Dim and Small Target Detection Based on the Improved Tensor Nuclear Norm" Applied Sciences 12, no. 11: 5570. https://doi.org/10.3390/app12115570
Note that from the first issue of 2016, this journal uses article numbers instead of page numbers. See further details here.