
The Effect of Fines Content on Compressional Behavior When Using Sand–Kaolinite Mixtures as Embankment Materials


1
Department of Research and Development, Techo Sen Institute of Public Works and Transport, Ministry of Public Work and Transport, 598, Phnom Penh 12000, Cambodia
2
Advanced Railroad Vehicle Division, Korea Railroad Research Institute, Uiwang 16105, Korea
3
Advanced Railroad Civil Engineering Division, Korea Railroad Research Institute, Uiwang 16105, Korea
4
Department of Civil Engineering, Gangneung-Wonju National University, Jukheon-gil 7, Gangneung-si 25457, Korea
*
Author to whom correspondence should be addressed.
Appl. Sci. 2022, 12(12), 6050; https://doi.org/10.3390/app12126050
Submission received: 2 May 2022
/
Revised: 7 June 2022
/
Accepted: 8 June 2022
/
Published: 14 June 2022
(This article belongs to the Topic Advances in Construction and Project Management)
Abstract
:In South Korea, Honam High-Speed Railway has a relatively large residual settlement issue and high fines content has been pointed out as one of the causes. Design guidelines regulate not to use soils containing fines content higher than 25%. However, there is no background information on the effect of fines content on settlement. Therefore, this paper aims to investigate compressional behavior according to fines content using sand and kaolinite. Oedometer test results showed that the compression index is lowest with fines content of 15% to 20% at which the mixture produced maximum density. The optimum fines content for inducing low settlement would be 15% to 20% for the sand–kaolinite mixture. Transition fines content (TFC), which shows sand-like to claylike behavior, was observed to have between 21% and 26% of fines content. Critical fines content (fcrit) where a minimum void ratio occurs was estimated as 21.67%. These behavioral changes appear when fines content is greater than the optimum fines content. SEM also shows that the kaolinite particles were overlapped, creating flat surfaces with a fines content higher than 30%, and showing clay-like behavior. Based on the analysis results, engineers can simply identify the behavior of embankment materials to ensure optimum fines content and consequently minimize long-term settlement potential.
1. Introduction
In South Korea, Honam High-Speed Railway was constructed as a concrete slab track and opened to the public in 2015. Some sections of high embankment in the Honam High-Speed Railway have produced large residual settlement. Geotechnical engineers investigated the causes of the residual settlement and pointed out that the presence of fine materials was one of the potential causes that could induce high creep settlement [1]. Soeung et al. [2] concluded that embankment materials for railway or road constructions in Korea habitually contain silty and clayey soils which would result in residual settlement. Regarding residual settlement of embankments, Korea Rail Network Authority regulated that fines contents should not be greater than 25% as embankment materials and 12% to 25% of fines needed to be stabilized (KDS, 2021). These regulations do not have mechanical background on the amount of fine particles that should be used.
Many researchers have studied the behavior of fines content. The ratio of low-plastic fine grains in the clayey soil has a major influence on the behavior of sand–silt mixtures including both physical (index void ratio and relative density) and mechanical properties (instability, critical state, strength, and stress-dilatancy). For instance, the presence of kaolinite clay, as fine particles in sand grains, changes the engineering properties of sandy soils. The behavior of sand–silt mixtures has been investigated by researchers for low, intermediate, and high contents of fine particles [3,4,5]. Pitman et al. [6] carried out a laboratory study to observe the effect of fines (kaolinite, crushed silica fines, and 70–140 silica sand) and gradation on the collapse behavior of loosely compacted soil mixtures. The experimental results showed that an increase in fines content has a noticeable effect on the undrained condition at large strains, while the gradation variation of the sand seems to have a minor effect on the undrained condition. Osipov et al. [7] investigated the mechanism of liquefaction for the artificial mixture of sand with various clay contents by means of a ring shear apparatus. They could divide liquefiable and non-liquefiable clayey soils according to plasticity index. Moreover, the increase of clay content (bentonite clay) increased the liquefaction resistance. Monkul and Ozden [8] conducted oedometer tests on kaolin-sand mixtures to investigate compression behavior based on transition fines content (TFC). The results showed that when the fines content was below the TFC, the mixture behaves like sand–silt mixtures while, in the range exceeding the TFC, silt controls the compression behavior. Belkhatir et al. [9] carried out undrained monotonic triaxial tests on sand with non-plastic silt. The outcomes indicated that undrained shear strength can be linked to the fines content, intergranular void ratio, and saturated hydraulic conductivity. Phan et al. [10] studied the effects of low-plastic silt content on geotechnical properties based on the static triaxial, cyclic triaxial, and resonant column tests. Their results indicated that an increase in silt content caused an increase in cohesion and a decrease in the internal friction angle, cyclic stress ratio, and maximum shear modulus. Hsiao et al. [11] performed drained and undrained triaxial compression tests with the specimens of sands with low plastic fines content. The results showed that an increasing fines content gradually causes a high compressibility of sand–silt mixture.
Judging by the aforementioned studies, most of the research has been concerned with the overall effect of fines content on simple artificial mixtures. In South Korea, embankment materials consist of low-plastic fines. In this sense, sand and kaolinite have been selected to simulate embankment materials in a simple and systematic way. As a first step to investigate the effect of fines content on settlement behavior, sand–kaolinite mixtures were mixed according to fines content and tests were conducted under controlled conditions. This paper aims to investigate the effect of fines content on basic material properties and settlement characteristics, and thus to provide the background to fines content limitations for embankment materials in order to reduce residual settlement. Fundamental material properties were measured including compaction and oedometer tests. In addition, the effect of particle size and shape was investigated by using Scanning Electron Microscope (SEM) images. The outcomes of this study can offer useful information for investigating the behavior of embankment materials containing low-plastic fines and provide a background or a basis for proper guidelines for the selection of embankment materials.
2. Test Materials and Program
CEN standard sand and kaolinite are used to simulate embankment materials and the effect of fines content. The host material is CEN standard sand or ISO sand [12]. CEN standard sand is an artificial product consisting of several different sand fractions produced industrially by sieving. Its grain size distribution and related basic properties are provided as shown in Figure 1. The initial moisture content is less than 0.2%. The second material is kaolinite clay which is one of the most common minerals of natural clays. As an abundant mineral in soils and deposits, it has been frequently used to enhance the mechanical stability of soil structures via interaction with other soil particles [13,14]. The value of liquid limit, plastic limit, and plastic index for kaolinite are 34.98, 29.86, and 5.12, respectively. Moreover, its grain size distribution is also indicated in Figure 1 and was obtained by sieve analysis (wet sieving) and a hydrometer test with materials passing #200 sieve.
2.1. Index Properties of Mixtures
Mixtures of CEN sand and kaolinite were prepared for the tests with 8 different ratios of kaolinite (10, 15, 20, 25, 30, 40, 60, and 70% of KC (kaolinite clay) over the CEN sand weight). The mixtures were manually mixed in a container, then were put in an oven for 24 h. The dried mixtures were used to perform basic property tests such as a specific gravity test [15], sieve analysis [16], and Atterberg limit [17]. The results are summarized in Table 1. Figure 2 shows the gradation of all the mixtures.
2.2. Compaction Test
As soil is compacted, bearing capacity and stability increased while permeability, erosion, subsidence, and heaving from freeze-thaw cycles were reduced. In this regard, embankment material needs to be well-compacted. In order to investigate the effect of fines on compaction, compaction tests were performed according to ASTM D-698 [18] and D-1557 [19] with method D. The optimal water content (wopt) and the maximum dry unit weight (γd,max) were mainly compared.
2.3. Oedometer Test
One-dimensional consolidation tests were carried out by the standard method of measuring compression properties [20]. Samples were fabricated using the optimum water content (Wopt) obtained from the compaction tests and compacted up to 90% of maximum dry unit weight (γd,max). The 90% of the degree of compaction was similar to the field condition where KDS [21] regulated the desired degree of compaction of 90% for earth embankments.
Step loading was applied from 24.5 kPa to 784 kPa with a standard load increment ratio (LIR) of unity. The applied load doubled in each loading step (e.g., 24.5, 49, 98, 196, 392, 784 kPa). The diameter and height of the specimens were 58 and 20 mm, respectively. Figure 3 presents the picture of all specimens extracted after the oedometer tests.
2.4. Scanning Electron Microscope Image
To observe the microstructure of the mixtures (bonding structure, physicochemical component, grain size, and shape), high resolution images with high magnifying power were examined as the representative samples. FE-SEM (Field Emission Scanning Electron Microscope, Model: LEO SUPRA 55, Carl Zeiss, Jena, Germany) which can capture a number of photos in magnifications from 12× to 2,000,000× was used. The equipment can analyze the shape, structure, and components of a substance by detecting various signals generated on the sample surface. Figure 4 shows the setup of the Scanning Electron Microscope used in this study.
3. Test Results and Discussion
3.1. Compaction Test Results
Moisture-unit weight curves for all specimens were established using a modified Proctor compaction test [18,19]. Figure 5 represents the results of optimum water content (Wopt) and maximum dry unit weight (γd,max) in terms of various fines contents.
The overall trend shows that the optimum water content increased with an increase of fines content. This trend can be explained by the water absorption capacity of kaolinite clay [22,23]. It was also noticeable that the γd,max increased and then decreased after the fines content reached 20%. Generally, the presence of low-plastic fines in the soil could make the soil soft and weak (i.e., the value of γd,max decreases). However, the mixtures with fines contents of 15% and 20% enable the soil to achieve higher γd,max. Rearrangement of soil particles in these two mixtures could change the soil structure from a loose to dense state better than other mixtures. In other words, the fines (kaolinite) fill the void between granular particles, thus the mixtures are compacted better. However, as the fines content increases or decreases above or below 15 to 20%, the fine materials behave like obstacles to the compaction.
3.2. Void Ratio
The test results of the mixtures of CEN sand and kaolinite clay demonstrate that the characteristics of the mixtures are ascribable to the presence of the kaolinite in the samples tested in an oedometer. From the one-dimensional compression results, it was proved that the presence of kaolinite had a significant effect on the compressibility of the soil under various loading conditions. The variation of void ratio with vertical effective stress in each fines content are presented in Figure 6 and Figure 7. As can be seen from Figure 6, the values of the initial void ratio for the mixtures are scattered in a relatively wider band (Δe = 0.38) and the differences became smaller at the end of the test (Δe = 0.33). Compared to the variation of the initial void ratio in each mixture, the change of void ratio by increasing vertical effective stress from 24.52 kPa to 784.53 kPa was very small (about 0.84 on average). This is because the initial condition was determined by the compaction with 90% of the maximum dry density. Under the higher compaction energy, the specimen showed a higher strength and lower settlement leading to lower void ratio change [24]. Regarding the percentage of fines content, the change of void ratio in low fines content was smaller than that in high fines content. This is because the fines do not participate in the resistance of shear in the case of low fines content; on the contrary, the sand grains contribute to the shearing resistance under the high fines content [5].
In Figure 7, the 3D graph clearly illustrates the overall behavior of the mixtures: as the fines content increased, the initial void ratio also increased. The vertical effective stress led to an overall decrease in the void ratio. However, exceptional change was observed; that is, even though fines content increased from 15% to 20%, the void ratio decreased regardless of vertical effective stress. This phenomenon is similar to the observation in Figure 6, where maximum dry density increased until fines content became 20%. Beyond 20% of fines content, maximum dry density decreased. Therefore, it can be concluded that a specific range of fines content would improve a mixtures’ behavior. In the case of the sand–kaolinite mixture, the soil that contained 15% and 20% of fines is appropriate in embankment construction when considering minimum residual settlement.
3.3. Behavioral Analysis
3.3.1. Transition Fines Content
Many researchers have reported that the intergranular void ratio has a strong correlation with various aspects of silty sand behavior [25,26,27,28,29]. The concept of the intergranular void ratio is referred to as the void ratio where the part of volume of voids is occupied by the fine and this can be determined by Equation (1) [30]:
in which G is the specific gravity of the soil itself or the mixture, Gs is the specific gravity of the host material, Gf is the specific gravity of fines, e is the void ratio, and es is the intergranular void ratio.
Monkul and Ozden [31] suggested that transition fines content (TFC) could be an indicator that can classify a mixture’s behavior into granular-dominant or clayey-dominant. The TFC can be signified when the value of the intergranular void ratio (es) is equal to the maximum void ratio of the host material (emax). In this study, the CEN standard sand had an emax = 0.7, obtained from the relative density test [32] and the values of es were computed by using Equation (1) with Gs = 2.607 and Gf = 2.8. The variation of intergranular void ratio with fines content in each vertical effective stress is indicated in Figure 8.
As a general observation, the es was found to increase with an increase of fines content. The TFCs can be estimated by the intersection of the red dashed line (emax). Therefore, the possible range of TFC was 21 to 26% for six different vertical effective stresses (24.52–784.53 kPa), respectively. The TFCs are shown in Table 2 and increase according to the vertical effective stress. This is because the higher effective stress led to more contact among granular materials, thus, higher TFCs were produced [8].
3.3.2. Behavioral Threshold Analysis
A behavioral threshold can be defined as a threshold where a small change in mixing ratio resulted in a significant change in overall behavior or response of the soil. The behavioral thresholds exist at a critical fines content where a minimum void ratio occurs; in other words, it happens when the voids between coarse particles are fully filled by fine particles [33]. Choo and Burns [34] and Yang et al. [5] described critical fines content fcrit as a function of minimum void ratio and specific gravity (Equation (2)):
where emin,c is the minimum void ratio of the coarse particles, emin,f is the minimum void ratio of the fine particles, Gs is the specific gravity of the host material, and Gf is the specific gravity of fines.
To identify the behavioral threshold of sand–kaolinite mixture, the value of emin,c = 0.49, emin,f = 0.9, Gs = 2.607, and Gf = 2.80 were used. As a result, the critical fines content fcrit was equal to 21.67%. Therefore, this critical fines content is where the threshold was defined as the point changes in sand–kaolinite mixture ratio result in behavior changes. Moreover, this value was found within the possible range of transition fines content (21–26% KC) which was obtained from experimental observation. In other words, this value of fcrit could be related to the TFCs.
3.3.3. Compression Behavior
In order to better observe the compression behavior of the mixtures, the parameters of the global and granular compression indices (Cc and Cc-s) were utilized. The physical meaning of granular compression index (Cc-s) is similar to the global compression index (Cc) and can be expressed as the Equations (3) and (4) [20], respectively:
in which e is the void ratio, es is the intergranular void ratio, and σ1′ and σ2′ are the vertical effective stress (kPa).
Figure 9 represents the variation of maximum dry unit weight (γd,max) and the global and granular compression indices (Cc, Cc-s) according to fines contents (fc). As can be seen from Figure 9, the trend showed an increasing trajectory for both Cc and Cc-s and a decreasing one for γd,max. However, the value of Cc at the high fines content (i.e., 40%, 60%, and 70% of fines content) were found to gradually increase compared with Cc-s. This is because the value of Cc could define that there are sand particles which participate in the deformation control of the mixtures, while the value of Cc-s signified that at high fines content, the deformation was controlled by fine grains. It is recommended that the parameter of Cc-s can be used for future studies on the settlement of sand–kaolinite mixture. It was noted that the values of Cc and Cc-s at 15% and 20% of fines content decreased while γd,max increased. That is to say, fines content of 15% to 20% makes the mixture behave differently. A certain level of fines content would enhance compacting efficiency, which results in a low compression index (i.e., small residual settlement). For sand–kaolinite mixture, around 15% to 20% of fines content are the optimal ratio. Henceforth, one could assume that the presence of kaolinite clay at a certain amount (15% and 20%) could also provide a significant effect to reduce the creep settlement in well-compacted conditions. This certain amount can be called optimum fines content (fopt), at which the minimum creep settlement would happen.
3.3.4. Particle Shape Analysis
It is well-known that the engineering properties (shear strength, compressibility, and permeability) of soil mixtures are affected by the shape of soil particles [35]. The particle size and shape of the mixture can be estimated by crystallographic structure, surface area, and particle volume [36]. In this study, the particles of CEN sand are generally isometric and have angular shape, and the clay particles (kaolinite) have a hexagonal plate shape (Figure 10).
In the mixture of 10% KC in Figure 11, we can see the smooth surface of a sand particle under kaolinite particles. However, with the mixture which has the amount of kaolinite up to 25%, the kaolinite particles were found to take over the sand grains—findings consistent with previous research [22]. In Figure 11, the particle shape in all mixtures was with 10,000× (i.e., 10,000 times magnification) and 100,000× magnification by SEM.
Additionally, also observed in SEM photos (100,000×), the present kaolinite particles were found to be large as kaolinite content increased. Moreover, with the content of kaolinite up to 30%, the kaolinite particles were contacted one to another creating flat surfaces (blue solid line) from small to large according to the percentage of kaolinite as can be seen in photos with 10,000× magnification. For this reason, the fines particles could not fully fill in the voids between sand particles which also leaves high local porosity between the kaolinite particles themselves resulting in an effect on the packing density of CEN sand. Therefore, with the high percentage of kaolinite (60% and 70% KC), the sand grains were assumed to float in the fines grain network and were regarded as void in the mixture.
3.3.5. Behavioral Variation
Based on the aforementioned analysis, we could identify the different types of behavior of the embankment materials (Figure 12) according to fines content. TFC (transition fines content) indicated a boundary of sand-like and clay-like behavior of the mixtures, and this possible range of the tested mixture was around 21% to 26%. The optimum fines content (fopt), defined as the fines content that produces greatest dry density, was around 15% to 20%. The critical fines content was 21.67%.
Since the clayey soil (low plasticity) has its own optimum fines content which could provide a denser state, low compression index, and low void ratio, engineers could consider using the soil with fopt as an embankment material. Based on the observations in this research, there could be three simple approaches to specify the value of fopt: (1) simple compaction test with method D, (2) identification of the possible transition zone, and (3) determination of the critical fines content. However, these three approaches are based only on the sand–kaolinite mixtures. For a more specific method to define optimum fines content, more laboratory tests are required.
4. Summary and Conclusions
Based on the fact that embankment materials in South Korea contain low plastic fines, kaolinite was selected as a fine material. Sand represents granular materials of the embankment to simplify the testing matrix. Sand–kaolinite mixtures were tested by changing the fines content. The basic material properties gradually vary as fines content increased. Maximum dry density tended to decrease according to fines content; however, it slightly increased at fines content of 15% and 20%. One-dimensional compression tests (i.e., oedometer tests) provided details on settlement behavior in terms of fines content. To categorize behavior of sand–kaolinite mixture, the transition fines content (TFC), defined as an intergranular void ratio in which the maximum void ratio of the host material (i.e., sand) is equal to, was adopted. SEM images were taken and analyzed to investigate the microscale grain network of the sand–kaolinite mixtures. The findings of this study can be summarized as follows:
- An increase in fines content caused an increase in both void ratio and compression index. However, settlement-related properties such as e, Cc, and Cc-s decreased or showed the smallest values. Maximum dry density of 15% and 20% of fines content was also the greatest.
- Presence of fine materials at a certain amount, 15% and 20% of kaolinite in this study, played a role in helping ensure better compaction. Therefore, appropriate fines content of embankment materials resulted in less deformation.
- With the mixture of 10% KC, the smooth surface of a sand particle under kaolinite particles can be seen in the SEM images. However, in the mixture with up to 25% kaolinite content, the kaolinite particles were found to take over the sand grains. Moreover, the kaolinite particles were overlapped, creating large flat surfaces with the fines content higher than 30%, and inducing the claylike behavior of mixtures.
- Transition fines content of sand–kaolinite mixture was about 21% to 26%. Different types of behavior were identified: a transition zone (21% ≤ fc ≤ 26%), which was a behavioral change point of the mixture; sand-like behavior (fc < 15%), which was when the mixture behaved like sand; clay-like behavior (fc ≥ 30%), which was when the mixture behaved like clay, and an optimum fines content (15% ≤ fc ≤ 20%) which induced a low compression index.
Based on oedometer tests and compaction tests, 15% to 20% of fines content of sand–kaolinite mixture is the most appropriate fines content for inducing the least settlement. Transition fines content, critical fines content, optimum fines content (mentioned above) were similar to those of e, Cc, and maximum dry density. Therefore, the best fines content or transition fines content can be approximately predicted by following these approaches: (1) simple compaction test with method D, (2) TFC by laboratory testing, and (3) calculation of the critical fines content. However, this approach should be verified through more laboratory and field testing with actual embankment materials used in South Korea. Consolidation settlement and long-term settlement should also be investigated according to fines content. Based on this research, the design criteria on materials, especially fines content as embankment materials, can be suggested to control residual settlement.
Author Contributions
Conceptualization, Y.-T.C.; Data curation, Y.-T.C.; Funding acquisition, S.-H.L.; Investigation, P.K. and Y.-T.C.; Methodology, C.-Y.Y.; Project administration, S.-H.L.; Supervision, S.-H.L. and C.-Y.Y.; Validation, C.-Y.Y.; Writing—original draft, P.K.; Writing—review & editing, Y.-T.C. All authors have read and agreed to the published version of the manuscript.
Funding
This research was supported by a grant from the R&D Program of the Korea Railroad Research Institute (PK2203A3), Republic of Korea and by the Basic Science Research Program through the National Research Foundation of Korea (NRF) funded by the Ministry of Education (2021R1A6A1A03044326).
Institutional Review Board Statement
Not Applicable.
Informed Consent Statement
Not Applicable.
Conflicts of Interest
The authors declare no conflict of interest.
References
- KGS. A Study on Honam High-Speed Railway; Report No. KGS20-180; Korean Geotechnical Society: Seoul, Korea, 2020. [Google Scholar]
- Soeung, S.; Lee, S.H.; Lee, S.J.; Kim, B.J.; Yune, C.Y. Causing factors of additional settlement in high-speed railways in Korea. KSCE J. Civ. Eng. 2018, 22, 3843–3851. [Google Scholar] [CrossRef]
- Lade, P.V.; Liggio, C.D.; Yamamuro, J.A. Effects of non-plastic fines on minimum and maximum void ratios of sand. Geotech. Test. J. 1998, 21, 336–347. [Google Scholar]
- Thevanayagam, S.; Shenthan, T.; Mohan, S.; Liang, J. Undrained fragility of clean sands, silty sands, and sandy silts. J. Geotech. Geoenviron. Eng. 2002, 128, 849–859. [Google Scholar] [CrossRef]
- Yang, S.L.; Lacasse, S.; Sandven, R. Determination of the transitional fines content of mixtures of sand and non-plastic fines. Geotech. Test. J. 2006, 29, 102–107. [Google Scholar]
- Pitman, T.D.; Robertson, P.K.; Sego, D.C. Influence of fines on the collapse of loose sands. Can. Geotech. J. 1994, 31, 728–739. [Google Scholar] [CrossRef]
- Osipov, V.I.; Gratchev, I.B.; Sassa, K. The mechanism of liquefaction of clayey soils (M124). In Landslides; Springer: Berlin/Heidelberg, Germany, 2005; pp. 127–131. [Google Scholar]
- Monkul, M.M.; Ozden, G. Compressional behavior of clayey sand and transition fines content. Eng. Geol. 2007, 89, 195–205. [Google Scholar] [CrossRef]
- Belkhatir, M.; Schanz, T.; Arab, A. Effect of fines content and void ratio on the saturated hydraulic conductivity and undrained shear strength of sand–silt mixtures. Environ. Earth Sci. 2013, 70, 2469–2479. [Google Scholar] [CrossRef]
- Phan, V.T.A.; Hsiao, D.H.; Nguyen, P.T.L. Effects of fines contents on engineering properties of sand-fines mixtures. Procedia Eng. 2016, 142, 213–220. [Google Scholar] [CrossRef] [Green Version]
- Hsiao, D.H.; Phan, V.T.A. Evaluation of static and dynamic properties of sand–fines mixtures through the state and equivalent state parameters. Soil Dyn. Earthq. Eng. 2016, 84, 134–144. [Google Scholar] [CrossRef]
- I.S. EN 196-1:2016; Methods of Testing Cement—Part 1: Determination of Strength. Turkish Standard Institute: Ankara, Turkey, 2002.
- Chen, J.; Anandarajah, A.; Inyang, H. Pore fluid properties and compressibility of kaolinite. J. Geotech. Geoenviron. Eng. 2000, 126, 798–807. [Google Scholar] [CrossRef]
- Huertas, F.J.; Fiore, S.; Huertas, F.; Linares, J. Experimental study of the hydrothermal formation of kaolinite. Chem. Geol. 1999, 156, 171–190. [Google Scholar] [CrossRef]
- ASTM D-854; Standard Test Methods for Specific Gravity of Soil Solids by Water Pycnometer. American Society for Testing and Materials: West Conshohocken, PA, USA, 2002.
- ASTM D-2487; Standard Practice for Classification of Soils for Engineering Purposes (Unified Soil Classification System). American Society for Testing and Materials: West Conshohocken, PA, USA, 2000.
- ASTM D-4318; Standard Test Methods for Liquid Limit, Plastic Limit, and Shrinkage Limit of Soils. American Society for Testing and Materials: West Conshohocken, PA, USA, 2017.
- ASTM D-698; Standard Test Method for Laboratory Compaction Characteristics of Soil Using Standard Effort. Annual Book of ASTM Standards. American Society for Testing and Materials: West Conshohocken, PA, USA, 2000.
- ASTM D-1557; Standard Test Method for Laboratory Compaction Characteristics of Soil Using Modified Effort (56,000 ft-lbf/ft3 (2700 kN-m/m3)). Annual Book of ASTM Standards. American Society for Testing and Materials: West Conshohocken, PA, USA, 2000.
- ASTM D-2435; Standard Test Methods for One-Dimensional Consolidation Properties of Soils. ASTM International: West Conshohocken, PA, USA, 1996. [CrossRef]
- KDS 47 10 25; Korean Design Standard. Earth Structure. Ministry of Land, Infrastructure and Transport Railway Construction Division: Sejong City, Korea, 2021. Available online: http://www.kcsc.re.kr (accessed on 15 May 2021).
- Kaothon, P.; Lee, S.H.; Choi, Y.T.; Yune, C.Y. Effect of Low-Plastic Fines Content on the Engineering Properties of Kaolinite-Sand Mixture. J. Korean Geotech. Soc. 2021, 37, 35–42. [Google Scholar]
- White, W.A.; Pichler, E. Water-Sorption Characteristics of Clay Minerals; Circular no. 266; Illinois State Geological Survey: Champaign, IL, USA, 1959. [Google Scholar]
- Chhun, K.T.; Lee, S.H.; Choi, Y.T.; Yune, C.Y. Experimental Study on the Effect of Compaction on Long-term Settlement of the Embankment of High-speed Railways. In Proceedings of the 28th International Ocean and Polar Engineering Conference, Sapporo, Japan, 10–15 June 2018. [Google Scholar]
- Murthy, T.G.; Loukidis, D.; Carraro, J.A.H.; Prezzi, M.; Salgado, R. Undrained monotonic response of clean and silty sands. Géotechnique 2007, 57, 273–288. [Google Scholar] [CrossRef]
- Ni, Q.T.S.T.; Tan, T.S.; Dasari, G.R.; Hight, D.W. Contribution of fines to the compressive strength of mixed soils. Géotechnique 2004, 54, 561–569. [Google Scholar] [CrossRef]
- Papadopoulou, A.; Tika, T. The effect of fines on critical state and liquefaction resistance characteristics of non-plastic silty sands. Soils Found. 2008, 48, 713–725. [Google Scholar] [CrossRef] [Green Version]
- Thevanayagam, S.; Martin, G.R. Liquefaction in silty soils—Screening and remediation issues. Soil Dyn. Earthq. Eng. 2002, 22, 1035–1042. [Google Scholar] [CrossRef]
- Yamamuro, J.A.; Covert, K.M. Monotonic and cyclic liquefaction of very loose sands with high silt content. J. Geotech. Geoenviron. Eng. 2001, 127, 314–324. [Google Scholar] [CrossRef]
- Monkul, M.M. Influence of Inter-granular Void Ratio on One Dimensional Compression. Ph.D. Thesis, Dokuz Eylul University, Izmir, Turkey, 2005. [Google Scholar]
- Monkul, M.M.; Ozden, G. Effect of intergranular void ratio on one-dimensional compression behavior. In Proceedings of the International Conference on Problematic Soils, Famagusta, Cyprus, 25–27 May 2005; Volume 25, p. 27. [Google Scholar]
- ASTM D4254–91; Standard Test Method for Minimum Index Density and Unit Weight of Soils and Calculation of Relative Density. Annual Book of ASTM Standards. ASTM International: West Conshohocken, PA, USA, 2006.
- Simpson, D.C.; Evans, T.M. Behavioral thresholds in mixtures of sand and kaolinite clay. J. Geotech. Geoenviron. Eng. 2016, 142, 04015073. [Google Scholar] [CrossRef]
- Choo, H.; Burns, S.E. Effect of over consolidation ratio on dynamic properties of binary mixtures of silica particles. Soil Dyn. Earthq. Eng. 2014, 60, 44–50. [Google Scholar] [CrossRef]
- Terzaghi, K. Erdbaumechanik auf Bodenphysikalischer Grundlage; F. Deuticke: Vienna, Austria, 1925. [Google Scholar]
- Santamarina, J.C.; Cho, G.C. Soil behavior: The role of particle shape. In Advances in Geotechnical Engineering: The Skempton Conference, Proceedings of the Three-Day Conference on Advances in Geotechnical Engineering, Organized by the Institution of Civil Engineers and Held at the Royal Geographical Society, London, UK, 29–31 March 2004; Thomas Telford Publishing: London, UK, 2004; pp. 604–617. [Google Scholar]
Figure 1.
Grain size distribution of CEN standard sand and Kaolinite clay.
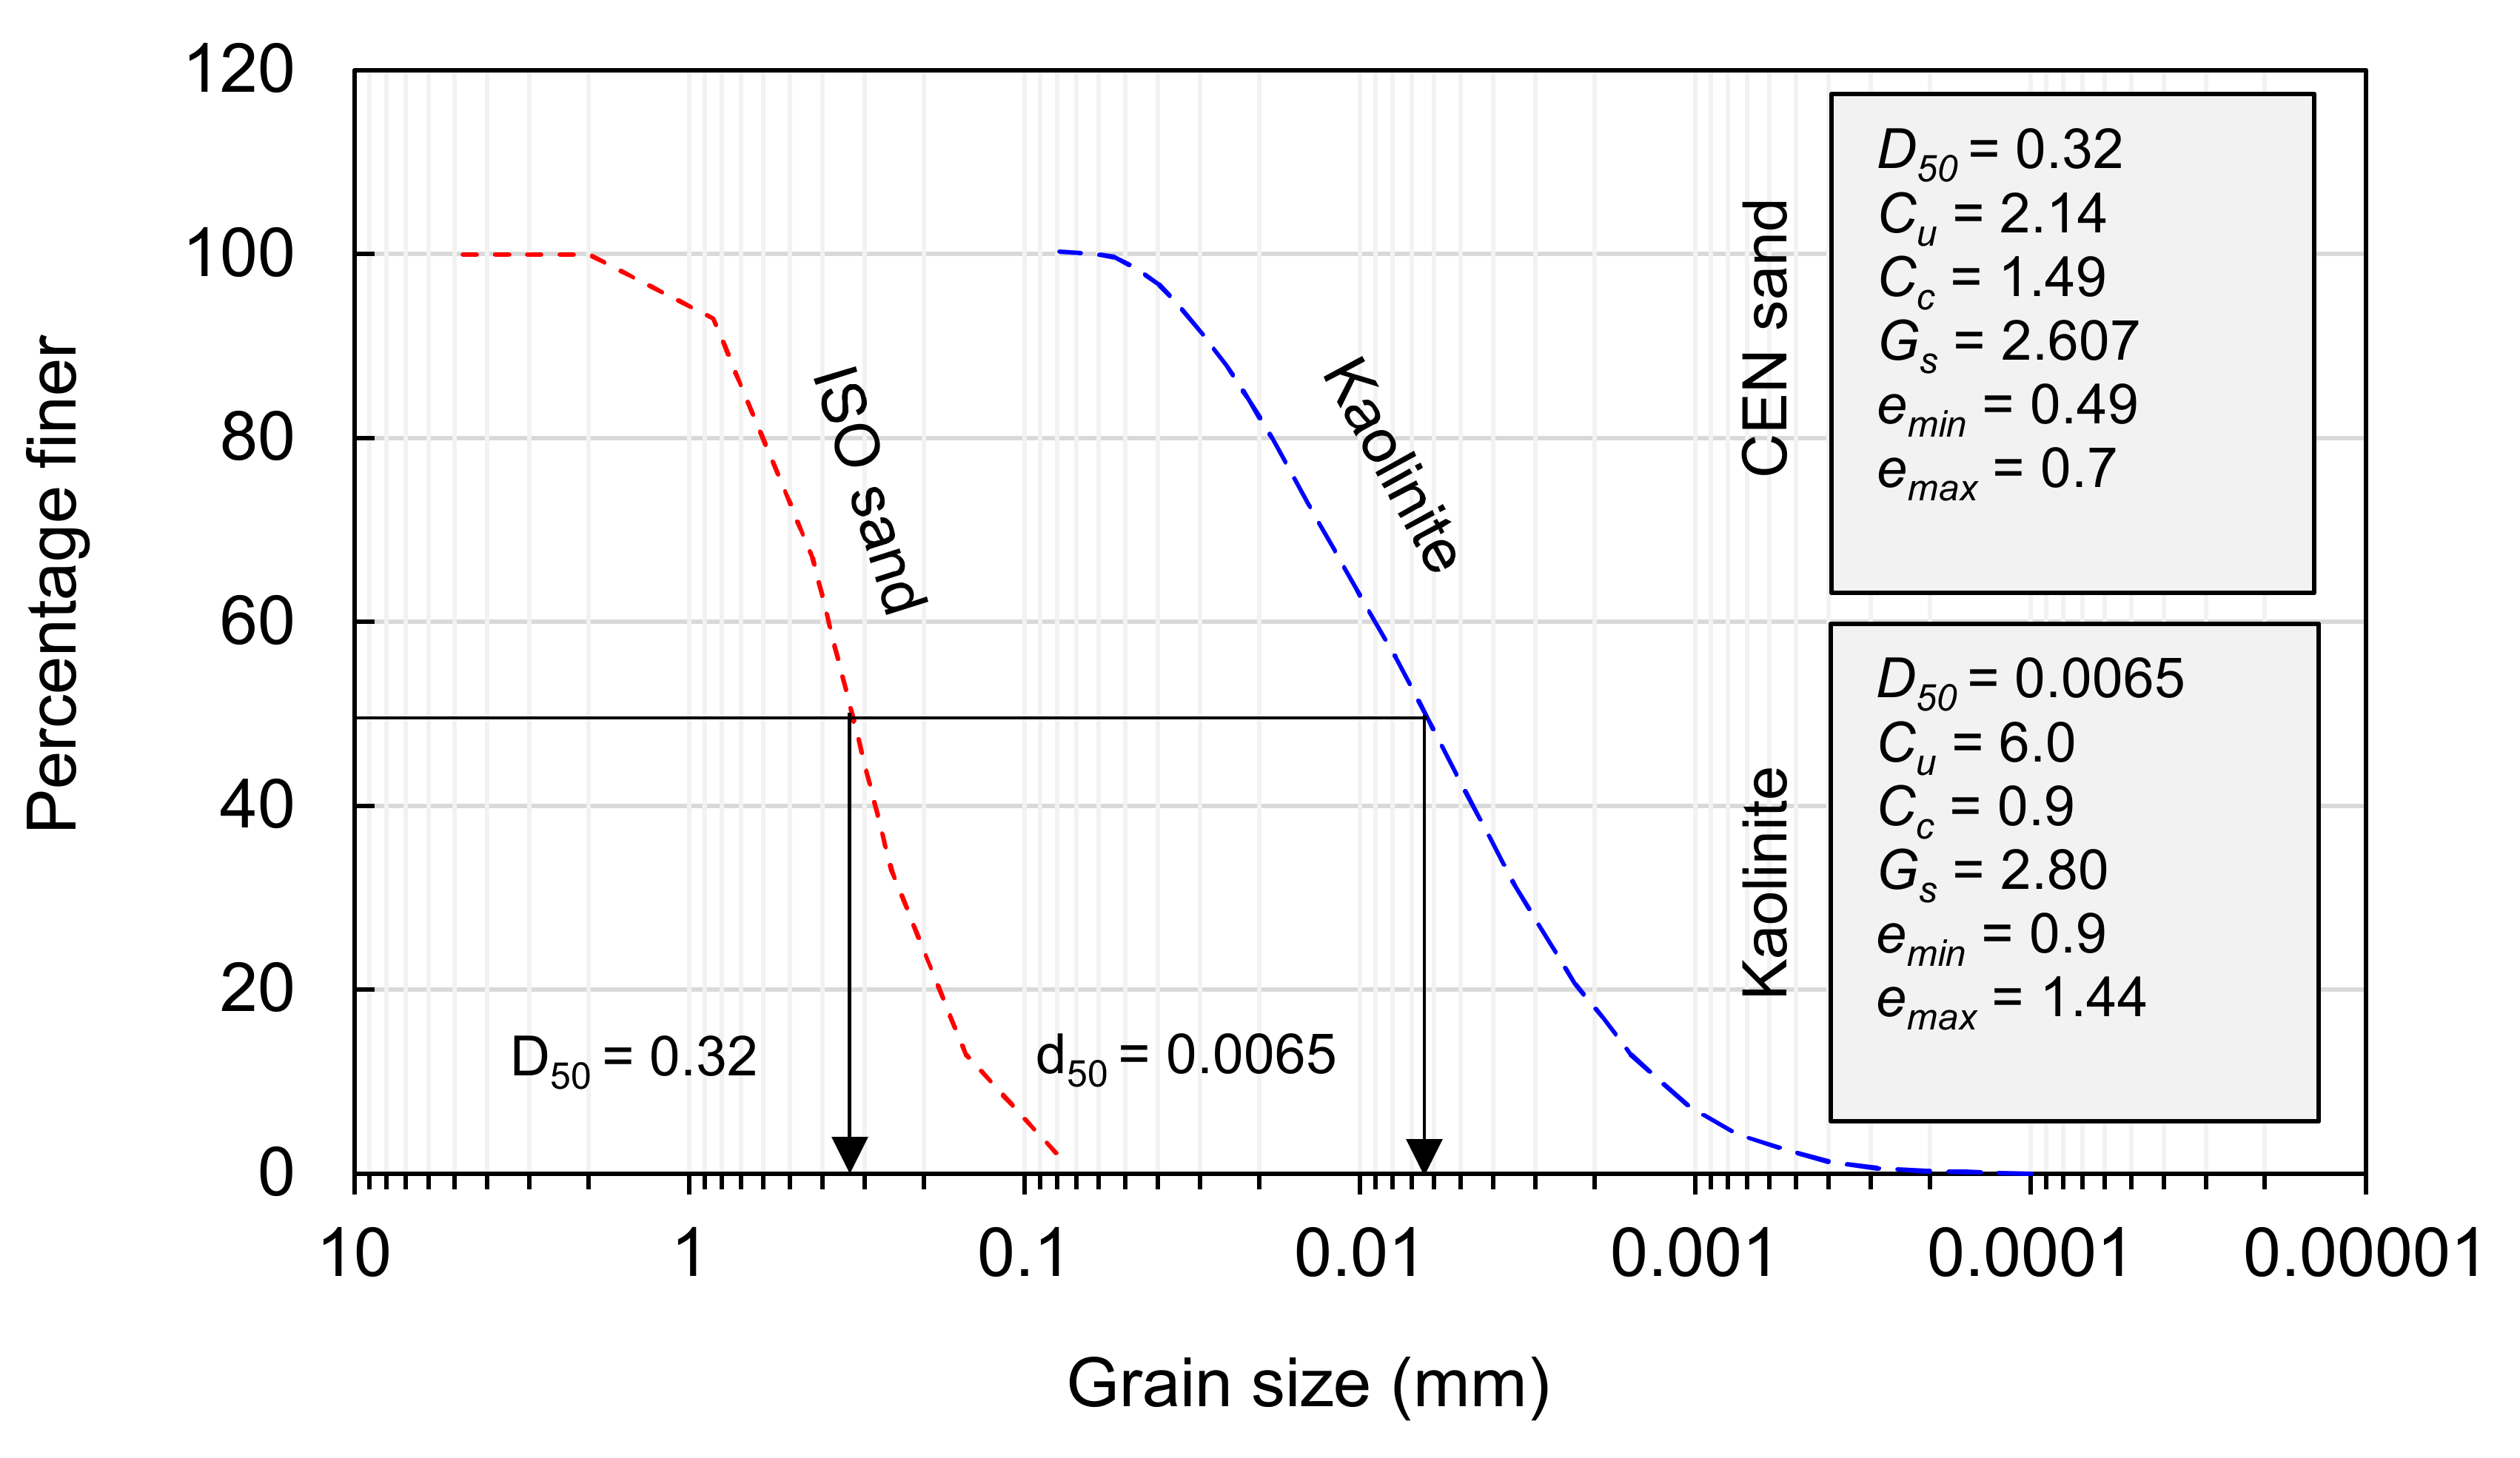
Figure 2.
Gradation of sand–kaolinite mixtures according to fines content.
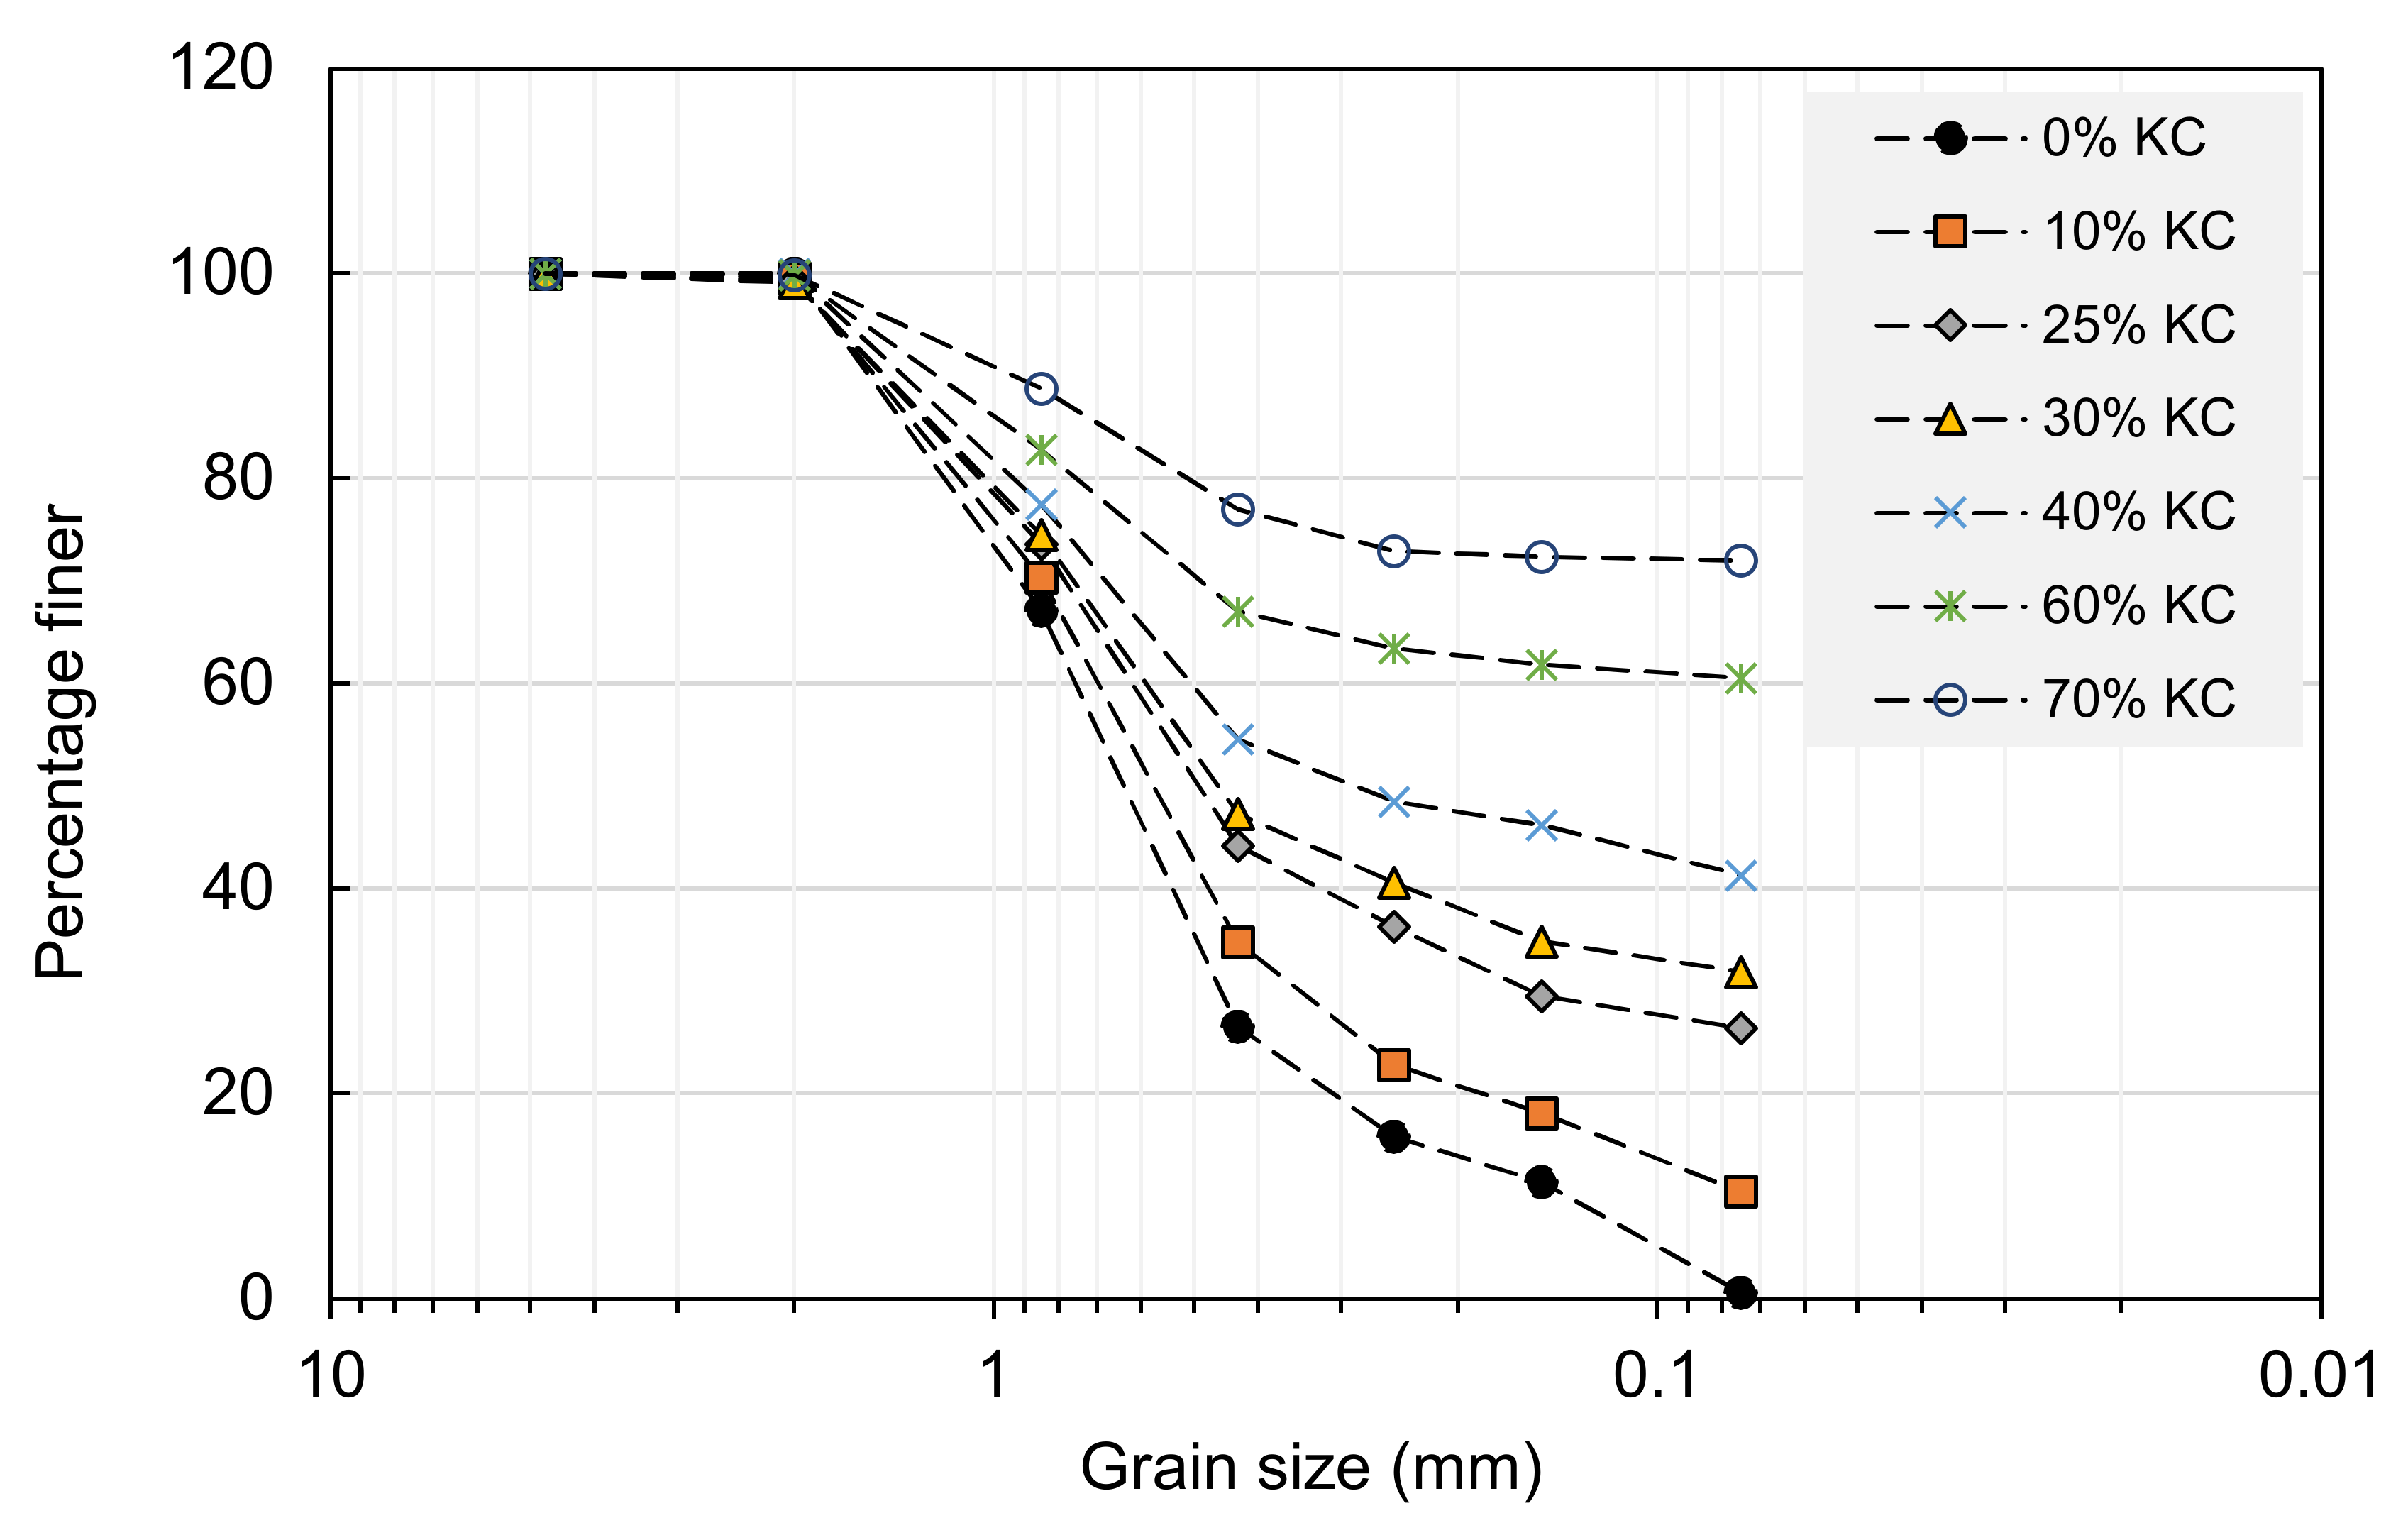
Figure 3.
Top view of all specimens after the oedometer tests.
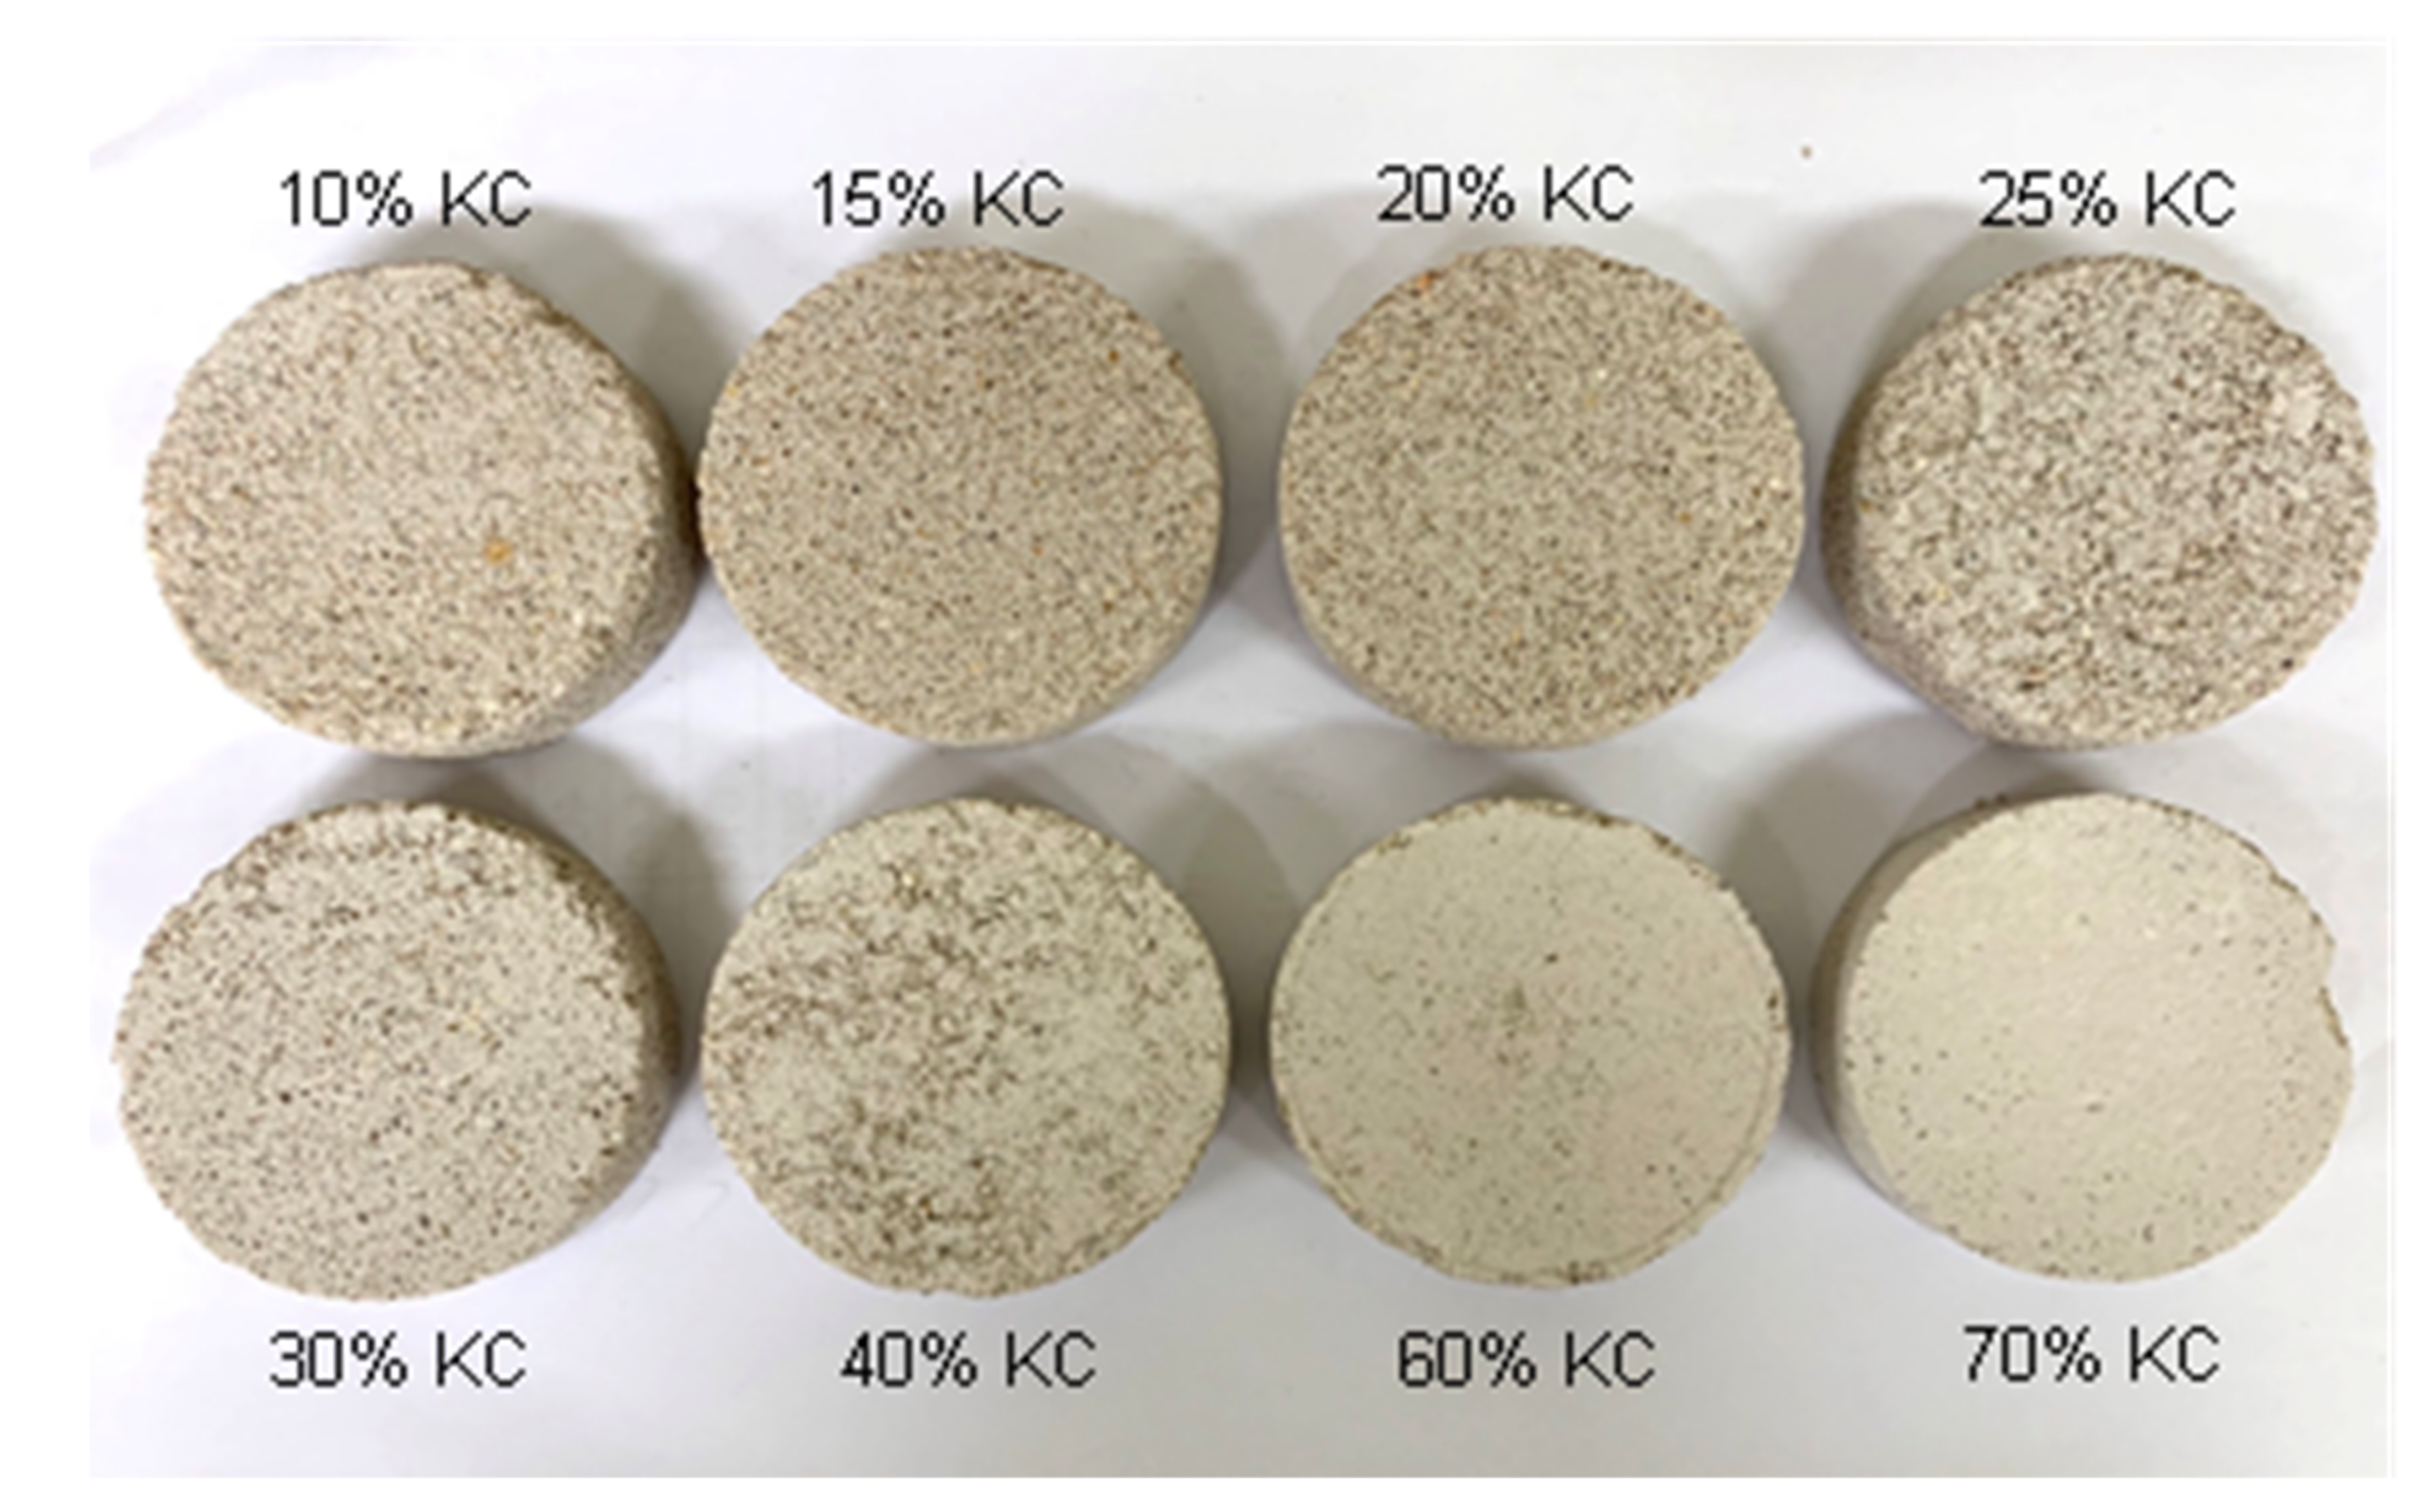
Figure 4.
Scanning Electron Microscope, Model: LEO SUPRA 55.
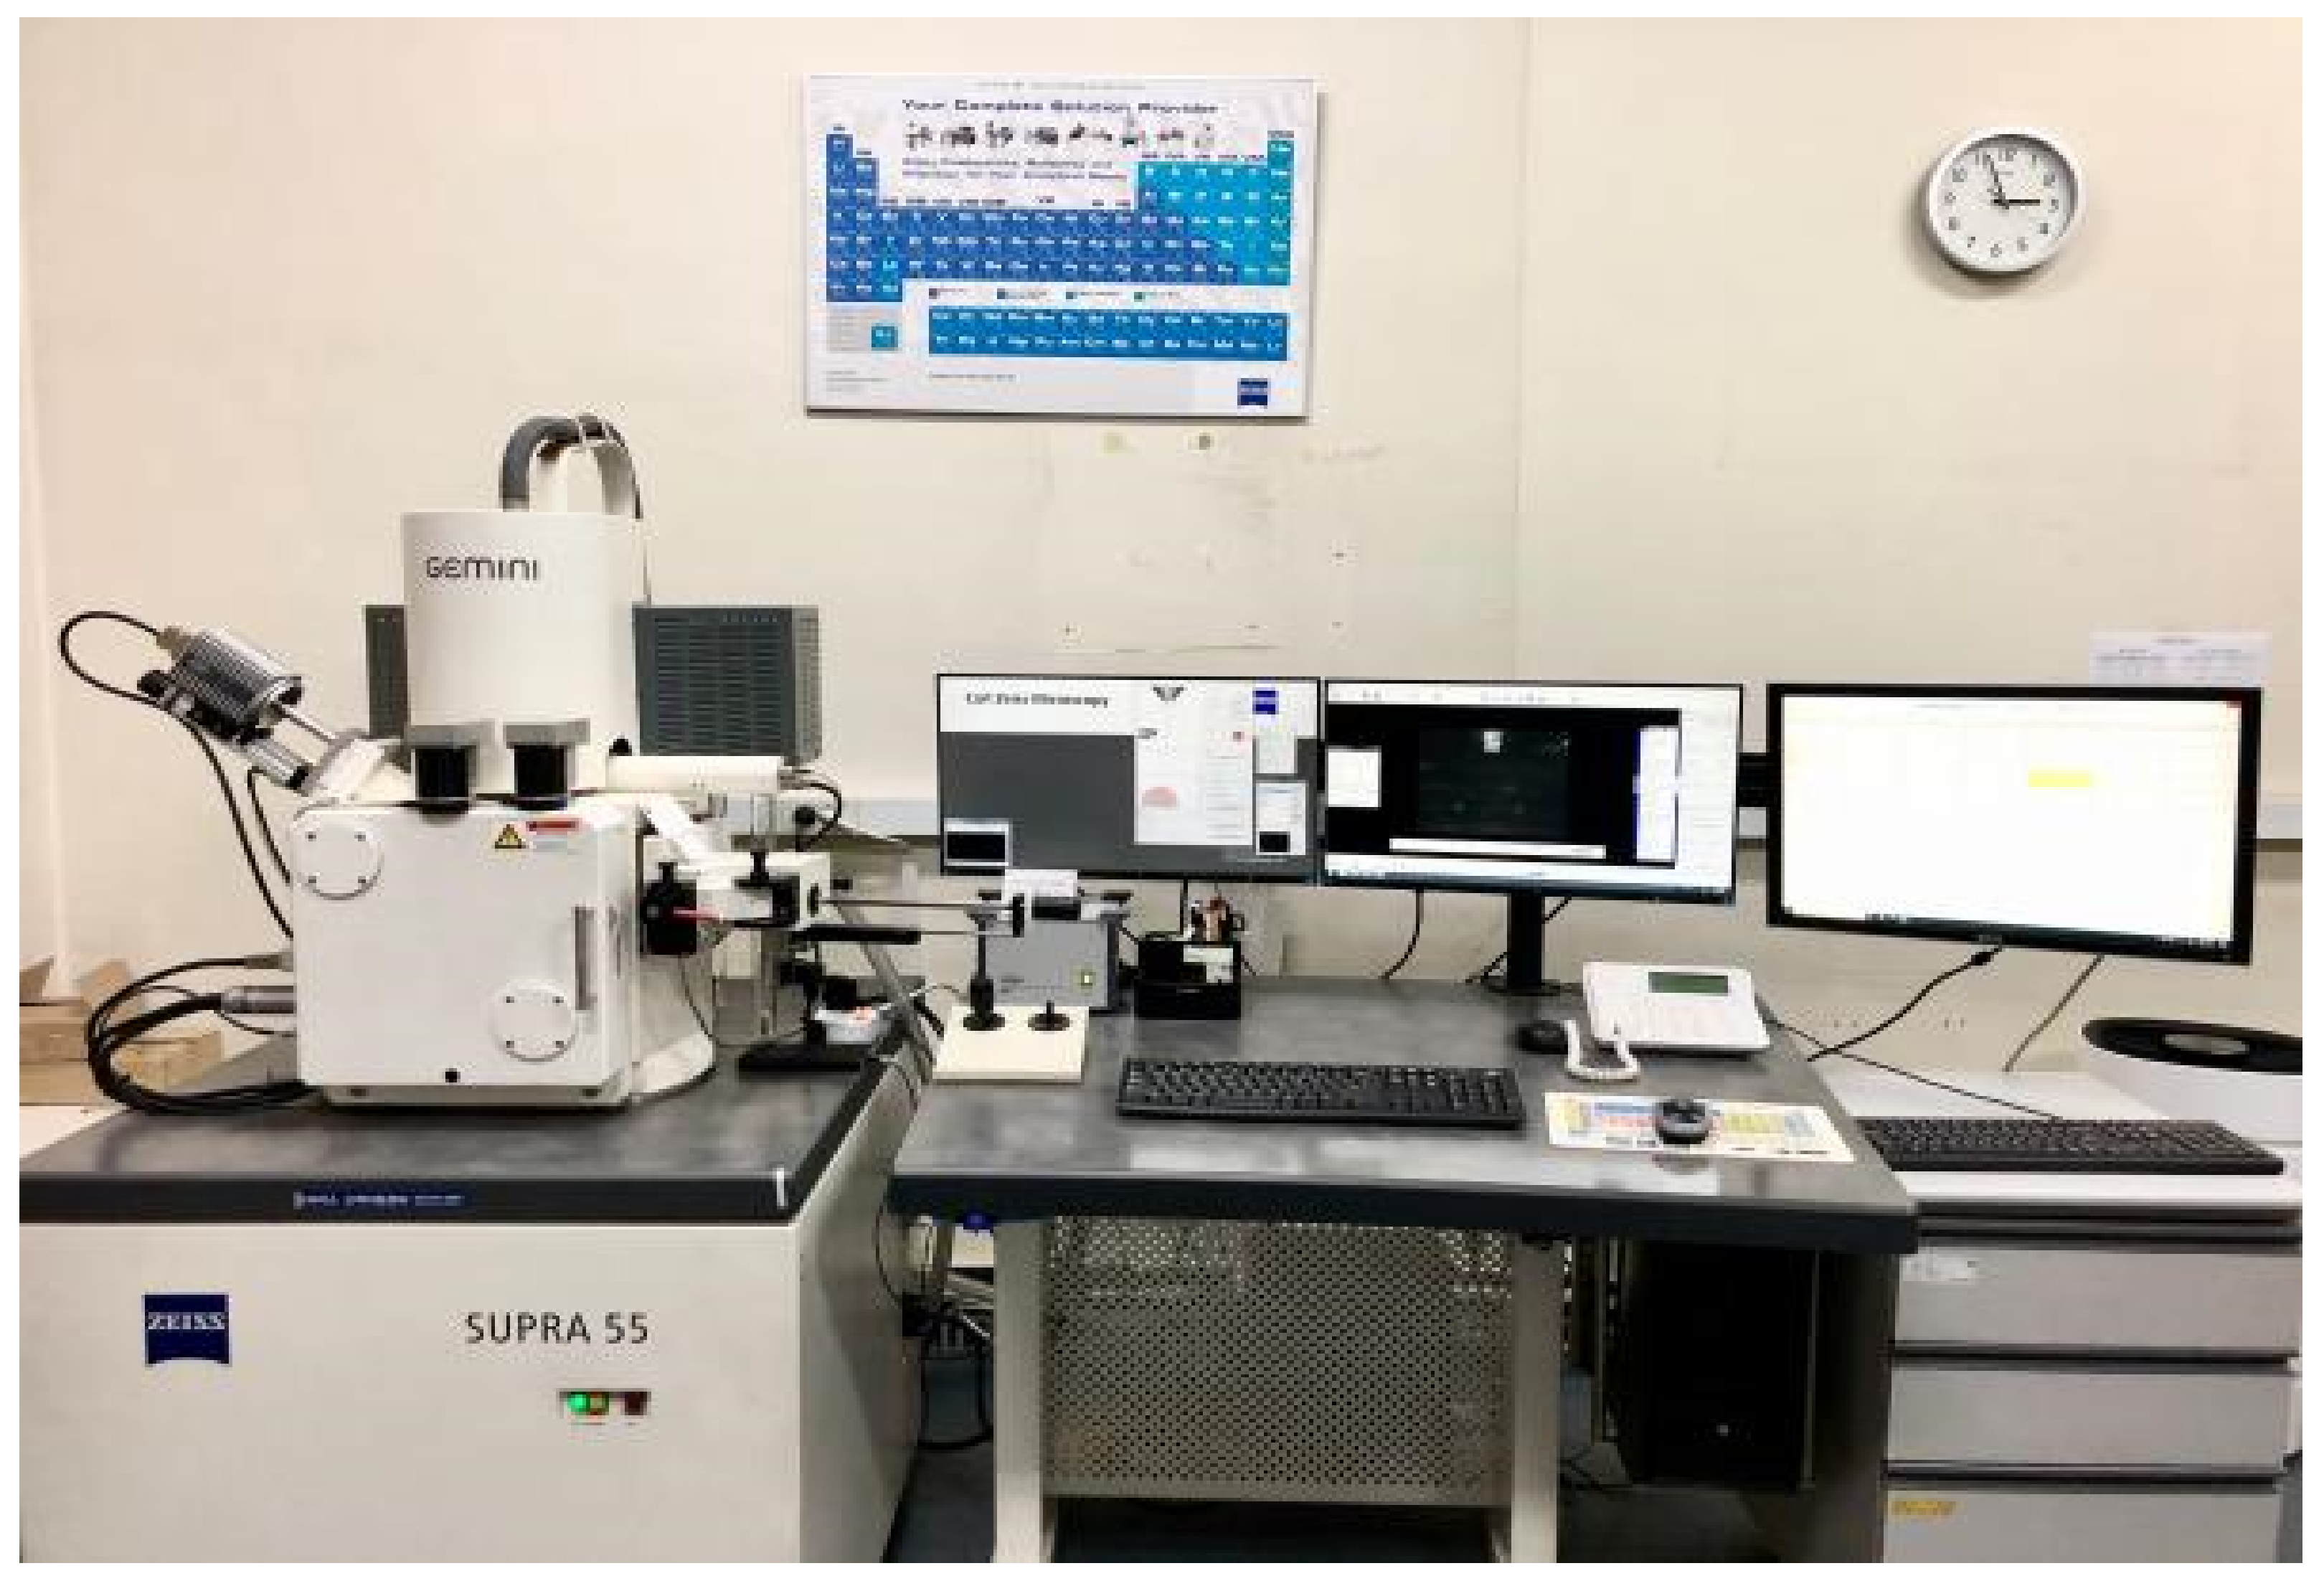
Figure 5.
Maximum dry unit weight and optimal water content in various fines contents.
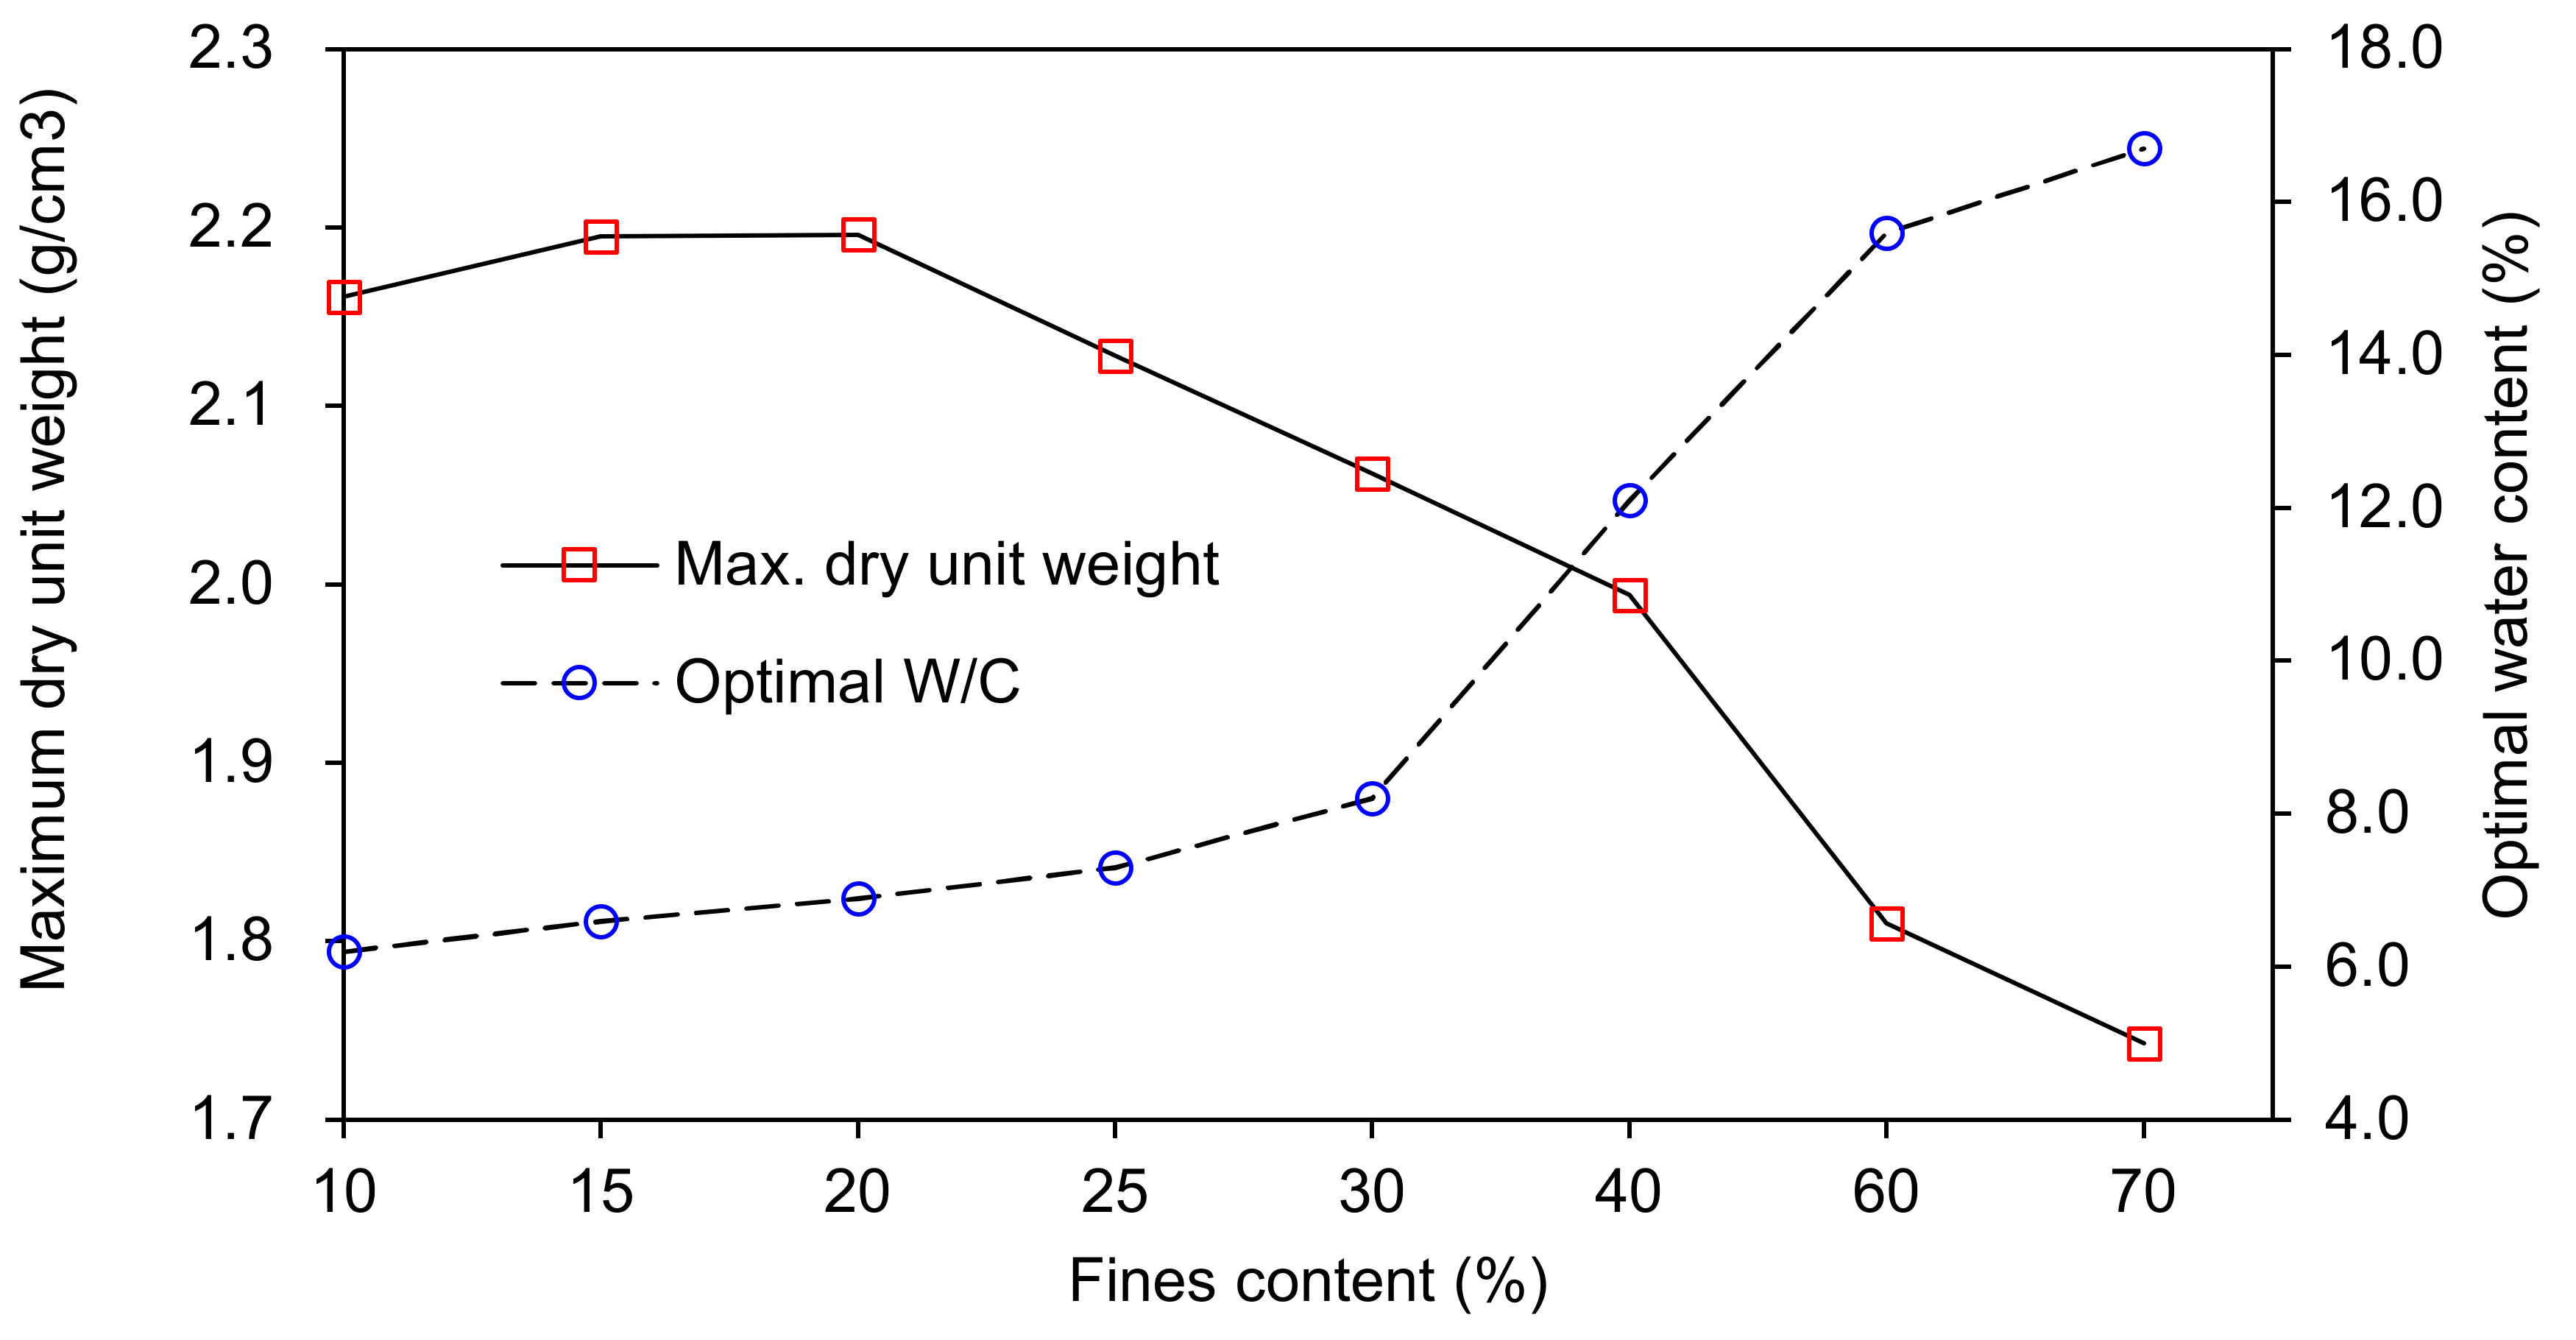
Figure 6.
Variation of void ratio with vertical effective stress for each fines content.

Figure 7.
Variation of void ratio with fines content and vertical effective stress.
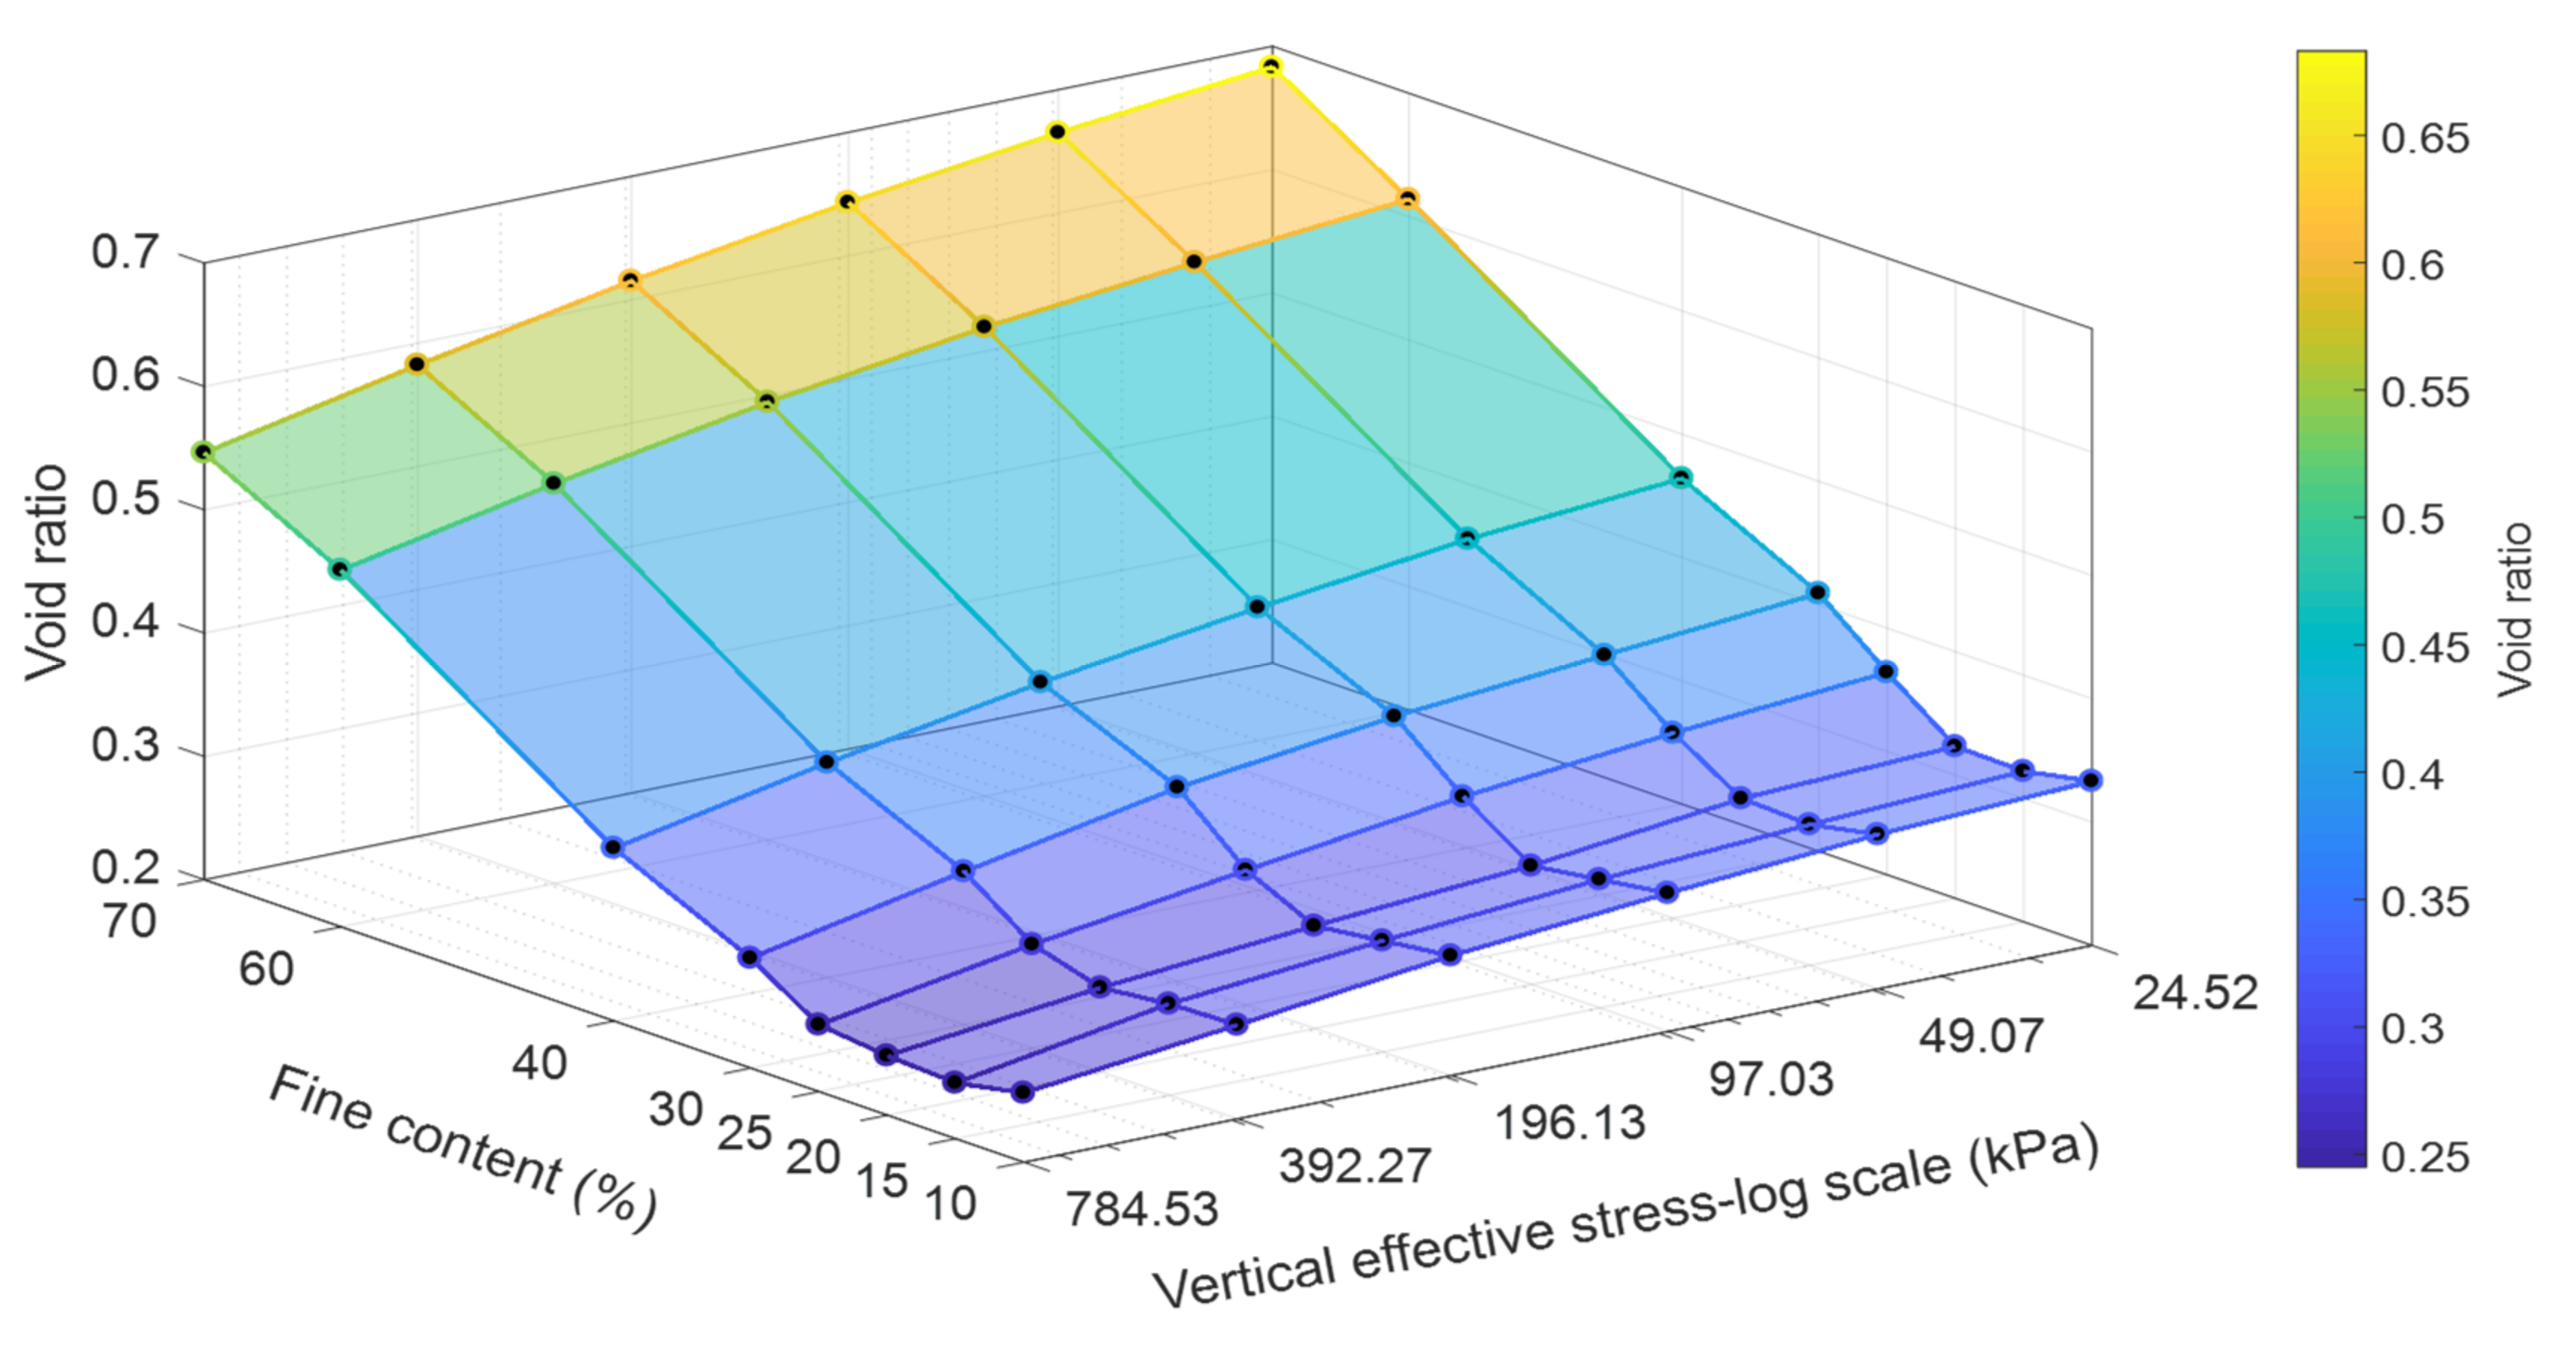
Figure 8.
Variations of intergranular void ratio according to fines content.

Figure 9.
Relationship between the granular compression index and maximum dry unit weight.
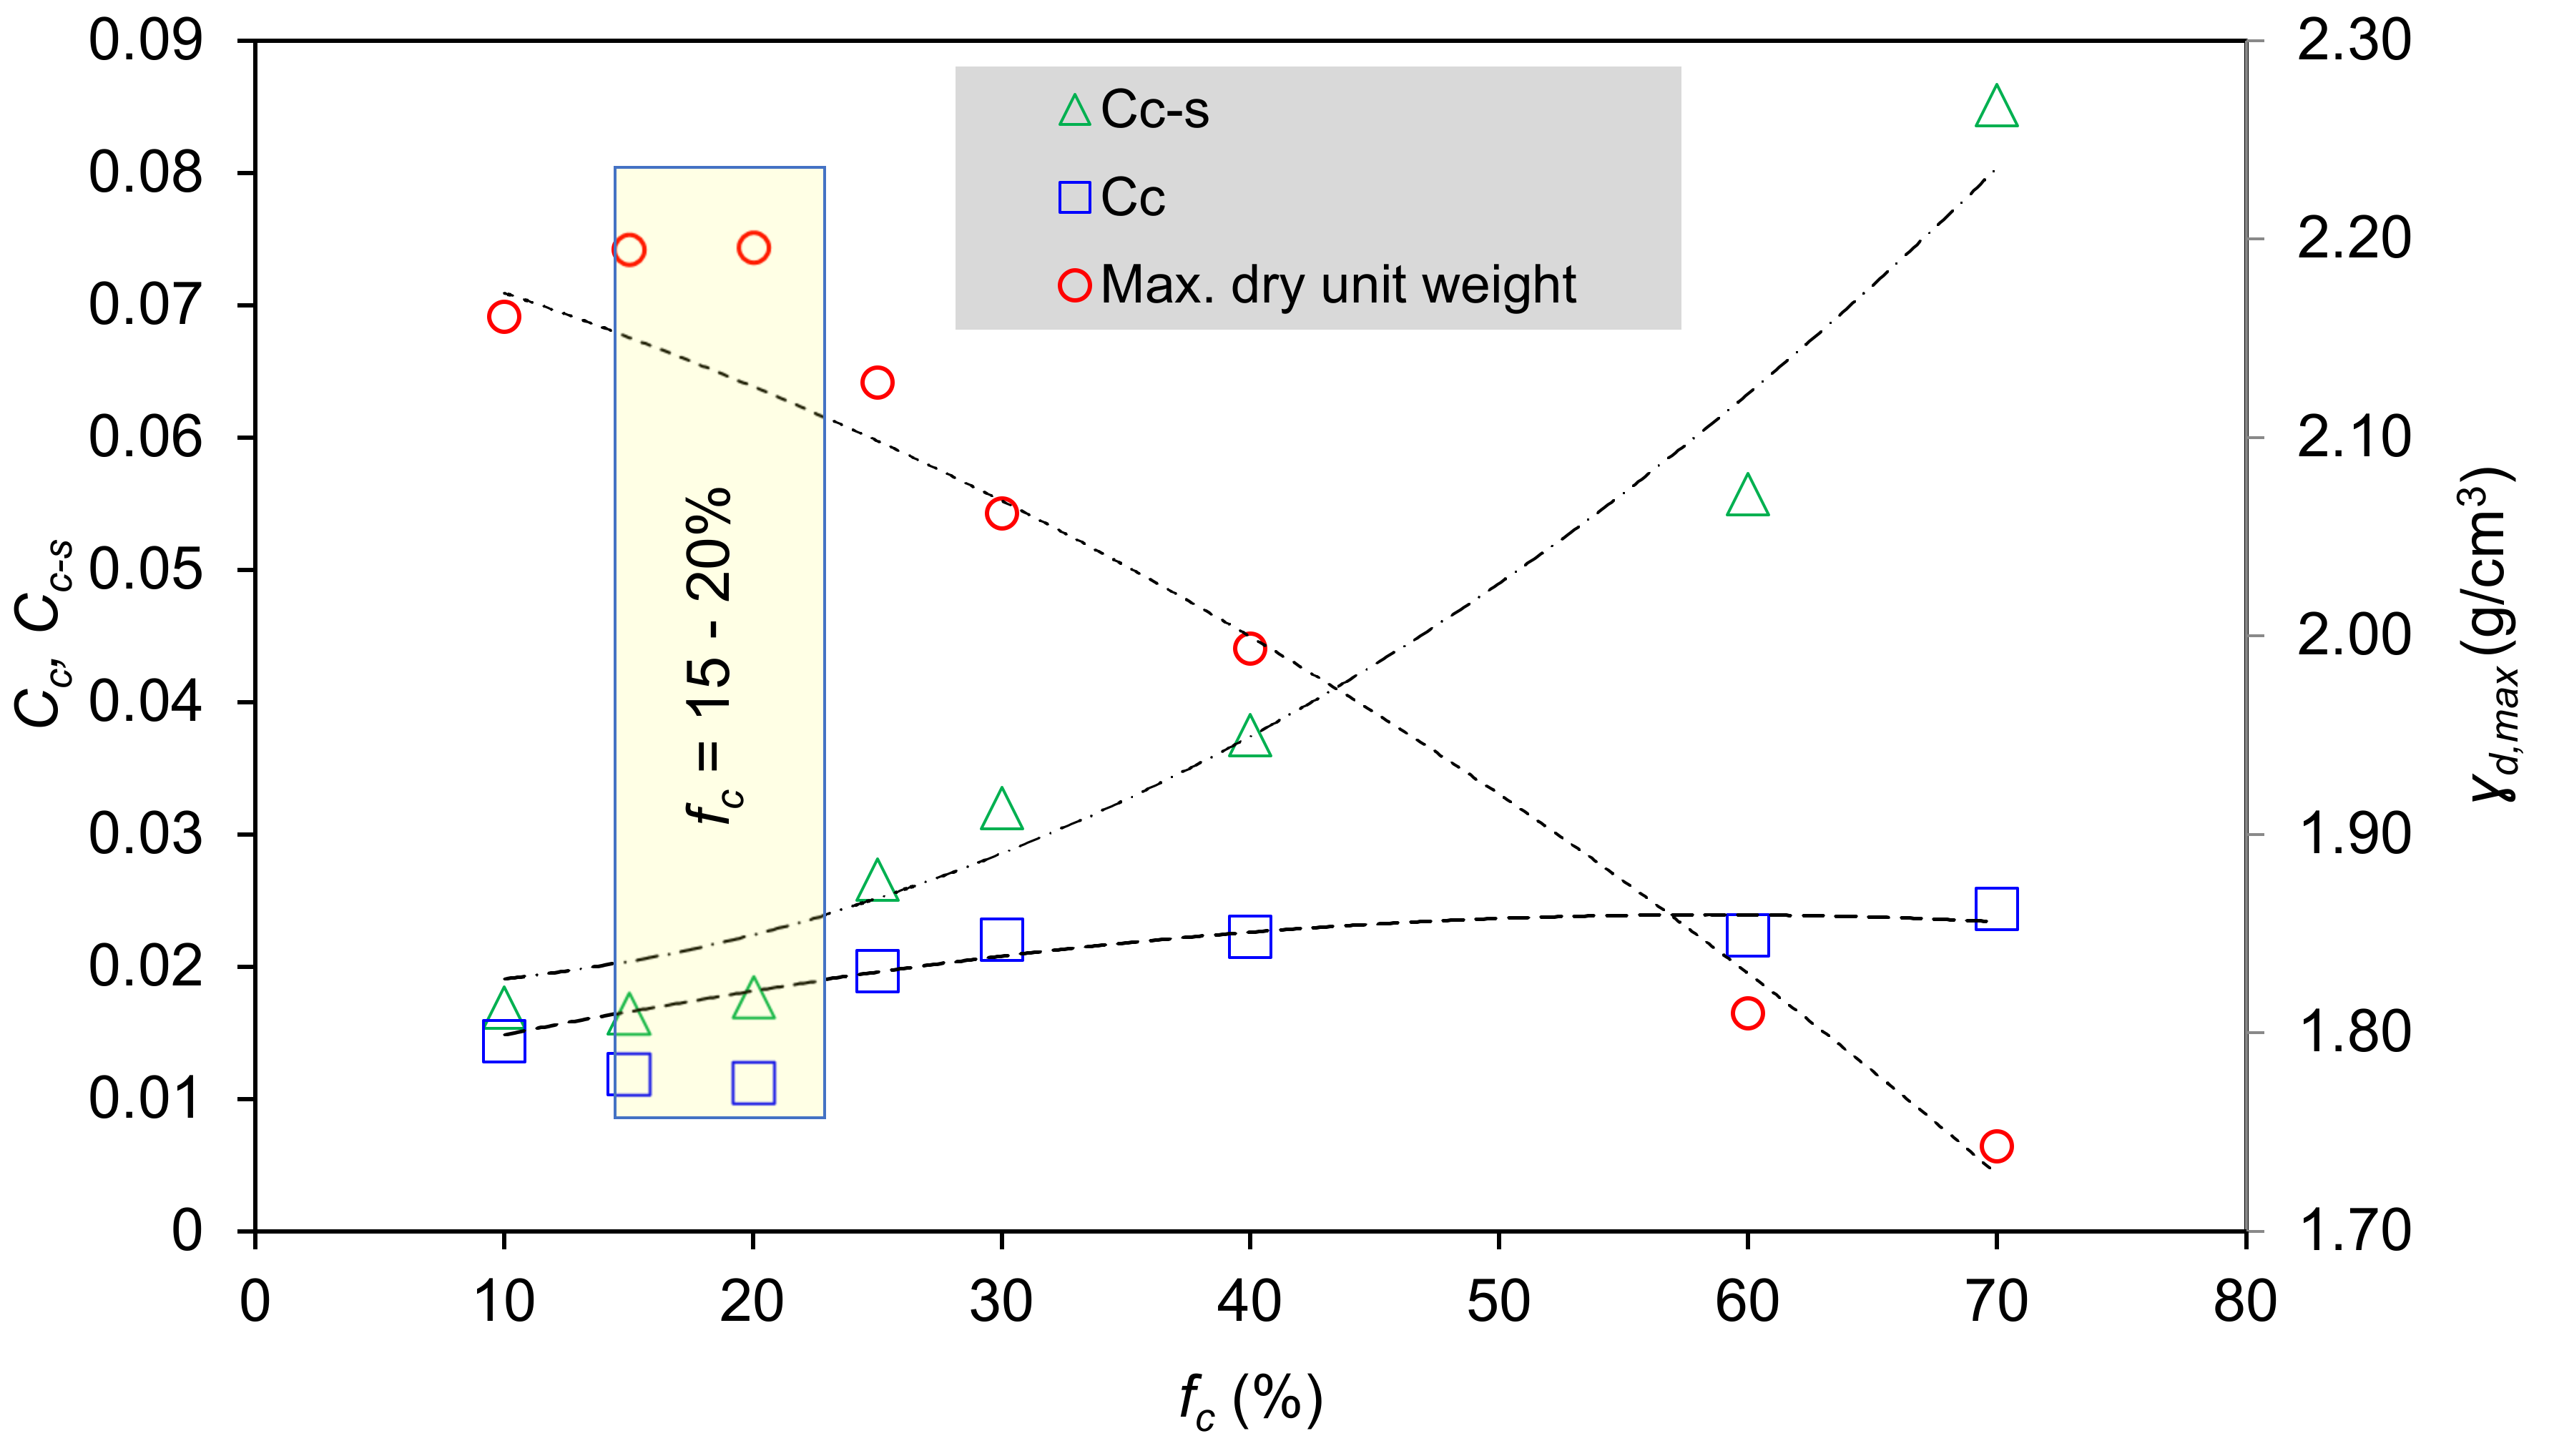
Figure 10.
Particle shape: (a) CEN standard sand, (b) Kaolinite Clay.
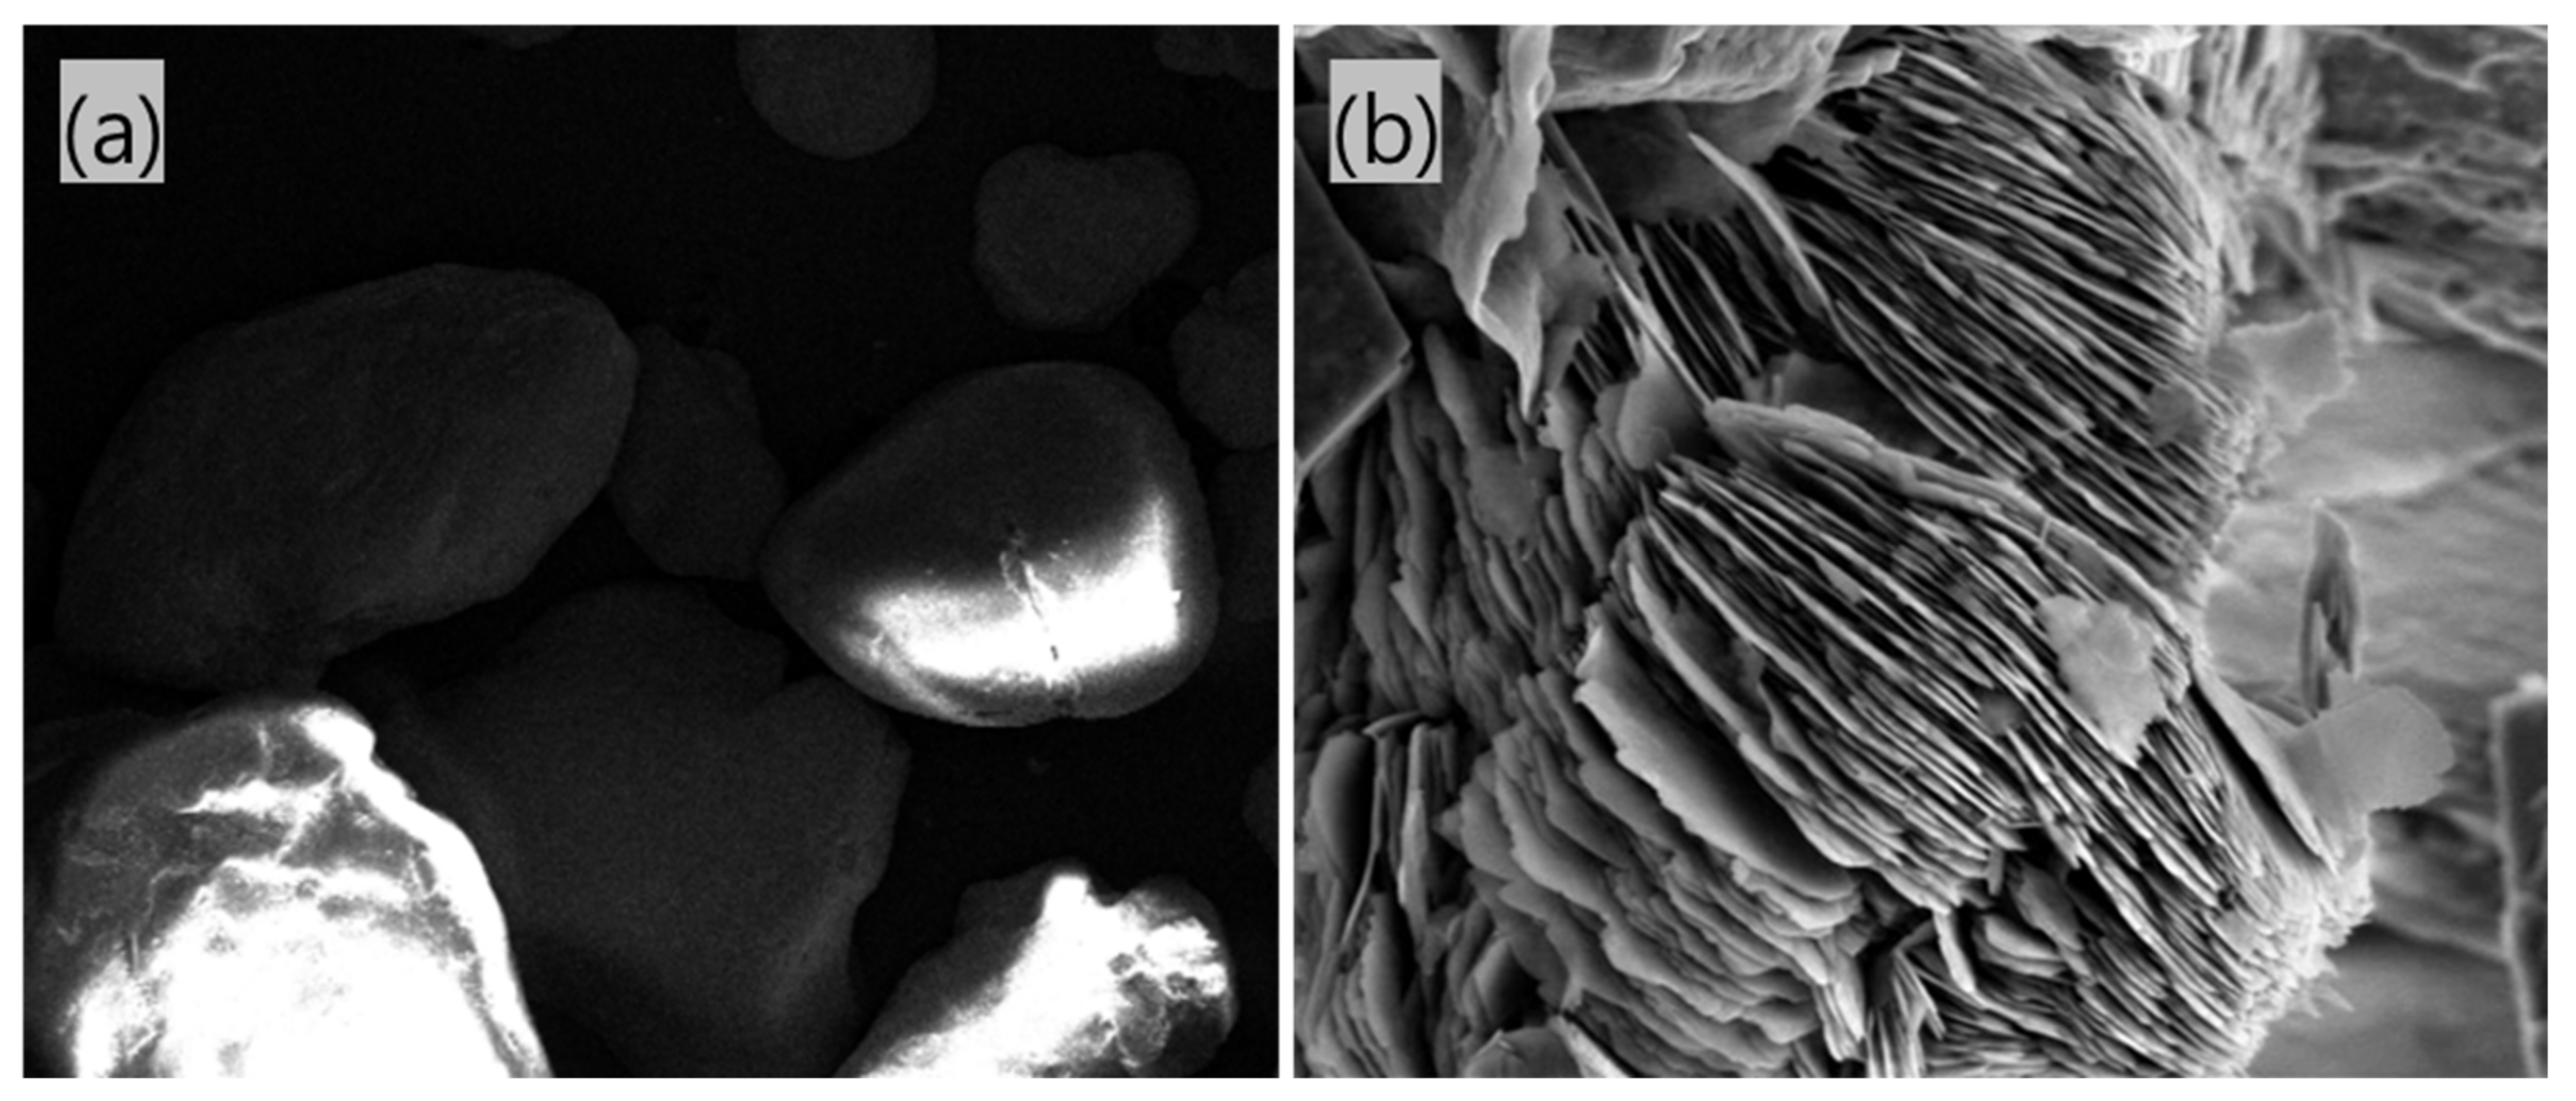
Figure 11.
Particle shape in all mixtures with 10,000× and 100,000× magnification by SEM.

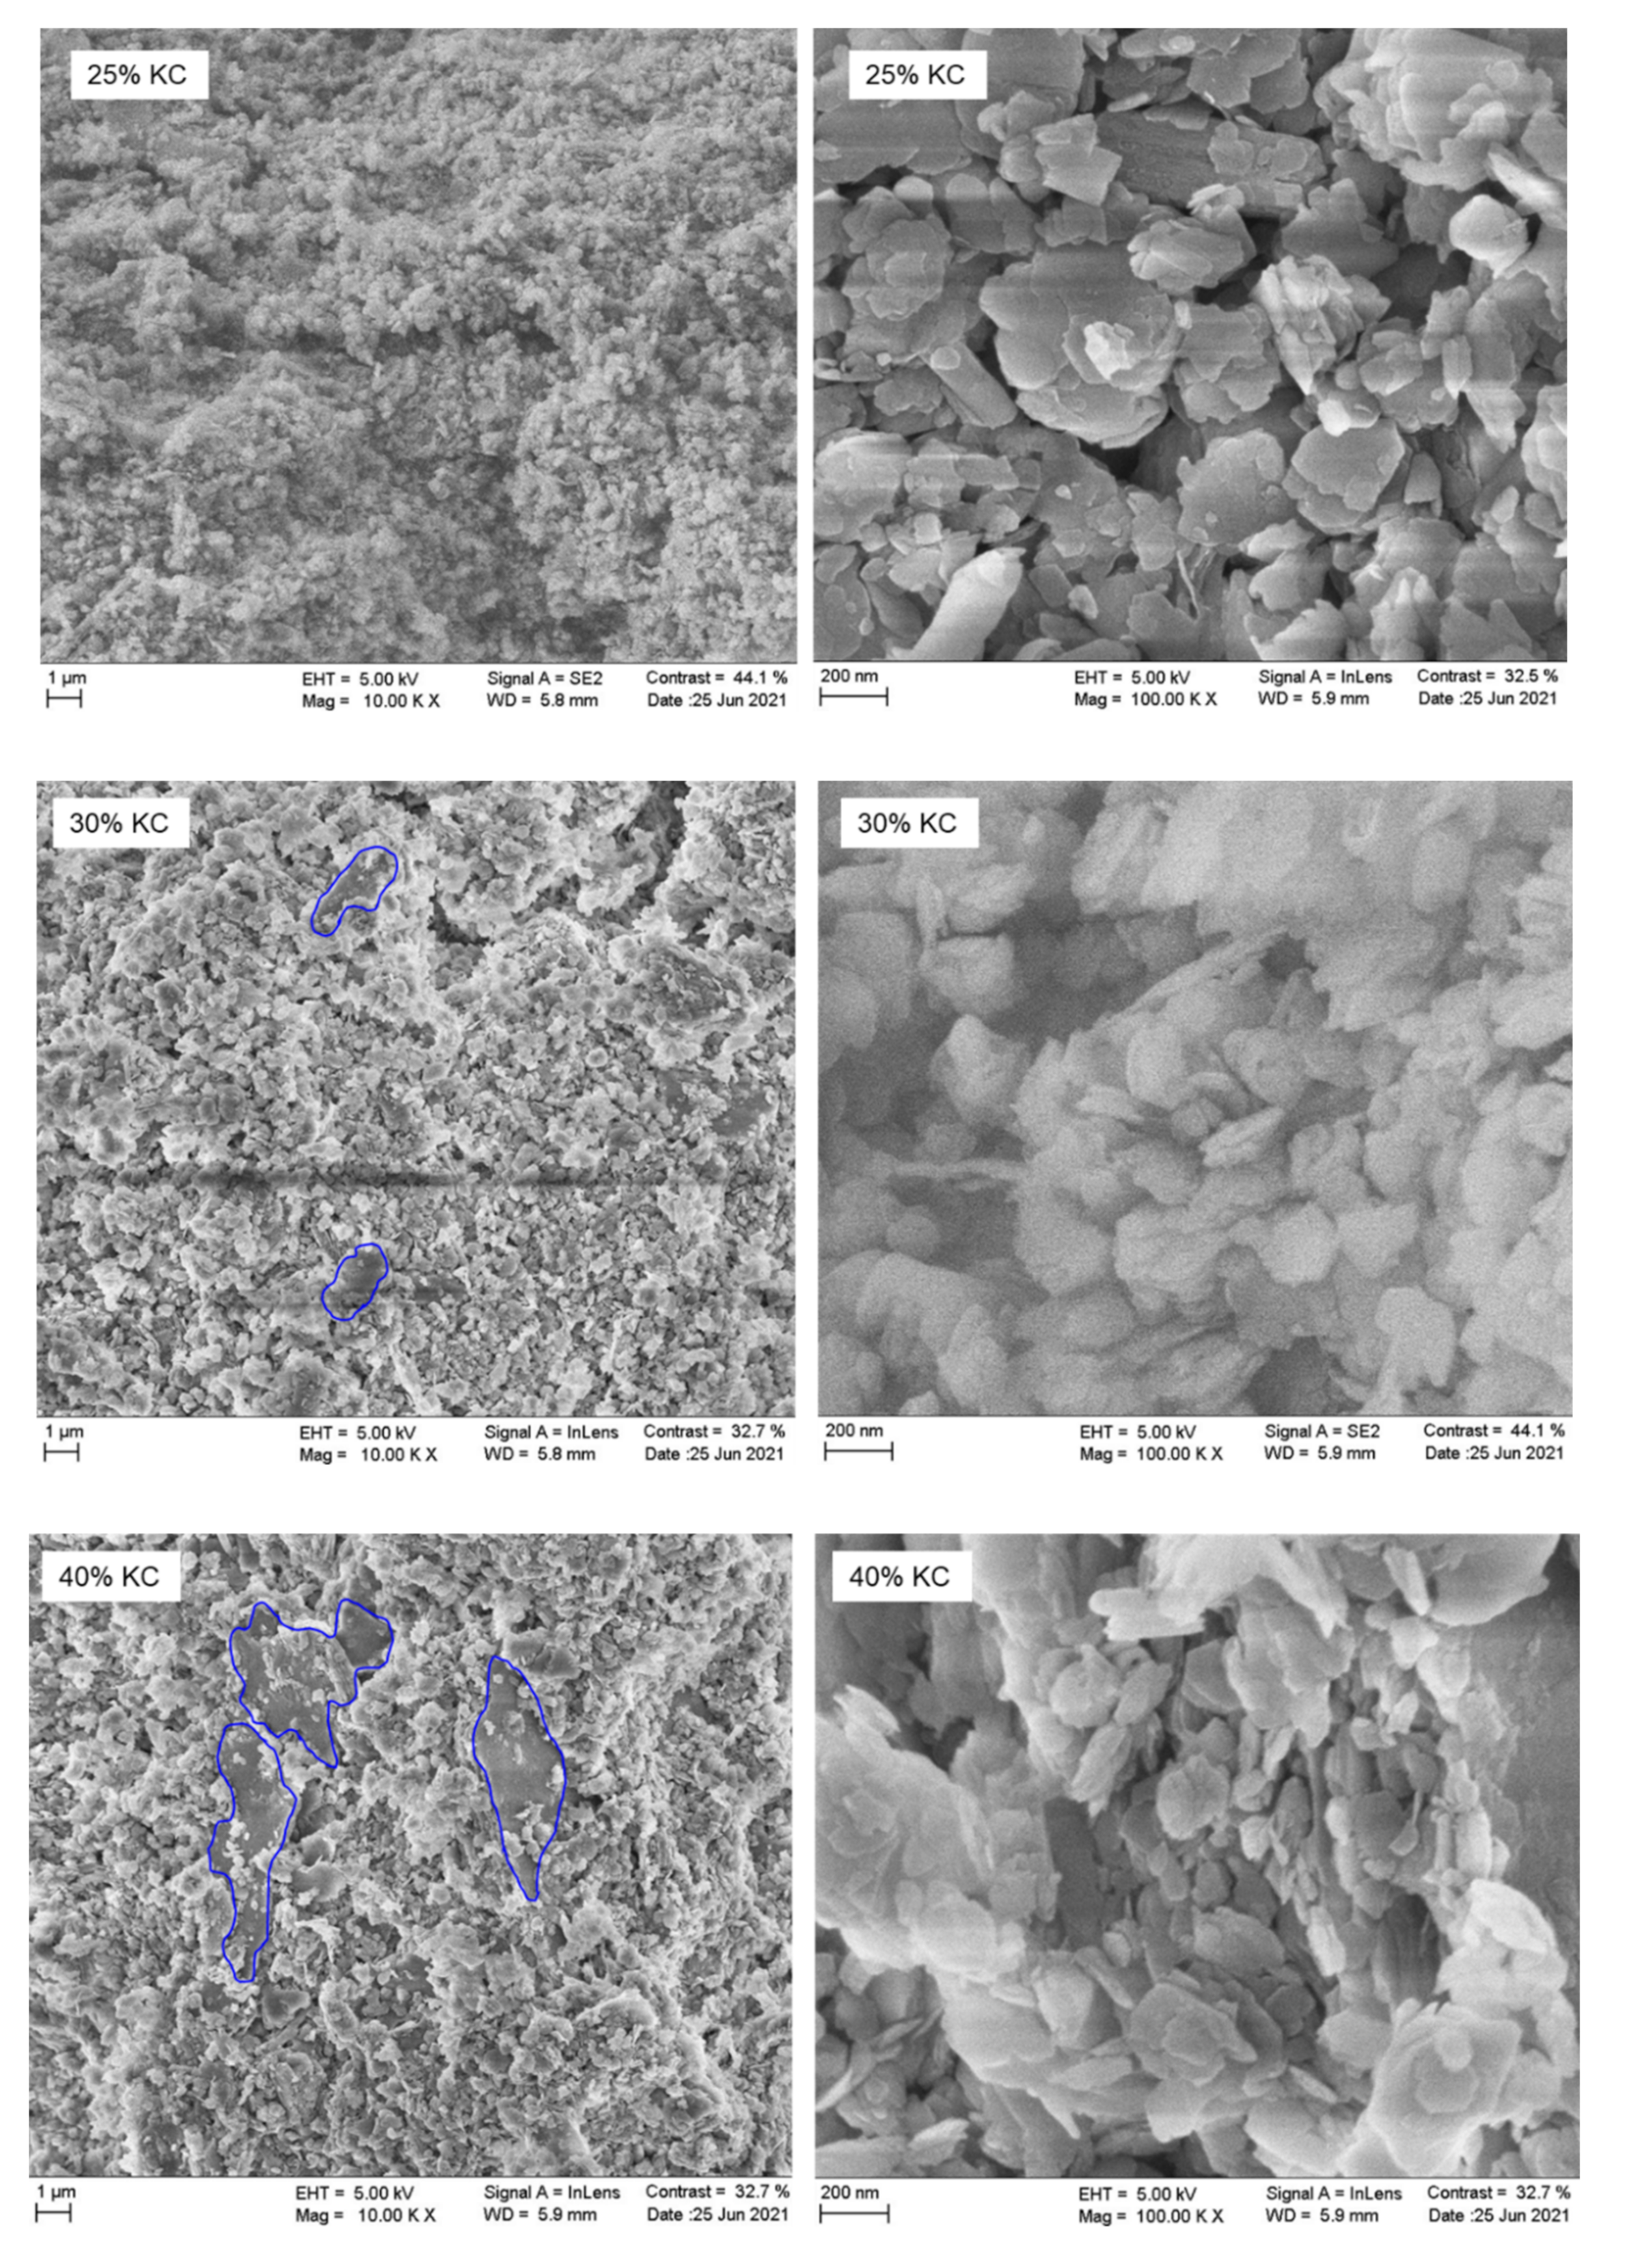
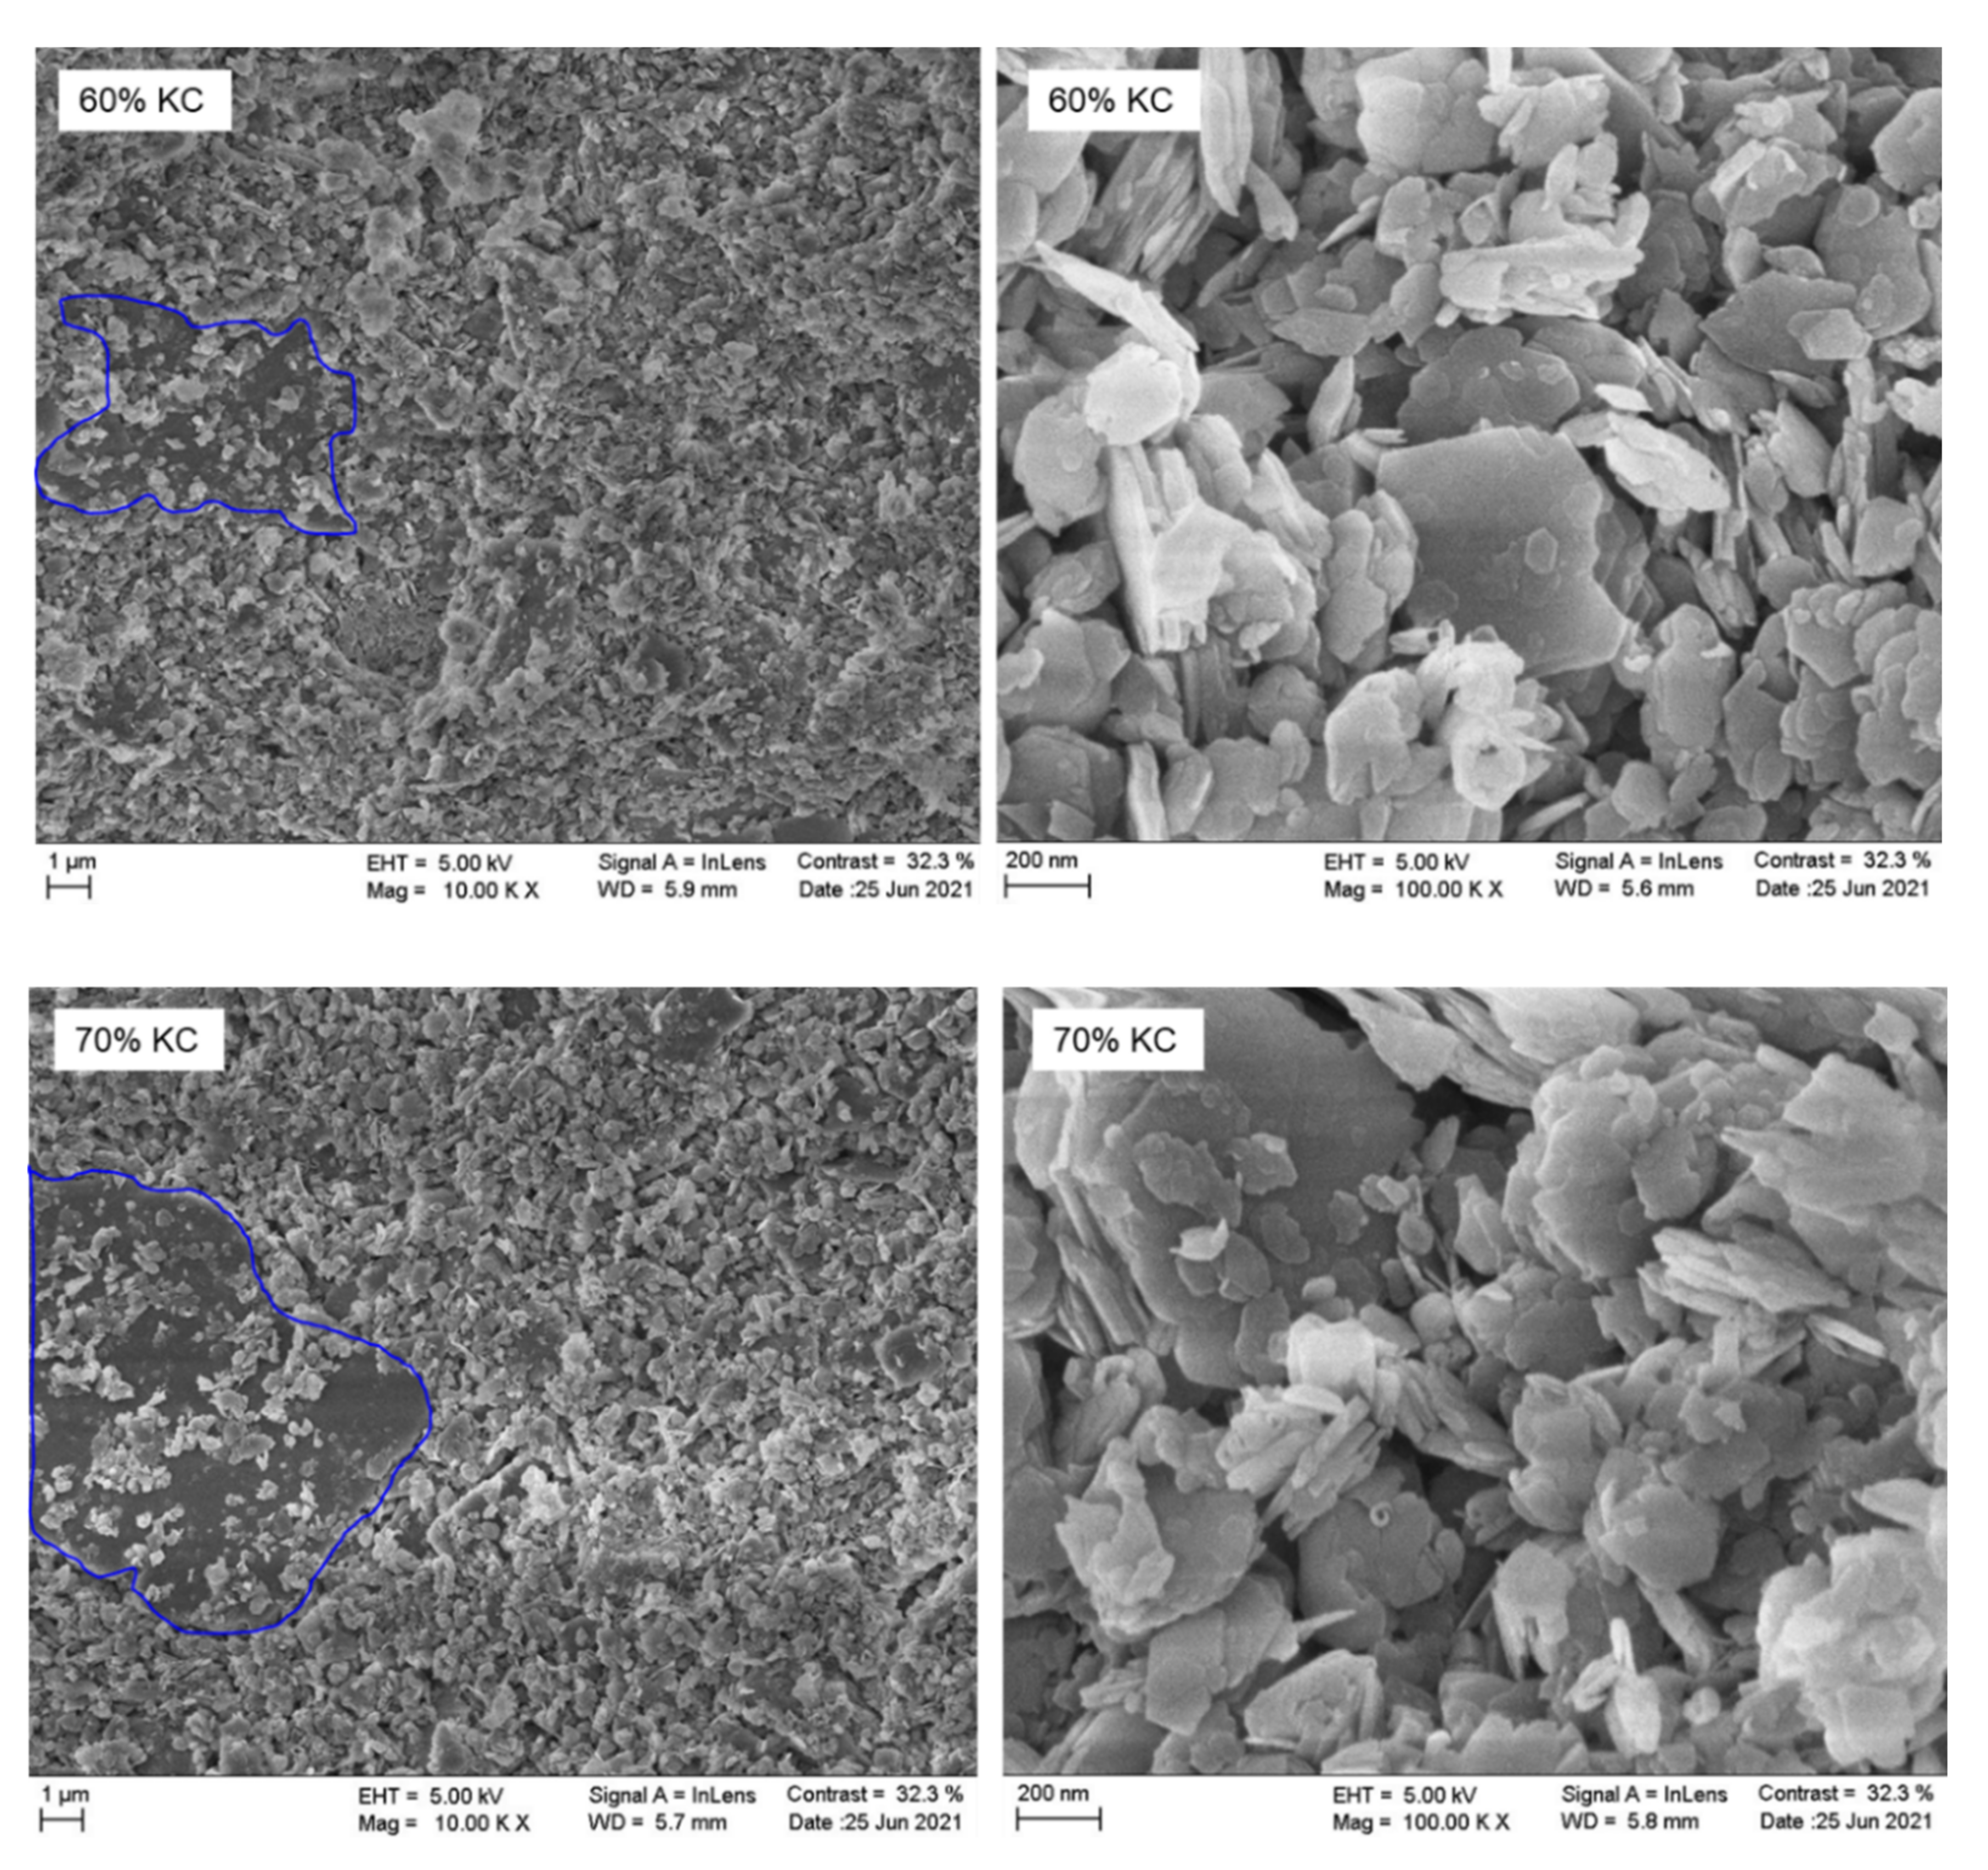
Figure 12.
Overall behavioral of the mixture.


Table 1.
Index properties of kaolinite–sand mixtures.
| Material | KC (%) | Gs | fc (%) | LL | PL | PI |
|---|---|---|---|---|---|---|
| 10% KC | 10 | 2.608 | 10.38 | 11.30 | 0.00 | 11.30 |
| 15% KC | 15 | 2.611 | 15.90 | 14.96 | 5.00 | 9.96 |
| 20% KC | 20 | 2.615 | 20.41 | 16.60 | 7.20 | 9.40 |
| 25% KC | 25 | 2.619 | 26.33 | 17.50 | 8.81 | 8.69 |
| 30% KC | 30 | 2.632 | 31.81 | 18.60 | 9.66 | 8.94 |
| 40% KC | 40 | 2.640 | 41.31 | 21.50 | 17.57 | 3.93 |
| 50% KC | 60 | 2.655 | 60.49 | 25.70 | 21.48 | 4.22 |
| 60% KC | 70 | 2.659 | 71.95 | 26.20 | 22.52 | 3.68 |
Table 2.
Transition fines content under different vertical effective stress.
| Effective Stress (kPa) | TFC (%) |
|---|---|
| 24.52 | 21 |
| 49.03 | 22 |
| 98.07 | 23 |
| 196.13 | 24 |
| 392.27 | 25 |
| 784.53 | 26 |
Publisher’s Note: MDPI stays neutral with regard to jurisdictional claims in published maps and institutional affiliations. |
© 2022 by the authors. Licensee MDPI, Basel, Switzerland. This article is an open access article distributed under the terms and conditions of the Creative Commons Attribution (CC BY) license (https://creativecommons.org/licenses/by/4.0/).
Share and Cite
MDPI and ACS Style
Kaothon, P.; Lee, S.-H.; Choi, Y.-T.; Yune, C.-Y. The Effect of Fines Content on Compressional Behavior When Using Sand–Kaolinite Mixtures as Embankment Materials. Appl. Sci. 2022, 12, 6050. https://doi.org/10.3390/app12126050
AMA Style
Kaothon P, Lee S-H, Choi Y-T, Yune C-Y. The Effect of Fines Content on Compressional Behavior When Using Sand–Kaolinite Mixtures as Embankment Materials. Applied Sciences. 2022; 12(12):6050. https://doi.org/10.3390/app12126050
Chicago/Turabian StyleKaothon, Panyabot, Su-Hyung Lee, Yeong-Tae Choi, and Chan-Young Yune. 2022. "The Effect of Fines Content on Compressional Behavior When Using Sand–Kaolinite Mixtures as Embankment Materials" Applied Sciences 12, no. 12: 6050. https://doi.org/10.3390/app12126050
Note that from the first issue of 2016, this journal uses article numbers instead of page numbers. See further details here.