
Identification of Key Components of CNC Lathe Based on Dynamic Influence of Fault Propagation


1
Key Laboratory of Reliability of CNC Equipment, Ministry of Education, Changchun 130022, China
2
School of Mechanical and Aerospace Engineering, Jilin University, Changchun 130022, China
*
Author to whom correspondence should be addressed.
Appl. Sci. 2022, 12(12), 6187; https://doi.org/10.3390/app12126187
Submission received: 27 May 2022
/
Revised: 11 June 2022
/
Accepted: 14 June 2022
/
Published: 17 June 2022
(This article belongs to the Special Issue Machine Fault Diagnostics and Prognostics Volume III)
Abstract
:Identifying the key components of CNC lathe and analyzing the fault propagation behavior is a powerful guarantee for the fault diagnosis and health maintenance of CNC lathe. The traditional key component identification studies are mostly based on the feature parameter evaluation of the fault propagation model, disregarding the dynamics and influence of fault propagation. Therefore, this paper proposes a key component identification method based on the dynamic influence of fault propagation. Based on the CNC lathe architecture and fault data, the cascaded faults are analyzed. The improved Floyd algorithm is used to iterate and transform the direct correlation matrix expressing the cascaded fault information, and the fault propagation structure model of each component is constructed. The coupling degree function is introduced to calculate the dynamic impact degree between components, and the dynamic fault propagation rate of each component is calculated with the dynamic fault rate model. Based on this, the dynamic influence value of fault propagation is obtained by using the improved ASP algorithm. The key components of the system are identified by synthesizing the fault propagation structure model and the dynamic influence value of fault propagation. Taking a certain type of CNC lathe as an example, the proposed method is verified to be scientific and effective by comparing with the traditional identification method of key components based on fault propagation intensity.
1. Introduction
As one of the technical supports for the development of modern intelligent manufacturing, real-time monitoring of the running state of the CNC lathe, rapid identification of key components and tracking the root cause of the fault are effective measures to reduce the probability of fault, improve the reliability level and reduce the maintenance cost [1]. As a complex integrated system, CNC lathe components are associated with each other [2], creating favorable conditions for fault propagation and increasing the difficulties of fault identification and tracking [3]. Therefore, considering the dynamic influence of fault propagation and identifying the key components of the system in real time is of great significance to improve the efficiency of fault diagnosis, control the fault propagation and improve the operation reliability of the lathe.
At present, the research methods of key component identification mostly focus on the “importance measure” [4], which is manifested as the component importance measure and the node importance measure. The importance measure of components based on system reliability theory mostly uses “expert knowledge and experience” to construct a function-oriented system structure model by using fault tree [5], event tree [6] and other methods [7,8]; then, the importance measure is built by combining the reliability index of components to identify key components. Typical methods include Birnbaum importance degree [9], conditional marginal reliability importance (CMRI) [10], integrated importance measure (IIM) [11] and improved-PageRank (IPR) [12,13]. Although this method is widely used, there are still some defects, such as that the system functional structure modeling cannot fully reflect the system topological structure and the interdependence of system components, which affects the accuracy of identification results.
The node importance measure is based on the complex network theory [14], according to the objective law that the essence of any system is the network, the physical structure of the system is abstracted into a topological network model and the key components of the system are evaluated by degrees [15], centrality [16,17], eigenvectors [18], centrality [19] and degree of cohesion [20]. Although the node importance measure can clearly represent the system structure and its coupling relationship, it only analyzes the topological status of components in the system [21], but does not consider the influence of reliability attributes of components on the system.
The component importance measure and the node importance measure are both single measures to identify key components, which may be affected by randomness, uncertainty and different emphasis, resulting in different results in identifying key components with different measures [22], and have disadvantages such as limited application scope and incomplete evaluation results. Therefore, some researchers have proposed to identify key components in the system by integrating multiple importance measures from the perspective of multi-attribute decision making [23]. Commonly used multi-index comprehensive evaluation methods include entropy weight method [24], technique for order preference by similarity to an ideal solution (TOPSIS) [25], grey relation analysis (GRA) [26], etc. Although this method solves the problem of identification deviation of a single measurement, it is mostly a synthesis of the same type of measure, and lacks the recognition from the perspective of the combination of system function and topological structure, and the weight distribution of each index should be considered emphatically.
By the importance of component, the importance of node, or the comprehensive evaluation method of multiple indicators, the key components are identified from the perspective of importance measurement, focusing on the characteristics of a single node and its position in the system, but not considering the interaction between nodes or the dynamic influence of each node in the propagation process, which may lead to inaccurate discrimination results.
In view of the problems existing in the above key component identification methods, this paper proposes a key component identification method based on the influence of fault propagation. This method not only considers the importance of each component in the system, but also considers the influence of each component on other components as the initial fault propagation source. The fault propagation structure diagram of each component established in this paper can more clearly show the process of fault propagation to other components as the initial fault propagation source, and qualitatively describes the influence of components in the propagation from the structure. Based on this diagram, the dynamic influence value of fault propagation of each component is calculated quantitatively, and the influential components of CNC lathe in the process of fault propagation are identified and sorted using this value as an index, which provides a theoretical basis and practical reference for subsequent fault detection and health maintenance.
2. Identification Method of Key Components of CNC Lathe
The identification process of key components of CNC lathe based on dynamic influence of fault propagation is divided into four steps. Firstly, the fault propagation relationship is analyzed. According to the structure and working process of CNC lathe, the CNC lathe is divided into multiple components. The field fault information is collected, the relevant faults are analyzed by the details of fault phenomenon and fault data of each component is sorted out. Secondly, the fault propagation model is constructed. The cascade fault is analyzed considering the fault correlation, and the direct correlation matrix representing the cascade fault information is established. The indirect correlation matrix and routing matrix are calculated by the improving Floyd algorithm, and the fault propagation structure model starting from each component of the CNC lathe is constructed. The Johnson method is applied to correct the fault data and construct the fault rate model and fault probability model of system and component. On this basis, the importance of component is calculated to reflect the fault influence degree of components. The dynamic fault propagation rate is obtained by considering the dynamic fault rate of each component and the dynamic influence degree among components. Then, the fault propagation influence value is assessed. The improved ASP algorithm is applied to calculate the fault propagation dynamic influence value of each component taking the fault propagation structure diagram and dynamic fault propagation rate of component as input. Finally, the key components are identified according to the ranking results of dynamic influence value of fault propagation. The greater the influence, the more critical the component is, and should be paid attention to. The dynamic identification process of key components of CNC lathe is shown in Figure 1.
2.1. Construction of the Fault Propagation Structure Model of Components
According to the architecture and working process of CNC lathe, system components are divided and fault data is collected and processed. The cascading fault among the internal components of the system is analyzed. Components that affect the fault of other components are called antecedent components, and components that are affected by other components are called successor components. In literature [27], the direct correlation matrix between components by cascading fault information is represented in Matrix (1).
where represents that there is no direct fault propagation relationship between components, and represents that the correlation between components i and j is 1, that is, the fault propagation between components can be completed in one step.
The indirect correlation matrix is an extension of the direct correlation matrix, which represents the indirect correlation between the components of the system [28]. Taking the direct correlation matrix as input, the improved Floyd algorithm [29,30] is introduced to recursively update, and each update introduces a transition node, that is, whether there is path propagation between the two components until all nodes are introduced, so as to obtain the indirect correlation matrix, which represents the fault propagation path between components. The indirect correlation matrix is expressed as Matrix (2).
where represents that there is no fault effect between components, that is, there is no fault propagation relationship between the two components, and represents that the correlation between components i and j is k, that is, the fault propagation between components requires k steps.
The indirect correlation matrix represents the number of steps required for fault propagation between components, while the routing matrix represents the components required for fault propagation from component i to component j [31]. The routing matrix is obtained through the above update process in Matrix (3).
where represents that the components through which the fault propagates from component i to j, from which the fault propagation path from component i to j is deduced.
According to the component propagation steps determined by the indirect correlation matrix and the fault propagation path determined by the routing matrix, the fault propagation structure model starting from each component of CNC lathe is drawn in Equation (4).
where i represents each component of the CNC lathe, and represents the fault propagation relationships starting from component i.
2.2. Calculation of Fault Propagation Rate of CNC Lathe Components
2.2.1. Calculation of Dynamic Fault Rate of Components
The dynamic fault rate of each component at any time is calculated according to the operation fault information of the CNC lathe. Firstly, the fault time of the system component is considered and the fault order is corrected. The hypothesis distribution is identified according to the operation fault data and the modified fault sequence. Assume that the fault rate function follows the assumed distribution; then parameter estimation and hypothesis testing are carried out to obtain the dynamic fault rate function of each component. Finally, the component fault rate modeling based on time dependence is realized. The specific solution process is shown in Figure 2.
According to the above-mentioned modeling principle of the fault rate of components of the CNC lathe, combined with the failure time, the failure distribution function and reliability function of the system and each component can be calculated, which is convenient for the subsequent calculation and application of this paper.
2.2.2. Determination of the Dynamic Influence Degree between Components
As one of the reliability parameters of the system components, the importance degree indicates the influence on the failure probability of the whole machine when a certain component of the system fails [32]. In this paper, probability importance and criticality importance are introduced to quantify the influence of component failure on the whole machine failure. The equations for calculating the probability importance and criticality of system components [33] are shown in Equations (5) and (6).
where and are the probability importance and criticality importance of CNC lathe components, is the fault probability function of the CNC lathe and is the fault probability function of each component.
When any component of the CNC lathe fails, according to the fault correlation shown in the fault propagation structure diagram of the component, the fault is transmitted to other components associated with it. The criticality importance is used as the value of the efficacy function [34], and the coupling degree function is introduced to calculate dynamic fault impact between components [35]. The calculation equation is expressed in Equation (7):
where is the dynamic fault influence degree between components i and j, and and are the critical importance values of the antecedent component i and the successor component j, respectively.
2.2.3. Calculation of Dynamic Fault Propagation Rate of Components
The dynamic fault propagation rate of each component of CNC lathe is not only affected by its own fault rate, but also related to the mutual influence of faults among components. Combined with the above two indicators, the dynamic fault propagation rate of system components is calculated in Equation (8).
where is the dynamic fault propagation rate of the components over time, is the dynamic fault influence of the component i on the component j and is the dynamic fault rate of the component i.
2.3. Identification of Key Components of System Based on Dynamic Influence of Fault Propagation
The fault propagation path from the component i to another component j can be any reachable path between them [36]. According to the third-order influence principle [37], the influence range of system components is not limited to directly adjacent components, but also indirectly affects the components adjacent to neighbor components, possibly within the third order. However, since the fault propagation rate will decay rapidly with the increase of the path length, it is not necessary to consider all the accessible paths. The ASP algorithm only includes the accessible paths whose length is not greater than 3 between components and neighboring components into the calculation range. In this paper, the fault propagation rate between CNC lathe components is introduced into the improved ASP algorithm, and the components that affect the component within the third order are obtained through the fault propagation structure diagram of each component, and the fault propagation influence value of the component is calculated. The calculation formula is shown in Equation (9):
where is the fault propagation influence value of the component i, is the success rate of the component i in propagating the fault information to a one-step neighbor component j, is the success rate of the component i in propagating the fault information to two-step neighbor component n and is the success rate of the component i in propagating the fault information to three-step neighbor component q.
For the one-step neighbor components of the component j:
where is the set of all one-step neighbor components of component i, is the fault propagation rate between component i and j, is the propagation rate that component i passes the fault to component j through component m and is the propagation rate that component i passes the fault to component j through component m and r.
For the two-step neighbor components of the component n:
where is the set of all two-step neighbor components of component i, is the propagation rate that component i passes the fault to component n through component m and is the propagation rate that component i passes the fault to component n through component m and l.
For the three-step neighbor components of the component q:
where is the set of all three-step neighbor components of component i and is the propagation rate that component i passes the fault to component q through component m and n.
According to the above steps, the fault propagation influence value of each component is calculated and sorted. The more advanced the component is, the more important it is, and the component with the highest influence value is the key component of the system, laying a foundation for the development of system reliability analysis and maintenance strategy.
3. Case Application
In this section, a total of 129 pieces of fault data and fault information details of 67 CNC lathe were collected during the course of one year. According to the CNC lathe structure, it is divided into nine components, and the component element code and fault time on of the CNC lathe are shown in Table 1. By analyzing fault information in detail, we can determine whether the faults of each component are independent faults or related faults. Further analysis of the related faults can identify the antecedent failure component that caused the component to fail. For example, when the numerical control device fails, the fault location is the numerical control system, but the root cause may be a problem with the electrical components, so the fault component before positioning is the electrical system. In this manner, the antecedent components and subsequent components were divided, and the relationship of fault propagation was established as shown in Table 2.
As expressed in the fault propagation information of the CNC lathe in Table 2, the direct correlation matrix can be obtained as Matrix (13).
The improved Floyd algorithm was used to iteratively calculate the number of steps and paths of fault propagation, and the corresponding indirect correlation matrix and routing matrix were obtained as Matrix (14) and (15).
Combined with an indirect correlation matrix and routing matrix, a fault propagation structure model starting from each component of CNC lathe was constructed, as shown in the Figure 3.
Figure 3 clearly shows the extent to which each component of the CNC lathe is an initial fault source and may propagate the fault to other components associated with it. For example, in Figure 3a, when NC acts as the initial fault source, its failure may cause M or A to fail, and when A fails, the failure may be transmitted to T or B. This is further explained by an example. In the multi-process processing of complex parts, the fault phenomenon is that the tool holder system cannot realize the tool change for parts processing, but in-depth analysis to find the reason determines that the PLC system in the numerical control system is faulty, and the tool change instruction cannot be issued, so there is an arrow pointing from NC to M. The PLC control program in the CNC system can realize the auxiliary function control of the lathe. When it fails, the lubrication system in the auxiliary system may not work normally. When the CNC lathe cannot be lubricated, it will cause the spindle parts in the main driving system and the table in the base piece mechanical to wear, which reduces the life of the CNC lathe. Thus, the failure of the CNC system is transmitted to the main driving system and the base piece through the auxiliary system.
On the basis of the operation fault information of CNC lathe, the calculation method and operation process in Section 2.2.1 are used to evaluate the dynamic fault rate of each component. The Johnson method is used to correct the order, and the hypothetical distribution is identified. We use the two-parameter Weibull distribution to build the reliability model, and the least squares method to estimate the parameters; the linear correlation test and the goodness of fit test are then carried out. Finally, the dynamics fault rate function of each component of the CNC lathe can be obtained in Table 3 below.
Similarly, the fault probability function of a whole CNC lathe is and the fault probability function of system components can be obtained in Table 4.
According to Equations (5) and (6) and Table 4, the probability importance and criticality importance of components at any time can be calculated, and the function curves of each component are illustrated as Figure 4 and Figure 5, respectively.
It can be seen from the figures that importance curves of CNC lathe components tend to be stable when they run to 4000 h. Therefore, 4000 h and 6000 h are taken as examples, and the fault influence degree and fault propagation rate of other associated components are calculated combined with the fault propagation structure diagram of the components.
According to the value of the fault propagation rate solved in Table 5, combined with the third-order neighborhood component relationship of each component characterized in the fault propagation structure diagram, the improved ASP algorithm is used to calculate the fault propagation influence value of the components in the system at 4000 h and 6000 h, and the ranking is as shown in Table 6.
The dynamic and real-time fault propagation influence value represents the importance of the components in the system. Through the ranking results in Table 6, it can be identified that the key components of the CNC lathe under current investigation at 4000 h and 6000 h are electrical systems, followed by hydraulic systems, which should be paid attention to in fault diagnosis and health maintenance.
4. Comparison Analysis
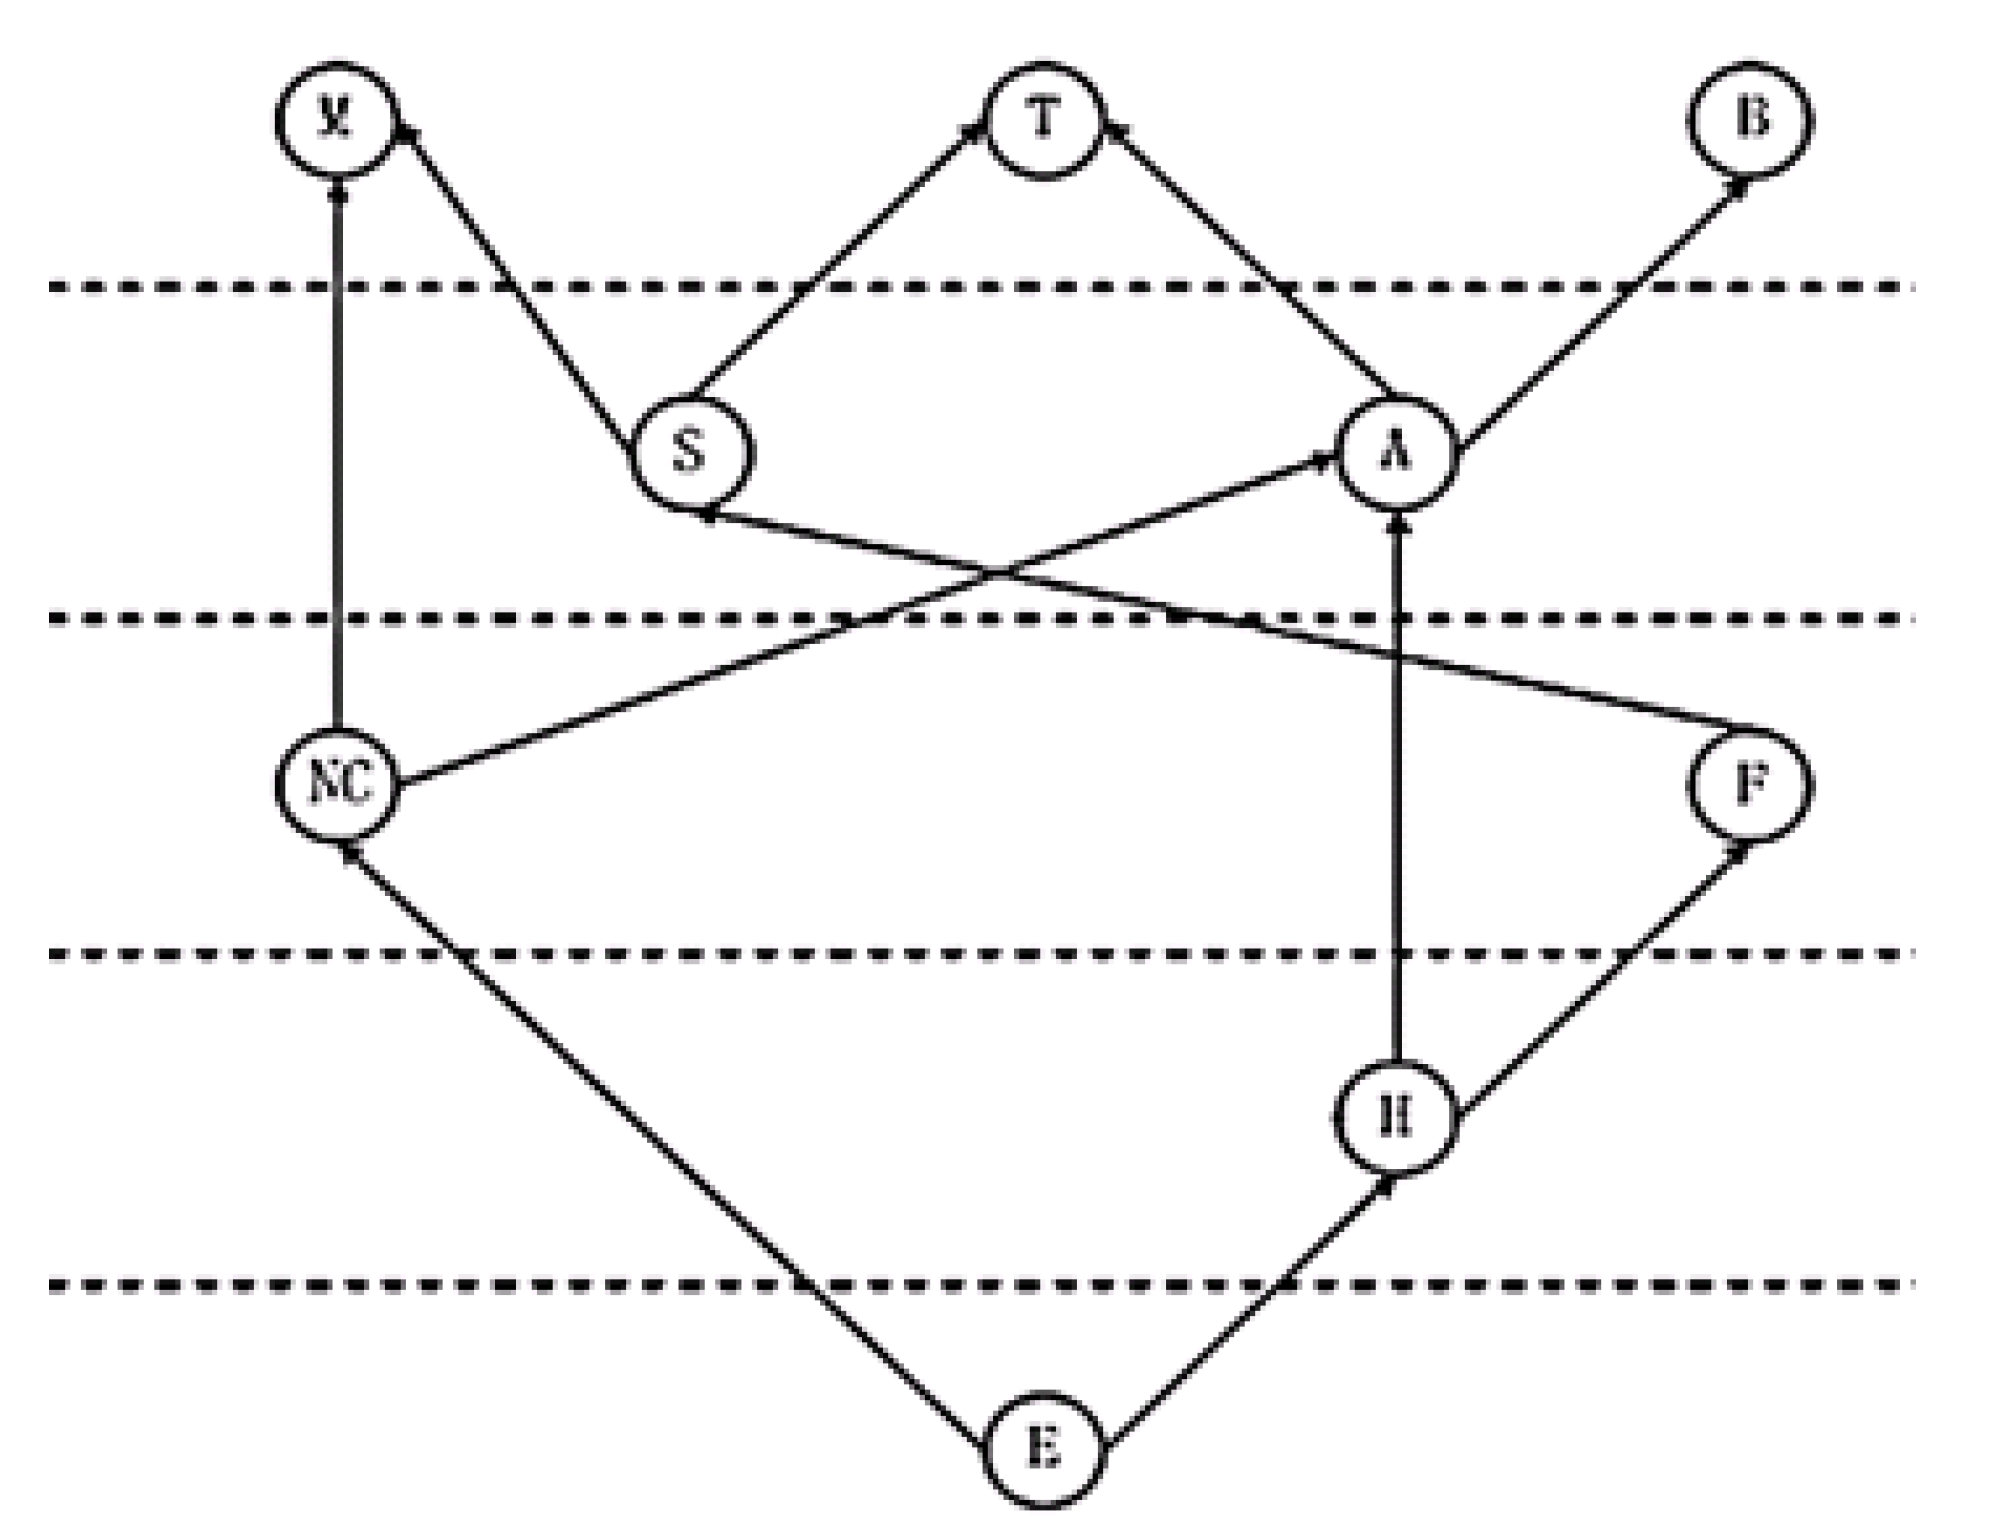
In this paper, the proposed method is compared with the key component identification method based on the fault propagation intensity [38]. This method comprehensively considers the dual influence of the fault propagation structure characteristics of the CNC lathe and the reliability level of the system component itself. Based on the layered fault propagation directed graph of CNC lathe, the fault propagation cost was measured by selecting the fault impact degree of directed edge and edge mediums to find the key components that have great influence on the whole machine. According to the fault data of the above case, the hierarchical fault propagation directed graph is constructed as shown in Figure 6.
The fault propagation intensity value of each directed edge in the graph is calculated as shown in Table 7.
The fault propagation intensity values of the directed edges starting from each component are added, and the fault propagation intensity of each component at 4000 h and 6000 h is shown in Table 8.
According to the ranking results in Table 8, the key components of the system at the current moment by the method based on the identification of key components of fault propagation intensity are the electrical system, followed by the hydraulic system, which is consistent with the identification results of key components based on the dynamic influence of fault propagation, verifying the correctness and reliability of the method proposed in this paper.
Compared with the current methods and technologies, the method proposed in this paper mainly reflects the advantages of two aspects. On the one hand, the fault propagation structure model with each component of the system as the starting point can quickly and accurately analyze the fault propagation relationship of each component in the complex system. The operation program is relatively simple, and the fault propagation structure of each component is clearer. On the other hand, it provides a feasible and multi-faceted analysis method for the key component identification in view of the influence value of fault propagation, which is the core judgment criterion for identifying critical component and of great significance for ensuring system reliability.
5. Conclusions
This paper proposes a method to identify the key components of CNC lathe from the perspective of the influence of fault propagation. Based on the details of the fault information collected in the field, the relevant faults are analyzed, and the fault propagation structure diagram starting from each component of the system is established. The fault data is used to calculate dynamic fault rate, dynamic fault probability and dynamic fault influence degree, and then the dynamic fault propagation rate of the system components is calculated. Combined with the fault propagation structure diagram, the improved ASP algorithm is used to evaluate the fault propagation influence value of the components, and finally the dynamic and accurate identification of key components of CNC lathe is realized.
The results obtained in this paper can be used to formulate maintenance control strategy, provide reference for health maintenance and reliability design, and reduce unnecessary shutdown loss of CNC lathes. In the future, multiple attributes of importance, fault propagation influence and fragility can be considered to identify key components, and the method can be extended to the identification of key components of other complex CNC equipment.
Author Contributions
Conceptualization, L.L. and Y.Z.; methodology, L.L.; software, G.G.; validation, L.L. and G.S.; formal analysis, Y.Z.; investigation, L.L. and G.G.; resources, G.S.; data curation, Y.Z.; writing—original draft preparation, L.L.; writing—review and editing, L.L.; visualization, G.G.; supervision, Y.Z.; project administration, G.S.; funding acquisition, Y.Z. All authors have read and agreed to the published version of the manuscript.
Funding
This research was funded by the Jilin Province Science and Technology Development Plan Project (Grant No. 20190302104GX) and the Jilin Provincial Natural Science Foundation (Grant No. 20170101212JC).
Institutional Review Board Statement
Not applicable.
Informed Consent Statement
Not applicable.
Data Availability Statement
Not applicable.
Conflicts of Interest
The authors declare no conflict of interest.
References
- Martinova, L.I.; Martinov, G.M. Prospects for CNC machine tools. Russ. Eng. Res. 2019, 39, 1080–1083. [Google Scholar] [CrossRef]
- Peukert, B.W.; Archenti, A. Dynamic interaction between precision machine tools and their foundations. Int. J. Autom. Technol. 2020, 14, 386–398. [Google Scholar] [CrossRef]
- Daqing, L.; Yinan, J.; Rui, K.; Havlin, S. Spatial correlation analysis of cascading failures: Congestions and blackouts. Sci. Rep. 2014, 4, 5381. [Google Scholar] [CrossRef] [Green Version]
- Lin, S.; Jia, L.-M.; Wang, Y.-H. Identification of critical components of high-speed train system based on interval-value intuitionistic hesitant fuzzy set. Control Theory Appl. 2019, 36, 295–306. [Google Scholar]
- Ruijters, E.; Stoelinga, M. Fault tree analysis: A survey of the state-of-the-art in modeling, analysis and tools. Comput. Sci. Rev. 2015, 15, 29–62. [Google Scholar] [CrossRef] [Green Version]
- Chen, F.; Wang, C.; Wang, J.; Zhi, Y.; Wang, Z. Risk assessment of chemical process considering dynamic probability of near misses based on Bayesian theory and event tree analysis. J. Loss Prev. Process Ind. 2020, 68, 104280. [Google Scholar] [CrossRef]
- Zhang, D.; Zhang, Y.; Yu, M.; Chen, Y. Reliability evaluation and component importance measure for manufacturing systems based on failure losses. J. Intell. Manuf. 2017, 28, 1859–1869. [Google Scholar] [CrossRef]
- Wen, M.; Chen, Y.; Yang, Y.; Kang, R.; Zhang, Y. Resilience-based component importance measures. Int. J. Robust Nonlinear Control. 2020, 30, 4244–4254. [Google Scholar] [CrossRef]
- Miziuła, P.; Navarro, J. Birnbaum importance measure for reliability systems with dependent components. IEEE Trans. Reliab. 2019, 68, 439–450. [Google Scholar] [CrossRef]
- Wu, S.; Chen, Y.; Wu, Q.; Wang, Z. Linking component importance to optimisation of preventive maintenance policy. Reliab. Eng. Syst. Saf. 2016, 146, 26–32. [Google Scholar] [CrossRef] [Green Version]
- Dui, H.; Si, S.; Zuo, M.J.; Sun, S. Semi-Markov process-based integrated importance measure for multi-state systems. IEEE Trans. Reliab. 2015, 64, 754–765. [Google Scholar] [CrossRef]
- Zhu, D.; Wang, H.; Wang, R.; Duan, J.; Bai, J. Identification of Key Nodes in a Power Grid Based on Modified PageRank Algorithm. Energies 2022, 15, 797. [Google Scholar] [CrossRef]
- Su, Q.; Chen, C.; Sun, Z.; Li, J. Identification of critical nodes for cascade faults of grids based on electrical PageRank. Glob. Energy Interconnect. 2021, 4, 587–595. [Google Scholar] [CrossRef]
- Rubinov, M.; Olaf, S. Complex network measures of brain connectivity: Uses and interpretations. Neuroimage 2010, 52, 1059–1069. [Google Scholar] [CrossRef] [PubMed]
- Fu, K.; Xia, J.; Zhao, X. Node importance evaluation in dynamic convergence complex networks. J. Harbin Inst. Technol. 2017, 49, 112–119. [Google Scholar]
- Benzi, M.; Klymko, C. On the limiting behavior of parameter-dependent network centrality measures. SIAM J. Matrix Anal. Appl. 2015, 36, 686–706. [Google Scholar] [CrossRef] [Green Version]
- Singh, R.; Chakraborty, A.; Manoj, B.S. GFT centrality: A new node importance measure for complex networks. Phys. A Stat. Mech. Appl. 2017, 487, 185–195. [Google Scholar] [CrossRef]
- Bonacich, P.; Lloyd, P. Eigenvector centrality and structural zeroes and ones: When is a neighbor not a neighbor? Soc. Netw. 2015, 43, 86–90. [Google Scholar] [CrossRef]
- Qiu, L.; Zhang, J.; Tian, X.; Zhang, S. Identifying Influential Nodes in Complex Networks Based on Neighborhood Entropy Centrality. Comput. J. 2021, 64, 1465–1476. [Google Scholar] [CrossRef]
- Terdenge, L.M.; Heisel, S.; Schembecker, G.; Wohlgemuth, K. Agglomeration degree distribution as quality criterion to evaluate crystalline products. Chem. Eng. Sci. 2015, 133, 157–169. [Google Scholar] [CrossRef]
- Marmouch, S.; Aroui, T.; Koubaa, Y. Statistical neural networks for induction machine fault diagnosis and features processing based on principal component analysis. IEEJ Trans. Electr. Electron. Eng. 2021, 16, 307–314. [Google Scholar] [CrossRef]
- Wang, B.; Wang, Y.; Hao, Y. Identifying key component in high-speed train based on complex network. In Proceedings of the 4th International Conference on Traffic Engineering and Transportation System, Dalian, China, 21–23 August 2020; IOP Publishing: Bristol, UK, 2020; Volume 587, p. 012047. [Google Scholar]
- Zhang, Y.; Lu, Y.; Yang, G.; Hang, Z. Multi-Attribute Decision Making Method for Node Importance Metric in Complex Network. Appl. Sci. 2022, 12, 1944. [Google Scholar] [CrossRef]
- Jiang, L.; Sun, F.; Lian, J. Comprehensive evaluation model of abnormal production data based on Entropy Weight Method and TOPSIS Method. Int. J. Front. Eng. Technol. 2021, 3. [Google Scholar] [CrossRef]
- Jiang, J.; Ren, M.; Wang, J. Interval number multi-attribute decision-making method based on TOPSIS. Alex. Eng. J. 2022, 61, 5059–5064. [Google Scholar] [CrossRef]
- Wang, X. Application of Grey Relation Analysis Theory to Choose High Reliability of the Network Node. J. Phys. Conf. Ser. 2019, 1237, 032056. [Google Scholar] [CrossRef] [Green Version]
- Jiang, Z.; Zhao, T.; Wang, S.; Ren, F. A novel risk assessment and analysis method for correlation in a complex system based on multi-dimensional theory. Appl. Sci. 2020, 10, 3007. [Google Scholar] [CrossRef]
- Li, W.; He, M.; Sun, Y.; Cao, Q. A novel layered fuzzy Petri nets modelling and reasoning method for process equipment failure risk assessment. J. Loss Prev. Process Ind. 2019, 62, 103953. [Google Scholar] [CrossRef]
- Weiren, S.; Kai, W. Floyd algorithm for the shortest path planning of mobile robot. Chin. J. Sci. Instrum. 2009, 30, 2088–2092. [Google Scholar]
- Huang, Q.R.; Cao, M. Study on the Improvement of Floyd Algorithm and its Application in Network Plan. Appl. Mech. Mater. 2014, 3488, 1312–1315. [Google Scholar] [CrossRef]
- Tang, K.; Pan, C.; Qian, M. Manufacturing/Remanufacturing Logistics Network Optimization Based on Floyd Algorithm. J. Phys. Conf. Ser. 2019, 1288, 012026. [Google Scholar] [CrossRef]
- Li, Y.F.; Zhang, Y.J.; Dai, B.C.; Zhang, L. Dynamic importance analysis of components with known failure contribition of complex systems. Math. Probl. Eng. 2018, 2018, 8534065. [Google Scholar]
- Peng, H.; Coit, D.W.; Feng, Q.M. Component reliability criticality or importance measures for systems with degrading components. IEEE Trans. Reliab. 2012, 61, 4–12. [Google Scholar] [CrossRef]
- Fang, C.L.; Liu, H.M.; Li, G.D. International progress and evaluation on interactive coupling effects between urbanization and the eco-environment. J. Geogr. Sci. 2016, 26, 1081–1116. [Google Scholar] [CrossRef]
- Mu, L.; Zhang, Y.; Liu, J.; Zhai, F.; Song, J. Dynamic Analysis Method for Fault Propagation Behaviour of Machining Centres. Appl. Sci. 2021, 11, 6525. [Google Scholar] [CrossRef]
- Yi-Run, R.; Song-Yang, L.; Jun-De, W.; Liang, B.; Lu-Lin, H. An improved evaluating method of node spreading influence in complex network based on information spreading probability. Acta Phys. Sin. 2017, 66, 208901. [Google Scholar] [CrossRef]
- Fowler, J.H.; Christakis, N.A. Dynamic spread of happiness in a large social network: Longitudinal analysis over 20 years in the Framingham Heart Study. BMJ 2008, 337, a2338. [Google Scholar] [CrossRef] [Green Version]
- Zhang, Y.Z.; Liu, J.T.; Shen, G.X.; Long, Z.; Sun, S.G. Reliability evaluation of machine center components based on cascading failure analysis. Chin. J. Mech. Eng. 2017, 30, 933–942. [Google Scholar] [CrossRef]
Figure 1.
Schematic diagram of critical component identification.

Figure 2.
Dynamic fault rate calculation process of CNC lathe components.

Figure 3.
Fault propagation structure diagram of each component of CNC lathe. (a) NC as a starting point, (b) F as a starting point, (c) M as a starting point, (d) E as a starting point, (e) S as a starting point, (f) T as a starting point, (g) H as a starting point, (h) A as a starting point, (i) B as a starting point.

Figure 4.
Probability importance function curve of system components.
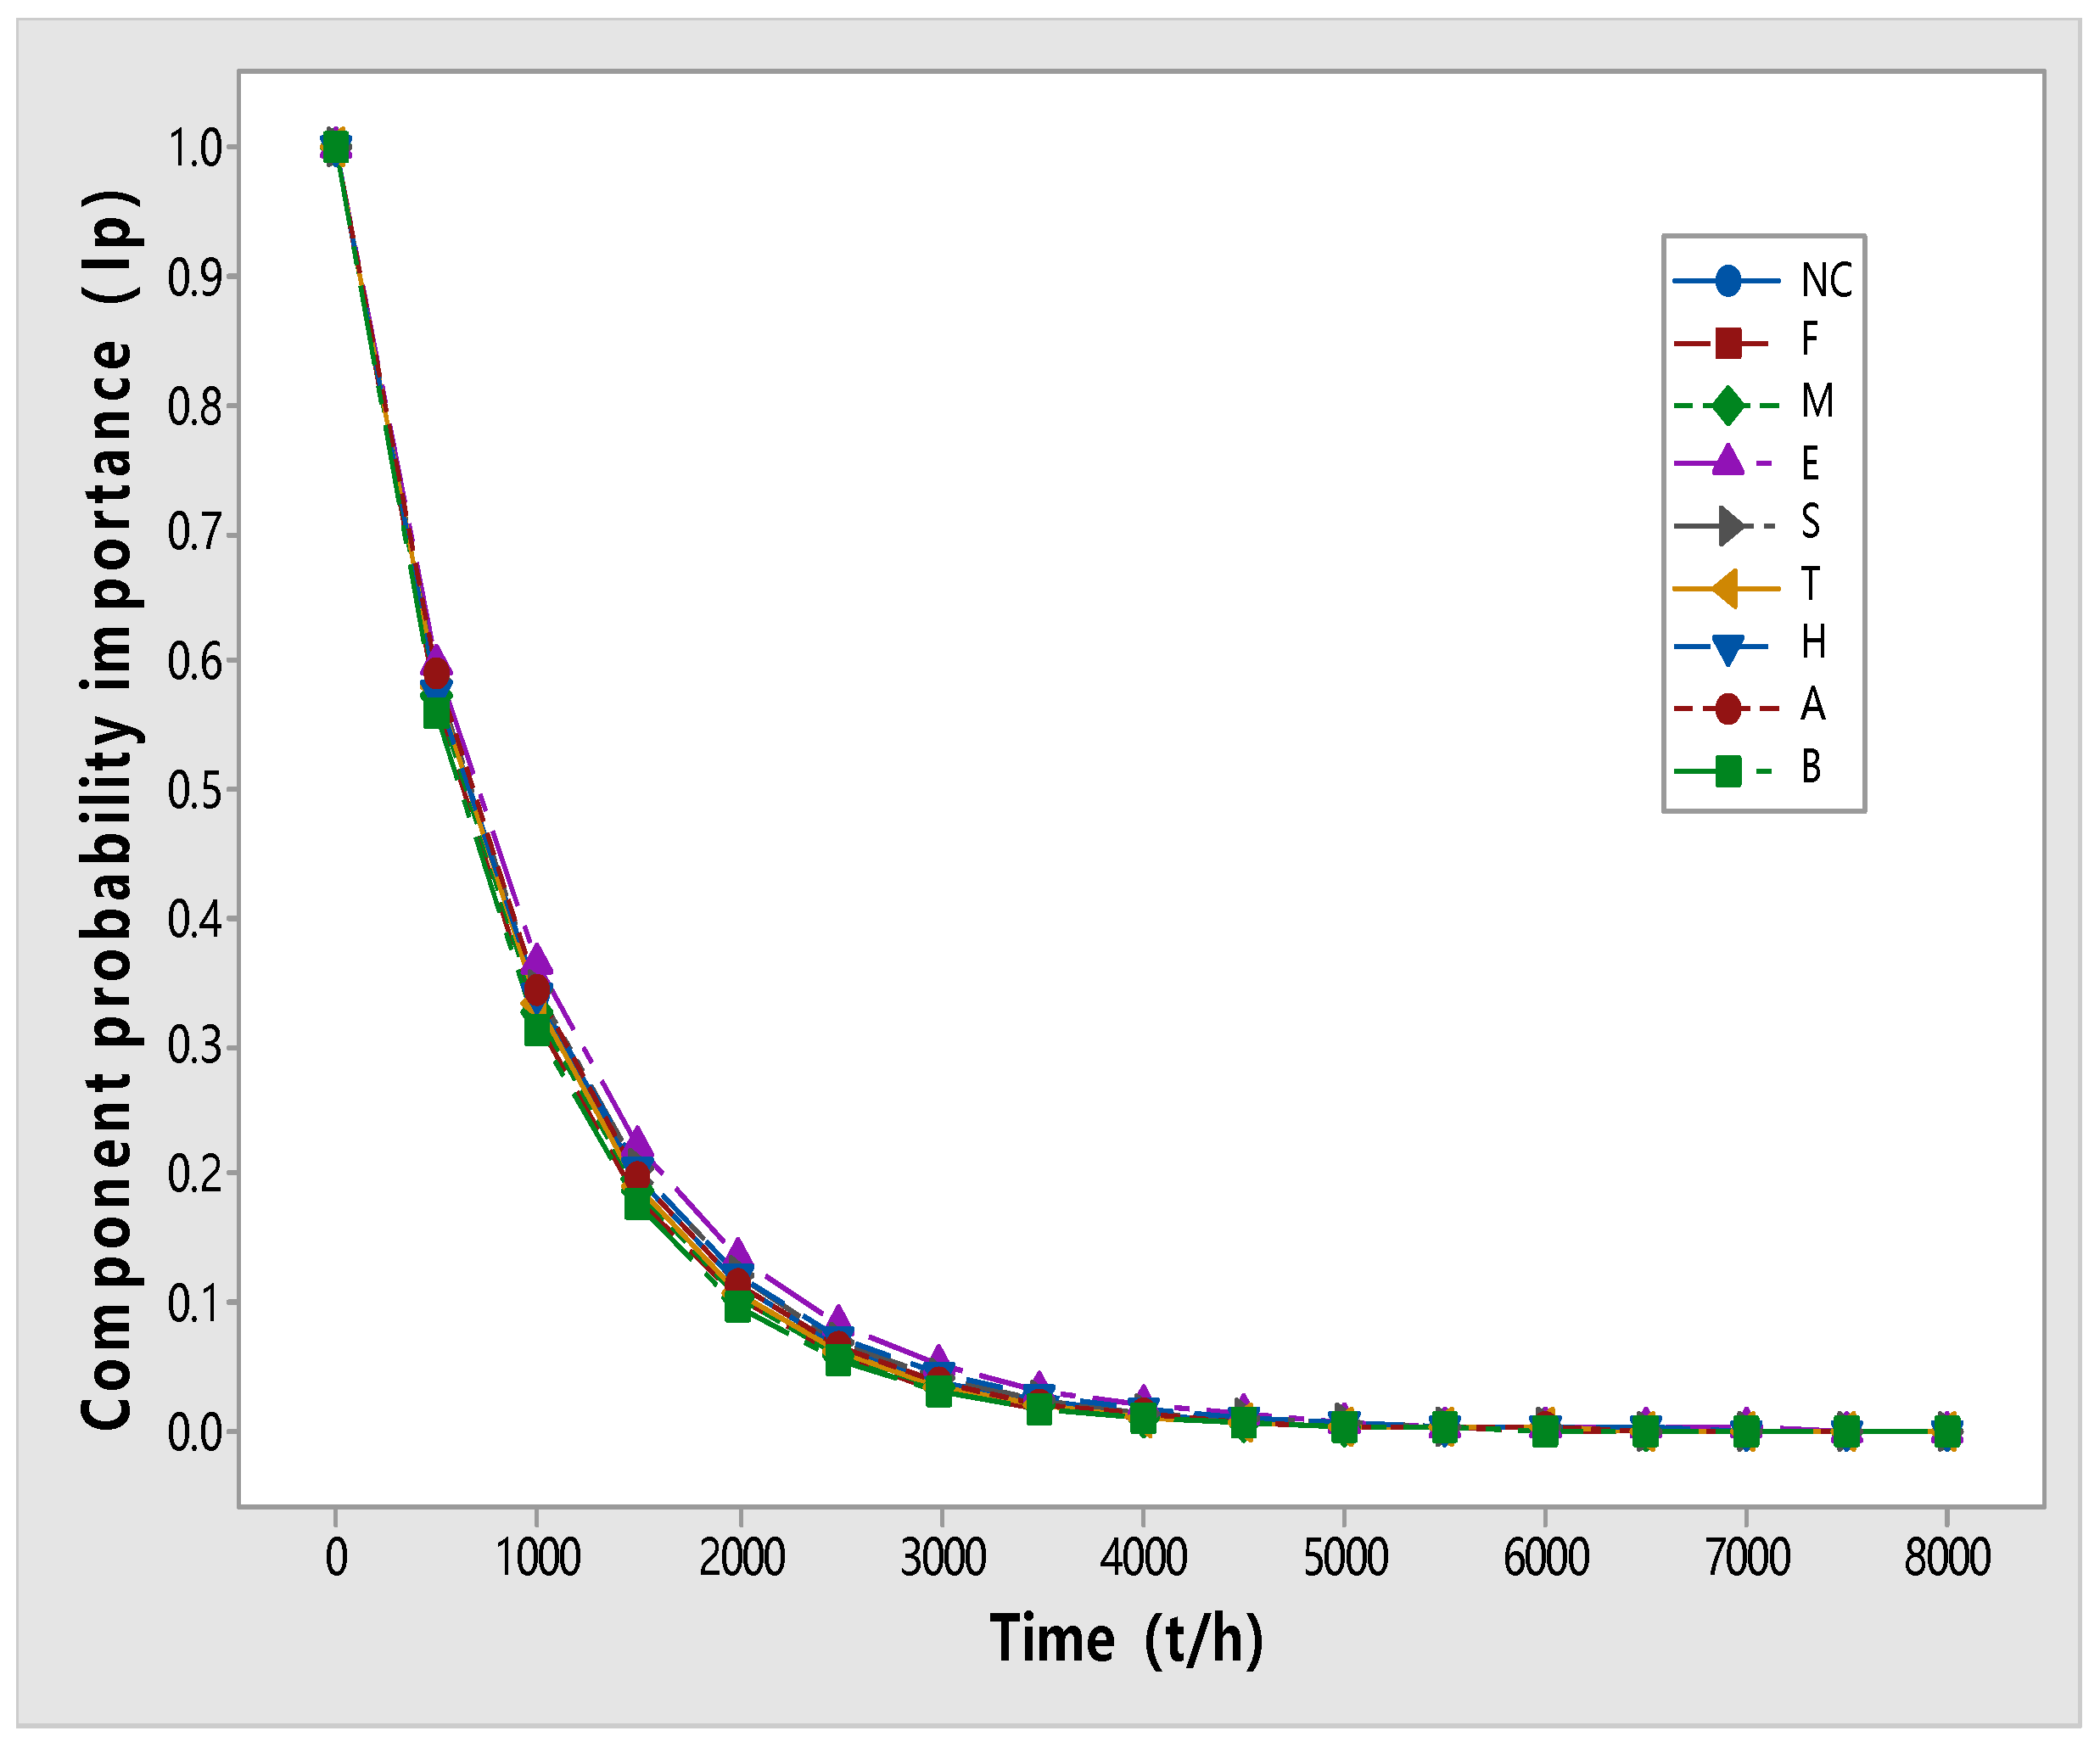
Figure 5.
Criticality importance function curve of system components.
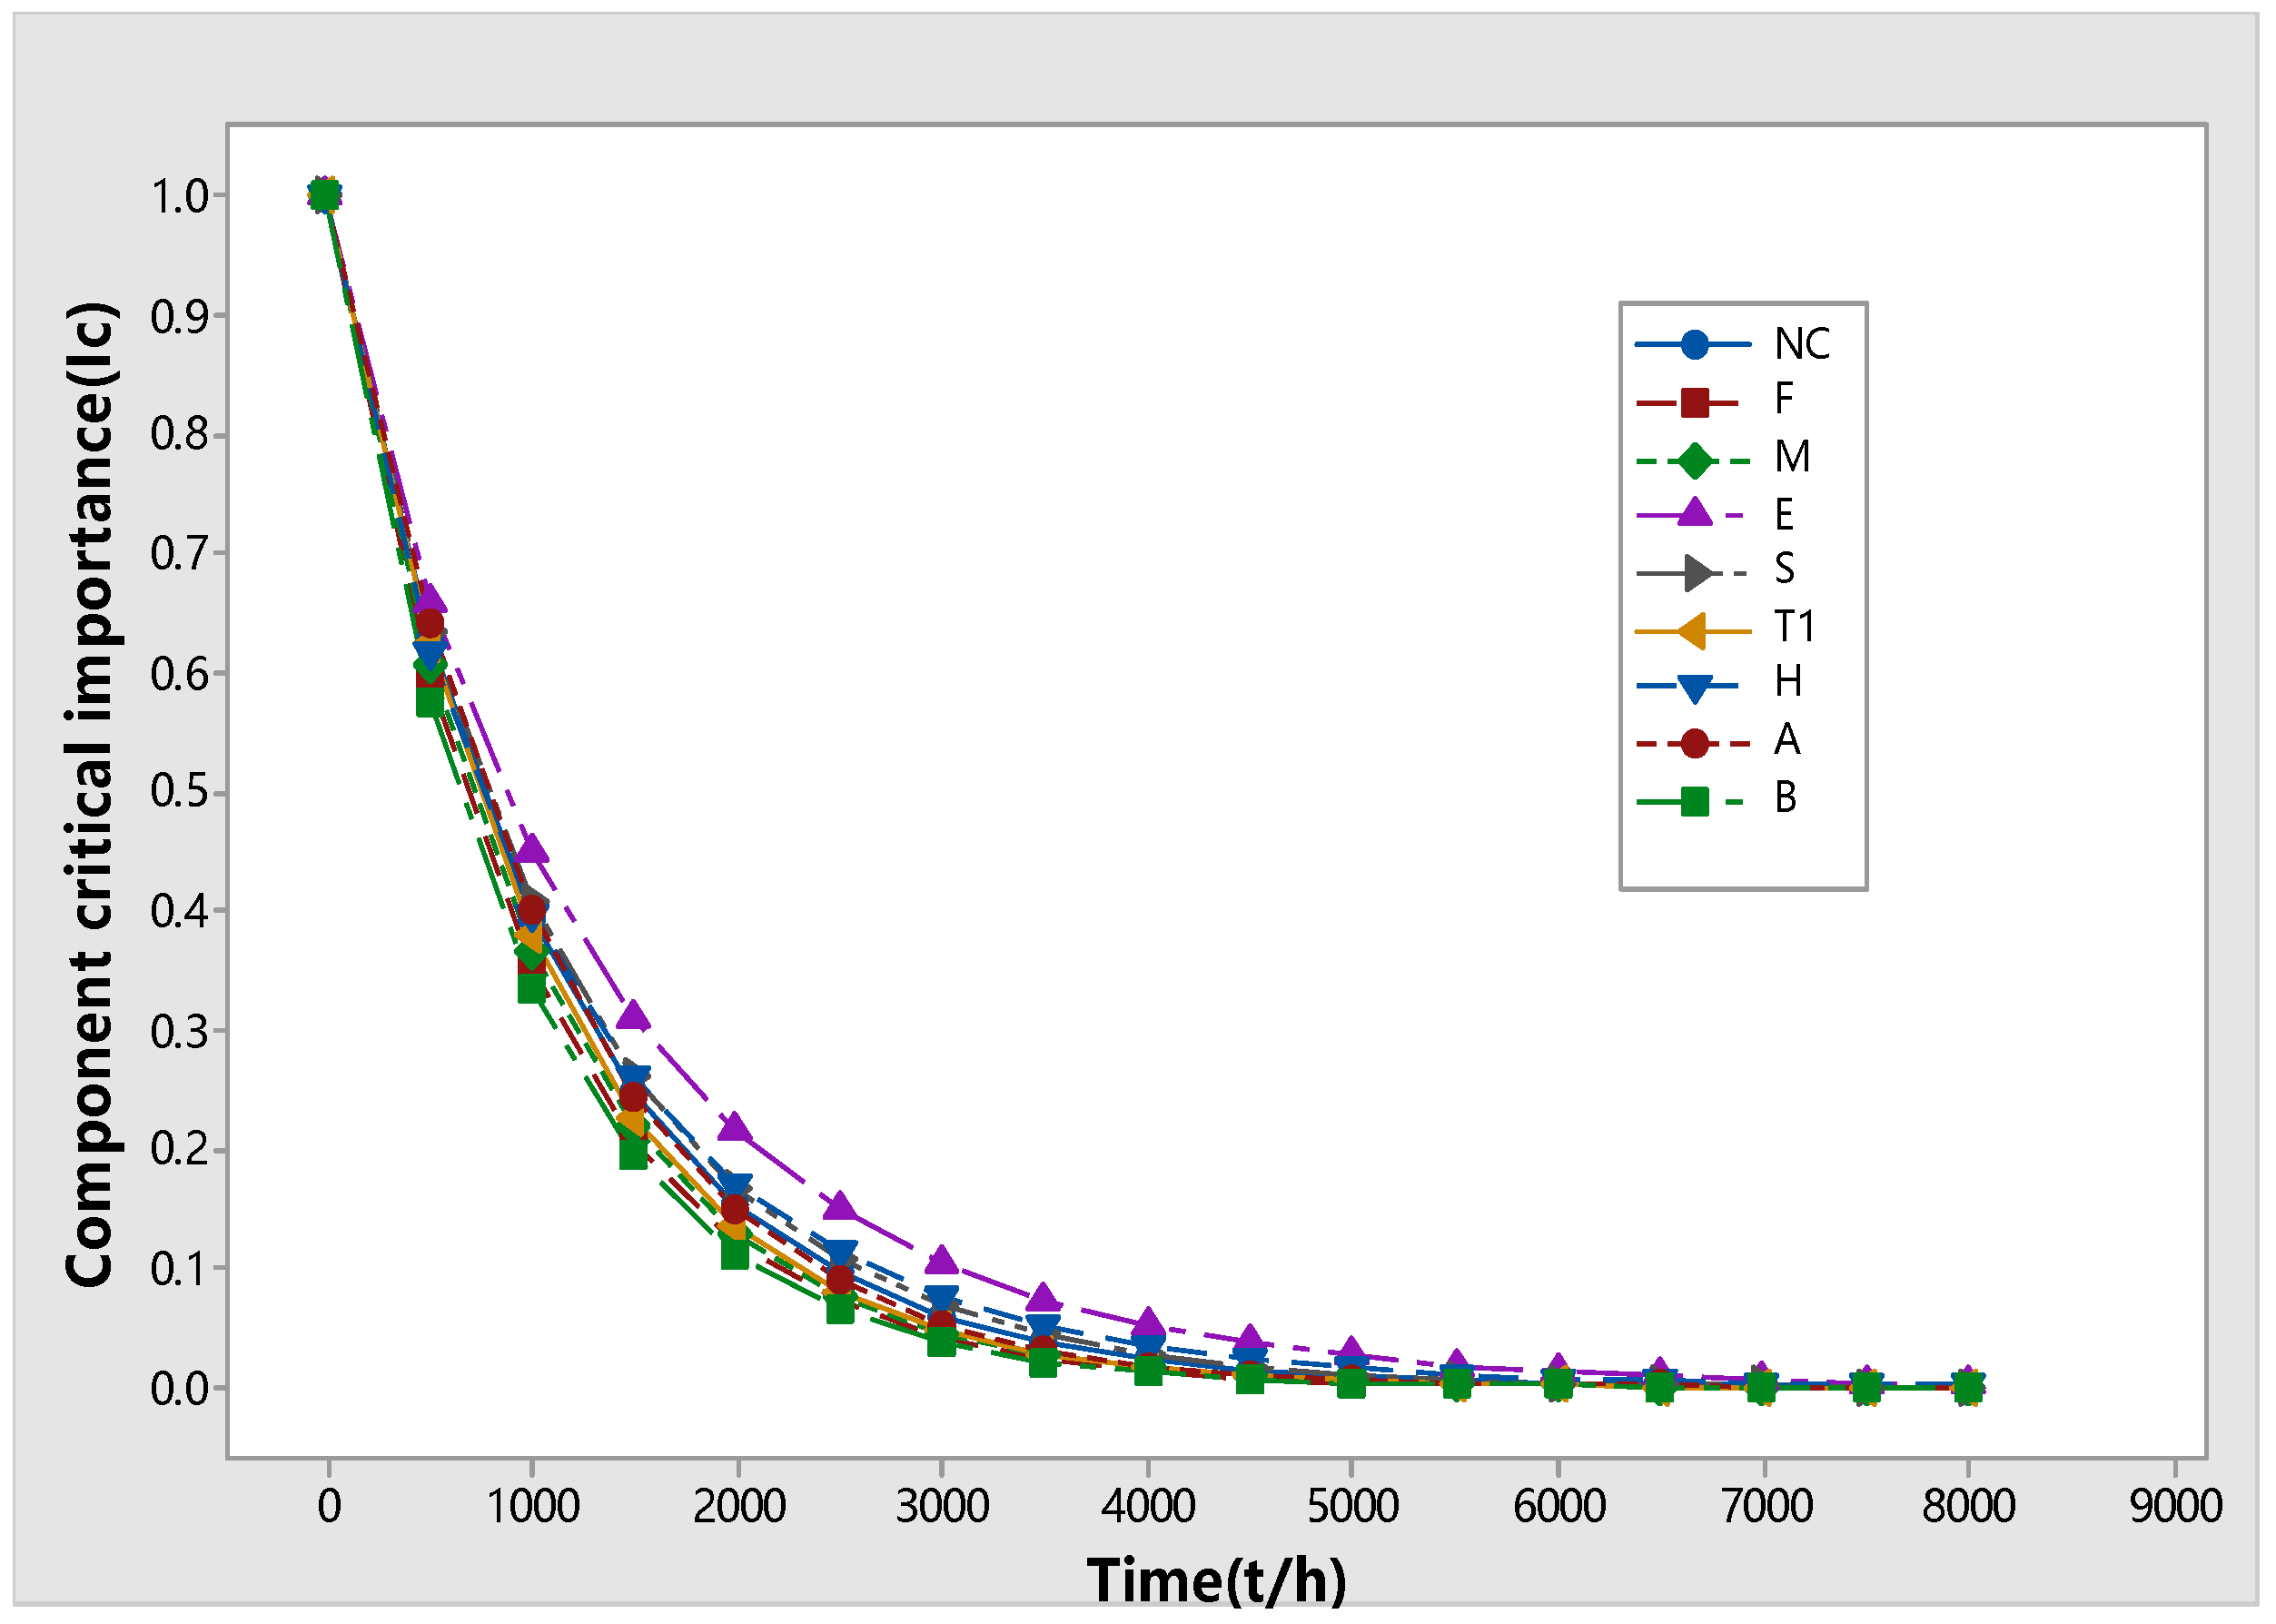
Figure 6.
Hierarchical model of fault propagation between components in CNC lathe.

Table 1.
System component code and failure time statistics table.
| Element Code and Name | Fault Time (h) | |||||
|---|---|---|---|---|---|---|
| Numerical control | 29.54 | 99.31 | 172.53 | 235.26 | 348.63 | 406.73 |
| system (NC) | 609.18 | 725.92 | 971.39 | 1058.25 | 1189.59 | 1363.59 |
| 1564.23 | 1853.46 | 2111.67 | ||||
| Feed system (F) | 52.49 | 135.57 | 309.27 | 589.69 | 726.11 | 868.53 |
| 1276.37 | 1486.23 | 2275.64 | ||||
| Electrical system (E) | 30.75 | 80.74 | 126.85 | 160.85 | 219.37 | 319.75 |
| 333.39 | 435.97 | 581.55 | 683.86 | 689.83 | 750.35 | |
| 784.27 | 957.84 | 1015.73 | 1146.33 | 1268.24 | 1305.53 | |
| 1496.54 | 1596.24 | 1812.53 | 1856.96 | 2073.36 | 2546.35 | |
| 2943.71 | ||||||
| Tool holder (M) | 58.63 | 72.63 | 116.78 | 348.36 | 420.75 | 551.71 |
| 1029.27 | 1116.58 | 1531.33 | 1860.67 | 2755.26 | ||
| Servo system (S) | 28.53 | 116.36 | 174.64 | 246.59 | 275.57 | 333.53 |
| 406.36 | 449.63 | 592.73 | 707.59 | 896.47 | 1160.36 | |
| 1264.74 | 1408.49 | 1643.68 | 1785.24 | 1972.74 | 2465.46 | |
| Main driving system (T) | 43.57 | 58.35 | 103.57 | 161.47 | 219.63 | 278.54 |
| 420.47 | 565.97 | 841.977 | 1334.44 | 1667.38 | 1986.96 | |
| Hydraulic system (H) | 67.45 | 143.53 | 246.52 | 297.68 | 347.53 | 406.86 |
| 464.49 | 551.41 | 638.83 | 826.5 | 1015.58 | 1102.09 | |
| 1256.36 | 1580.56 | 1972.47 | 2436.37 | |||
| Auxiliary system (A) | 15.82 | 42.57 | 92.75 | 169.53 | 195.46 | 284.38 |
| 363.36 | 498.75 | 652.85 | 797.3 | 975.35 | 1029.86 | |
| 1276.29 | 1421.96 | 1940.47 | 2812.5 | |||
| Base piece (B) | 89.75 | 278.93 | 568.27 | 758.53 | 1136.57 | 2264.43 |
Table 2.
Statistical analysis of the related faults in CNC lathe components.
| Antecedent Component | Subsequent Component | Antecedent Component | Subsequent Component |
|---|---|---|---|
| NC | M | E | A |
| NC | T | E | B |
| NC | A | S | M |
| NC | B | S | T |
| F | S | H | F |
| E | NC | H | M |
| E | F | H | A |
| E | M | H | B |
| E | T | A | T |
| E | H | A | B |
Table 3.
Dynamics fault rate function of system components in CNC lathe.
| Component Code | Dynamics Fault Rate Function |
|---|---|
| NC | |
| F | |
| M | |
| E | |
| S | |
| T | |
| H | |
| A | |
| B |
Table 4.
The fault probability function of system components in CNC lathe.
| Component Code | Fault Probability Function |
|---|---|
| NC | |
| F | |
| M | |
| E | |
| S | |
| T | |
| H | |
| A | |
| B |
Table 5.
Fault propagation rate of system components in CNC lathe.
| Propagation Path | ||||
|---|---|---|---|---|
| (E as a starting point) | ||||
| E→NC | 0.918448361 | 0.000254995 | 0.796881103 | 0.000231419 |
| E→H | 0.977647161 | 0.000271431 | 0.956705067 | 0.000277833 |
| H→A | 0.956717540 | 0.000221941 | 0.848962399 | 0.000211872 |
| H→F | 0.909115084 | 0.000210898 | 0.766856527 | 0.000191382 |
| NC→M | 0.981947229 | 0.000141439 | 0.955113065 | 0.000137078 |
| NC→A | 0.995526834 | 0.000143395 | 0.982569130 | 0.000141019 |
| A→B | 0.979554928 | 0.000098696 | 0.969648730 | 0.000091128 |
| A→T | 0.996958535 | 0.000100450 | 0.994247429 | 0.000093440 |
| F→S | 0.945228319 | 0.000078409 | 0.875293970 | 0.000071674 |
| (NC as a starting point) | ||||
| NC→A | 0.995526834 | 0.000143395 | 0.982569130 | 0.000141019 |
| NC→M | 0.981947229 | 0.000141414 | 0.955113065 | 0.000137078 |
| A→B | 0.979554928 | 0.000098696 | 0.969648730 | 0.000091128 |
| A→T | 0.996958535 | 0.000100450 | 0.994247429 | 0.000093440 |
| (F as a starting point) | ||||
| F→S | 0.945228319 | 0.000078409 | 0.875293970 | 0.000071674 |
| S→T | 0.963840493 | 0.000169284 | 0.902043089 | 0.000160421 |
| S→M | 0.958919595 | 0.000168419 | 0.898204379 | 0.000159738 |
| (S as a starting point) | ||||
| S→T | 0.963840493 | 0.000169284 | 0.902043089 | 0.000160421 |
| S→M | 0.958919595 | 0.000168419 | 0.898204379 | 0.000159738 |
| (A as a starting point) | ||||
| A→T | 0.996958535 | 0.000100450 | 0.994247429 | 0.000093440 |
| A→B | 0.979554928 | 0.000098696 | 0.969648730 | 0.000091128 |
| (H as a starting point) | ||||
| H→F | 0.909115084 | 0.000210898 | 0.766856527 | 0.000191382 |
| H→A | 0.956717540 | 0.000221941 | 0.848962399 | 0.000211872 |
| F→S | 0.945228319 | 0.000078409 | 0.875293970 | 0.000071674 |
| S→M | 0.958919595 | 0.000168419 | 0.898204379 | 0.000159738 |
| A→T | 0.996958535 | 0.000100450 | 0.994247429 | 0.000093440 |
| A→B | 0.979554928 | 0.000098696 | 0.969648730 | 0.000091128 |
Table 6.
Numerical control lathe fault propagation influence value and rank.
| Component Code | Rank | Rank | ||
|---|---|---|---|---|
| NC | 0.000284891 | 4 | 0.000278149 | 4 |
| F | 0.000078462 | 6 | 0.000071720 | 6 |
| M | 0 | 7 | 0 | 7 |
| E | 0.000538541 | 1 | 0.000509605 | 1 |
| S | 0.000337703 | 3 | 0.000320159 | 3 |
| T | 0 | 7 | 0 | 7 |
| H | 0.000434398 | 2 | 0.000404833 | 2 |
| A | 0.000199146 | 5 | 0.000184567 | 5 |
| B | 0 | 7 | 0 | 7 |
Table 7.
Fault propagation intensity value of each edge of the fault propagation structure model of CNC lathe.
Table 7.
Fault propagation intensity value of each edge of the fault propagation structure model of CNC lathe.
| Directed Edge | Fault Propagation Intensity Value (4000 h) | Fault Propagation Intensity Value (6000 h) |
|---|---|---|
| E→NC | 0.17773814 | 0.165807 |
| E→H | 0.26106422 | 0.262317 |
| H→A | 0.20396607 | 0.200436 |
| H→F | 0.22417257 | 0.216161 |
| NC→M | 0.12332509 | 0.128086 |
| NC→A | 0.16248011 | 0.168651 |
| A→B | 0.13769959 | 0.141097 |
| A→T | 0.11370514 | 0.117754 |
| F→S | 0.24395299 | 0.246486 |
| S→M | 0.18203743 | 0.18273 |
| S→T | 0.16985866 | 0.170474 |
Table 8.
Fault propagation strength and ranking of system components in CNC lathe.
| Component Code | Fault Probability | Fault Propagation Strength (4000 h) | Rank | Fault Probability | Fault Propagation Strength (6000 h) | Rank |
|---|---|---|---|---|---|---|
| NC | 0.440846 | 0.285805 | 4 | 0.580568 | 0.296737 | 4 |
| F | 0.290179 | 0.243953 | 6 | 0.398005 | 0.246486 | 6 |
| M | 0.322855 | 0 | 7 | 0.430764 | 0 | 7 |
| E | 0.632003 | 0.438802 | 1 | 0.79164 | 0.428125 | 1 |
| S | 0.494166 | 0.351896 | 3 | 0.644833 | 0.353204 | 3 |
| T | 0.335338 | 0 | 7 | 0.436309 | 0 | 7 |
| H | 0.544449 | 0.428139 | 2 | 0.718822 | 0.416597 | 2 |
| A | 0.385268 | 0.251405 | 5 | 0.493773 | 0.258851 | 5 |
| B | 0.246186 | 0 | 7 | 0.350279 | 0 | 7 |
Publisher’s Note: MDPI stays neutral with regard to jurisdictional claims in published maps and institutional affiliations. |
© 2022 by the authors. Licensee MDPI, Basel, Switzerland. This article is an open access article distributed under the terms and conditions of the Creative Commons Attribution (CC BY) license (https://creativecommons.org/licenses/by/4.0/).
Share and Cite
MDPI and ACS Style
Luan, L.; Shen, G.; Zhang, Y.; Guo, G. Identification of Key Components of CNC Lathe Based on Dynamic Influence of Fault Propagation. Appl. Sci. 2022, 12, 6187. https://doi.org/10.3390/app12126187
AMA Style
Luan L, Shen G, Zhang Y, Guo G. Identification of Key Components of CNC Lathe Based on Dynamic Influence of Fault Propagation. Applied Sciences. 2022; 12(12):6187. https://doi.org/10.3390/app12126187
Chicago/Turabian StyleLuan, Lan, Guixiang Shen, Yingzhi Zhang, and Guiming Guo. 2022. "Identification of Key Components of CNC Lathe Based on Dynamic Influence of Fault Propagation" Applied Sciences 12, no. 12: 6187. https://doi.org/10.3390/app12126187
Note that from the first issue of 2016, this journal uses article numbers instead of page numbers. See further details here.