
Pressure- and Size-Dependent Aerodynamic Drag Effects on Mach 0.3–2.2 Microspheres for High-Precision Micro-Ballistic Characterization


Department of Mechanical and Industrial Engineering, University of Massachusetts, Amherst, MA 01003, USA
*
Author to whom correspondence should be addressed.
Appl. Sci. 2022, 12(13), 6622; https://doi.org/10.3390/app12136622
Submission received: 24 May 2022
/
Revised: 27 June 2022
/
Accepted: 28 June 2022
/
Published: 30 June 2022
(This article belongs to the Section Mechanical Engineering)
Abstract
:Featured Application
The present study measures aerodynamic drag effects on microspheres for the purpose of improving the accuracy of microsphere flight modeling. Applications that will benefit from improved accuracy include microscopic ballistic testing and projectile gene delivery.
Abstract
The acceleration of microparticles to supersonic velocities is required for microscopic ballistic testing, a method for understanding material characteristics under extreme dynamic conditions, and for projectile gene and drug delivery, a needle-free administration technique. However, precise aerodynamic effects upon supersonic microsphere motion at sub-300 Reynolds numbers have not been quantified. We derive drag coefficients for microspheres traveling in air at subsonic, transonic, and supersonic velocities from the measured trajectories of microspheres launched by laser-induced projectile acceleration. Moreover, the observed drag effects on microspheres in atmospheric (760 Torr) and reduced pressure (76 Torr) are compared with existing empirical data and drag coefficient models. We find that the existing models adequately predict the drag coefficient for subsonic microspheres, while rarefaction effects cause a discrepancy between the model and empirical data in the supersonic regime. These results will improve microsphere flight modeling for high-precision microscopic ballistic testing and projectile gene and drug delivery.
1. Introduction
Accurate knowledge of a projectile’s velocity is essential for improving the accuracy of its impact dynamics. Over the trajectory of the projectile’s flight, its deceleration rate varies due to the evolution of the surrounding fluid flow conditions [1]. These conditions are reflected in the projectile’s drag coefficient (), making the quantification of as a function of the projectile’s velocity useful for modeling its flight and impact velocity. This is of particular importance to the laser-induced projectile impact test (LIPIT) [2,3,4], an emerging microscopic mechanical characterization method utilizing supersonic micro-projectiles to apply localized ultrahigh-strain-rate inelastic stimulus to a specimen. In LIPIT, it is essential to quantify the velocity of the micro-projectile as it impacts the specimen to determine the kinetic energy it delivers. Improved quantification of will enable the impact velocity, and kinetic energy at impact, to be modeled more accurately. Moreover, improved knowledge of can benefit projectile gene [5,6,7,8] and drug [9,10,11] delivery, where a DNA-, RNA-, or drug-coated microprojectile’s impact velocity determines its penetration depth into the soft tissue substrate. Precise depths must be reached to achieve the desired gene therapy or pharmacological effect. For instance, administration through the skin requires that the projectiles carry sufficient kinetic energy to pass through the skin’s stratum corneum and reach the viable epidermis [7,9,10,11]. By improving the accuracy of modeling, calibration of the instruments launching these projectiles may be improved so that the genes or drugs are delivered to the target tissue with greater efficacy.
In both micro-ballistic characterization and projectile delivery of genes and drugs, microspheres often travel at supersonic Mach numbers () and low Reynolds numbers ( < 300). Prior methods of quantifying for spheres within this high-, low- experimental space have included wind tunnel testing [12,13,14] and ballistics [15]. To access < 300, these methods have typically used macro-scale spheres (0.8 < diameter () < 25 mm) in low air pressure environments ( < 5 Torr) [12,13,14,15]. However, quantifying in near-vacuum conditions may suppress fluid flow characteristics that affect microsphere flight in the atmospheric pressure conditions of micro-ballistic characterization and projectile delivery of genes and drugs. In this work, we use laser-induced projectile acceleration to quantify for microspheres (3.7 7.6 µm) in = 760 and 76 Torr at 0.3 < < 2.2 and 5 < < 300 and compare the results with existing empirical data and models. While the models agree with empirical data in the subsonic regime, we found their accuracy to diminish with increasing rarefaction in 1.2 < < 4 and < 300 conditions. These findings will benefit future work seeking to improve modeling of microsphere velocity in order to increase the efficacy of micro-ballistic characterization and projectile gene and drug delivery, where the projectile’s impact velocity and kinetic energy must be known with confidence.
2. Materials and Methods
In this work, we derived from the measured trajectories of silica microspheres ( = 3.7 and 7.6 μm) launched at initial velocities ranging from 90 to 770 m/s in two different air pressures ( = 760 and 76 Torr) using LIPIT. Experiments were conducted in 25 °C air, corresponding to a 346 m/s speed of sound [16] and air viscosity [16] of 1.8 × 10⁻⁵ Ns/m2. Air density [16], , was 1.2 kg/m3 in = 760 Torr and 0.12 kg/m3 in = 76 Torr. In LIPIT, which is illustrated in Figure 1a, microspheres are dispersed on the surface of a launch pad consisting of glass, gold, and crosslinked polydimethylsiloxane (PDMS) layers at respective thicknesses of 210 μm, 70 nm, and 30 μm. A 1064 nm laser pulse incident upon the underside of the launch pad locally ablates the gold film, causing a rapid expansion of the PDMS layer above it. This ablation launches the microsphere, whose flight is illuminated by ultrafast sub-picosecond white-light pulses at even time intervals (noted as in Figure 1a) and captured in a multi-exposure stroboscopic image, as in Figure 1b. is the microsphere’s velocity at the first exposure within the field of view, as noted in Figure 1a. Each individual microsphere was launched through a single 115 × 115 μm opening in a solid baffle positioned between 1 and 2 mm from the launch pad. The baffle blocked the propagation of shock waves produced by the ablation event, thereby ensuring that the air behind the baffle would remain undisturbed until the microsphere’s arrival through the opening. The exposures at and in Figure 1a represent the first and last exposures within the camera’s field of view, where ranged from 5 to 17. After calibrating the multi-exposure image using a calibration target in the focal plane, the positions of all exposures from to were measured to establish the microsphere’s trajectory. The distance and time between the and exposures ranged from 330 to 1175 μm and from 0.98 to 9.20 μs, respectively. To illustrate the nonlinearity of the microspheres’ trajectories, the positional deviation from a microsphere of constant velocity is presented in Figure 2a for microspheres at m/s for each of the three experimental conditions.
We used a central difference approximation of the first derivative to convert the microsphere’s position-time trajectory into velocity-position data, as shown in Figure 2b. We then performed a regression fit of the velocity-position data using Equation (1), achieving an average R2 value of 0.96 across all experiments. Equation (1) is an exponential decay function giving velocity as a function of position and assuming an exponential loss of kinetic energy. The fitting parameters of Equation (1) are and , the exponential decay parameter. Despite the sub-10 μs timescales of the measured portion of flight, the microspheres exhibited sufficient velocity drop to assess deceleration with confidence. A velocity drop of at least 1% of the initial velocity () over the measured range is necessary in order to accurately calculate a microsphere’s deceleration [17]. This condition was satisfied in all tests conducted in the present work. Microspheres launched in the three conditions ( = 3.7 μm, = 760 Torr; = 7.6 μm, = 760 Torr; = 3.7 μm, = 76 Torr) at 0.3 < < 2.2 exhibited ranges of 7.2–22.3%, 5.2–10.5%, and 1.6–6.0% and Knudsen numbers () of 0.018, 0.009 and 0.18, respectively. Each flight yielded a single, constant value, which is consistent with the methods of prior studies [15,17,18,19,20]. By derivation from the drag force equation (Equation (2)), is directly proportional to by Equation (3), in which , , and correspond to air density, particle cross-sectional area, and particle mass. The added mass and Basset history forces were neglected due to the high density ratio between the particle and the surrounding gas [21].
3. Results and Discussion
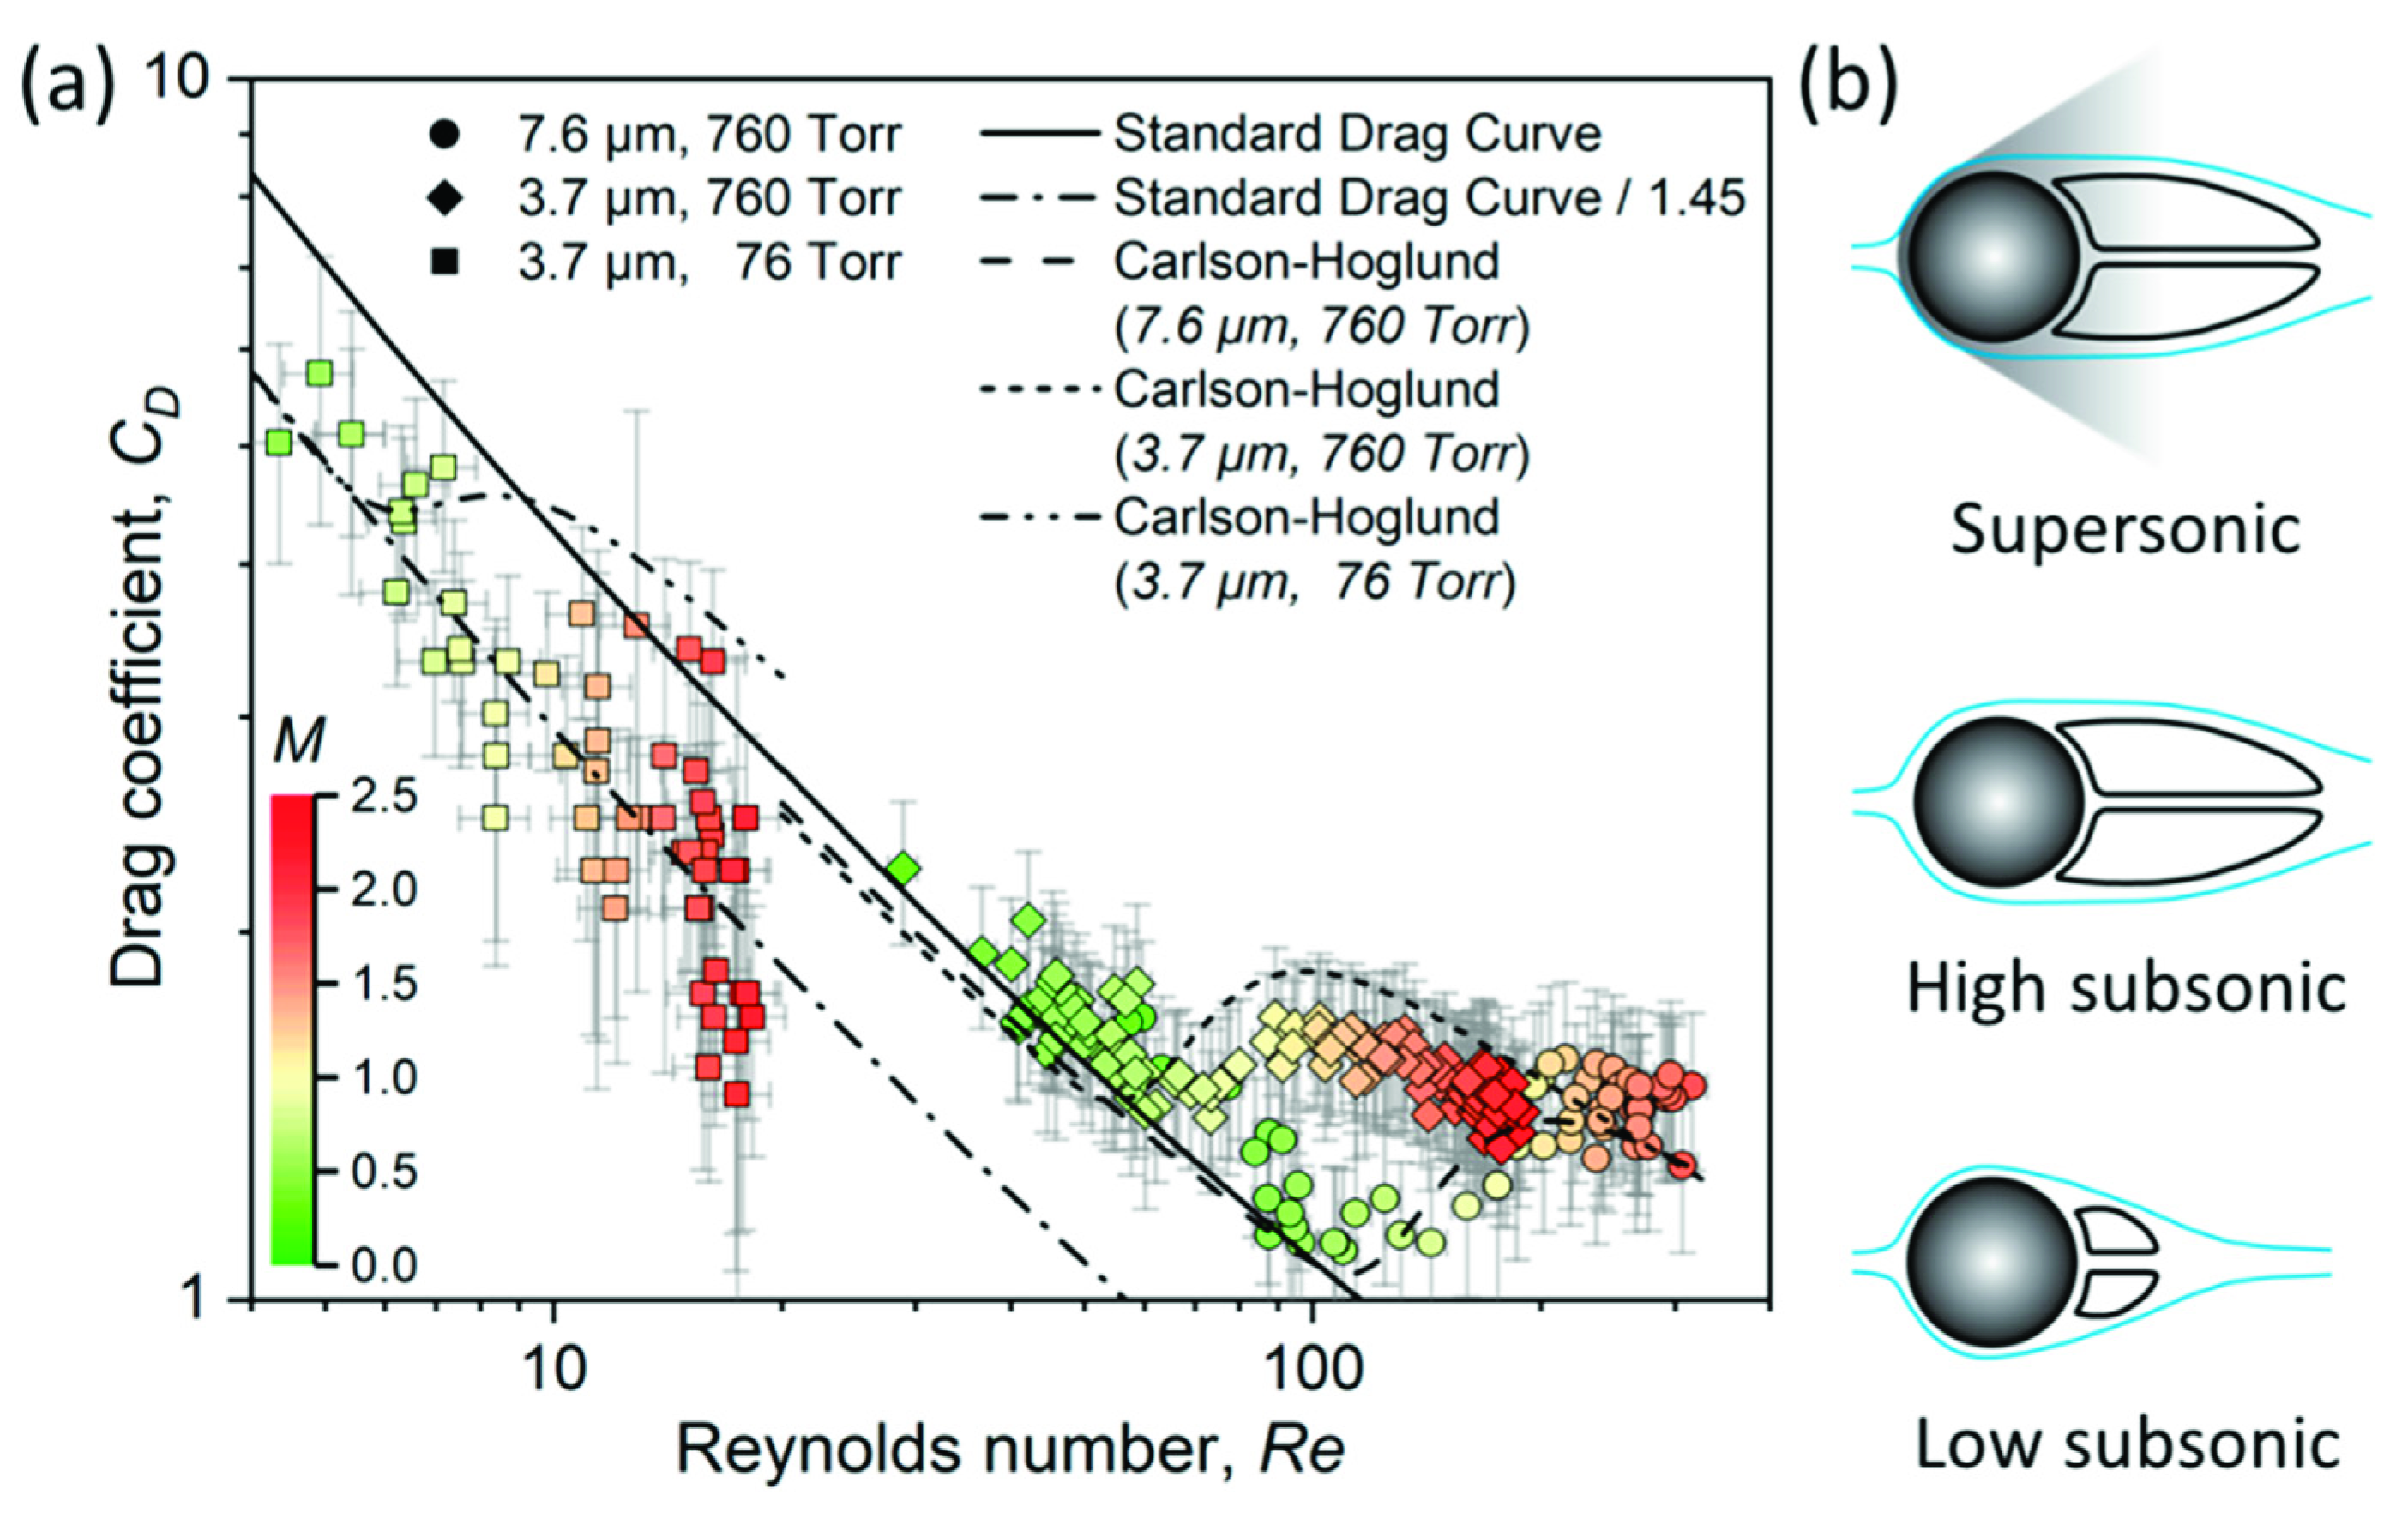
By varying microsphere velocity, microsphere diameter, and air pressure, we quantified at a range of flow conditions, reflected by and , spanning from 5 to 300 and 0.3 to 2.2, respectively. Figure 3 presents vs. colored according to for the three combinations of and . It is apparent from Figure 3 that in = 760 Torr, changes non-monotonically near = 1. In the supersonic regime, increases with decreasing . Figure 3b illustrates how pressure drag mainly contributes to drag force in this regime due to the large low-pressure region in the wake of the detached bow shock, which contains a toroidal recirculation region downstream of the sphere [22,23]. As the supersonic velocity decreases, the angle of the shock wave increases, causing the low-pressure region in its wake to expand [23,24]. Expansion of the low-pressure region incurs greater pressure drag and results in an increase in . As the microsphere decelerates through the transonic regime (estimated to be 0.8 < < 1.2), the additional drag created by the shock wave is lost, resulting in a reduction in . Due to differing microsphere diameters, this transition occurs at lower values for the = 3.7 μm, = 760 Torr case than the = 7.6 μm, = 760 Torr case. As the microsphere’s velocity continues to decrease below = 0.8, the flow separation point moves to the downstream side of the microsphere and the low-pressure zone in the microsphere’s wake reduces in volume [22,23,25,26]. While the reduction of the low-pressure region induces a decrease in pressure drag, the concurrent increase in friction drags results in a monotonic net increase in . In the = 76 Torr case, we do not observe a distinct change in during the transonic regime due to the weakened contribution of the bow shock in reduced pressure. The error bars [27], representing a 95% confidence interval of two standard deviations, are the largest for the = 76 Torr condition. By implementing the method of sequential perturbation to calculate error [27], it was found that the uncertainty in deceleration accounted for most of the error in . As noted previously, the values are smallest for the = 76 Torr condition, yielding the least accurate measurement of deceleration among the three experimental conditions. The vs. results in Figure 3 can be used to model microsphere velocity for micro-ballistic mechanical characterization and for projectile delivery of genes and drugs, ultimately determining impact velocity in both applications. In the former, the specimen impact velocity provides the microsphere’s kinetic energy upon impact. In the latter, the skin impact velocity [10] may be utilized in a theoretical penetration model [28] to estimate the tissue depth reached by the penetrating microsphere [9,10,29]. Future studies of projectile gene and drug delivery may achieve greater efficacy by including the present work’s quantification of in such penetration models.
The “standard drag curve” for spheres illustrates vs. in subsonic, incompressible flow [30]. Many empirical and semi-empirical models, which are functions of only, have been developed to approximate the standard drag curve [31,32,33,34,35,36,37,38,39,40,41,42]. The model given by Equations (4) and (5) is recommended by Clift, Grace, and Weber [30] as the most accurate approximation. This approximation is provided in Figure 3 and shows reasonable agreement with the subsonic = 760 Torr results from the present work for < 0.8. This and other approximations of the standard drag curve [31,32,33,34,35,36,37,38,39,40,41,42] overestimate subsonic for the = 76 Torr condition because they are purely functions of and do not account for , where describes the degree of rarefaction by the ratio of the molecular mean free path of the fluid to the diameter of the sphere [1,23,30,43,44,45,46]. The value for the = 76 Torr condition was 0.18, corresponding to the transitional-flow regime between slip-flow and free-molecule flow [30]. A slip correction factor [30] of = 1.45, given by Equation (6), may be implemented to the standard drag curve approximation in the case of = 76 Torr, where continuum flow is assumed despite the value indicating rarefied transitional-flow. Slip correction factors are negligible for the = 760 Torr cases, where flow conditions are nearer to continuum flow. By dividing the standard drag curve by 1.45, the approximation is shown in Figure 3 to agree with the empirical results for the = 76 Torr condition at < 0.8.
Standard drag curve approximation:
Slip correction factor:
Recognizing the difficulty of accurately measuring aerodynamic force empirically under high-, low- conditions, Nagata et al. [23] used direct numerical simulation to model vs. within the ranges 0.3 < < 2.0 and 50 < < 300. Of the models considered by the authors, Carlson and Hoglund’s (Equation (7)) showed the best agreement with the simulation results in both subsonic and supersonic conditions. Thus, in Figure 3, the Carlson-Hoglund model is provided for the three experimental conditions in the present work. The model was developed to be valid across the subsonic, transonic, and supersonic regimes, although no specific range of validity is given by the authors [47]. It does not require implementation of the slip correction factor, as it accounts for through the proportionality [47]. The model shows reasonable agreement with the < 0.8 results from the present work.
Carlson-Hoglund model:
To assess the model’s validity in the supersonic regime, the > 1.2 results of the present work are provided in Figure 4 alongside the combined empirical data of Kane [12], Wegener and Ashkenas [13], Aroesty [14], and Bailey and Hiatt [15] within the ranges 1.2 < < 4 and < 300. These data, derived from wind tunnel and ballistic experiments, accessed < 300 by testing macro-scale spheres (0.8 < < 25 mm) in low air pressure environments ( < 5 Torr) [12,13,14,15]. Using the flow regime metric [30,48], the data were found to fall within the transitional-flow regime. The transition between the transitional-flow and slip-flow regimes occurs at = 0.1. With data points colored according to , it is apparent that data approaching the slip-flow regime show better agreement with the Carlson-Hoglund model. Since the model is a function of and , it is provided in Figure 4 as a shaded range for 1.2 < < 4. The data in best agreement with the model are the = 7.6 μm, = 760 Torr data, which fall within the slip-flow regime (0.01 < < 0.1).
These findings join other studies [1,23,43,44,45,46] in illustrating that is not solely a function of , but also of metrics that reflect changing flow conditions, such as and . The increasing deviation of the > 1.2 empirical data from the Carlson-Hoglund model in Figure 4 is attributed to the suppression of flow characteristics in increasingly rarefied conditions. For instance, the drag force incurred by the bow shock may be diminished in increasingly rarefied supersonic flow. Thus, while Figure 3 attests to the Carlson-Hoglund model’s accuracy for modeling at < 0.8, Figure 4 indicates that the model is less accurate for > 1.2 rarefied flow conditions, including the transitional-flow regime.
Figure 4.
Drag coefficient, , vs. Reynolds number, , at 1.2 < < 4 for the three supersonic experimental conditions are displayed with the data of Kane [12], Wegener and Ashkenas [13], Aroesty [14], and Bailey and Hiatt [15]. The shaded region indicates the Carlson-Hoglund model’s range for 1.2 < < 4. Data points are colored according to the flow regime metric from 0.1 to 0.7, where increasing values correspond to increasingly rarefied conditions. Data points in black with < 0.1 belong to the slip-flow regime.

4. Conclusions
In this work, we used LIPIT to launch = 3.7 and 7.6 μm microspheres in = 76 and 760 Torr and quantified across 5 < < 300 and 0.3 < < 2.2. While prior methods of accessing the 1.2 < < 4 and < 300 experimental space accessed the transitional-flow regime, our study broadened the range of flow regimes by accessing the transitional-flow and slip-flow regimes. We illustrated the diminishing accuracy of the Carlson-Hoglund model with increasing rarefaction in 1.2 < < 4 and < 300 conditions. The diminishing accuracy was attributed to the suppression of drag-inducing flow characteristics in increasingly rarefied conditions. The results of this work will be useful to the fields of micro-ballistic mechanical characterization and projectile gene and drug delivery, as the Carlson-Hoglund model may be more accurate in modeling for > 1.2 and < 300 in the continuum and slip-flow regimes than in the transitional-flow and free-molecule flow regimes. The results also attest to the accuracy of the Carlson-Hoglund model, and the standard drag curve in modeling for < 0.8 and < 300. These models may be used to estimate the velocity and energy of a microsphere at any point during its flight, including the moment of impact, which is critical for applications such as micro-ballistic mechanical characterization and projectile gene and drug delivery.
Author Contributions
Conceptualization, N.F., D.S. and J.-H.L.; methodology, J.-H.L.; software, J.-H.L.; validation, N.F. and J.-H.L.; formal analysis, N.F. and J.-H.L.; investigation, N.F., D.S. and J.-H.L.; resources, J.-H.L.; data curation, N.F.; writing—original draft preparation, N.F.; writing—review and editing, D.S. and J.-H.L.; visualization, N.F. and J.-H.L.; supervision, J.-H.L.; project administration, J.-H.L.; funding acquisition, J.-H.L. All authors have read and agreed to the published version of the manuscript.
Funding
This research was funded by the Army Research Laboratory, Contract No. W911NF1920108 (Program Manager: M. Fermen-Coker).
Data Availability Statement
The data that support the findings of this study are available from the corresponding author upon reasonable request.
Conflicts of Interest
The authors declare no conflict of interest.
References
- Hoerner, S.F. Fluid-Dynamic Drag. 1965. Available online: https://cir.nii.ac.jp/crid/1572543026233935872 (accessed on 23 May 2022).
- Lee, J.-H.; Veysset, D.; Singer, J.P.; Retsch, M.; Saini, G.; Pezeril, T.; Nelson, K.A.; Thomas, E.L. High Strain Rate Deformation of Layered Nanocomposites. Nat. Commun. 2012, 3, 1164. [Google Scholar] [CrossRef] [Green Version]
- Lee, J.-H.; Loya, P.E.; Lou, J.; Thomas, E.L. Dynamic Mechanical Behavior of Multilayer Graphene via Supersonic Projectile Penetration. Science 2014, 346, 1092–1096. [Google Scholar] [CrossRef] [PubMed]
- Xie, W.; Lee, J.-H. Intrinsic Dynamics and Toughening Mechanism of Multilayer Graphene upon Microbullet Impact. ACS Appl. Nano Mater. 2020, 3, 9185–9191. [Google Scholar] [CrossRef]
- Sanford, J.C.; Klein, T.M.; Wolf, E.D.; Allen, N. Delivery of Substances into Cells and Tissues Using a Particle Bombardment Process. Part. Sci. Technol. 1987, 5, 27–37. [Google Scholar] [CrossRef]
- Iida, A.; Seki, M.; Kamada, M.; Yamada, Y.; Morikawa, H. Gene Delivery into Cultured Plant Cells by DNA-Coated Gold Particles Accelerated by a Pneumatic Particle Gun. Theor. Appl. Genet. 1990, 80, 813–816. [Google Scholar] [CrossRef] [PubMed]
- Mellott, A.J.; Forrest, M.L.; Detamore, M.S. Physical Non-Viral Gene Delivery Methods for Tissue Engineering. Ann. Biomed. Eng. 2013, 41, 446–468. [Google Scholar] [CrossRef] [Green Version]
- Klein, T.M.; Gradziel, T.; Fromm, M.E.; Sanford, J.C. Factors Influencing Gene Delivery into Zea Mays Cells by High-Velocity Microprojectiles. Nat. Biotechnol. 1988, 6, 559–563. [Google Scholar] [CrossRef]
- Menezes, V.; Takayama, K.; Ohki, T.; Gopalan, J. Laser-Ablation-Assisted Microparticle Acceleration for Drug Delivery. Appl. Phys. Lett. 2005, 87, 163504. [Google Scholar] [CrossRef]
- Kendall, M.; Mitchell, T.; Wrighton-Smith, P. Intradermal Ballistic Delivery of Micro-Particles into Excised Human Skin for Pharmaceutical Applications. J. Biomech. 2004, 37, 1733–1741. [Google Scholar] [CrossRef]
- Quinlan, N.J.; Kendall, M.A.F.; Bellhouse, B.J.; Ainsworth, R.W. Investigations of Gas and Particle Dynamics in First Generation Needle-Free Drug Delivery Devices. Shock Waves 2001, 10, 395–404. [Google Scholar] [CrossRef]
- Kane, E.D. Sphere Drag Data at Supersonic Speeds and Low Reynolds Numbers. J. Aeronaut. Sci. 1951, 18, 259–270. [Google Scholar] [CrossRef]
- Wegener, P.P.; Ashkenas, H. Wind Tunnel Measurements of Sphere Drag at Supersonic Speeds and Low Reynolds Numbers. J. Fluid Mech. 1961, 10, 550–560. [Google Scholar] [CrossRef]
- Aroesty, J. Sphere Drag in a Low Density Supersonic Flow; California University: Berkeley, CA, USA, 1962. [Google Scholar]
- Bailey, A.B.; Hiatt, J. Free-Flight Measurements of Sphere Drag at Subsonic, Transonic, Supersonic, and Hypersonic Speeds for Continuum, Transition, and Near-Free-Molecular Flow Conditions; Arnold Air Force Station: Tullahoma, TN, USA, 1971. [Google Scholar]
- Pritchard, P.J. Introduction to Fluid Dynamics; Wiley: Hoboken, NJ, USA, 2011. [Google Scholar]
- Bailey, A.B. Sphere Drag Measurements in an Aeroballistics Range at High Velocities and Low Reynolds Numbers; Arnold Air Force Station: Tullahoma, TN, USA, 1966. [Google Scholar]
- Lawrence, W.R. Free-Flight Range Measurements of Sphere Drag at Low Reynolds Numbers and Low Mach Numbers; Arnold Air Force Station: Tullahoma, TN, USA, 1967. [Google Scholar]
- Bailey, A.B.; Hiatt, J. Sphere Drag Coefficients for a Broad Range of Mach and Reynolds Numbers. AIAA J. 1972, 10, 1436–1440. [Google Scholar] [CrossRef]
- Veysset, D.; Sun, Y.; Kooi, S.E.; Lem, J.; Nelson, K.A. Laser-Driven High-Velocity Microparticle Launcher in Atmosphere and under Vacuum. Int. J. Impact Eng. 2020, 137, 103465. [Google Scholar] [CrossRef] [Green Version]
- Parmar, M.; Haselbacher, A.; Balachandar, S. Generalized Basset-Boussinesq-Oseen Equation for Unsteady Forces on a Sphere in a Compressible Flow. Phys. Rev. Lett. 2011, 106, 2–5. [Google Scholar] [CrossRef] [Green Version]
- Johnson, T.A.; Patel, V.C. Flow Past a Sphere up to a Reynolds Number of 300. J. Fluid Mech. 1999, 378, 19–70. [Google Scholar] [CrossRef]
- Nagata, T.; Nonomura, T.; Takahashi, S.; Mizuno, Y.; Fukuda, K. Investigation on Subsonic to Supersonic Flow around a Sphere at Low Reynolds Number of between 50 and 300 by Direct Numerical Simulation. Phys. Fluids 2016, 28, 056101. [Google Scholar] [CrossRef] [Green Version]
- Zaehringer, E.; Schwabe, M.; Zhdanov, S.; Mohr, D.P.; Knapek, C.A.; Huber, P.; Semenov, I.L.; Thomas, H.M. Interaction of a Supersonic Particle with a Three-Dimensional Complex Plasma. Phys. Plasmas 2018, 25, 033703. [Google Scholar] [CrossRef]
- Nakamura, I. Steady Wake behind a Sphere. Phys. Fluids 1976, 19, 5–8. [Google Scholar] [CrossRef]
- Wu, Z.; Jin, H.; Guo, L. Investigation on the Drag Coefficient of Supercritical Water Flow Past Sphere-Particle at Low Reynolds Numbers. Therm. Sci. 2017, 21, 217–223. [Google Scholar] [CrossRef]
- Moffat, R.J. Describing the Uncertainties in Experimental Results. Exp. Therm. Fluid Sci. 1988, 1, 3–17. [Google Scholar] [CrossRef] [Green Version]
- Dehn, J. A Unified Theory of Penetration. Int. J. Impact Eng. 1987, 5, 239–248. [Google Scholar] [CrossRef]
- Kendall, M.A.F. The Delivery of Particulate Vaccines and Drugs to Human Skin with a Practical, Hand-Held Shock Tube-Based System. Shock Waves 2002, 12, 23–30. [Google Scholar] [CrossRef]
- Clift, R.; Grace, J.R.; Weber, M.E. Bubbles, Drops, and Particles; Academic Press: New York, NY, USA, 1978. [Google Scholar]
- Schiller, L.; Naumann, A. Über Die Grundlegenden Berechnungen Bei Der Schwerkraftaufbereitung. Z. Des Ver. Dtsch. Ing. 1933, 77, 318–320. [Google Scholar]
- Morsi, S.A.; Alexander, A.J. An Investigation of Particle Trajectories in Two-Phase Flow Systems. J. Fluid Mech. 1972, 55, 193–208. [Google Scholar] [CrossRef]
- Lapple, C.E. Particle Dynamics; E.I. Dupont de Nemours and Company: Wilmington, DE, USA, 1951. [Google Scholar]
- Langmuir, I.; Blodgett, K.B. Technical Report No. 5418: A Mathematical Investigation of Water Droplet Trajectories; Army Air Forces Headquarters, Air Technical Service Command: Washington, DC, USA, 1948. [Google Scholar]
- Allen, H.S. The Motion of a Sphere in a Viscous Fluid. Lond. Edinb. Dublin Philos. Mag. J. Sci. 1900, 50, 519–534. [Google Scholar] [CrossRef] [Green Version]
- Gilbert, M.; Davis, L.; Altman, D. Velocity Lag of Particles in Linearly Accelerated Combustion Gases. Jet Propuls. 1955, 25, 26–30. [Google Scholar] [CrossRef]
- Kürten, H.; Raasch, J.; Rumpf, H. Beschleunigung Eines Kugelförmigen Feststoffteilchens Im Strömungsfeld Konstanter Geschwindigkeit. Chem. Ing. Tech. 1966, 38, 941–948. [Google Scholar] [CrossRef]
- Abraham, F.F. Functional Dependence of Drag Coefficient of a Sphere on Reynolds Number. Phys. Fluids 1970, 13, 2194–2195. [Google Scholar] [CrossRef]
- Ihme, F.; Schmidt-Traub, H.; Brauer, H. Theoretische Untersuchung Über Die Umströmung Und Den Stoffübergang an Kugeln. Chem. Ing. Tech. 1972, 44, 306–313. [Google Scholar] [CrossRef]
- Clift, R.; Gauvin, W. Proceedings of Chemeca 70. Chemeca 1970, 70, 14–27. [Google Scholar]
- Brauer, H.; Mewes, D. Strömungswiderstand Sowie Stationärer Und Instationärer Stoff-und Wärmeübergang an Kugeln. Chem. Ing. Tech. 1972, 44, 865–868. [Google Scholar] [CrossRef]
- Tanaka, Z.; Iinoya, K. New Approximate Equation of Drag Coefficient for Spherical Particles. J. Chem. Eng. Japan 1970, 3, 261–262. [Google Scholar] [CrossRef] [Green Version]
- Moshfegh, A.; Shams, M.; Ahmadi, G.; Ebrahimi, R. A New Expression for Spherical Aerosol Drag in Slip Flow Regime. J. Aerosol. Sci. 2010, 41, 384–400. [Google Scholar] [CrossRef]
- Barber, R.W.; Emerson, D.R. Numerical Simulation of Low Reynolds Number Slip Flow Past a Confined Microsphere; CLRC Daresbury Laboratory: Daresbury, UK, 2001. [Google Scholar]
- Barber, R.W.; Gu, X.J.; Emerson, D.R. Simulation of Low Knudsen Number Isothermal Flow Past a Confined Spherical Particle in a Micro-Pipe. In Proceedings of the Second International Conference on Microchannels and Minichannels, Rochester, NY, USA, 17–19 June 2004; pp. 1–8. [Google Scholar]
- Stefanov, S.K.; Barber, R.W.; Ota, M.; Emerson, D.R. Comparison between Navier-Stokes and DSMC Calculations for Low Reynolds Number Slip Flow Past a Confined Microsphere. In AIP Conference Proceedings; American Institute of Physics: Bari, Italy, 2005; Volume 762, pp. 701–706. [Google Scholar]
- Carlson, D.J.; Hoglund, R.F. Particle Drag and Heat Transfer in Rocket Nozzles. AIAA J. 1964, 2, 1980–1984. [Google Scholar] [CrossRef]
- Emmons, H.W. Fundamentals of Gas Dynamics: Volume 3, High Speed Aerodynamics and Jet Propulsion; Princeton University Press: Princeton, NJ, USA, 1958. [Google Scholar]
Figure 1.
(a) Schematic of LIPIT experiment (b) Ultrafast stroboscopic image of microsphere trajectory ( = 640 ns, = 7.6 μm).
Figure 1.
(a) Schematic of LIPIT experiment (b) Ultrafast stroboscopic image of microsphere trajectory ( = 640 ns, = 7.6 μm).

Figure 2.
(a) Positional deviation, , from a constant-motion reference of m/s, where and actual position, , is measured from a multi-exposure stroboscopic image, as in Figure 1b. (b) Velocity-position data corresponding to the data in (a) fit with an exponential decay fitting function (Equation (1)). Error bars correspond to a 95% confidence interval ( standard deviations).
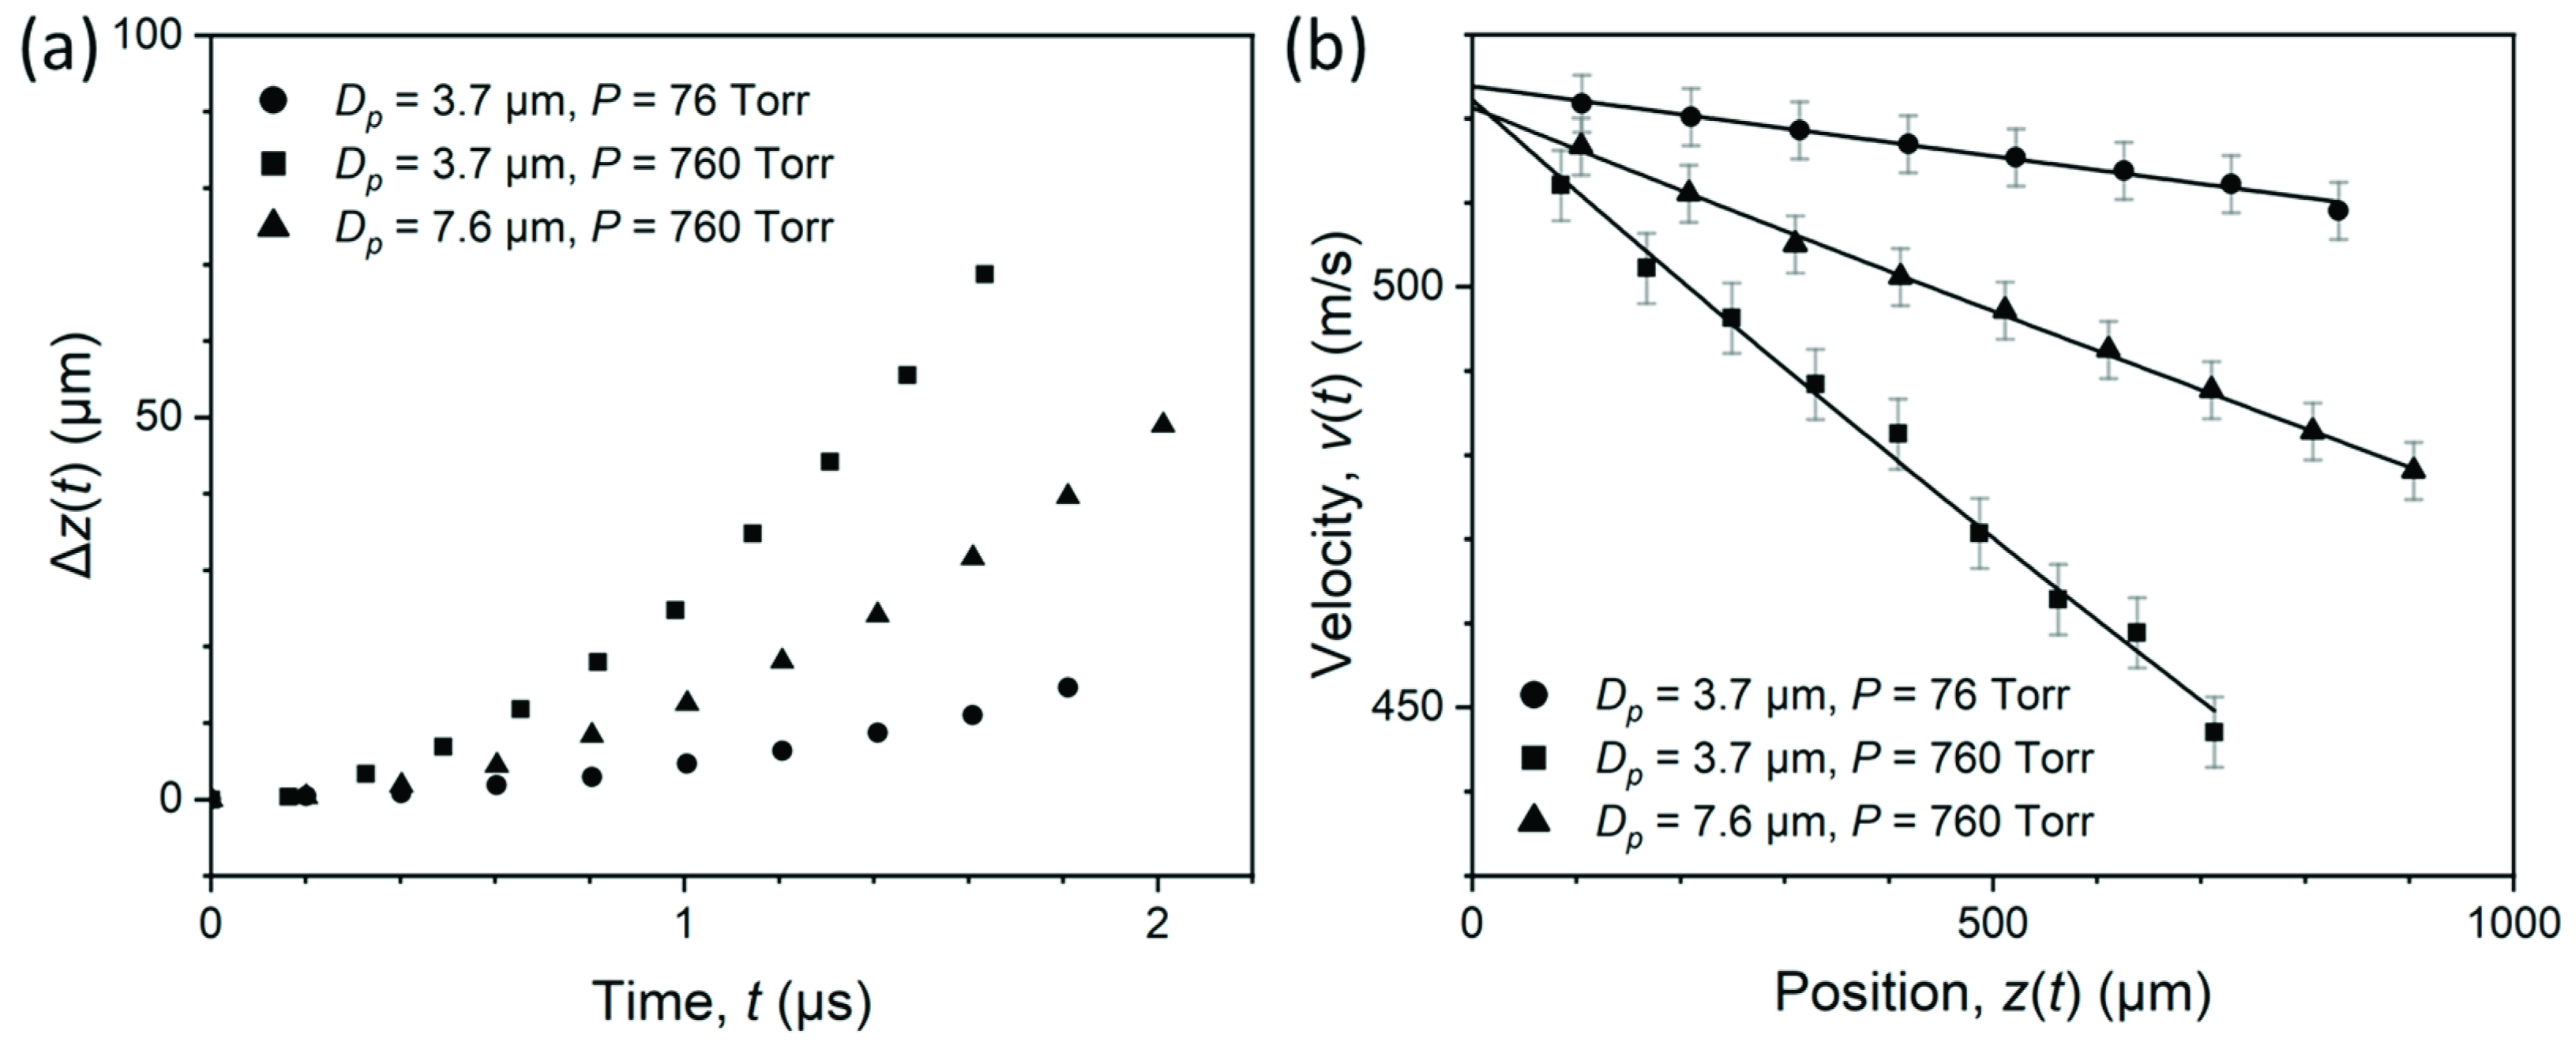
Figure 3.
(a) Drag coefficient, , vs. Reynolds number, , for the three experimental conditions. Data points are colored according to . Previously published models are provided for comparison. Error bars correspond to a 95% confidence interval ( standard deviations). (b) Approximate fluid flow characteristics at supersonic, high subsonic, and low subsonic microsphere velocities. Black lines represent the extents of the recirculation region, while blue lines represent streamlines. A detached bow shock is present in the supersonic condition. Steady flow features are depicted because Re values for nearly all microsphere flights studied in this work fall below the 270–300 range when the onset of unsteady vortex shedding occurs for spheres.
Publisher’s Note: MDPI stays neutral with regard to jurisdictional claims in published maps and institutional affiliations. |
© 2022 by the authors. Licensee MDPI, Basel, Switzerland. This article is an open access article distributed under the terms and conditions of the Creative Commons Attribution (CC BY) license (https://creativecommons.org/licenses/by/4.0/).
Share and Cite
MDPI and ACS Style
Figliola, N.; Schmidt, D.; Lee, J.-H. Pressure- and Size-Dependent Aerodynamic Drag Effects on Mach 0.3–2.2 Microspheres for High-Precision Micro-Ballistic Characterization. Appl. Sci. 2022, 12, 6622. https://doi.org/10.3390/app12136622
AMA Style
Figliola N, Schmidt D, Lee J-H. Pressure- and Size-Dependent Aerodynamic Drag Effects on Mach 0.3–2.2 Microspheres for High-Precision Micro-Ballistic Characterization. Applied Sciences. 2022; 12(13):6622. https://doi.org/10.3390/app12136622
Chicago/Turabian StyleFigliola, Nino, David Schmidt, and Jae-Hwang Lee. 2022. "Pressure- and Size-Dependent Aerodynamic Drag Effects on Mach 0.3–2.2 Microspheres for High-Precision Micro-Ballistic Characterization" Applied Sciences 12, no. 13: 6622. https://doi.org/10.3390/app12136622
Note that from the first issue of 2016, this journal uses article numbers instead of page numbers. See further details here.