
Anisotropic Heat Transfer in Plane of Carbon Fabrics Reinforced Geopolymer Composite


Department of functional Materials, FZU-Institute of Physics of Czech Academy of Science, Prague 8, Na Slovance 1999/2, 18221 Prague, Czech Republic
Appl. Sci. 2022, 12(13), 6624; https://doi.org/10.3390/app12136624
Submission received: 6 June 2022
/
Revised: 22 June 2022
/
Accepted: 27 June 2022
/
Published: 30 June 2022
(This article belongs to the Section Materials Science and Engineering)
Abstract
:Heat transfer within carbon fiber in the geopolymer composite is predicted from parallel in phase to a perpendicular direction within the fabrics. Temperature distribution is higher along the fiber axis with a perpendicular position. The use of curvilinear coordinates along the fiber axis are useful in estimating thermal conductivity within the geopolymer composite theoretically. Experimental findings are also carried out in carbon fiber reinforced geopolymer composite. It has been observed that thermal conductivity has remained constant throughout the composite as a function of temperature. A correlation has been established that shows the heat transfer in the composite falls within the standard range of the specification of insulating materials. This study offers insights and a possible strategy for the development of an anisotropic low-thermal-conductivity geopolymer composite for potential applications in insulating material systems.
1. Introduction
Geopolymers are considered an insulating material due to their low thermal conductivity behavior [1], with additional fire proofing properties. Geopolymers emerge as the alternative eco-friendly material because of durability, flexural strength, and high temperature withstanding behavior [2,3]. However, geopolymer is more brittle in nature, which hinders its application in various areas [4,5]. This could result in failures in civil structure [6] in areas of the construction and building sectors. Geopolymer is chosen as an insulating material with low conductivity properties [7]. These properties of geopolymer allows for applications in the construction and building industries. The low thermal conductivity of an inorganic matrix phase of geopolymer could be enhanced or maintained by incorporating carbon fiber network materials as the supporting matrix [8]. However, brittleness of the geopolymer matrix could improve by incorporating carbon fibers in the geopolymer matrix. Carbon fabrics have low density, high stiffness, and high temperature tolerance, which could lead to applications in areas of the aerospace and civil engineering industries [9,10]. Carbon fabric is composed of carbon crystals. A linear arrangement of these crystals forms a chain that results in a flat ribbon. A large number of these ribbons are braided together in different patterns to form carbon fabrics. Fibers are aligned in anisotropic material properties in carbon fabric. Continuous carbon fiber reinforced geopolymer matrix composites exhibit better mechanical properties [11]. Carbon fiber reinforced geopolymer composites have been widely used in various areas such as aerospace, construction, and building materials in structural applications [12,13]. On the benefits side, materials with low conductivity could be used as insulation materials in energy-intensive industries with easy integration in the main assembled structure. In this scenario, geopolymer materials are attractive in various applications in fire protection coating materials [14,15]. The geopolymer is prepared by mixing a silicate-based mineral, such as metakaolin, as a binder at room temperature (RT) [16]. The mixture undergoes curing at a temperature of 80 °C inside the vacuum furnace. Geopolymers have low thermal conductivity in the range of 0.5 < K < 1.0 W/m K [17]. Carbon fibers are known to have excellent thermal conductivities. However, if the interface between the matrix and fibers has poor thermal properties, it affects the overall thermal conductivity of the composite significantly. The goal of this article is to quantify the thermal conductivity of the matrix-fiber interface in a carbon fiber geopolymer composite. A geopolymer matrix can reduce the thermal conductivity by about a factor of ten. Therefore, to improve the conductivity of the composite, the improvement in the interface heat transfer coefficient should be accompanied by an improvement in the conductivity of the matrix as well as the distribution of fibers within the composite.
To understand the heat conductivity of a carbon fiber in geopolymer composite, an approach has been discussed in this article with experiments and numerical simulations. The heat distribution within carbon fiber is predicted using an infinite domain wall approach, with a geopolymer as the matrix. The approach has been established on comparing the thermal conductivity of a carbon fiber reinforced geopolymer composite at various temperatures. The thermal conductivity value of the carbon fiber reinforced composite will allow for the categorization of the material in a low thermal conductivity material, which is a reduction in the category of insulating materials for structural applications.
1.1. Theoretical Prediction of Thermal Conductivity of a Composite
In general, the heat conduction is defined by the transfer of phonons within the matrix and fiber in the composite. In heat transfer, thermal diffusivity measures the rate of heat transfer in a material from the hot end to the cold end. So thermal diffusivity could be defined as the function of a phonon free path in Equation (1) as below [18],
where α is thermal diffusivity, vs is velocity, and l is the mean free path of the phonons.
In the case of the material (solid compact), thermal conduction is considered by ignoring radiative heat transfer. Based on the heat transfer methods, radiation of heat from the material is also considered. Heat transfer by radiation is defined as below [19],
where Φ is the radiation heat, A is the area of the composite material, σ is the Stefan-Boltzmann constant, and T is the temperature.
Thermal conductivity of a material results from the combination of major conductive heat (transfer of phonons) and a minor contribution of radiative heat transfer [20],
where λ0 is the effective thermal conductivity of the composites, λc is the thermal conductivity contributed by conductive heat transfer, and λr is the thermal conductivity contributed by radiative heat transfer.
The thermal conductivity of the composite is varied from a different direction. The difference in thermal conductivity is observed from the plane direction towards the thickness of the composite. When the temperature increases, it provides a drift in phonon vibration energy that results in an increase in phonon collision frequency [21]. This will result in reducing the mean free path of phonon that will contribute towards a decrease in thermal conductivity. On the other hand, the radiative heat transfer increases with an increase in temperature. The heat transfer channels, acting as a barrier from dropping thermal conductivity at higher temperature. The thermal diffusivity is defined by the function of temperature as below [22],
where α is the thermal diffusivity of the composites, A is a constant determined by the intrinsic lattice characteristics (phonon–phonon scattering), B is determined by the phonon-defect scattering and phonon-grain boundary scattering, b is a constant (~2), and is the characteristic temperature [23].
1.2. Physical and Thermal Properties of Carbon Fiber Reinforced Geopolymer Composite
A geopolymer matrix is prepared by mixing a metakaolin binder of 6.88%, alumino-silicate powder of 49%, and alkali activator with the NaOH/KOH of 44.12% in free dissolution. The chemical composition of the geopolymer consists of Al (2.04), Si (31.80), P (0.08), K (15.5), Zr (1.76), Na (0.63), Ca (0.24), and O (48.32). The geopolymer slurry was filled on the surface of carbon fabrics that later stack together in the transverse direction. The stacked piles of fabrics with filled geopolymer matrix were compressed by a roller until the desired thickness of about 3 mm was achieved. The assembled fabric reinforced geopolymer matrix was placed in a vacuum bag and cured at 0.003 MPa at RT for 2 h. The composite underwent curing at 70 °C for a period of 2 h, with a follow up 20 h at RT. The composite was fabricated in with the fabrics arranged in the plane direction. Thermal conductivity of the composite was measured in the plane direction. The out-of-plane thermal diffusivity of the rectangular composite sample 3 × 15 × 220 mm3 was determined by using a laser flash technique (NETZSCH model LFA 447). The specific heat of the composite was determined by using standard Pyroceram 9606. The out-of-plane thermal conductivity of the composite sample was measured by using thermal diffusivity, specific heat capacity, and density of the sample
is the thermal conductivity (W m−1 K−1) of the composite, ρ is the density of the composite (g cm−3), Cp is the specific heat capacity of the samples (J g−1 K−1), and α is the thermal diffusivity (m2 s−1).
Thermal conductivity of the composites was determined at a temperature range from 25 °C to 250 °C. The graphite coating was applied on the samples to increase the absorption of flashlight on the front surface and the emissivity on the back surface. The standard deviation of the thermal conductivity of the composite was achieved by measuring five samples at each temperature.
The density of the carbon fiber reinforced geopolymer composites was measured as prepared and for samples after exposure to 1000 °C. Samples having dimensions of 3 × 15 × 220 mm were used for density measurements. The volume fraction of fiber, geopolymer matrix, and porosity is calculated from composites by the following equations:
where Vf, Vm, Vv are the volume fractions of fiber, matrix, and void in the geopolymer composites; n is the number of fabric layers in the composite samples; t, L, b are the thickness, length, and width of the composite [m], respectively; ρw is the density of fiber layer [g/m2]; ρf is the density of a single fiber [g/m3]; and ρm is the density of matrix [g/m3].
The surface morphology of the composite was investigated by a scanning electron microscope (SEM, ZEISS) with field emission source using 30 kV acceleration voltages.
2. Model Layout and Properties for Simulation
2.1. The Model for the Fiber Reinforced Geopolymer Composite
Figure 1 displays the model for the fiber reinforced geopolymer composite. The carbon infinite element domain is presented in the boundary with the geopolymer composite. The mesh size of the outer domain and inner arrangement is shown with a maximum element size of 0.1 cm and with a minimum element size of 0.018 cm. The maximum element growth rate was 1.5 with a curvature factor of 0.6.
The diffusion of the outer wall is zero in stationary condition as below
The heat transfer within the solid of the composite is defined as below
Here, ρ is the density of the composite, Cp is the heat capacity at constant pressure, K is the thermal conductivity of composite, with q as the heat source.
Figure 2 shows the cross section of the carbon fiber reinforced geopolymer composite. The infinite domains that present within the boundary wall of the geometry truncate to model a boundary stage of fibers. Based on the heat transfer module, infinite element domains could suppress boundary effects.
The material properties are summarized in Table 1 for the carbon fiber reinforced geopolymer composite.
Anisotropic thermal conductivity is represented as second order tensor. The tensor is defined as
In general, thermal conductivity of a composite is highest along the plane direction compared to thickness. The matrix represented for K is provided x-component depending upon the shape of the fibers. The curvilinear coordinate provides such vector system for the interface. Three predefined methods could be able to function in the curvilinear coordinate system. In this system, the diffusion method has been used in a scalar potential. The streamline flow of heat represents along the direction of the carbon fiber. The base vector system for a single fiber is shown in Figure 3. The parameters used for the fiber axis are chosen with the specification as below a number of four loops considered along the fiber axis that determines a number of seven fibers per axis. The length of the loop is considered as 0.2 mm with an amplitude of 0.05. The curvilinear coordinates allow the inlet and outlet boundaries that allow the heat transfer in the direction of the composite (Figure 4). All other boundaries are thermally insulated walls. A Gaussian field of heat distribution in the center of the geometry is applied with a convective cooling boundary condition on both sides.
2.2. Carbon Fiber Reinforced Geopolymer Composite
The composites were prepared by manually stacking 10 layers of carbon fiber impregnated with the geopolymer matrix. The fabrication steps are shown in a schematic diagram in Figure 5.
Fabrics considered in the plain biaxial direction with the incorporation of the matrix geopolymer undergo pressure to form a compact structure with a follow-up vaccum bagging and curing process to form the composite. The fabrication and subequent exposure to heat allows more compaction in thickness and mass retention in the composite. Figure 6a,b shows thickness expansion and mass loss after exposure to treating temperature.
Figure 6a shows the thickness expansion of the geopolymer composite from RT to annealed temperature. The carbon fiber reinforced geopolymer composite showed less expansion. Figure 6b represents mass retention of the composite as a function of annealed temperature. Weight loss is observed initially at annealed temperature in the carbon geopolymer composite, which remains stable after 600 °C.
2.3. Surface Feature Evolution of Matrix Geopolymer and Geopolymer Composite
Figure 7a shows the microstructure of the geopolymer matrix and subsequent changes after exposed to the annealed temperature. At higher temperatures from 600 to 1000 °C, surface deformation and voids of the matrix are observed (Figure 7c–e).
Microstructure of the carbon fiber reinforced geopolymer composites at RT shows the cross section of carbon fibers (Figure 8a). Composite annealed at 600 °C (Figure 8d) shows voids and deadhesion of carbon fiber in the geopolymer matrix, with cracks on the surface morphology. With an increase in the annealed temperature of 800 °C, more disintegration of fibers was observed (Figure 8c). However, at 1000 °C, the oxidizing surface was observed that confirms the outer white layer. Figure 8a–f displays the surface image of the composite after exposure to an annealed temperature from 200 to 1000 °C. Carbon reinforced geopolymer composite at RT shows the good packing of the matrix within fibers. After exposure to the annealed temperature of 200 °C, the composite shows no remarkable change in surface morphology of the composite. After exposure to the annealed temperature 400 °C, the composite shows necking of the geopolymer matrix along the fabric layers in the surface morphology (Figure 8c). At 600 °C, melting and shrinkage of the geopolymer matrix results in the creation of porosity and voids between fabric and geopolymer matrix within the composite. Adhesion between fiber and matrix weakens during annealing, which results in shrinkage of the geopolymer. The fabric devolatilization process starts at 800 °C, which may result in the creation of voids. Samples exposed at 1000 °C show a more homogeneous and oxidized layer on the outer surface. The partial carbon fiber oxidization at an annealed temperature of 400 °C in an air medium inside the furnace forms a white layer. The mass retention result shows 14 wt% loss in mass (Figure 6b) in the composite that may arise from the mass loss of the geopolymer matrix and carbon fiber.
3. Results and Discussion
3.1. Simulation Findings
Figure 9a–c displays the temperature distribution on the surface of the geopolymer composite. It shows a temperature distribution from the higher value of inner core to the lower value of periphery. The temperature at the center shows a maximum temperature and decreases towards the periphery (Figure 9a,b). However, there were iso thermal heat spreads preferentially along the fiber axis, showing the uniform distribution of temperature range (Figure 9c).
3.2. Experimental Measurement of Thermal Conductivity of the Composite
3.2.1. Density and Thermal Measurement for the Carbon Fiber Reinforced Geopolymer Composite
Table 2 shows the volume fraction of matrix, carbon fabric, and void in the geopolymer and geopolymer composite. The pore sizes were 2.0 ± 0.2 µm. The porosity developed from dehydration and the curing process in the geopolymer matrix. The density of the geopolymer was 2.0 ± 0.05 g/cm3. The carbon fiber reinforced geopolymer composite showed the volume fraction of voids 21%. Figure 10 represents the density of geopolymer and geopolymer composites at RT and after annealed at 1000 °C.
The geopolymer exposed to the annealed temperature 1000 °C shows a lower density compared to the geopolymer matrix at RT. At 1000 °C, decomposition and material loss of the geopolymer may result in a decrease in volume that results in a decrease in density value. Figure 10b represents the endo–exothermic reaction peaks of the geopolymer matrix and carbon fiber reinforced geopolymer composite as a function of temperature. The matrix geopolymer shows peaks of exothermic reaction at the temperatures of 50–100 °C and 250–300 °C. The first peak may have arisen due to the dehydration and degassing chemicals used as a binder. The second exothermic peak shows deformation or degradation of the geopolymer. This observation implicates that fabrics are stable at a high temperature (500 °C), whereas the matrix geopolymer is very unstable and swells with cracks.
3.2.2. Thermal Conductivity of the Carbon Fiber Reinforced Geopolymer Composite
Insulation behavior of the geopolymer composites were assessed by measuring the thermal conductivity at a higher temperature. Figure 11a–c displays specific heat, thermal diffusivity, and thermal conductivity of the carbon fabric reinforced geopolymer composites as the function of annealed temperatures. A standard deviation of 1% was achieved from measuring five average samples. The increase in specific heat capacity in the carbon fiber reinforced geopolymer was observed as a function of annealed temperature (Figure 11a). There was a linear increase of specific heat from 950 to 1650 J/(kg K), which was observed over the annealed temperature. To the contrary, thermal diffusivity decreased over the range of an annealed temperature in the carbon fiber reinforced geopolymer composite. Figure 11b shows the thermal diffusivity decrease with an annealed temperature and remained constant at 250 °C for the carbon fiber reinforced geopolymer composite. Thermal conductivity of the carbon fiber geopolymer composite slightly changed from RT to an annealed temperature. However, the value of thermal conductivity of carbon fiber reinforced geopolymer composite lies in the range of 0.6–0.65 W/m K. The conductivity values fell within the range of insulating materials, such as brick (1.31 W/m K), soil/clay (1.1 W/m K), and concrete (0.4–0.7 W/m K) [11].
There is not a significant difference in thermal diffusivity values in warp and weft directions because the fiber counts in the warp and weft directions are equivalent without any porosity in either direction. The effective thermal conduction of the carbon fiber reinforced geopolymer composite is based on the solid heat transfer and the radiative contribution. Results show that heat conduction was the principal contributor to the overall heat transfer, but its influence decreased when the temperature increased; this is due to the sum of different scattering processes. However, these scattering processes are predominantly dominant at different temperature ranges. Using a calorimetric method, we found that values on thermal diffusivity and thermal conductivity measured in-plane to the fiber axis decreased with respect to those obtained out-plane of laminate [24,25].
The simulation findings showed the value of heat distribution in the surface of the carbon fiber geopolymer composite (Figure 9b). The temperature distribution reached until 446 K at the center of the surface. However, the temperature distribution of the center plane and fiber structure remained at room temperature (Figure 9c). It showed the insulating behavior of the composite that matched well with the experimental findings from Figure 11c. The parameter that controls the composite thermal conductivity is the direction of fiber arrangement in the layout, where each fiber location varies along the direction of the fiber axis with adjoining location. The effect of the deviation of the fiber location from the ideal geometry has a very strong effect on the thermal conductivity of the composite.
4. Conclusions
Anisotropic heat transfer performance along the carbon fiber within a geopolymer matrix was examined by combining the approach of a simulation analysis and experimental findings. It was observed that heat transfer in the composite material slightly increased, which also corresponded to the minimum increase in the thermal conductivity value. These findings are supported by thickness expansion and mass retention in the sample as a function of temperature, with support from the microstructural evolution. The value of thermal conductivity and heat transfer was only limited in the fiber direction at the center of the composite, which falls in the category of insulting material. If the exact distribution of fiber orientation is known, this study can be used to predict the composite sample conductivity when the interface heat transfer coefficient is known.
Funding
This research received no external funding.
Institutional Review Board Statement
Not applicable.
Informed Consent Statement
Not applicable.
Data Availability Statement
Not applicable.
Acknowledgments
This work is supported from project Solid-21 for the support within the Institute of Physics, Prague, Czech Republic (SOLID21: CZ.02.1.01/0.0/0.0/16_019/0000760, SOLID21-Fyzika pevných látek pro 21. Století, Fyzikální ústav AV ČR, v. v. i. (2018–2023).
Conflicts of Interest
The authors declare no conflict of interest.
References
- Duxson, P.; Fernández-Jiménez, A.; Provis, J.L.; Lukey, G.C.; Palomo, A.; Van Deventer, J.S.J. Geopolymer technology: The current state of the art. J. Mater. Sci. 2007, 42, 2917. [Google Scholar] [CrossRef]
- El-Naggar, K.A.M.; Amin, S.K.; El-Sherbiny, S.A.; Abadir, M.F. Preparation of geopolymer insulating bricks from waste raw materials. Constr. Build. Mater. 2019, 222, 699. [Google Scholar] [CrossRef]
- Samal, S.; Phan Thanh, N.; Petríková, I.; Marvalová, B. Improved Mechanical Properties of Various Fabric-Reinforced Geocomposite at Elevated Temperature. JOM 2015, 67, 1478. [Google Scholar] [CrossRef]
- Le, V.S.; Nguyen, V.V.; Sharko, A.; Ercoli, R.; Nguyen, T.X.; Tran, D.H.; Łoś, P.; Buczkowska, K.E.; Mitura, S.; Špirek, T.; et al. Fire Resistance of Geopolymer Foams Layered on Polystyrene Boards. Polymers 2022, 14, 1945. [Google Scholar] [CrossRef]
- Samal, S.; Thanh, N.P.; Marvalova, B.; Petrikova, I. Thermal Characterization of Metakaolin-Based Geopolymer. JOM 2017, 69, 2480. [Google Scholar] [CrossRef]
- Samal, S.; Thanh, N.P.; Petríková, I.; Marvalová, B.; Vallons, K.A.M.; Lomo, S.V. Correlation of microstructure and mechanical properties of various fabric reinforced geopolymer composites after exposure to elevated temperature. Ceram. Int. 2015, 41, 12115. [Google Scholar] [CrossRef]
- Ercoli, R.; Laskowska, D.; Nguyen, V.V.; Le, V.S.; Louda, P.; Łoś, P.; Ciemnicka, J.; Prałat, K.; Renzulli, A.; Paris, E.; et al. Mechanical and Thermal Properties of Geopolymer Foams (GFs) Doped with By-Products of the Secondary Aluminum Industry. Polymers 2022, 14, 703. [Google Scholar] [CrossRef]
- Korniejenko, K.; Kejzlar, P.; Louda, P. The Influence of the Material Structure on the Mechanical Properties of Geopolymer Composites Reinforced with Short Fibers Obtained with Additive Technologies. Int. J. Mol. Sci. 2022, 23. [Google Scholar] [CrossRef]
- Cao, S.H.; Wu, Z.S.; Wang, X. Tensile properties of CFRP and hybrid FRP composites at elevated temperatures. J. Compos. Mater. 2009, 43, 315. [Google Scholar]
- Kalinowska-Wichrowska, K.; Pawluczuk, E.; Bołtryk, M.; Nietupski, A. Geopolymer Concrete with Lightweight Artificial Aggregates. Materials 2022, 15, 3012. [Google Scholar] [CrossRef]
- Rashedi, A.; Marzouki, R.; Raza, A.; Rawi, N.F.M.; Naveen, J. Mechanical, Fracture, and Microstructural Assessment of Carbon-Fiber-Reinforced Geopolymer Composites Containing Na2O. Polymers 2021, 13, 3852. [Google Scholar] [CrossRef]
- Łach, M.; Kluska, B.; Janus, D.; Kabat, D.; Pławecka, K.; Korniejenko, K.; Guigou, M.D.; Choińska, M. Effect of Fiber Reinforcement on the Compression and Flexural Strength of Fiber-Reinforced Geopolymers. Appl. Sci. 2021, 11, 10443. [Google Scholar] [CrossRef]
- Samal, S.; Marvalová, B.; Petríková, I.; Vallons, K.A.M.; Lomov, S.V.; Rahier, H. Impact and post impact behavior of fabric reinforced geopolymer composite. Constr. Build. Mater. 2016, 127, 111. [Google Scholar] [CrossRef]
- Luhar, S.; Nicolaides, D.; Luhar, I. Fire Resistance Behaviour of Geopolymer Concrete: An Overview. Buildings 2021, 11, 82. [Google Scholar] [CrossRef]
- Samal, S. Effect of high temperature on the microstructural evolution of fiber reinforced geopolymer composite. Heliyon 2019, 5, e01779. [Google Scholar] [CrossRef] [Green Version]
- Samal, S. Interface failure and delamination resistance of fiber-reinforced geopolymer composite by simulation and experimental method. Cem. Concr. Compos. 2022, 128, 104420. [Google Scholar] [CrossRef]
- R-Value for the Building Insulation Materials. Available online: http://www.archtoolbox.com/materials-systems/thermal-moisture-protection/rvalues.html (accessed on 30 May 2022).
- Chung, D.D.L. Materials for thermal conduction. Appl. Therm. Eng. 2001, 21, 1593. [Google Scholar] [CrossRef]
- Baillis, D.; Sacadura, J.F. Thermal radiation properties of dispersed media: Theoretical prediction and experimental characterization. J. Quant. Spectrosc. Radiat. Transf. 2000, 67, 327. [Google Scholar] [CrossRef]
- Cao, L.; Wang, J.; Liu, Y.; Zhang, Y.; Liu, B.; Cao, Y.; Zhang, Q. Effect of heat transfer channels on thermal conductivity of silicon carbide composites reinforced with pitch-based carbon fibers. J. Europ. Ceramc. Soc. 2022, 42, 420. [Google Scholar] [CrossRef]
- Chen, J.; Wang, Y.L.; Cheng, L.; Zhang, L. Thermal diffusivity of three-dimensional needled C/SiC–TaC composites. Ceram. Int. 2011, 37, 3095. [Google Scholar] [CrossRef]
- Bruls, R.J.; Hintzen, H.T.; Metselaar, R. A new estimation method for the intrinsic thermal conductivity of nonmetallic compounds. J. Eur. Ceram. Soc. 2005, 25, 767. [Google Scholar] [CrossRef]
- Berman, R. The thermal conductivity of dielectric solids at low temperatures. Adv. Phys. 1953, 2, 103. [Google Scholar] [CrossRef]
- Feng, Z.; Fan, Z.; Kong, Q.; Xiong, X.; Huang, B. Effect of high temperature treatment on the structure and thermal conductivity of 2D carbon/carbon composites with a high thermal conductivity. New Carbon Mater. 2014, 29, 357. [Google Scholar] [CrossRef]
- Macias, J.D.; Bante-Guerra, J.; Cervantes-Alvarez, F.; Rodrìguez-Gattorno, G.; Arés-Muzio, O.; Romero-Paredes, H.; Arancibia-Bulnes, C.A.; Ramos-Sánchez, V.; Villafán-Vidales, H.I.; Ordonez-Miranda, J.; et al. Thermal Characterization of Carbon Fiber-Reinforced Carbon Composites. Appl. Compos. Mater. 2019, 26, 321–337. [Google Scholar] [CrossRef]
Figure 1.
Model geometry of carbon fibers reinforced in geopolymer matrix with infinite element domain on the left side (highlight fiber, matrix hidden) and right side (matrix highlight, fiber hidden).
Figure 1.
Model geometry of carbon fibers reinforced in geopolymer matrix with infinite element domain on the left side (highlight fiber, matrix hidden) and right side (matrix highlight, fiber hidden).

Figure 2.
Outer domain wall of the fiber reinforced in geopolymer composite (a) and (b) mesh size of the composite.
Figure 2.
Outer domain wall of the fiber reinforced in geopolymer composite (a) and (b) mesh size of the composite.

Figure 3.
A three-dimensional curvilinear coordinate system for a single fiber.
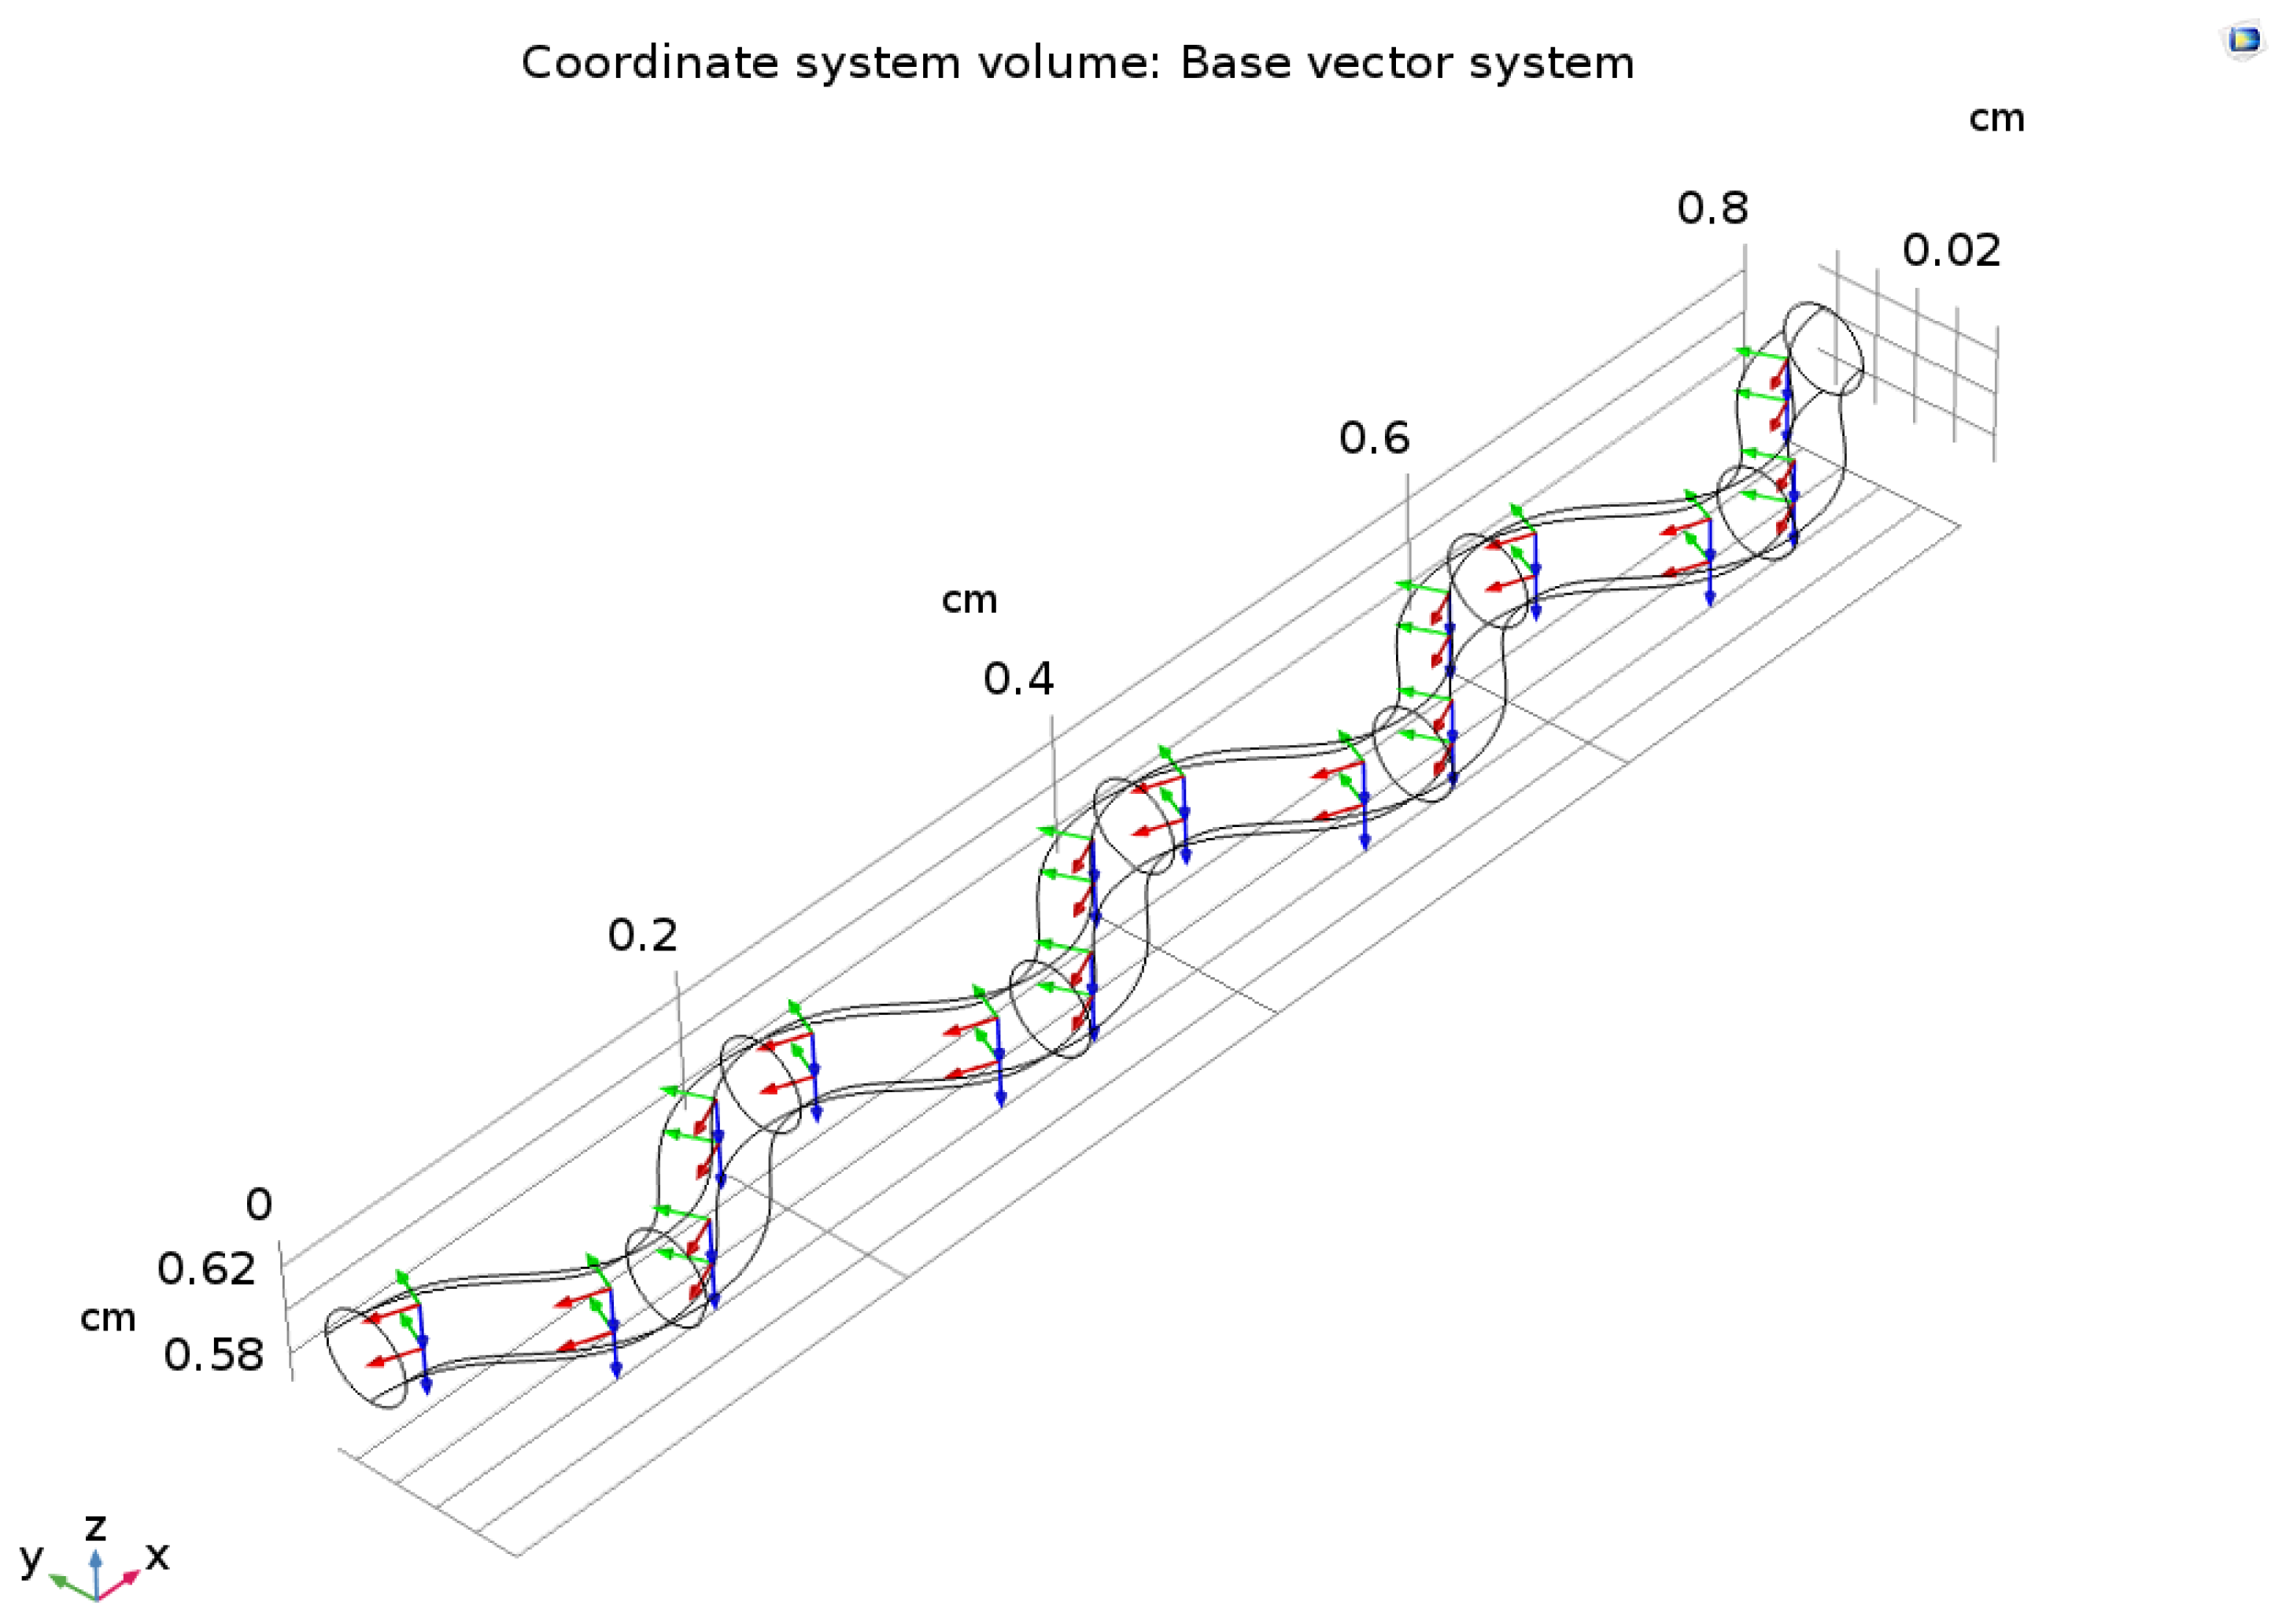
Figure 4.
Fiber streamline flow in the composite system.
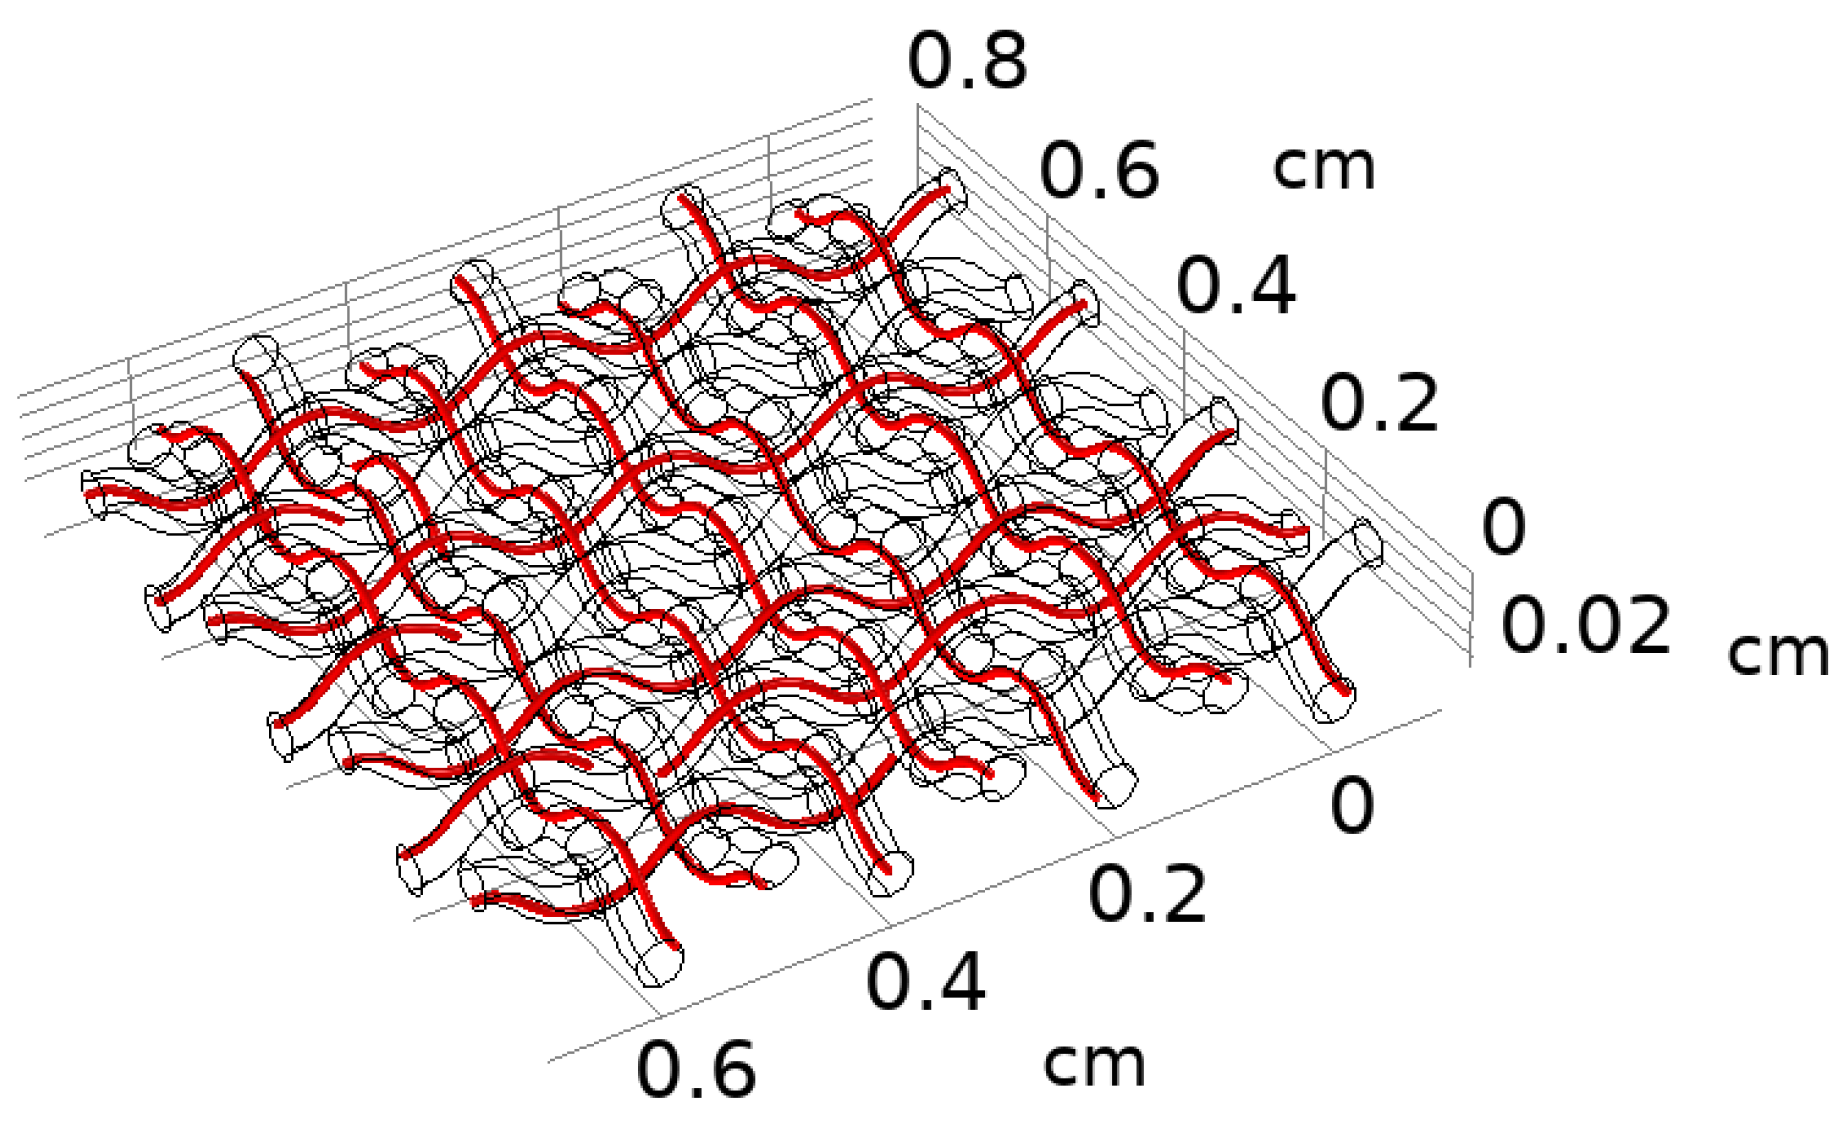
Figure 5.
Fabrication steps for carbon fiber reinforced geopolymer composite with stacking sequence, with the follow-up curing process.
Figure 5.
Fabrication steps for carbon fiber reinforced geopolymer composite with stacking sequence, with the follow-up curing process.
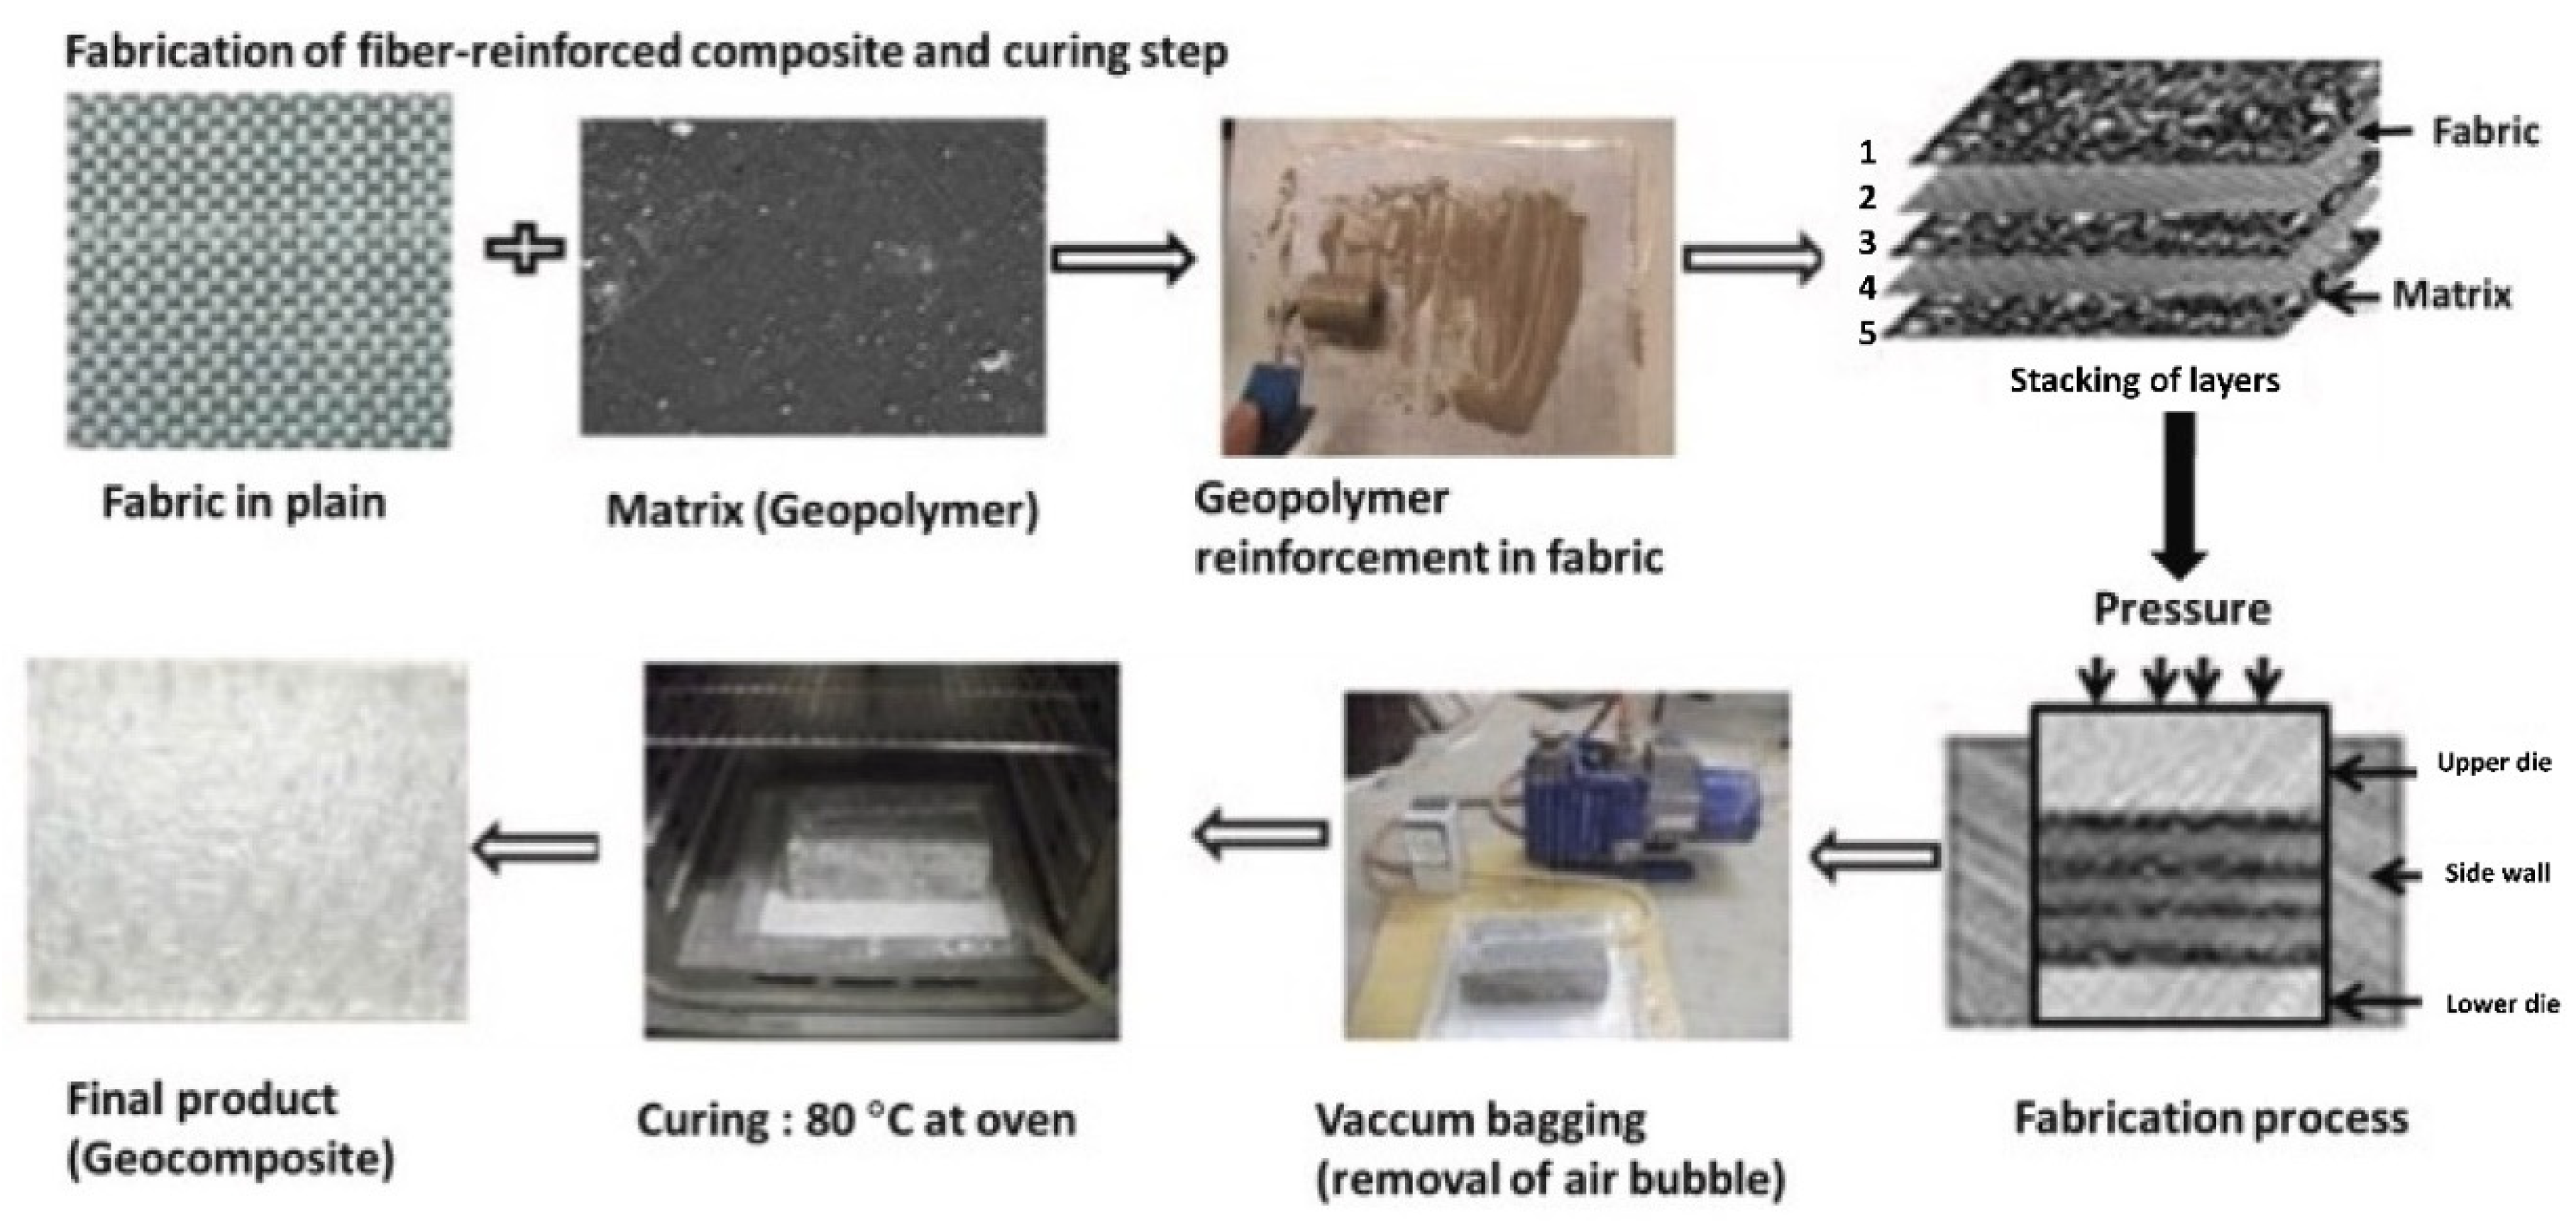
Figure 6.
(a) Thickness expansion, and (b) mass retention of carbon fiber reinforced geopolymer composite as the function of annealed temperature.
Figure 6.
(a) Thickness expansion, and (b) mass retention of carbon fiber reinforced geopolymer composite as the function of annealed temperature.
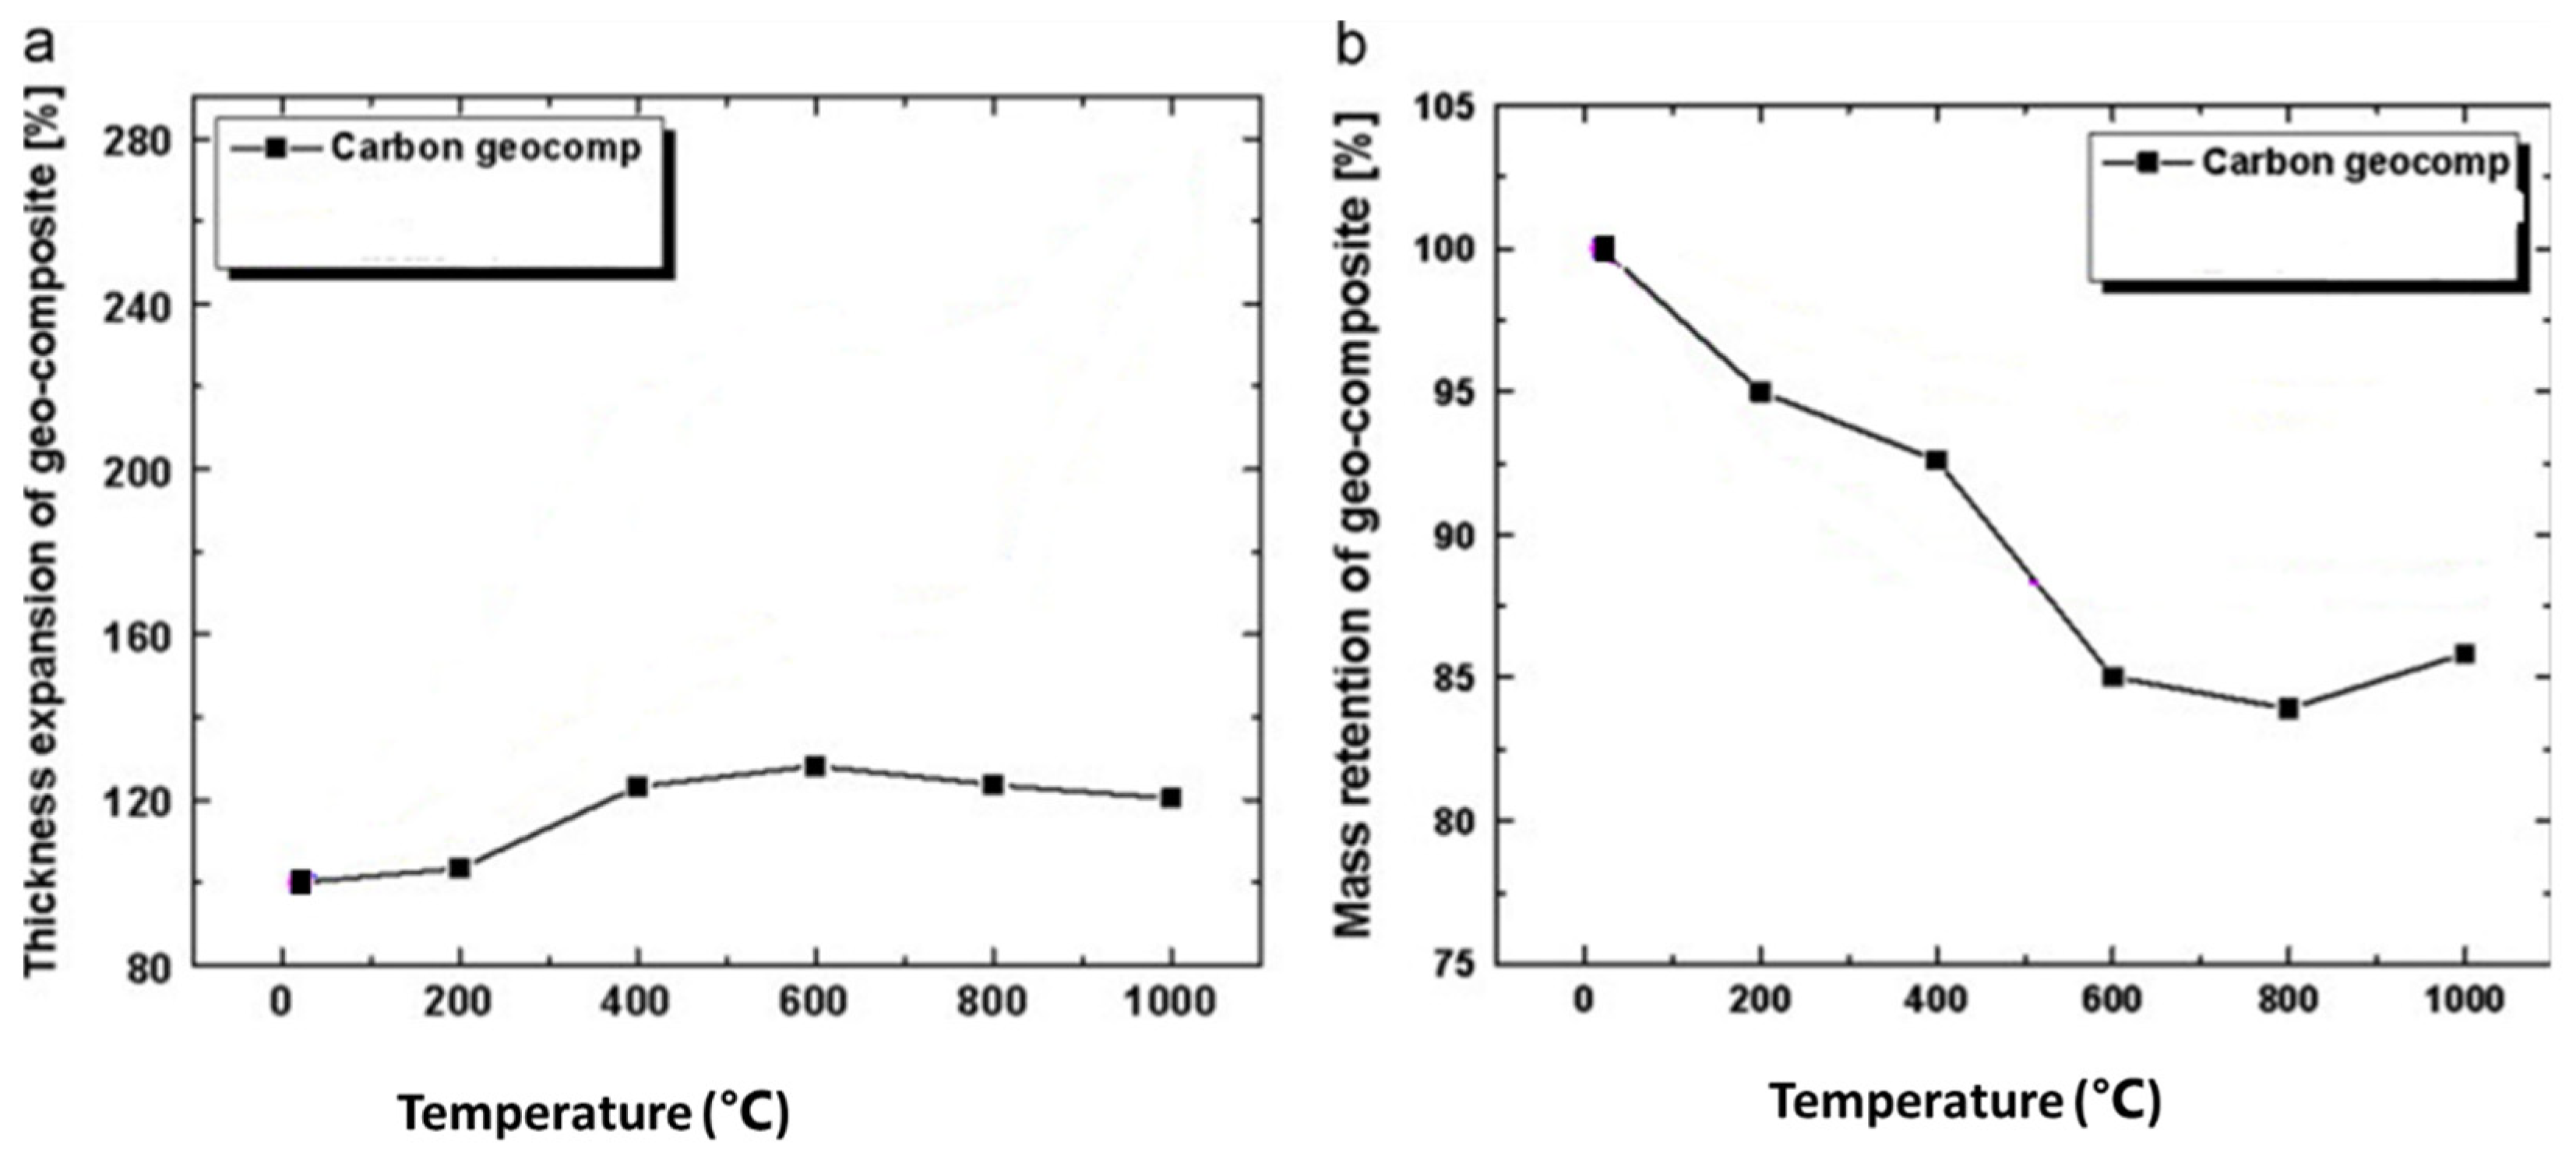
Figure 7.
Surface morphology (a) geopolymer at RT shows the minor cracks; (b) geopolymer after exposure to temperature of various temperatures from (c–e) 200 to 1000 °C.
Figure 7.
Surface morphology (a) geopolymer at RT shows the minor cracks; (b) geopolymer after exposure to temperature of various temperatures from (c–e) 200 to 1000 °C.

Figure 8.
Surface image of (a) geopolymer composites with incorporated carbon fabrics (RT), (b) geopolymer composite (200 °C), (c) geopolymer composite (400 °C), (d) geopolymer composite (600 °C), (e) geopolymer composite (800 °C), and (f) geopolymer composite (1000 °C).
Figure 8.
Surface image of (a) geopolymer composites with incorporated carbon fabrics (RT), (b) geopolymer composite (200 °C), (c) geopolymer composite (400 °C), (d) geopolymer composite (600 °C), (e) geopolymer composite (800 °C), and (f) geopolymer composite (1000 °C).
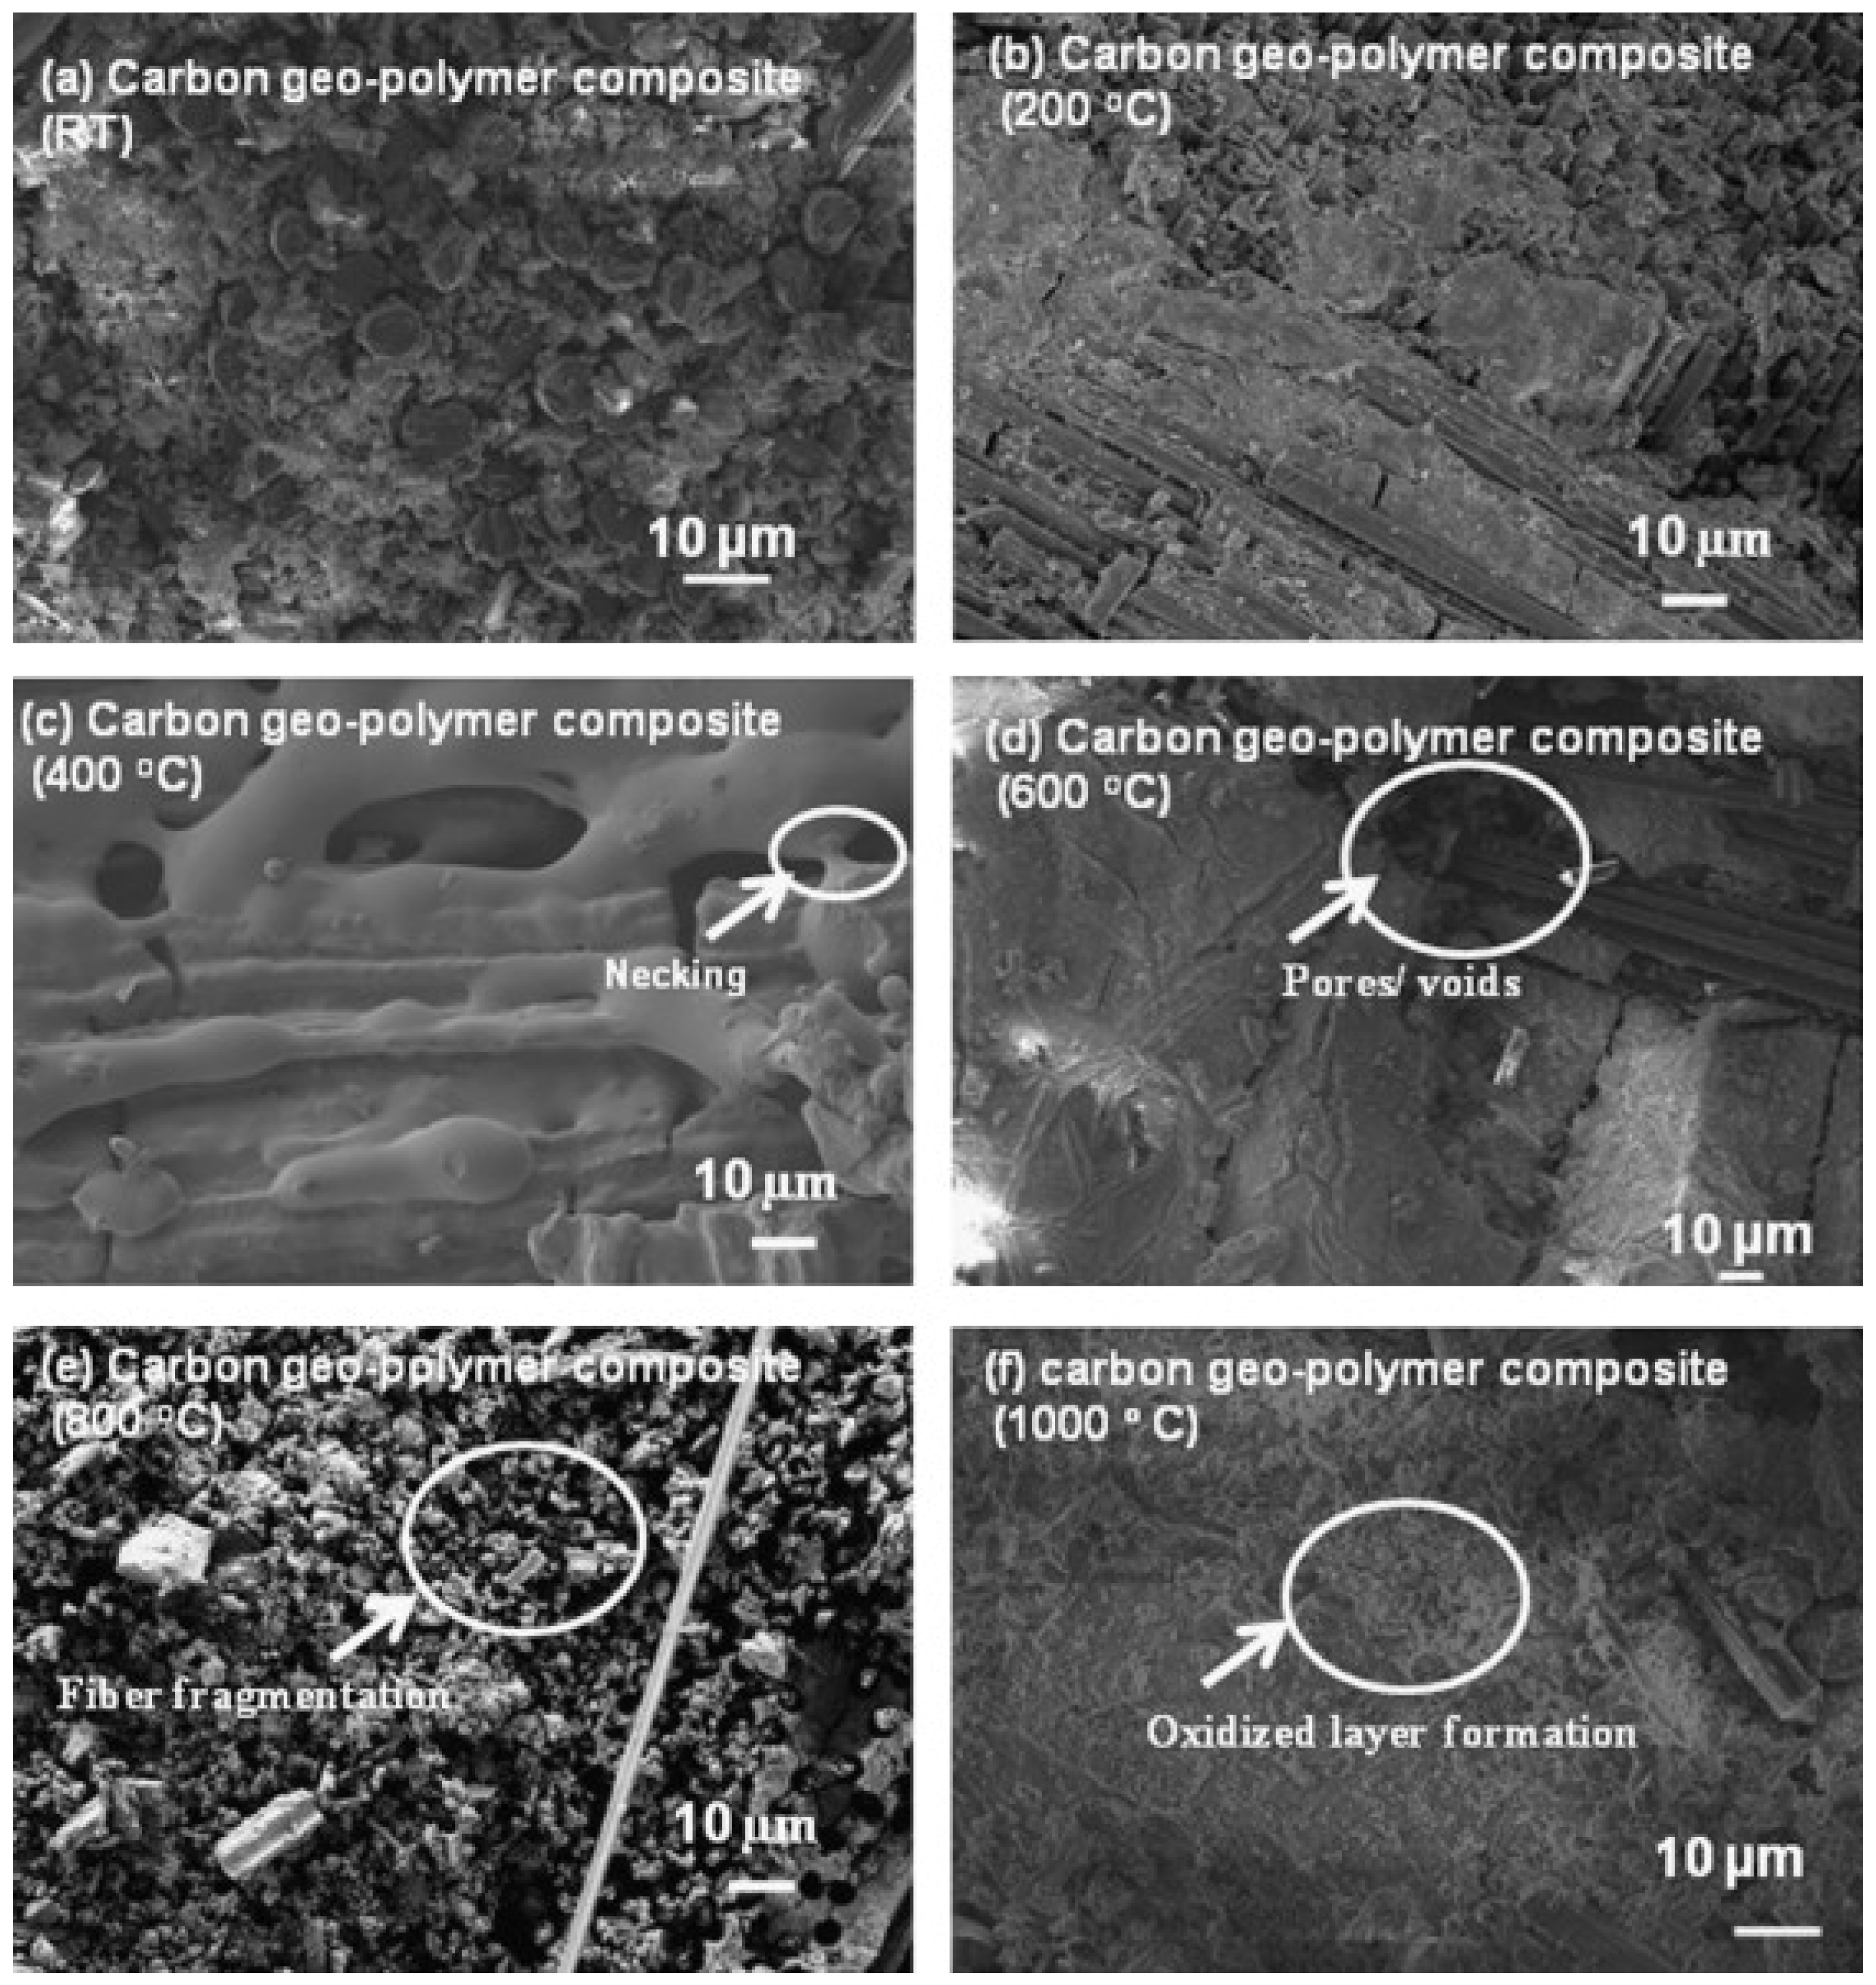
Figure 9.
(a) Temperature distribution on the surface (b), with a fiber-oriented position (c) temperature at the center area with a fiber structure.
Figure 9.
(a) Temperature distribution on the surface (b), with a fiber-oriented position (c) temperature at the center area with a fiber structure.

Figure 10.
(a) Density of geopolymer (RT)and carbon fiber reinforced geopolymer composite (at room and at 1000 °C). (b) Thermal response of geopolymer and composite with the peak of the exothermic reaction.
Figure 10.
(a) Density of geopolymer (RT)and carbon fiber reinforced geopolymer composite (at room and at 1000 °C). (b) Thermal response of geopolymer and composite with the peak of the exothermic reaction.
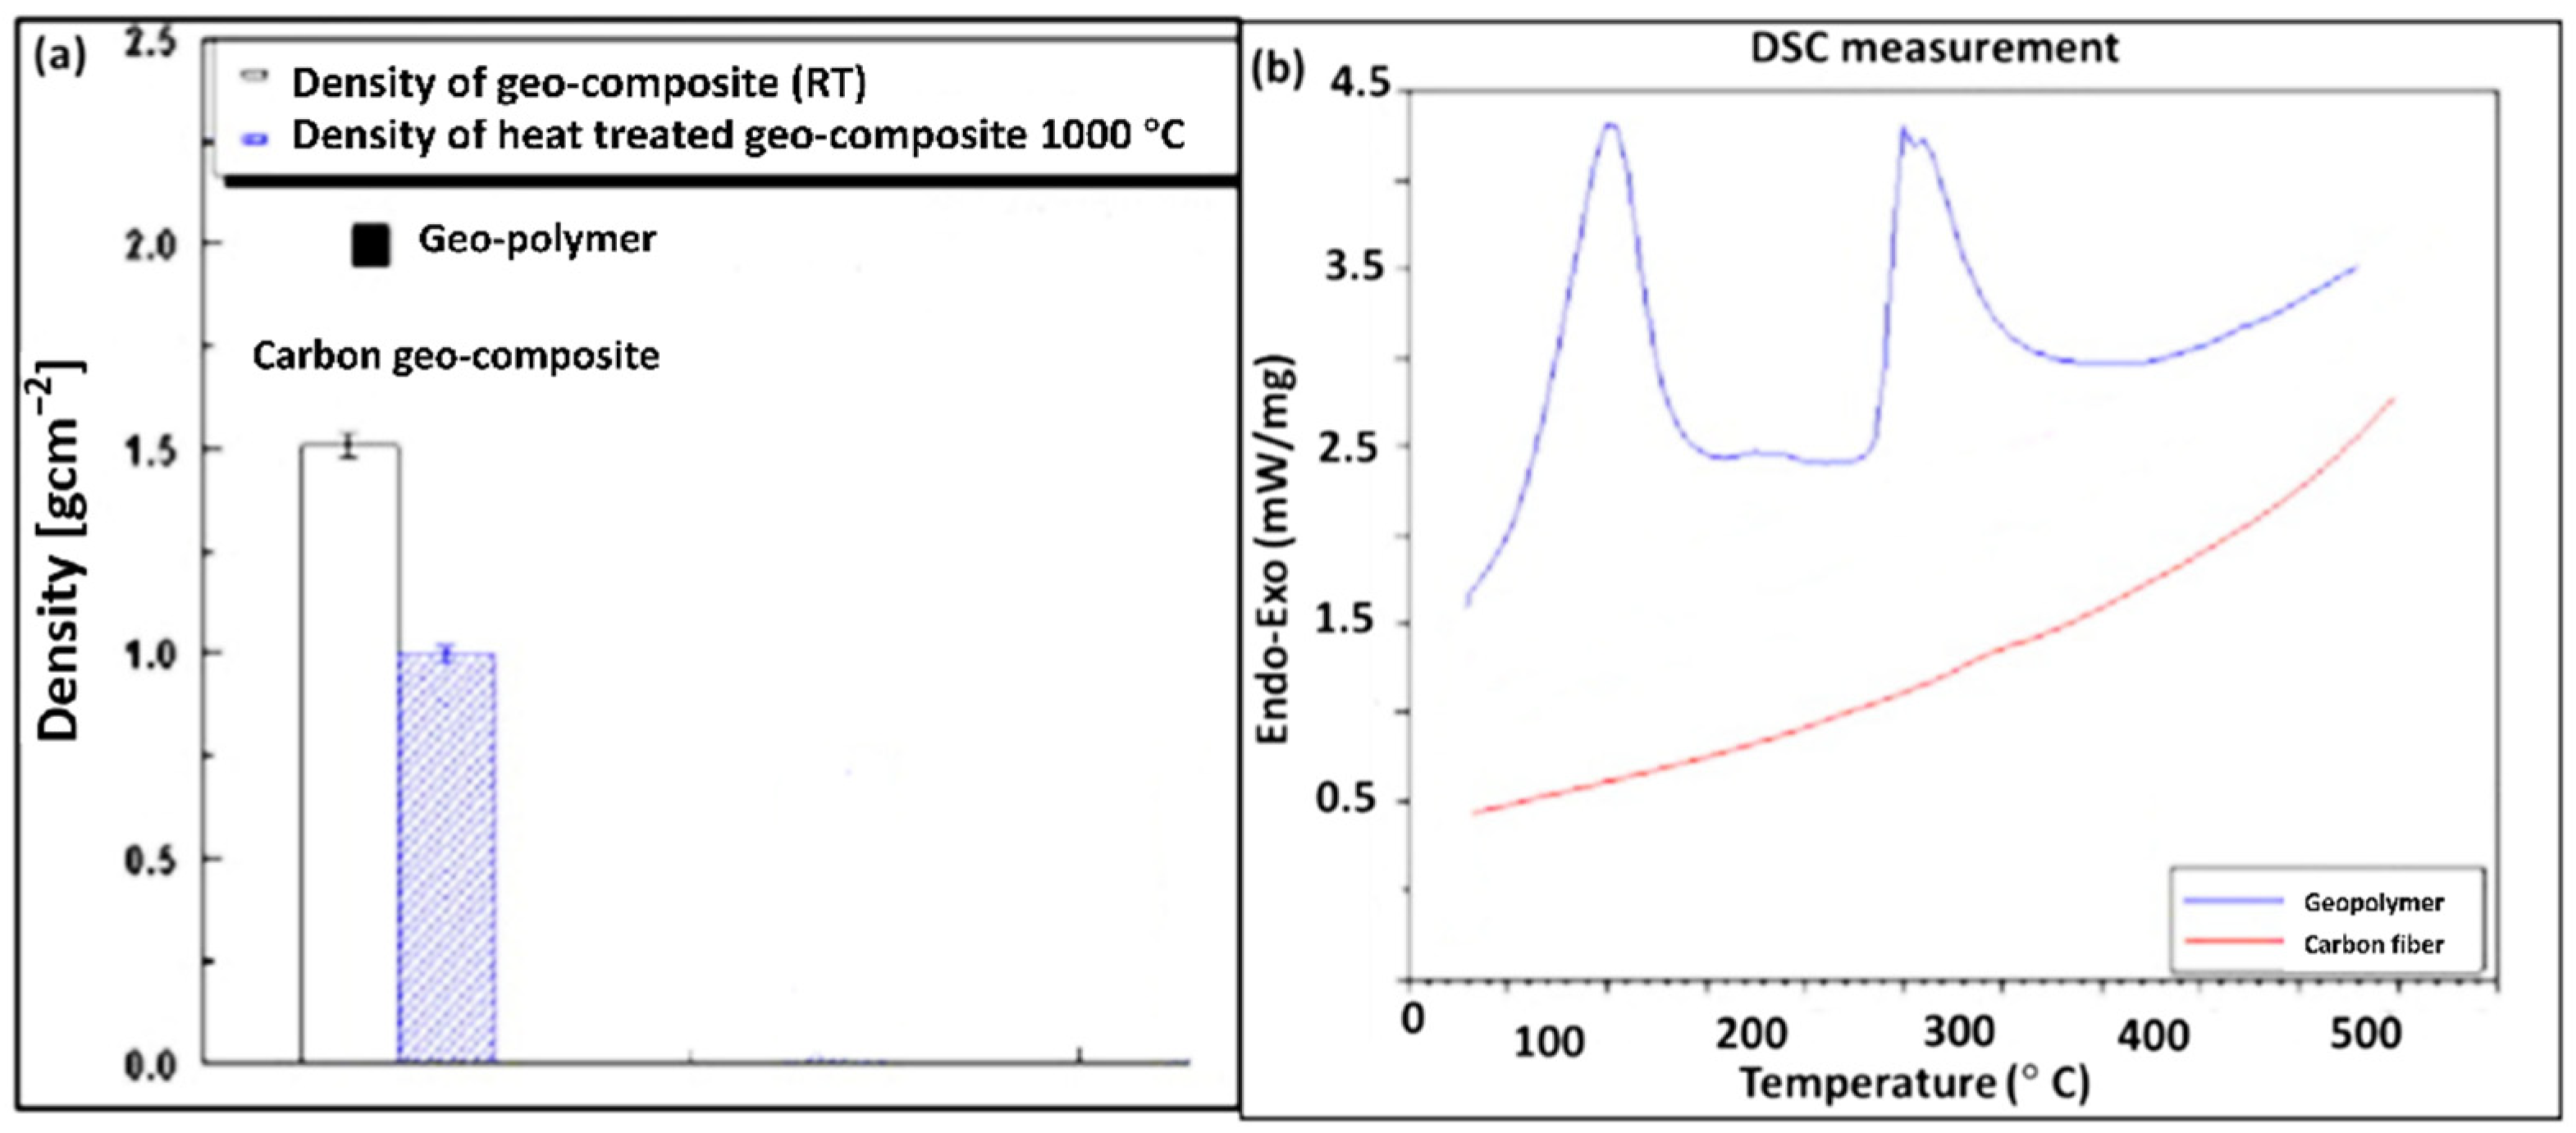
Figure 11.
(a–c) Specific heat capacity, thermal diffusivity, and thermal conductivity of carbon fiber reinforced geopolymer composite at various annealed temperatures.
Figure 11.
(a–c) Specific heat capacity, thermal diffusivity, and thermal conductivity of carbon fiber reinforced geopolymer composite at various annealed temperatures.


Table 1.
Thermal conductivity properties of carbon fiber reinforced geopolymer composite.
| Property | Geopolymer Ref [6] | Carbon Fiber (Core) Ref [6] | Carbon (Infinite Domain) |
|---|---|---|---|
| Thermal conductivity | 0.1141 W/(m K) | {60, 4, 4} W/(m K) | 60 W/(m K) |
| Density | 2000 kg/m3 | 1500 kg/m3 | 1500 kg/m3 |
| Heat capacity at constant pressure | 1650 J/(kg K) | 1000 J/(kg K) | 1000 J/(kg K) |
Table 2.
Matrix, fiber, and void content of geopolymer matrix and composite.
| Sample | Matrix (Polymer) Content (vol%) | Fiber Content (vol%) | Void Content (vol%) |
|---|---|---|---|
| Geopolymer matrix | 99.8 ± 0.02 | 0 | 0.2 ± 0.2 |
| Composite with carbon fiber reinforced geopolymer matrix | 40.5 ± 0.8 | 39.4 ± 0.5 | 21 ± 0.2 |
Publisher’s Note: MDPI stays neutral with regard to jurisdictional claims in published maps and institutional affiliations. |
© 2022 by the author. Licensee MDPI, Basel, Switzerland. This article is an open access article distributed under the terms and conditions of the Creative Commons Attribution (CC BY) license (https://creativecommons.org/licenses/by/4.0/).
Share and Cite
MDPI and ACS Style
Samal, S. Anisotropic Heat Transfer in Plane of Carbon Fabrics Reinforced Geopolymer Composite. Appl. Sci. 2022, 12, 6624. https://doi.org/10.3390/app12136624
AMA Style
Samal S. Anisotropic Heat Transfer in Plane of Carbon Fabrics Reinforced Geopolymer Composite. Applied Sciences. 2022; 12(13):6624. https://doi.org/10.3390/app12136624
Chicago/Turabian StyleSamal, Sneha. 2022. "Anisotropic Heat Transfer in Plane of Carbon Fabrics Reinforced Geopolymer Composite" Applied Sciences 12, no. 13: 6624. https://doi.org/10.3390/app12136624
Note that from the first issue of 2016, this journal uses article numbers instead of page numbers. See further details here.