Article

CoroNet: Deep Neural Network-Based End-to-End Training for Breast Cancer Diagnosis

1
Faculty of Computer and Information, South Valley University, Qena 83523, Egypt
2
Faculty of Computer and Information Sciences, Ain Shams University, Cairo 11566, Egypt
3
Faculty of Science, South Valley University, Qena 83523, Egypt
*
Author to whom correspondence should be addressed.
Appl. Sci. 2022, 12(14), 7080; https://doi.org/10.3390/app12147080
Submission received: 19 May 2022 / Revised: 7 July 2022 / Accepted: 7 July 2022 / Published: 13 July 2022
(This article belongs to the Special Issue Deep Neural Networks in Medical Imaging)

Abstract

:
In 2020, according to the publications of both the Global Cancer Observatory (GCO) and the World Health Organization (WHO), breast cancer (BC) represents one of the highest prevalent cancers in women worldwide. Almost 47% of the world’s 100,000 people are diagnosed with breast cancer, among females. Moreover, BC prevails among 38.8% of Egyptian women having cancer. Current deep learning developments have shown the common usage of deep convolutional neural networks (CNNs) for analyzing medical images. Unlike the randomly initialized ones, pre-trained natural image database (ImageNet)-based CNN models may become successfully fine-tuned to obtain improved findings. To conduct the automatic detection of BC by the CBIS-DDSM dataset, a CNN model, namely CoroNet, is proposed. It relies on the Xception architecture, which has been pre-trained on the ImageNet dataset and has been fully trained on whole-image BC according to mammograms. The convolutional design method is used in this paper, since it performs better than the other methods. On the prepared dataset, CoroNet was trained and tested. Experiments show that in a four-class classification, it may attain an overall accuracy of 94.92% (benign mass vs. malignant mass) and (benign calcification vs. malignant calcification). CoroNet has a classification accuracy of 88.67% for the two-class cases (calcifications and masses). The paper concluded that there are promising outcomes that could be improved because more training data are available.

1. Introduction

Cancer ranks a significant obstacle to rising life expectancy, and is a leading cause of death worldwide. In 2019, WHO reported that the first or second major reason for death earlier than the age of 70 is cancer, in 112 of 183 nations. It is ranked third or fourth in the other 23 countries [1]. It causes an irregular growth of cells and is frequently named depending on the part of the body in which it occurs. Cancer usually spreads out rapidly throughout the body tissues [2]. It starts in cells, the smallest units of body tissues and organs, e.g., in the breast. Mostly, cancer results from mutations, anarchic division, and multiplication or abnormal changes in the cells. New cells usually replace the old or damaged cells that die. This process occasionally fails, and the cell can keep up uncontrollable or orderless division, creating more cells similar to it and causing a tumor.
A tumor is divided into benign (uncancerous) or malignant (cancerous). Benign tumors are not dangerous, because they do not cause cancer: their cells appear close to normal, grow slowly, and do not attack near tissues or harm other body parts. In contrast, malignant tumors are dangerous. If they are not checked, they ultimately exceed the original tumor and attack other body parts.
Cases and deaths are broken down by global region and type of cancer. In 2020, 19.3 million new cases of cancer (18.1 million excluding NMSC, excluding basal cell carcinoma) as well as 10 million deaths (9.9 million excluding NMSC, excluding basal cell carcinoma) occurred in various countries of the world (Table 1). Figure 1 depicts the global distribution of new cases and fatalities for the 10 most common types of cancer among females worldwide in 2020 [3].
To detect the presence of cancer in the body, effective techniques are available. In the early stages, Breast Cancer (BC) can be detected through screening; hence, the treatment can be more effective. Several methods are available, including ultrasound, magnetic resonance imaging (MRI), CT, tomosynthesis, and mammography, as well as molecular breast imaging. Because mammography is cheap and available, it is considered the most widely adopted screening method. When examining a human breast, mammography employs low-dose X-rays. Notably, mammography is a simple and affordable method by specialists. Actually, it is considered the gold standard method of detecting the early stages of BC before the lesions turn into something clinically tangible. Its images show cancerous masses and calcium deposits more brightly. As a result, the death rate decreased by 25 to 30%. A specialist receives two views of the breast, producing two images, namely MLO (Medio Lateral Oblique) and CC (Cranio Caudal) views [4,5].
Specialists have accomplished results of cancer detection that have varied broadly. Even the performances of top clinicians pave the way for further improvements [6,7]. Although mammography is used extensively, interpreting its images has challenged specialists. For instance, false positives may cause patient anxiety [8] and unimportant follow-ups, as well as invasive diagnostic proceedings. The types of cancer that are not identified at screening may be unidentifiable until the advanced stages, when they are hard to treat [9].
In the 1990s, mammography had computer-aided detection (CAD). Since then, many assisting tools have been adopted for medical purposes [10]. Although they have been thought of as promising [11,12], this generation of software did not succeed in obtaining a better performance compared to readers in actual settings [6,12,13]. Lately, several developments have resulted in the reissuance of the field, because of the successful attempts of deep learning. Scholars and researchers employed several machine learning methods to detect BC using mammograms [14].
The Digital Database for Mammography Screening (DDSM) [15] represents the highest generally utilized databases of the public mammogram. Several papers utilized the traditional techniques of automatic, not manual, extraction of features, including fractional Fourier transform, Gray Level Co-Occurrence Matrix (GLCM), and Gabor filter, in order to secure features, followed by applying SVM or further classifiers to conduct the classification [16,17]. Furthermore, neural networks were utilized as classifiers [18,19]. Recently, several papers have employed CNN for feature generations, using mammograms [20,21]. Some authors utilized pre-trained CNN as transfer learning uses. Lévy et al. [22] surpassed human performance in the classification of DDSM images using CNN, exploiting transfer learning on pretrained models such as AlexNet, the ImageNet Large Scale Visual Recognition Challenge’s winning network in 2012 (ILSVRC), and GoogLeNet, which won the 2014 edition of the same competition [23,24]. Guan [25] only used one Convolutional CNN, with the front convolutional layers being responsible for feature generation and the back fully connected (FC) layers acting as the classifier. Therefore, our CNN uses mammographic images as the input, and the (predicted) label as the output. With no evident overfitting, the average validation accuracy for abnormal vs. normal cases converged at around 0.905. In 2018, Xi et al. used VGGNet, the winner of the ImageNet challenge in 2014, to achieve a 92.53% classification accuracy [26,27]. The same authors exploited ResNet to localize the abnormalities within the full mammography images [28]. Recently, Ragab et al. extracted ROIs from mammography, both manually and with threshold-based techniques, then classified them using AlexNet chained with SVM [29]. On the CBIS DDSM dataset, they claimed an accuracy of 87.2% with a 0.94 AUC. Shen et al. further extended these studies by comparing the findings of several state-of-the-art architectures; when averaging the top four models, they were able to obtain a 0.91 AUC [30].
In 2020, an important article was published in Nature [31], in which the authors trained an ensemble of three models on more than 28,000 mammogram images. Then, they compared its predictions with the decisions of radiologists. The actual labels were determined using follow-up exams or biopsies. It turns out that AI beats humans in terms of sensitivity and specificity.
Some scholars have addressed the scarcity of images in the DDSM dataset by proposing data augmentation techniques. Hussain et al. [32] compared different transformations, proving that using augmentation functions that preserve a high amount of information (i.e., not too disruptive) helps to increase the classification accuracy. Similar results were obtained by Costa et al. in a less extensive study [33].
In this study, we aim to perform abnormality classification in mammography using CNNs. The dataset of interest is the CBIS DDSM. The mammogram images feature two kinds of breast abnormalities: mass and calcification, which can be either benign or malignant. In supplementary, we display the advances of the CAD methods utilized in detecting and diagnosing BC, using mammograms that encompass pre-processing, feature selection, features extraction, and contrast enhancement, as well as methods of classification.
In this paper, Section 2 is dedicated to the Materials and Methods, whereas Section 3 is devoted to the methodology and pre-trained models. Section 4 explores the discussion of classification through classifiers and combined classifiers. Section 5 covers the concluding remarks.

2. Materials and Procedures

2.1. Materials

The mammogram is one the most important methods on the effectiveness and sensitivity of the screening modality [34].

2.1.1. Mammography Datasets

Various datasets are publicly accessible. They differ in terms of size, image format, image type, and resolution, etc., such as DDSM and DDSM’s Curated Breast Imaging Subset (CBIS-DDSM) as show (Table 2).
One of the most significant characteristics of a mammogram is the utilization of low-energy X-rays, to screen and diagnose the human breast. Two master views are introduced for acquiring the X-ray images: CC and MLO (Figure 2). Mammography mainly aims to detect BC early [35,36], ordinarily by detecting abnormal regions or masses in the images of the X-ray. These masses are often highlighted by a physician or an expert radiologist.
The paper applied mammographic images from databases. As a dataset, DDSM was first assembled and became available online in 2007 by South Florida University. It contains 2620 scanned film mammographic images of normal, benign, and malignant cases, all stored in Lossless Joint Photographic Experts Group format (LJPEG) with altered sizes and resolutions [37].
DDSM is employed to conduct research in the systems of detecting and classifying BC. It shows real breast data with a resolution of 42 microns, 16 bits, and an average size of 3000 × 4800 pixels. It [15,36,39] holds 2620 scanned film mammography studies distributed in 43 volumes. DDSM database holds 695 normal cases and 1925 abnormal cases (914 malignant/cancer cases and 870 benign cases, as well as 141 benign without callback), specifying the boundaries and locations of the abnormal cases. For every case, four images can be found to represent the left and right breasts in the MLO and CC views (Figure 2) [34]. An experienced radiologist can recognize malignant and benign masses in all mammograms. CBIS-DDSM Dataset: CBIS-DDSM is a developed and united edition of DDSM. Table 3 displays the distribution of data.

2.1.2. Data Pre-Processing

The dataset is provided as a set of numpy arrays, containing the images and labels to use for training and testing. Before these data can be actually used as input for the NN models, a few pre-processing steps are necessary. Depending on the specific classification task (e.g., mass/calcification, benign/malignant,…), the actions to perform can be slightly different. The following list describes the whole sequence for preparing the data:
  • Import the training and testing data as numpy arrays from shared npy files.
  • When the baseline patches are not needed, remove them and the corresponding labels from the arrays (even indices).
  • Remap the labels, depending on how many, and which classes are involved in the specific classification. If the task is to only distinguish between the masses and calcification, only two labels (0–1) are needed. Conversely, four labels (03) are required when it is also important to discriminate benign abnormalities from malignant ones.
  • Normalize the pixel values to be in a range that is compatible with the chosen model. Scratch CNN models using input in the range (0, 1) floating point, while VGGNet and other pretrained models are designed to work with images in (0, 255) that are further pre-processed with custom transformations (channel swapping, mean subtraction,…).
  • Shuffle the training set and corresponding labels accordingly.
  • Distribute the training data to “validation” and “training” subsets. The former will be used to compute the loss function exploited by the optimizer, where the actual performance is monitored on an independent group during training, using a validation set.
  • Instantiate Keras generators as data sources for the network. Data augmentation settings can be specified at this stage.
At the end of the pipeline, one or more of the resulting samples are effectively visualized to verify that:
  • The data are formatted as expected (size, range…)
  • The images content is still meaningful and was not accidentally corrupted during the process.

2.2. Methodology

2.2.1. Pre-Trained Models

CNNs have grown deeper in the past few years, because they have shown great performance; with the state-of-the-art networks going from 7 layers to 1000 layers. In this paper, we use some of these state-of-art architectures, pre-trained on ImageNet, for transfer learning from natural images to breast cancer images.

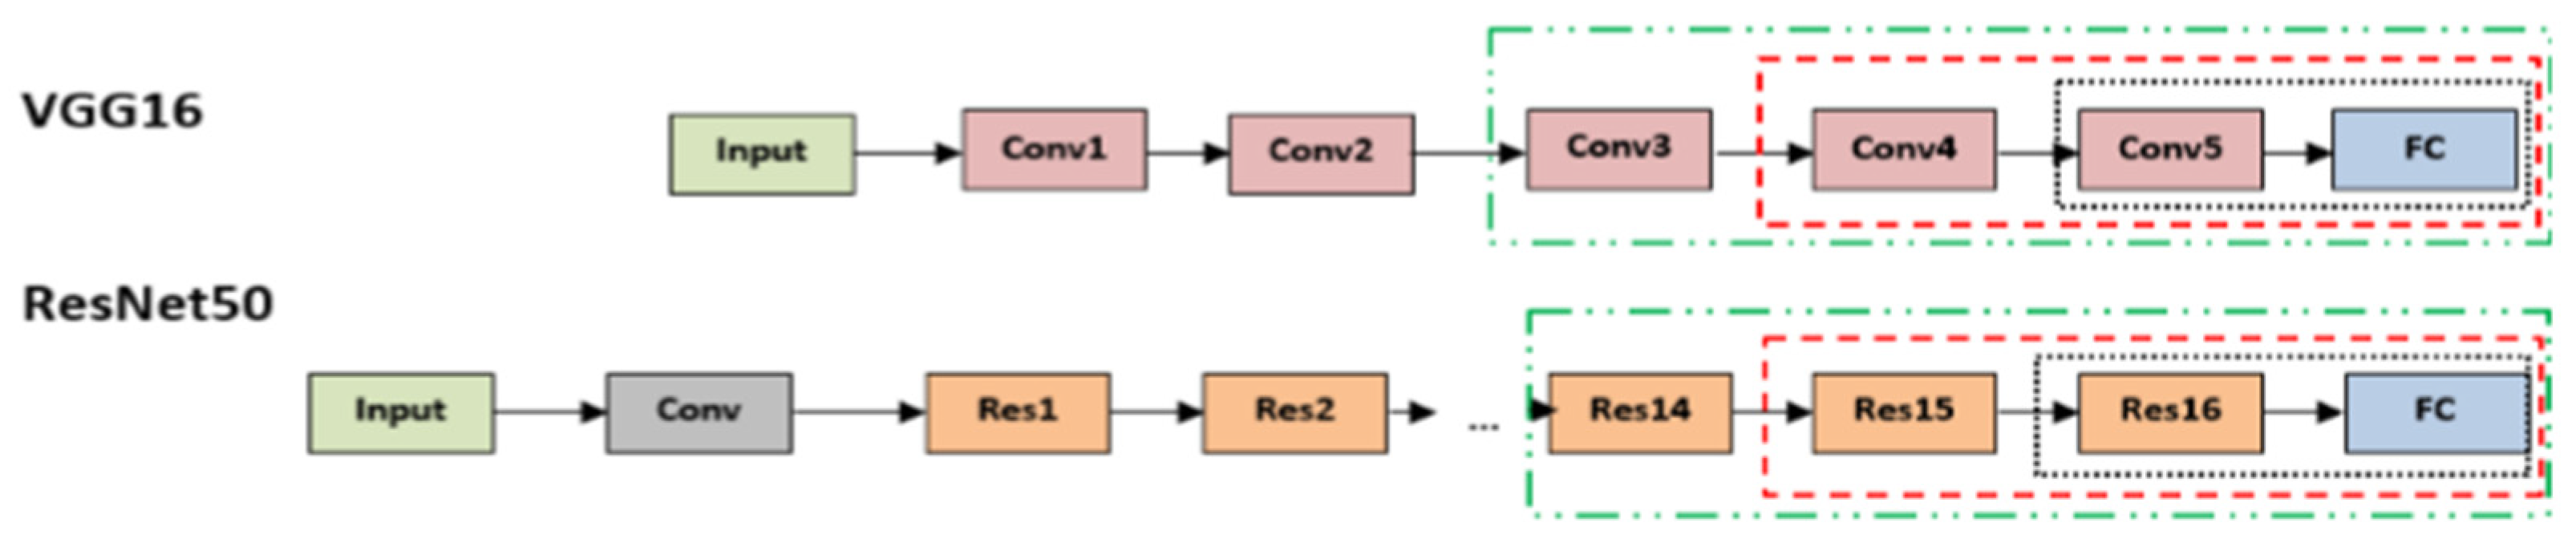
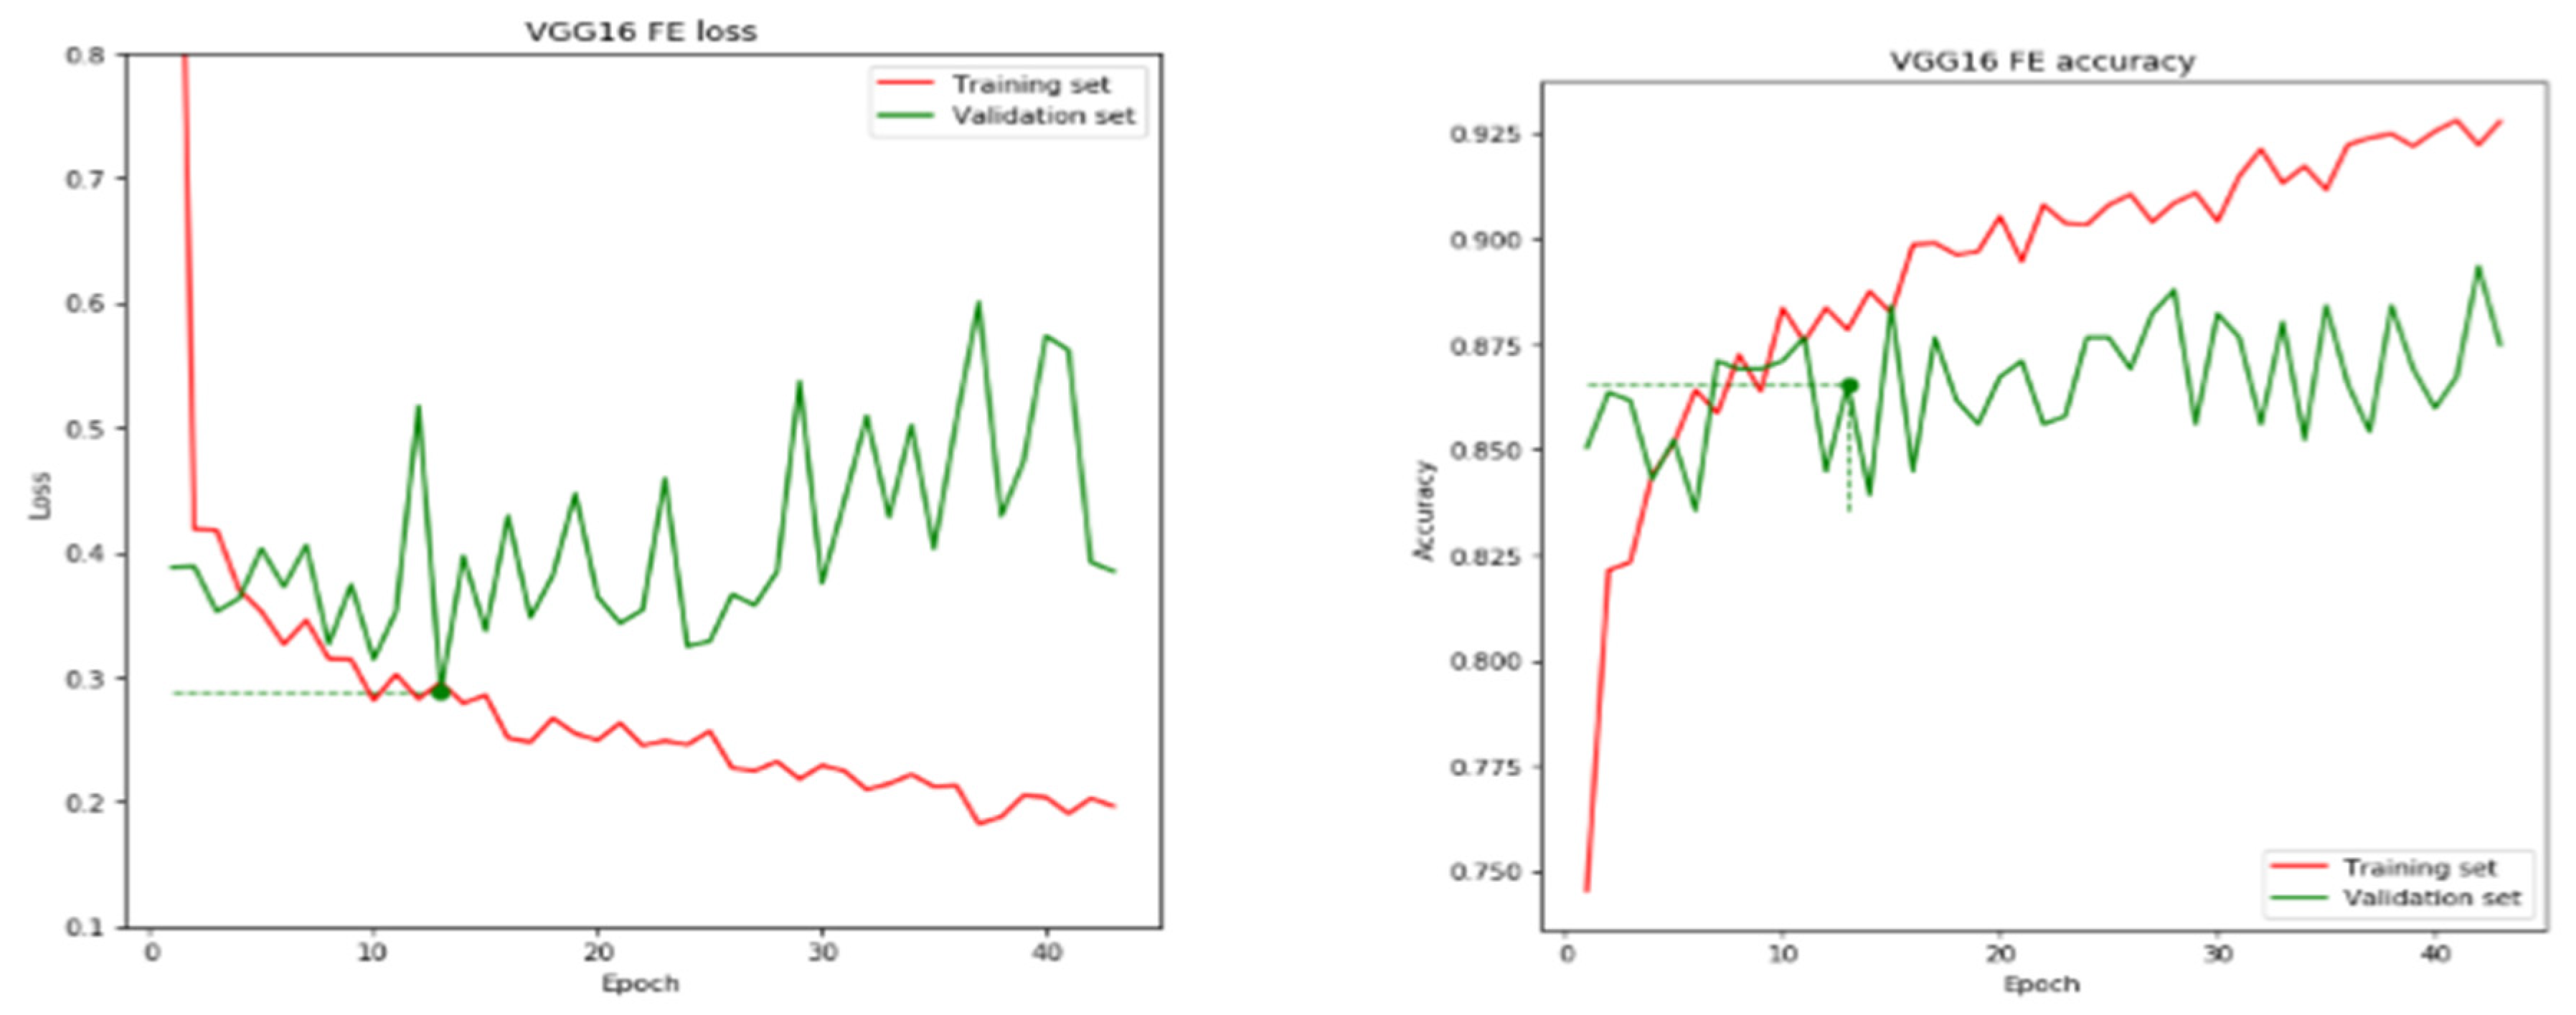
2.2.2. Pre-Trained VGG Architecture

A very deep convolutional network has many versions (VGG) [27], and has been published by researchers from Oxford University as one of the best networks; it is known as simple. Its architecture is very easy and deep; the convolution layers and dropout layers are basically switched between. To replicate the influence of bigger receptive fields, the first step is to use numerous small 3 × 3 filters in each convolutional layer and to merge them in a sequence (VGG).
Despite the simple architecture, the network is costly regarding the cost of the computation and memory, because the dramatically rising kernels cause more computational time and a bigger sized model. The applied VGG16 architecture includes 13 convolutional layers and five pooling layers, and attains 9.9% top-5 error on ImageNet. Its immense size makes the training an extremely cumbersome process; notwithstanding, VGG16 is often used for transfer learning, thanks to its flexibility.

2.2.3. Pre-Trained ResNet50 Architecture

Microsoft Research team introduced the ResNet50 for Image Recognition [28]; a deep residual learning model. Notably, it is one of the best developed models. Due to the novel concept of residual layers, some levels are bypassed to prevent a vanishing gradient. The authors developed an elegant, simple, and straightforward idea by gathering a standard deep CNN and adding shortcut connections that avoid limited convolutional layers simultaneously. These connections generate residual blocks, as the convolutional layer’s output is prompted by the block’s input tensor. The ResNet50 model, for example, is made up of 50 layers of similar blocks connected by shortcuts. These connections keep the computation time to a minimum, and provide a rich combination of features at the same time; see Figure 3.

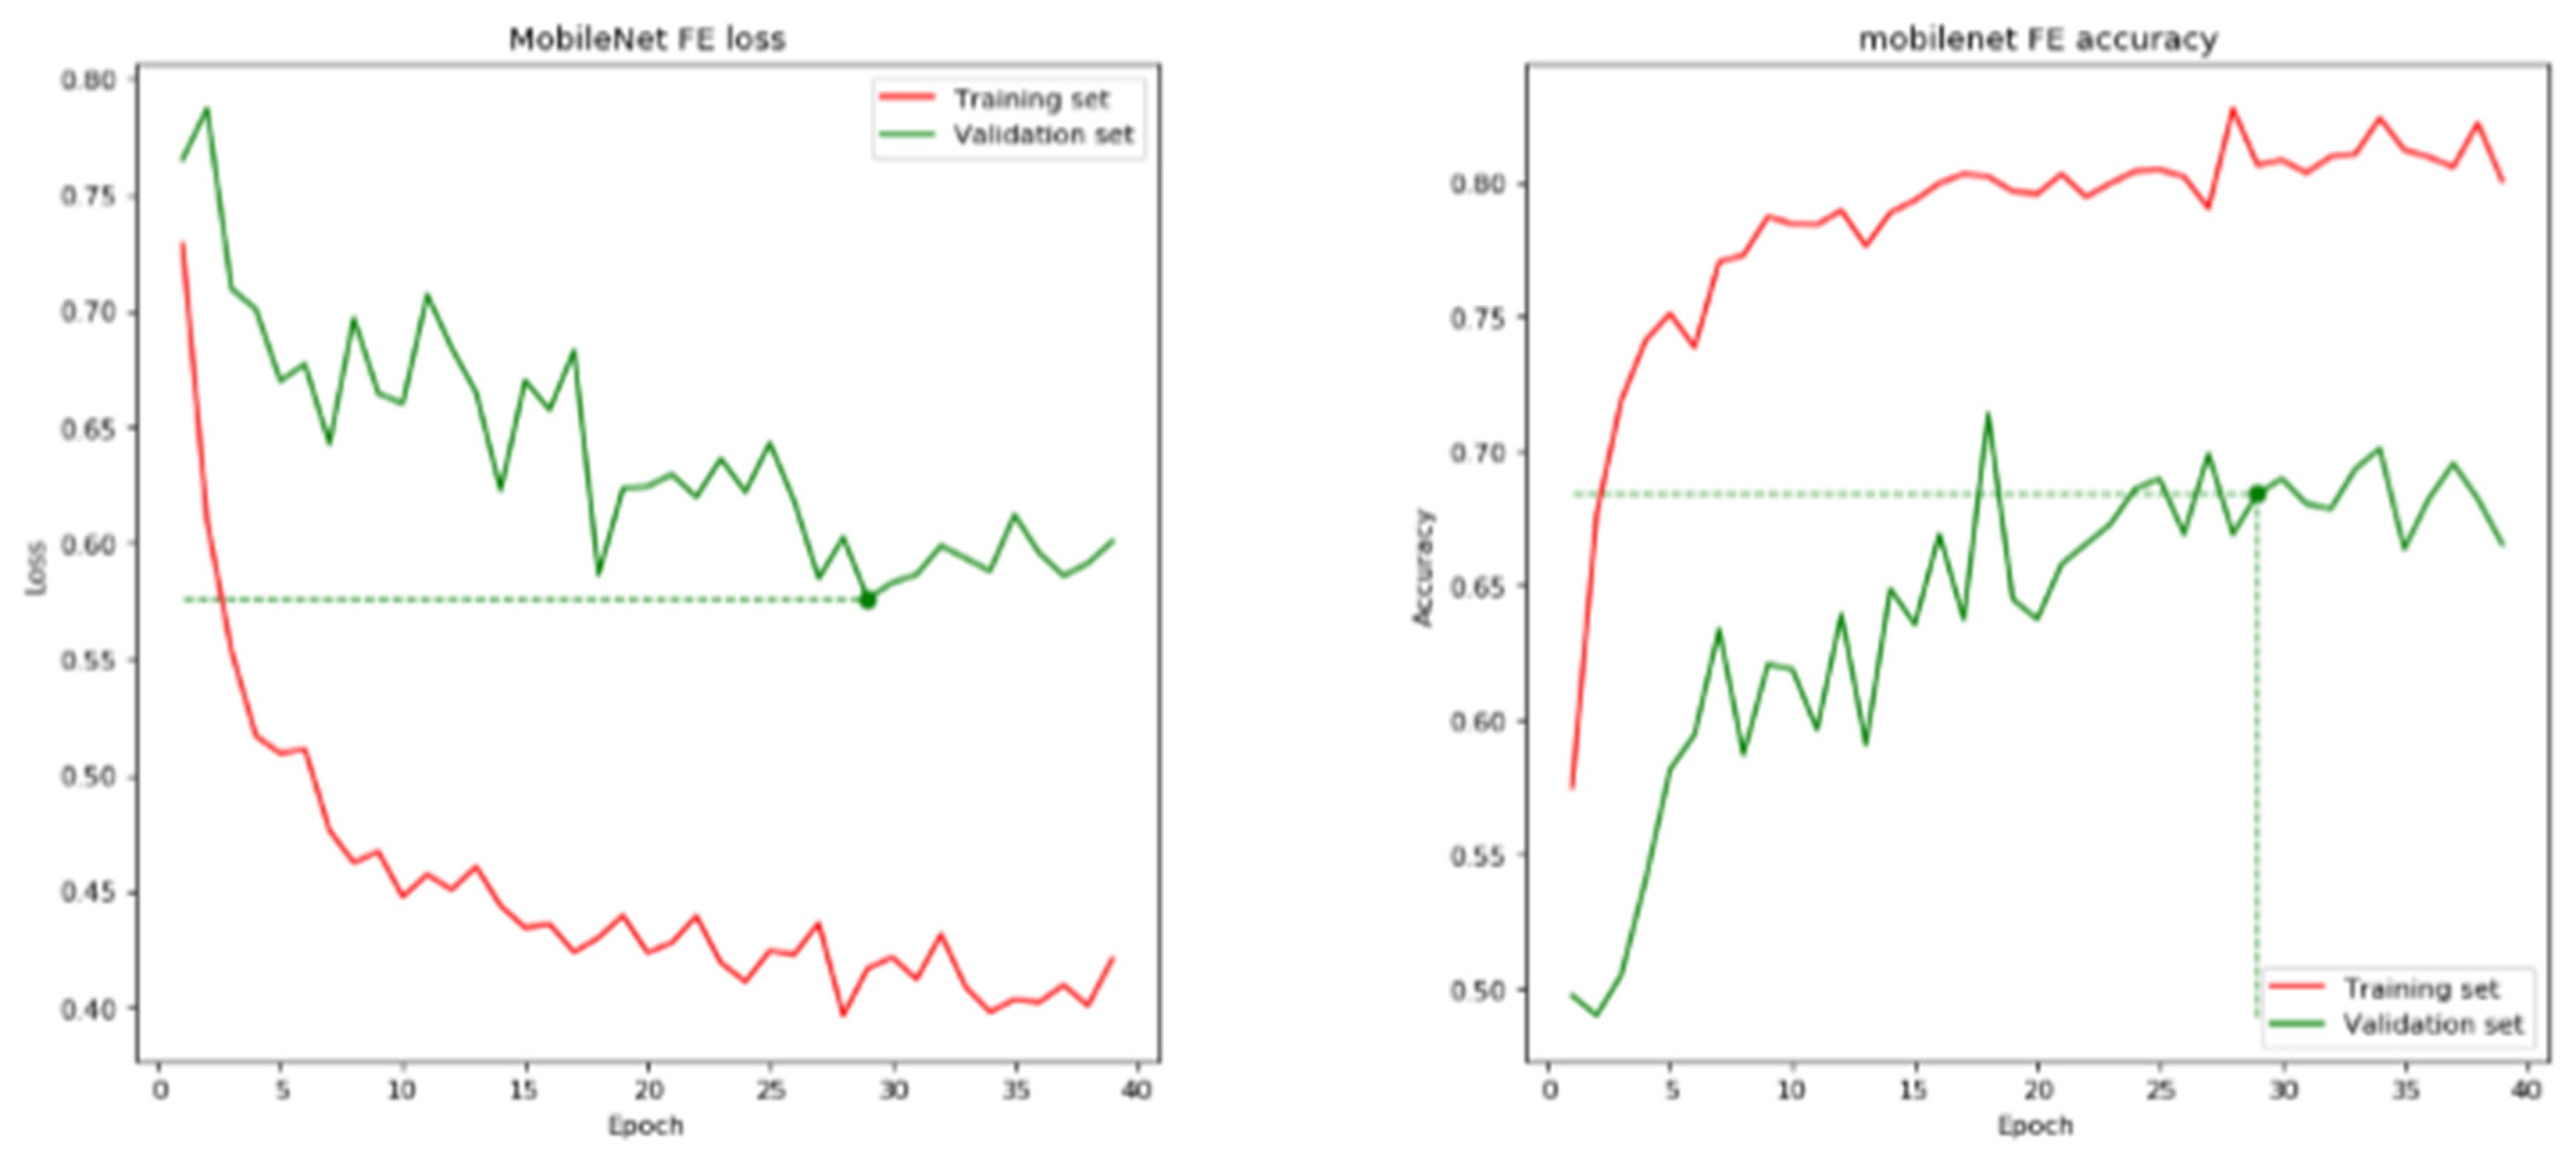
2.2.4. Pre-Trained MobileNet Architecture

MobileNet [40] is a scooped architecture proposed by Google to operate via mobile phones and embedded devices or systems that do not have computational power. Its architecture employed depthwise separable convolutions to radically decrease the sum of trainable parameters, in rapprochement with regular CNNs with corresponding depth. Both the spatial and depth dimensions are handled by the depthwise separable convolution (number of channels). It breaks up the kernel into two parts, one for depthwise convolution, and the other for pointwise convolution. The cost of calculation is considerably reduced when kernels are used. MobileNet provides findings of rapprochement with AlexNet, while drastically reducing the trainable parameters. Table 4 shows Summary of the architectures of CNN.

3. New Method

The present part tackles the work method of the suggested methods.

3.1. Convolutional Neural Network (CNN)

Deep CNN represents one of the distinctive types of neural networks that have found major and popular use in machine learning and computer-aided detection applications [41] for better performance and efficiency. The CNN has demonstrated extraordinary performance in several competitions regarding image processing and computer vision. The fantastic uses of CNN involve speech recognition, natural language processing, video processing, and object detection, as well as image classification and segmentation.
CNN is a mathematical structure, which usually includes three types of building blocks:
Convolution layers;
Pooling layers;
Fully connected layers.
Convolution and pooling building blocks perform feature extraction, while the third charts the extracted features into a final output, such as classification. A convolution layer has an interesting part of CNN that is made of many mathematical operations, like convolution, which represents a specialized type of linear operation.
The strong learning ability of the deep CNN network is firstly due to it using several feature extraction phases that can acquire representations based on data automatically. There has been an acceleration in the CNN network by research, due to the large amounts of available data and hardware improvements. Researchers have reported exciting deep CNN architectures. Many inspirational ideas have been discovered for achieving developments in CNN networks, including the use of several activation and loss functions, architectural innovations, regularization, and parameter optimization. They are achieved through architectural innovations and important developments in the representation capacity of CNN deep networks.

3.2. Architecture and Development of the Model

The CNN model, i.e., CoroNet, was proposed to automatically detect BC from mammogram images according to Xception CNN architecture [42,43]. Xception Extreme Inception architecture represents the major feature of Xception (the predecessor model). In addition, it consists of a 71-layer deep CNN architecture pre-trained on an ImageNet dataset. The major conception behind Xception is its depthwise separable convolution. Using this method, the operations’ number is decreased using a factor proportional to 1/k. Xception employs depthwise separable convolution layers with residual connections instead of traditional convolutions. Separable in-depth Convolution replaces the traditional n × n × k convolution with a 1 × 1 × k point-wise convolution followed by a channel-wise n × n spatial convolution.
Residual connections represent “skip connections” whose authorized gradients flux directly via a network, without travelling via non-linear functions of activation; consequently, disappearing gradients are avoided. In the case of residual connections, the output of a weight layer series is combined with the original input and passed via a non-linear activation function.
Out of the 33,969,964 parameters in CoroNet, 54,528 are non-trainable, and the other 33,969,964 are trainable. Xception represents the base model of CoroNet while adding a dropout layer, and two completely connected layers, ultimately. In Table 5, CoroNet’s architecture, layer-wise parameters, and output shape are all depicted. In order to specify the overfitting problem, we used Transfer Learning to initialize the model’s parameters.

4. Results and Discussion

The authors performed two scenarios for CoroNet, for the detection of BC from mammogram images. The first model was the major multi-class model (two-class CoroNet), trained to categorize mammogram images into two groups: masses and calcifications. The other was the four-class CoroNet (malignant mass vs. benign mass and malignant calcification vs. benign calcification).
CoroNet, the proposed model, was implemented in Keras on top of Tensorflow 2.0. It was pre-trained on the ImageNet dataset before being retrained end-to-end on the prepared dataset using the Adam optimizer with a learning rate of 0.0001, a batch size of 128, and an epoch value of 200. The data were shuffled before each epoch was activated, which was known as data shuffling. Google Colab was used to perform all of the experiments and training attempts.
The adopted models’ training and performance were evaluated with reference to significant parameters, namely, validation loss, training loss, validation accuracy, and training accuracy, at various epochs. Table 6 shows these parameters’ results. The parameters were considered to estimate the trained models’ under-fitting and over-fitting. The graphs of training loss vs. validation loss and training accuracy vs. validation accuracy of each model were presented (Figure 4, Figure 5, Figure 6 and Figure 7). In sum, CoroNet demonstrates the minimum training and validation loss, and shows the best accuracies of training and validation.

5. Conclusions

Deep convolutional neural networks (CNNs) are frequently used for medical image analysis, Unlike the randomly initialized ones, pre-trained natural image database (ImageNet)-based CNN models have a better chance of being successfully fine-tuned to produce better results than those that are randomly initialized. A CNN model called CoroNet is suggested to perform the automatic detection of BC by the CBIS-DDSM dataset. It leverages the Xception architecture, which was completely trained on whole-image BC based on mammograms, and pre-trained on the ImageNet dataset. This paper proved that the convolutional design method “CoroNet” outperforms its alternative networks. In four-class classification, experiments demonstrate that it can achieve an overall accuracy of 94.92 percent (benign mass vs. malignant mass and benign calcification vs. malignant calcification). For the two-class examples, CoroNet has a classification accuracy of 86.67%. (calcifications and masses).
High-resolution mammography handling is seen as a significant difficulty. In order to see the fine features contained in these high-resolution mammograms, the models must also be updated. Although there are various imaging modalities that can be employed, such as MRI and ultrasound, the majority of the current CAD relies on X-ray mammography. The use of 3D mammograms for diagnosis rather than 2D mammograms is another difficult issue that necessitated research in order to make the most of the 3D property, and to improve detection and classification performance.

Author Contributions

Conceptualization, N.M. and S.H.; methodology, N.M.; software, N.M.; validation, S.H. and N.M.; formal analysis, N.M.; investigation, N.M.; resources, N.M.; data curation, S.H.; writing—original draft preparation, N.M.; writing—review and editing, S.H. and N.M.; visualization, N.M.; supervision, S.Z.R.; project administration, S.H.; funding acquisition, N.M. All authors have read and agreed to the published version of the manuscript.

Funding

This research received no external funding.

Institutional Review Board Statement

Not applicable.

Informed Consent Statement

Not applicable.

Data Availability Statement

Not applicable.

Conflicts of Interest

The authors declare no conflict of interest.

References

  1. Hassan, N.M.; Hamad, S.; Mahar, K. Mammogram breast cancer CAD systems for mass detection and classification: A review. Multimed. Tools Appl. 2022, 81, 20043–20075. [Google Scholar] [CrossRef]
  2. Ponraj, D.N.; Jenifer, M.E.; Poongodi, P.; Manoharan, J.S. A survey on the preprocessing techniques of mammogram for the detection of breast cancer. J. Emerg. Trends Comput. Inf. Sci. 2011, 2, 656–664. [Google Scholar]
  3. Sung, H.; Ferlay, J.; Siegel, R.L.; Laversanne, M.; Soerjomataram, I.; Jemal, A.; Bray, F. Global Cancer Statistics 2020: GLOBOCAN Estimates of Incidence and Mortality Worldwide for 36 Cancers in 185 Countries. CA Cancer J. Clin. 2021, 71, 209–249. [Google Scholar] [CrossRef] [PubMed]
  4. Saira Charan, S.; Khan, M.J.; Khurshid, K. Breast Cancer Detection in Mammograms using Convolution Neural Network. In Proceedings of the 2018 International Conference on Computing, Mathematics and Engineering Technologies (iCoMET), Sukkur, Pakistan, 3–4 March 2018; Volume 1, pp. 2–6. [Google Scholar]
  5. Omonigho, E.L.; David, M.; Adejo, A.; Aliyu, S. Breast Cancer: Tumor Detection in Mammogram Images Using Modified AlexNet Deep Convolution Neural Network. In Proceedings of the 2020 International Conference in Mathematics, Computer Engineering and Computer Science (ICMCECS), Ayobo, Nigeria, 18–21 March 2020; pp. 1–6. [Google Scholar] [CrossRef]
  6. Elmore, J.G.; Jackson, S.L.; Abraham, L.; Miglioretti, D.L.; Carney, P.A.; Geller, B.M.; Yankaskas, B.C.; Kerlikowske, K.; Onega, T.; Rosenberg, R.D.; et al. Variability in Interpretive Performance at Screening Mammography and Radiologists’ Characteristics Associated with Accuracy. Radiology 2009, 253, 641–651. [Google Scholar] [CrossRef]
  7. Lehman, C.D.; Wellman, R.D.; Buist, D.S.M.; Kerlikowske, K.; Tosteson, A.N.A.; Miglioretti, D.L. Diagnostic Accuracy of Digital Screening Mammography With and Without Computer-Aided Detection. JAMA Intern. Med. 2015, 175, 1828–1837. [Google Scholar] [CrossRef] [PubMed]
  8. Tosteson, A.N.A.; Fryback, D.G.; Hammond, C.S.; Hanna, L.G.; Grove, M.R.; Brown, M.; Wang, Q.; Lindfors, K.; Pisano, E.D. Consequences of False-Positive Screening Mammograms. JAMA Intern. Med. 2014, 174, 954–961. [Google Scholar] [CrossRef]
  9. Houssami, N.; Hunter, K. The epidemiology, radiology and biological characteristics of interval breast cancers in population mammography screening. NPJ Breast Cancer 2017, 3, 12 . [Google Scholar] [CrossRef]
  10. Gilbert, F.J.; Astley, S.M.; Gillan, M.G.; Agbaje, O.F.; Wallis, M.G.; James, J.; Boggis, C.R.; Duffy, S.W. Single Reading with Computer-Aided Detection for Screening Mammography. N. Engl. J. Med. 2008, 359, 1675–1684. [Google Scholar] [CrossRef]
  11. Giger, M.L.; Chan, H.-P.; Boone, J. Anniversary paper: History and status of CAD and quantitative image analysis: The role of Medical Physics and AAPM. Med. Phys. 2008, 35, 5799–5820. [Google Scholar] [CrossRef]
  12. Fenton, J.J.; Taplin, S.H.; Carney, P.A.; Abraham, L.; Sickles, E.A.; D’Orsi, C.; Berns, E.A.; Cutter, G.; Hendrick, R.E.; Barlow, W.E.; et al. Influence of Computer-Aided Detection on Performance of Screening Mammography. N. Engl. J. Med. 2007, 356, 1399–1409. [Google Scholar] [CrossRef]
  13. Kohli, A.; Jha, S. Why CAD Failed in Mammography. J. Am. Coll. Radiol. 2018, 15, 535–537. [Google Scholar] [CrossRef] [PubMed]
  14. Ganesan, K.; Acharya, U.R.; Chua, C.K.; Min, L.C.; Abraham, K.T.; Ng, K.-H. Computer-Aided Breast Cancer Detection Using Mammograms: A Review. IEEE Rev. Biomed. Eng. 2012, 6, 77–98. [Google Scholar] [CrossRef] [PubMed]
  15. Heath, M.; Bowyer, K.; Kopans, D.; Moore, R.; Kegelmeyer, W.P. The digital database for screening mammography. In Proceedings of the 5th International Workshop on Digital Mammography, Toronto, Canada, 1–14 June 2000; pp. 212–218. [Google Scholar]
  16. Khan, S.; Hussain, M.; Aboalsamh, H.; Bebis, G. A comparison of different Gabor feature extraction approaches for mass classification in mammography. Multimed. Tools Appl. 2015, 76, 33–57. [Google Scholar] [CrossRef] [Green Version]
  17. Narváez, F.; Alvarez, J.; Garcia-Arteaga, J.D.; Tarquino, J.; Romero, E. Characterizing Architectural Distortion in Mammograms by Linear Saliency. J. Med. Syst. 2016, 41, 26. [Google Scholar] [CrossRef] [PubMed]
  18. Wang, S.; Rao, R.V.; Chen, P.; Zhang, Y.; Liu, A.; Wei, L. Abnormal Breast Detection in Mammogram Images by Feed-forward Neural Network Trained by Jaya Algorithm. Fundam. Inform. 2017, 151, 191–211. [Google Scholar] [CrossRef]
  19. Nithya, R.; Santhi, B. Classification of Normal and Abnormal Patterns in Digital Mammograms for Diagnosis of Breast Cancer. Int. J. Comput. Appl. 2011, 28, 21–25. [Google Scholar] [CrossRef]
  20. Zhu, W.; Lou, Q.; Vang, Y.S.; Xie, X. Deep multi-instance networks with sparse label assignment for whole mammogram classification. In International Conference on Medical Image Computing and Computer-Assisted Intervention; Springer: Cham, Switzerland, 2017; pp. 603–611. [Google Scholar]
  21. Sampaio, W.B.; Diniz, E.M.; Silva, A.C.; de Paiva, A.C.; Gattass, M. Detection of masses in mammogram images using CNN, geostatistic functions and SVM. Comput. Biol. Med. 2011, 41, 653–664. [Google Scholar] [CrossRef]
  22. Lévy, D.; Jain, A. Breast mass classification from mammograms using deep convolutional neural networks. arXiv 2016, arXiv:1612.00542. [Google Scholar]
  23. Krizhevsky, A.; Sutskever, I.; Hinton, G.E. Imagenet classification with deep convolutional neural networks. NIPS 2012, 60, 84–90. [Google Scholar] [CrossRef]
  24. Szegedy, C.; Liu, W.; Jia, Y.; Sermanet, P.; Reed, S.; Anguelov, D.; Erhan, D.; Vanhoucke, V.; Rabinovich, A. Going deeper with convolutions. In Proceedings of the IEEE Conference on Computer Vision and Pattern Recognition, Boston, MA, USA, 7–12 June 2015; pp. 1–9. [Google Scholar]
  25. Guan, S.; Loew, M. Breast cancer detection using synthetic mammograms from generative adversarial networks in convolutional neural networks. J. Med. Imaging 2019, 6, 31411. [Google Scholar] [CrossRef]
  26. Xi, P.; Shu, C.; Goubran, R. Abnormality detection in mammography using deep convolutional neural networks. In Proceedings of the 2018 IEEE International Symposium on Medical Measurements and Applications (MeMeA), Rome, Italy, 11–13 June 2018; pp. 1–6. [Google Scholar]
  27. Simonyan, K.; Zisserman, A. Very deep convolutional networks for large-scale image recognition. arXiv 2014, arXiv:1409.1556. [Google Scholar]
  28. He, K.; Zhang, X.; Ren, S.; Sun, J. Deep residual learning for image recognition. In Proceedings of the IEEE Conference on Computer Vision and Pattern Recognition, Las Vegas, NV, USA, 27–30 June 2016; pp. 770–778. [Google Scholar]
  29. Ragab, D.A.; Sharkas, M.; Marshall, S.; Ren, J. Breast cancer detection using deep convolutional neural networks and support vector machines. PeerJ 2019, 7, e6201. [Google Scholar] [CrossRef] [PubMed]
  30. Shen, L.; Margolies, L.R.; Rothstein, J.H.; Fluder, E.; McBride, R.; Sieh, W. Deep Learning to Improve Breast Cancer Detection on Screening Mammography. Sci. Rep. 2019, 9, 12495. [Google Scholar] [CrossRef] [PubMed]
  31. McKinney, S.M.; Sieniek, M.; Godbole, V.; Godwin, J.; Antropova, N.; Ashrafian, H.; Back, T.; Chesus, M.; Corrado, G.S.; Darzi, A.; et al. International evaluation of an AI system for breast cancer screening. Nature 2020, 577, 89–94. [Google Scholar] [CrossRef]
  32. Hussain, Z.; Gimenez, F.; Yi, D.; Rubin, D. Differential Data Augmentation Techniques for Medical Imaging Classification Tasks. In AMIA Annual Symposium Proceedings; American Medical Informatics Association: Bethesda, MD, USA, 2018; Volume 2017, pp. 979–984. [Google Scholar]
  33. Costa, A.C.; Oliveira, H.C.R.; Catani, J.H.; de Barros, N.; Melo, C.F.E.; Vieira, M.A.C. Data augmentation for detection of architectural distortion in digital mammography using deep learning approach. arXiv 2018, arXiv:1807.03167. [Google Scholar]
  34. Elmore, J.G.; Armstrong, K.; Lehman, C.D.; Fletcher, S.W. Screening for Breast Cancer. JAMA J. Am. Med. Assoc. 2005, 293, 1245–1256. [Google Scholar] [CrossRef]
  35. Friedewald, S.M.; Rafferty, E.A.; Rose, S.L.; Durand, M.A.; Plecha, D.M.; Greenberg, J.S.; Hayes, M.K.; Copit, D.S.; Carlson, K.L.; Cink, T.M.; et al. Breast Cancer Screening Using Tomosynthesis in Combination With Digital Mammography. JAMA J. Am. Med. Assoc. 2014, 311, 2499–2507. [Google Scholar] [CrossRef] [Green Version]
  36. Guan, S.; Loew, M. Breast Cancer Detection Using Transfer Learning in Convolutional Neural Networks. In Proceedings of the 2017 IEEE Applied Imagery Pattern Recognition Workshop (AIPR), Washington, DC, USA, 10–12 October 2017; pp. 1–8. [Google Scholar] [CrossRef]
  37. Heath, M.; Bowyer, K.; Kopans, D.; Kegelmeyer, P.; Moore, R.; Chang, K.; Munishkumaran, S. Current Status of the Digital Database for Screening Mammography. In Digital Mammography; Springer: Berlin/Heidelberg, Germany, 1998; pp. 457–460. [Google Scholar] [CrossRef]
  38. Lee, R.S.; Gimenez, F.; Hoogi, A.; Miyake, K.K.; Gorovoy, M.; Rubin, D.L. A curated mammography data set for use in computer-aided detection and diagnosis research. Sci. Data 2017, 4, 170177. [Google Scholar] [CrossRef]
  39. Suckling, J. The Mammographic Image Analysis Society Digital Mammogram Database. Digit. Mammo 1994, 1069, 375–378. [Google Scholar]
  40. Howard, A.G.; Zhu, M.; Chen, B.; Kalenichenko, D.; Wang, W.; Weyand, T.; Andreetto, M.; Adam, H. Mobilenets: Efficient convolutional neural networks for mobile vision applications. arXiv 2017, arXiv:1704.04861. [Google Scholar]
  41. Khan, A.; Sohail, A.; Zahoora, U.; Qureshi, A.S. A survey of the recent architectures of deep convolutional neural networks. Artif. Intell. Rev. 2020, 53, 5455–5516. [Google Scholar] [CrossRef] [Green Version]
  42. Khan, A.I.; Shah, J.L.; Bhat, M.M. CoroNet: A deep neural network for detection and diagnosis of COVID-19 from chest x-ray images. Comput. Methods Programs Biomed. 2020, 196, 105581. [Google Scholar] [CrossRef] [PubMed]
  43. Chollet, F. Xception: Deep learning with depthwise separable convolutions. In Proceedings of the IEEE Conference on Computer Vision and Pattern Recognition, Honolulu, HI, USA, 21–26 July 2017; pp. 1251–1258. [Google Scholar]
Figure 1. Distributing the Cases and Deaths of the 10 Prevalent Cancers in 2020 for Both Sexes [3].
Applsci 12 07080 g001
Figure 2. Mammography in CC and MLO views, respectively.
Applsci 12 07080 g002
Figure 3. The architecture of VGG16 and ResNet50.
Applsci 12 07080 g003
Figure 4. VGG16 Feature Extraction.
Applsci 12 07080 g004
Figure 5. ResNet50 Feature Extraction.
Applsci 12 07080 g005
Figure 6. MobileNet Feature Extraction.
Applsci 12 07080 g006
Figure 7. CoroNet Feature Extraction.
Applsci 12 07080 g007
Table 1. New cases and deaths for 10 cancer types in 2020.
Location of CancerNumber of New Cases (% of All Locations)Number of New Deaths (% of All Locations)
Brain, nervous system(1.6)308,102(2.5)251,329
Colon(6.0)1,148,515(5.8)576,858
Female breast(11.7)2,261,419(6.9)684,996
Leukemia(2.5)474,519(3.1)311,594
Liver(4.7)905,677(8.3)830,180
Lung(11.4)2,206,771(18.0)1,796,144
Nonmelanoma of skin(6.2)1,198,073(0.6)63,731
Ovary(1.6)313.959(2.1)207.252
Prostate(7.3)1,414,259(3.8)375,304
Stomach(5.6)1,089,103(7.7)768,793
Table 2. Mammography datasets for breast cancer [1,37,38].
DatasetType# of ImagesViewFormatClassesResolution (Bit/Pixel)Availability
DDSM [37]Digital Mammogram
(DM)
10,480MLO/CCLJPEGNormal, benign and malignant8–16Publicly available
CIBS-DDSM [38]Digital Mammogram
(DM)
10,239MLO/CCDICOMBenign and malignant10Publicly available
Table 3. Distribution of data.
TypeNormalAbnormalTotal
BenignMalignancy
Train11906887192597
Test1286464256
Total13187527832853
Table 4. Summary of the architectures of CNN.
ModelMain FindingDepthDatasetError RateInput SizeYear
AlexNetUtilizes Dropout and ReLU8ImageNet16.4227 × 227 × 32012
VGGIncreased depth, small filter size16, 19ImageNet7.3224 × 224 × 32014
ResNetRobust against overfitting because of symmetry mapping-based skip links50,152ImageNet3.57224 × 224 × 32016
XceptionA depthwise convolution followed by a pointwise convolution71ImageNet0.055229 × 229 × 32017
MobileNet-v2Inverted residual structure53ImageNet-224 × 224 × 32018
Table 5. CoroNet Architecture Details.
Layer (Type)Output ShapeNo of Parameters
Xception (Model)5 × 5 × 204820,861,480
flatten (Flatten)51,2000
dropout (Dropout)51,2000
dense (Dense)25613,107,456
dense_1 (Dense)41028
Total parameters: 33,969,964
Trainable parameters:33,915,436
Non-trainable parameters: 54,528
Table 6. Training performance of the CNN models in the present paper.
ModelsEpoch StopValidation AccuracyTraining AccuracyValidation LossTesting Loss
VGG 161386.5468.900.28860.4320
CoroNet8494.7399.730.60790.0069
MobileNet2968.4170.240.57590.6054
ResNet501272.1574.400.54570.5948
Publisher’s Note: MDPI stays neutral with regard to jurisdictional claims in published maps and institutional affiliations.

