
Infill Microstructures for Additive Manufacturing


1
Department of Mechanical Engineering, Hellenic Mediterranean University, 71401 Heraklion, Greece
2
School of Production Engineering and Management, Technical University of Crete, 73100 Chania, Greece
*
Author to whom correspondence should be addressed.
Appl. Sci. 2022, 12(15), 7386; https://doi.org/10.3390/app12157386
Submission received: 15 March 2022
/
Revised: 14 July 2022
/
Accepted: 15 July 2022
/
Published: 22 July 2022
(This article belongs to the Special Issue Additive Manufacturing: Topology Optimization and Cellular Microstructures)
Abstract
:Additive Manufacturing (AM) is a well-known and rapidly advancing method, especially in the manufacturing of high-strength and lightweight microstructures. Utilizing AM, it is possible to fabricate any structure as complicated as it is. For an efficient and cost-effective printing, a critical parameter is the infill, which can be characterized from an easy 2D shape to high complexity. At the same time, Topology Optimization (TO) is an appropriate method to create high-strength and mass optimized microstructure lattices. In the current study, TO starts from a solid cubic volume of 15 × 15 mm, and different boundary conditions of two new cellular microstructures designed with 0.4 and 0.1 relative density are applied, respectively. The adopted TO method was Solid Isotropic Material with Penalization (SIMP), which predicts an optimal material distribution within a given design domain. TO methods do not check other characteristics of the structure, such as anisotropy. To evaluate and characterize the optimized microstructure, a general purpose homogenization method is utilized to calculate the Zener ratio and the elastic modulus. Using Fused Filament Fabrication (FFF), which is a material extrusion 3D printing method, lattice structure samples are fabricated and then tested in compression and tensile strength tests. The comparative results from the homogenization study showed that both microstructures have anisotropic behavior and an accepted response in the stress test similar to the homogenized material. The experimental results show that the mechanical behavior of the lattice structure changes significantly when the cell mapping angle differs.
1. Introduction
Designers are able to create complex topologies and shapes, thanks to the design freedom provided by Additive Manufacturing (AM) [1,2,3,4]. In our days, the design manufacturing procedures have been expanded to conventional manufacturing processes, although Design for Additive Manufacturing (DfAM) methods have to be further elaborated [5,6,7,8]. Many of these methods help us to use the properties that are enabled by AM. Such methodologies are: Topology Optimization (TO), the AM manufacturability analysis, and cellular structures. Cellular structures are observed in nature: in plant stems or in bamboo microstructures [9,10,11]. These structures present an incline and can proceed toward better material distribution for a performance optimization. In relation to artificially designed cellular structures, the features presented are upper level, making them suitable for processes such as energy absorption or heat transfer.
AM stands out for its ability to reduce the necessary manufacturing material when producing a part and the weight of the part itself, thanks to its nature [12,13,14]. AM can manufacture lightweight parts characterized by a sparse internal infill and an external skin. In regards to the fabrication process, the type of the infill is a crucial parameter, with the most reliable and fast printing infills those that are made by printing the same pattern for every layer. These are the 2D infills, and they are characterized by a vertical cross-section, which creates a geometry fertile to anisotropic structural properties [15].
Another type of infills, that present an isotropic behavior, are the 3D infills. In particular, the infills that have a cubical symmetry are called “cubic infills”, and they repeat in all three directions. Another type of strong and fast printing 3D infill is the mathematically based “gyroid infill”, which can simplify the designing process. The disadvantage that comes along with 3D infills is that they are not easy to be printed and show a high complexity [16,17].
The final type of infills are those that cannot be characterized either as 2D infills or as 3D infills. Due to process optimization, they have a non-periodical nature, which allows them to be rich in forms. They may have internal structures containing voids, using graded infills or internal structures with repeating optimized lattice structures. These can show differing spatial properties or particular elastic properties. In an effort to stimulate the general orthotopic properties, Poisson’s ratio and elastic moduli tuning, many researchers have used Topology Optimization [18,19,20].
Topology Optimization is the mathematical method that can optimize the material distribution within a specific design area. Its purpose is the system performance maximization for a given set of loads. There are several TO implementations like Solid Isotropic Material with Penalization (SIMP), level set and BESO. TO is a technique via which we can remove from the structure the ineffectual material and add at the same time the proper material to the structure [21,22,23]. Furthermore, the MMC and the homogenization methods are used in order to produce a quickly infilling gradient microstructure [24]. The most famous method is the SIMP algorithm that calculates the element’s relative density distribution in the design space [25]. Some of the topologies are limited in AM and the truss-like cellular structures in the functionally graded modeling method. There are only a few isotropic cellular structures when the established TO methods are calculated for isotropic materials. Topology Optimization and Additive Manufacturing are coupled in an efficient manner and can make the most of their potential, in order to allow for wide application prospects in modern manufacturing [26].
2. Materials and Methods
In this paper, a modern approach is presented, where a general homogenization method is being used to examine the behavior of two lattice structures that are created from the SIMP method. The proposed lattices are going to be used as the infill structure within the Additive Manufacturing techniques. In order to characterize the new lattices, the elastic moduli and the Zener ratio have been calculated. Using material extrusion, 3D printing method lattice structure samples are fabricated and then tested on compressive and tensile strength. Due to the fact that the methodology is straightforward, it could be adapted in other similar behavioral predictions for different infill types.
The selected TO method (SIMP) and other general algorithms predict with an accurate manner the optimal material distribution within a given design domain. However, the isotropy of the optimized microstructure is not considered from the classical Topology Optimization algorithms. In the current study, the homogenization of the Topology Optimized structures is selected, such as an appropriate additional postprocessing step after TO. The evaluation of the homogenized microstructures follows with the execution of the Finite Element Analysis (FEA) on a coarser mesh with the calculated homogenized properties.
The purpose of this manuscript is the creation of new lattice structures as infill geometry for Additive Manufacturing. The proposed methodology is illustrated in Figure 1. Initially, two TO studies are carried out with different penalty factors and design constraints. In the next stage, a homogenization study is executed. While performing the procedure, the behavior of the homogenized structure in a given volume is studied. After-wards, the anisotropy of the structures is checked with the calculation of the Zener ratio. Acrylonitrile Butadiene Styrene (ABS) samples created by the use of the FFF printing technique and tested in the compression and tensile strength tests.
2.1. Theoretical Background
Topology Optimization has its roots in the study of Michel trusses and the usage of a ground structure approach, where a dense truss simulates the continuum, and in the course of some structural optimization process regarding the cross-sections of the bars, unloaded elements are eliminated and the optimal topology arises. TO can solve the problem of finding the proper distribution for a limited amount of materials within a specified domain. In current study, the SIMP algorithm is utilized. In total, two TO studies were carried out, and an equal number of structures emerged.
The history of SIMP takes us back to the 1980s when Bendsoe first conceived the idea of parameterizing the design domain and not proceeding to the solution of an on–off problem, the TO. It was until the 1990s that this method was highlighted. The SIMP method is able to maintain a fixed FE mesh and associate each of the Finite Elements with a density function ρ(x) whose values range from 0 (void) to 1 (solid). As presented by Rozvany et al., an artificial material that can also be conceived as a mesostructure material with holes can be created by the intermediate values. The last design solution has as its feature black regions (indicating solid regions), white regions (indicating voids) and grey regions (indicating intermediate densities). In order to subdue the grey areas and to eliminate, because of their impracticality in fabricating with traditional manufacturing methods, the intermediate densities from the last design solution, a lot of techniques emerged [27,28,29,30]. According to the SIMP method, the formula for the stiffness matrix of the optimized structure is:
where:
- is the elements stiffness matrix;
- is the minimum penalty factor;
- N is the number of total elements in the design domain.
During the TO study, a main goal is to maximize the stiffness of a structure or minimize its compliance with a given amount of the total mass, which is usually defined as a percentage of the available design area. The total compliance is equal to the cumulative deformation energy of the elements. Minimizing the total compliance, C, is equivalent to maximizing the overall stiffness. The optimization algorithm, through an iterative process, seeks to solve the element densities that minimize the overall compliance of the structure. The mathematical formula to calculate the C is:
where:
- (Ue) is the displacement vector of element e;
- (Ke) is the stiffness of element e;
- the vector {ρ} consists of the relative density of the ρe elements.
The behavior of a lattice structure can be described using the generalized Hooke’s law: . The anisotropic form of Hooke’s law can be expressed by the stiffness matric [c]:
The Zener ratio is a dimensionless number that is used to quantify the anisotropy for cubic structures [31]. Conceptually, it quantifies how far a material is from being isotropic (where the value of 1 means an isotropic material). The calculation of the Zener ratio is derived from the mathematical formula:
2.2. Homogenization
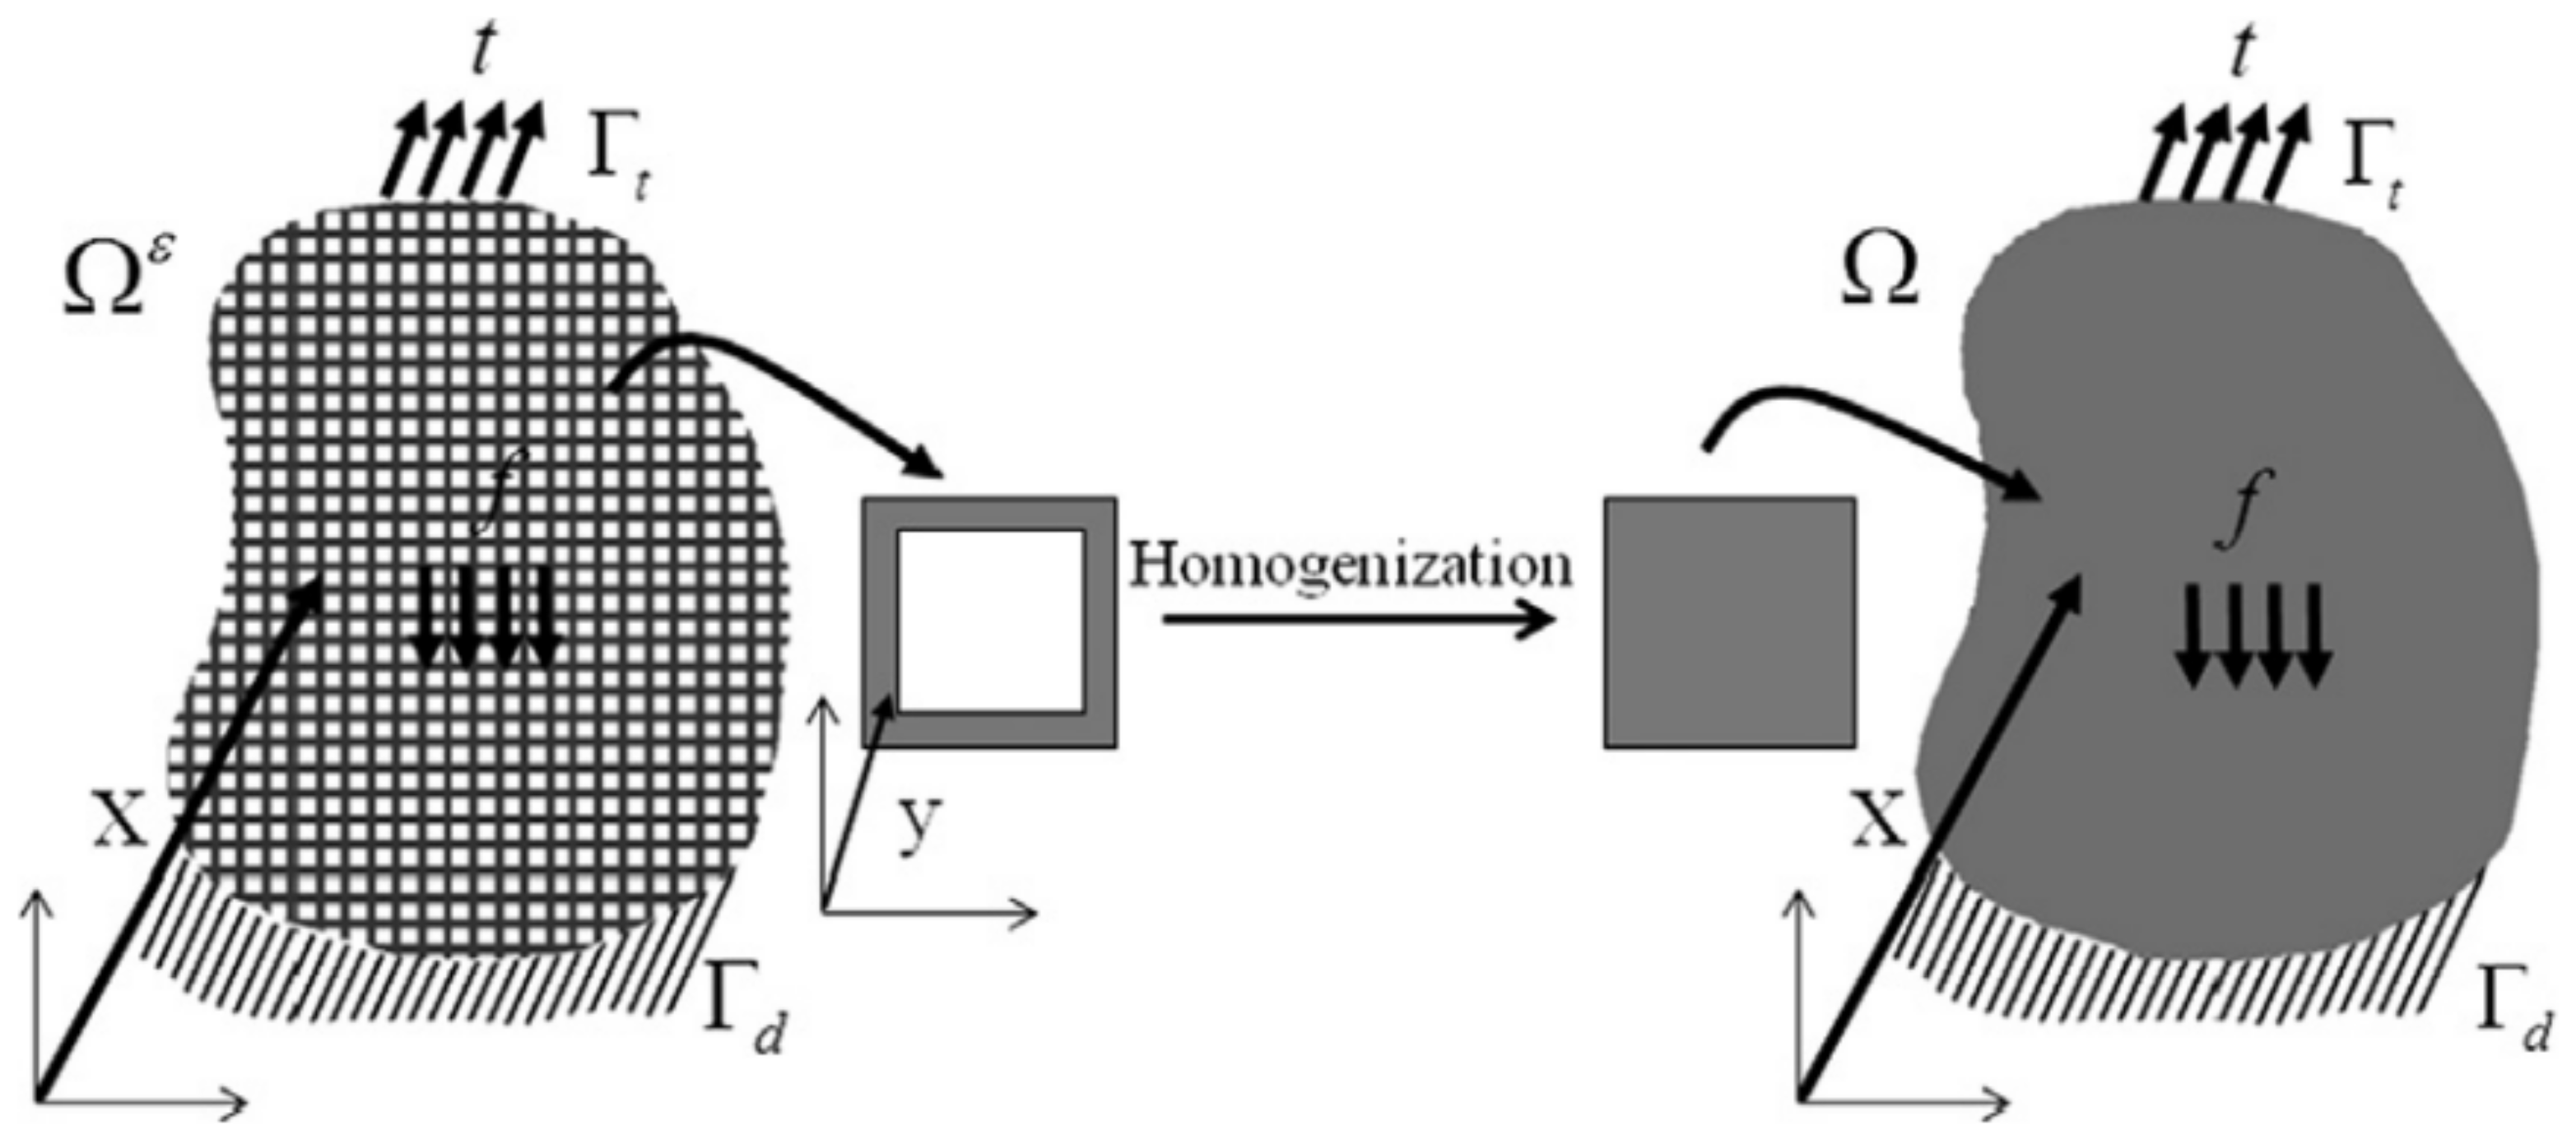
A microscale study is necessary to understand the behavior of the new proposed structures on the global scale. Plenty of studies have been developed to specify the behavior of cellular and heterogeneous structures [32,33,34]. Often, cellular materials are characterized by a high design complexity, which limits the manufacturability process. Additive manufacturing overcomes these issues, and lattice structures can be fabricated precisely and with lower production costs [35]. The keystone of the homogenization is the properties of a heterogenous material to be represented in a small fraction of that. Represented Volume Element (RVE) is defined as the limited fraction of the whole heterogenous material. Then, the characteristics of the heterogonous material are applied as the boundary conditions in the whole design volume [32]. For a square unit cell, the RVE method is applied as in Figure 2.
For the evaluation of the homogenized structures, new FE analyses are executed. The mechanical behavior of the homogenized structures has been checked on a cantilever model.
3. Design of Topologically Optimized Lattice Structures
The design process began from a cube with dimensions 15 × 15 × 15 mm; the topology optimization block of nTopology was used to carry out the TO studies. The boundary conditions involve a constraint restraint applied to the bottom face of the cube, with an exclusion of all degrees of freedom. The initial cube has been assigned with an isotropic elastic material (Table 1). During the meshing process, a solid mesh model consisting of 25,781 tetrahedral elements with an average edge length of 1 mm is created. The satisfaction of the objective function is achieved with the minimization of the material within the specified design domain. The fulfillment of the volume fraction restraint plays a decisive role in the configuration of the optimized model. The value, which is required for the volume fraction restraint, may range from 0 to 1, while the optimized volume will have a volume fraction equal to or less than the required value. The creation of different structures results from the various ways of imposing the loads, which, in both studies, are 300 N. In the first study, the load case is applied in plane to all model vertices. On the contrary, in the second study, the loads are applied in plane but only on the vertices of the top cube surface.
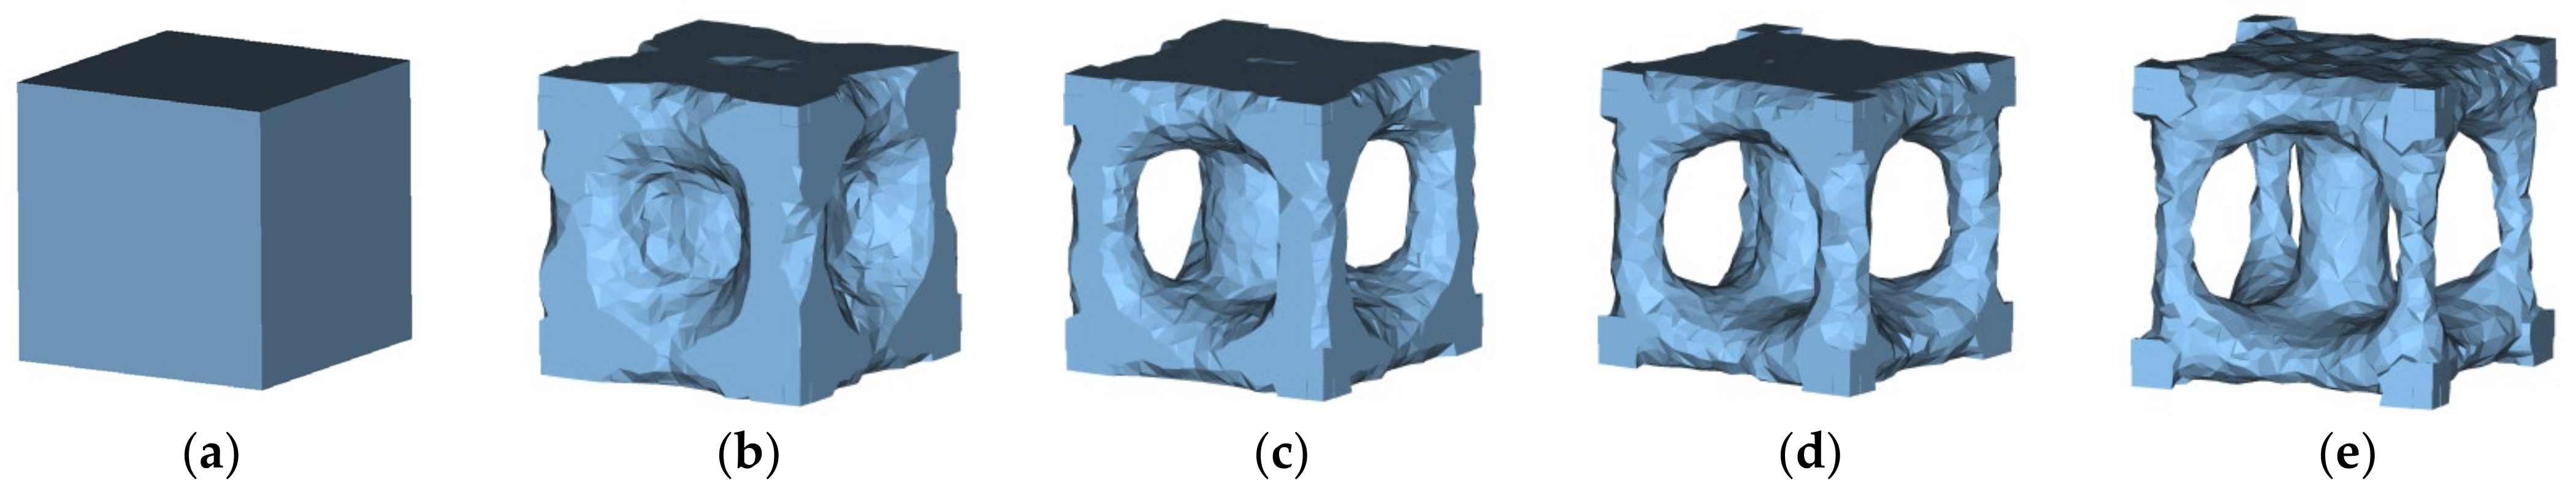
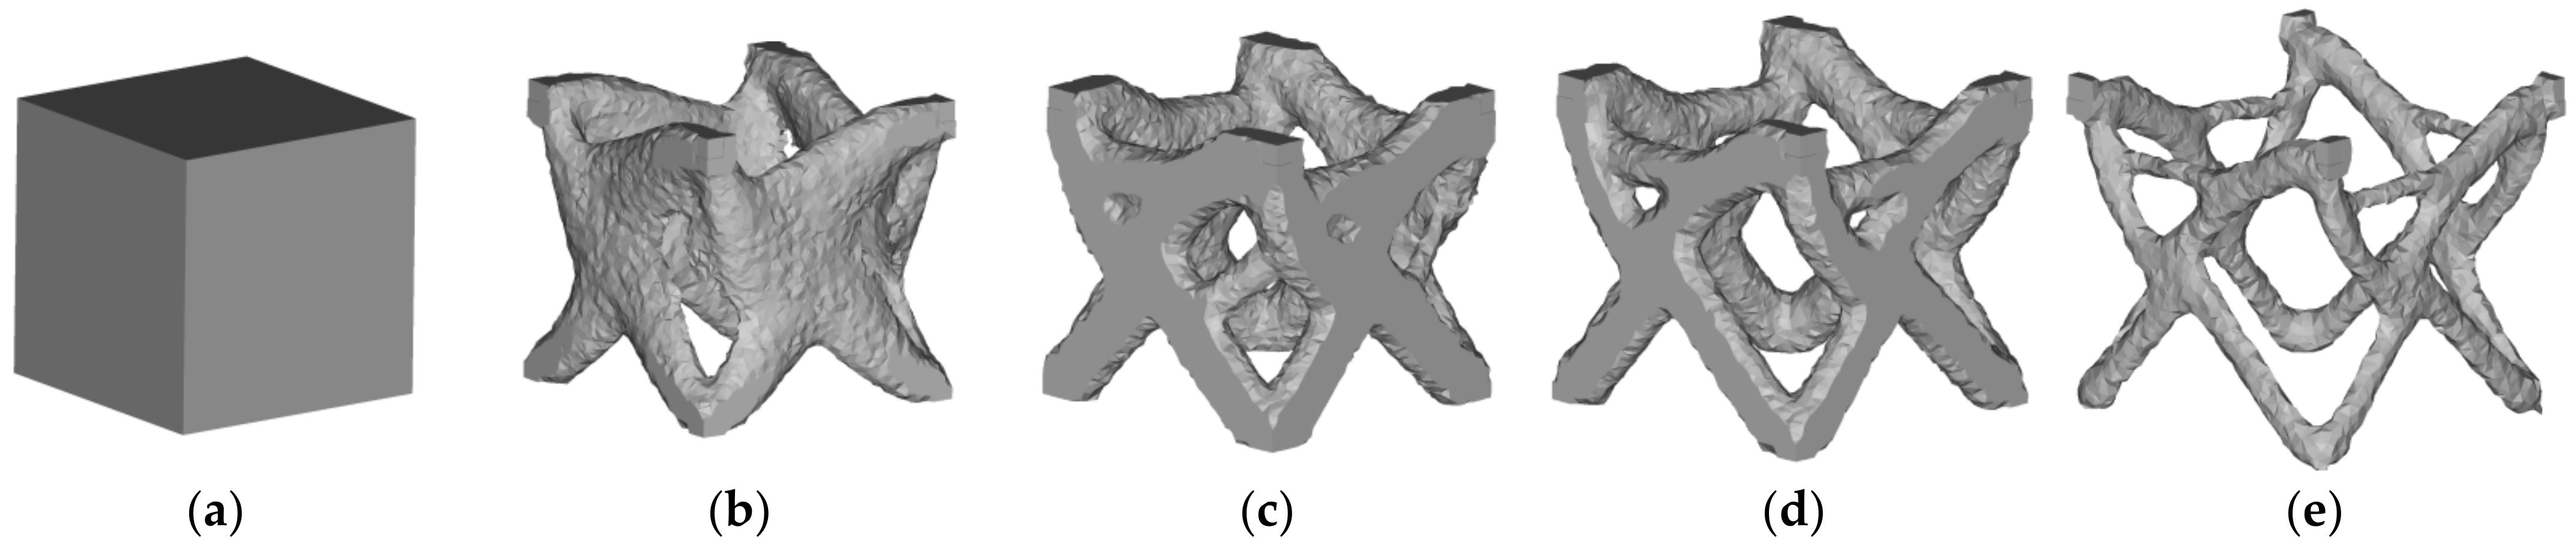
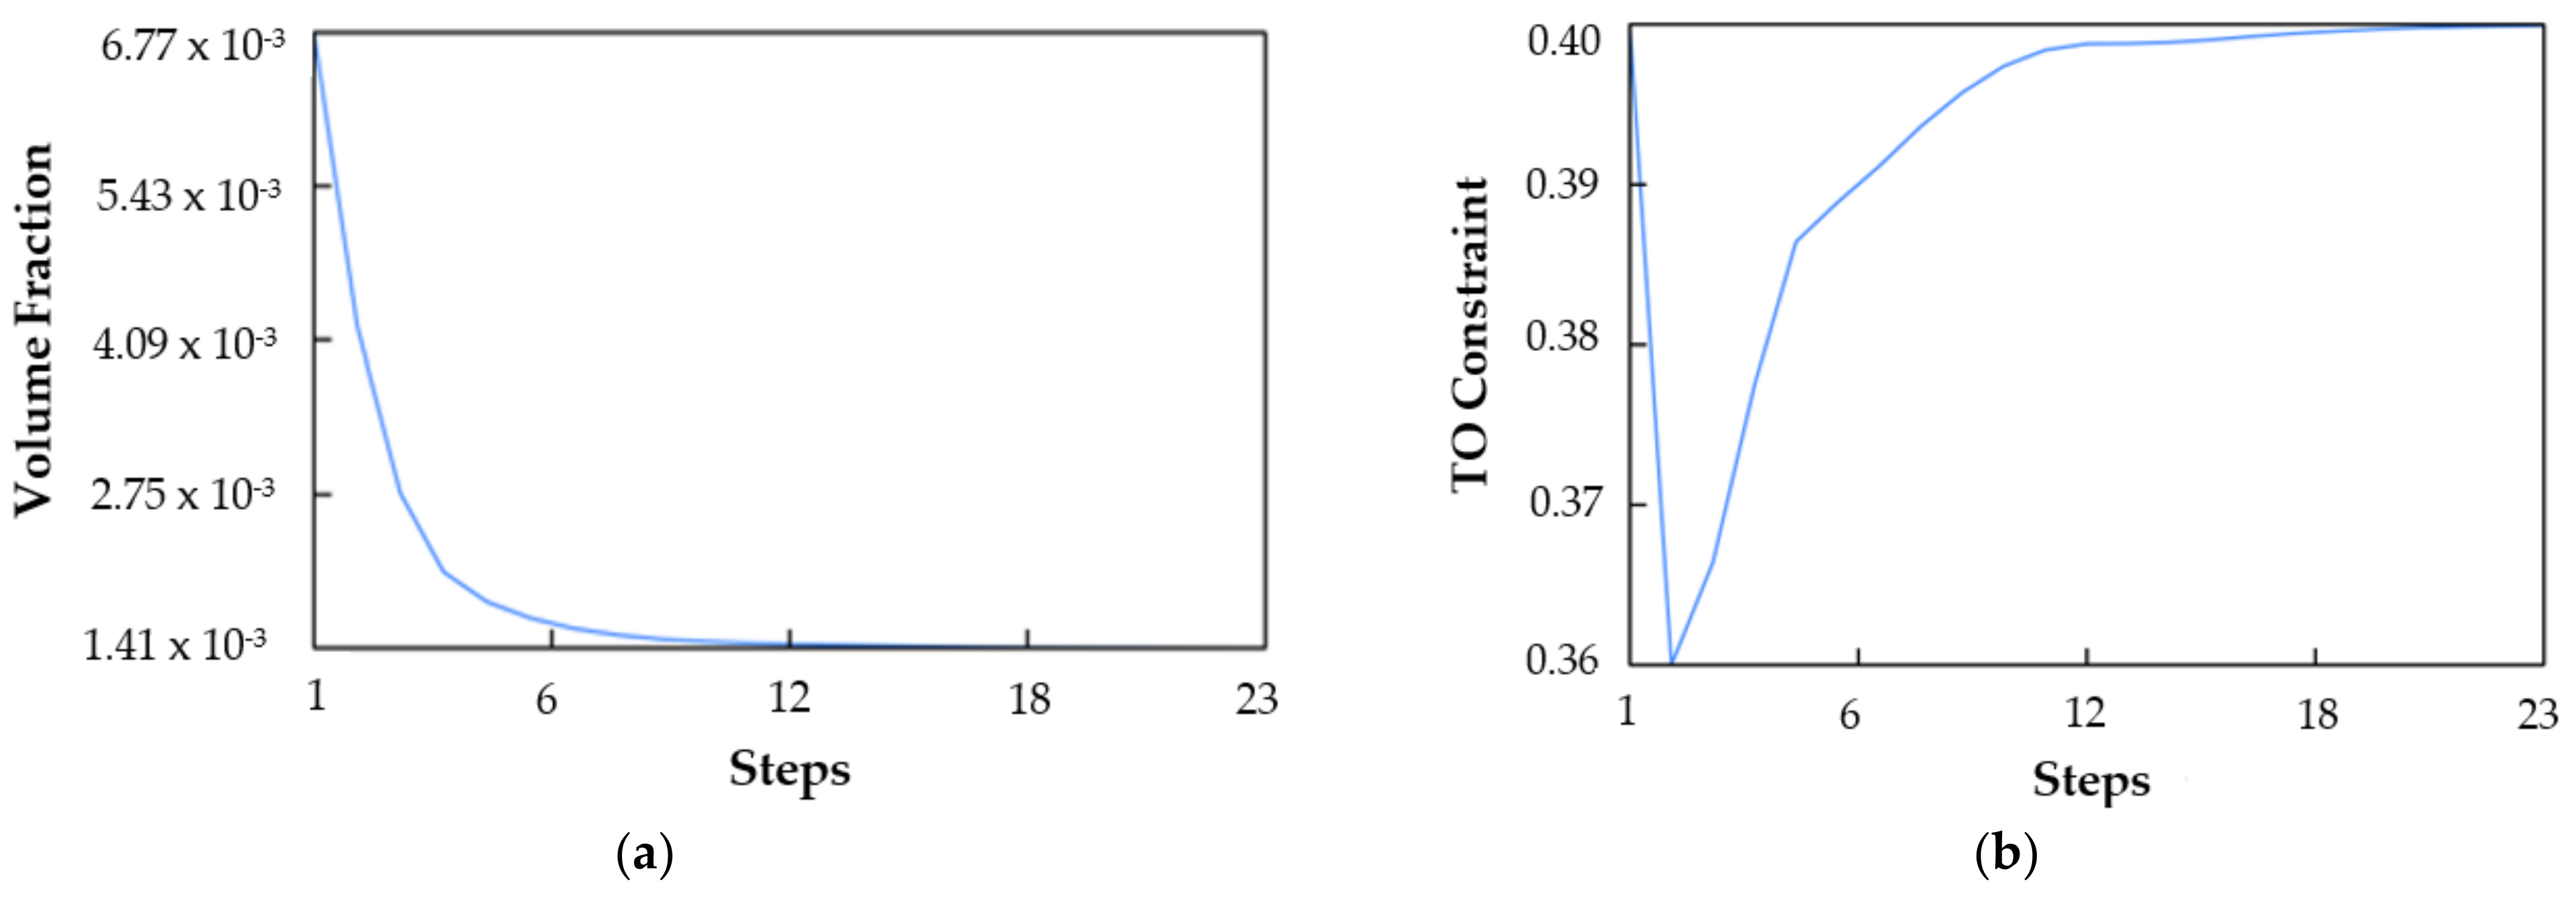
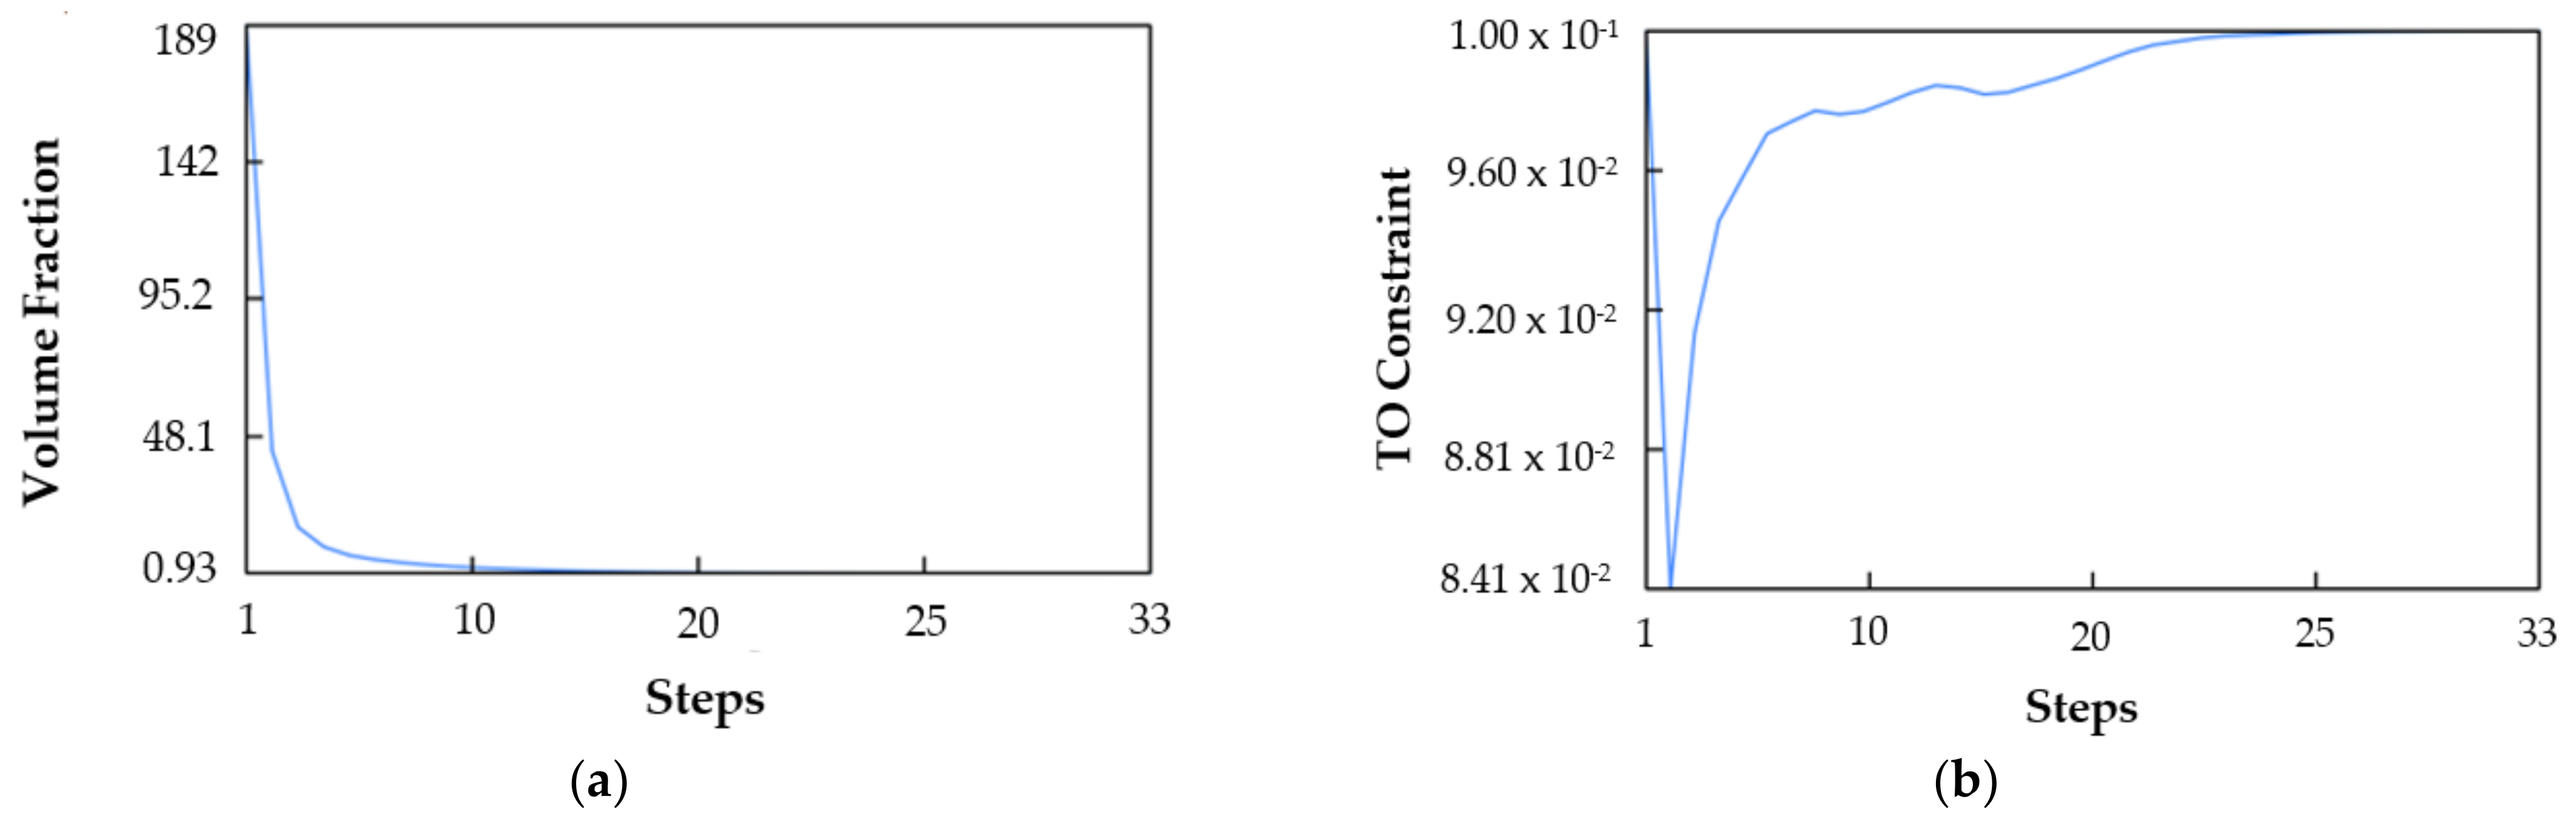
Two topologically optimized structures have been created, ‘structure #1’ and ‘structure #2’. The first structure is performed after twenty-three iterations; the final and intermediate shapes of TO study appear in Figure 3. Respectively, Figure 4 shows the progressive shape of the second structure in different iterations, the algorithm terminated after thirty-three iterations. In both studies, the volume fraction decreased sharply in the first 10 steps until asymptotically approaching the minimum (Figure 5a and Figure 6a).
After the evaluation, the target value of the volume fraction constraint for ‘structure #1’ is 0.4 and, for ‘structure #2’, is 0.1 (Figure 5b and Figure 6b). Topology Optimization is correlated with the material distribution in a specific domain in order to design constraints to be satisfied. In essence, a more rigid and stiff structure combined with material minimization is sought. Therefore, the problem goal is to minimize its compliance in order to increase the stiffness of the optimal structures.
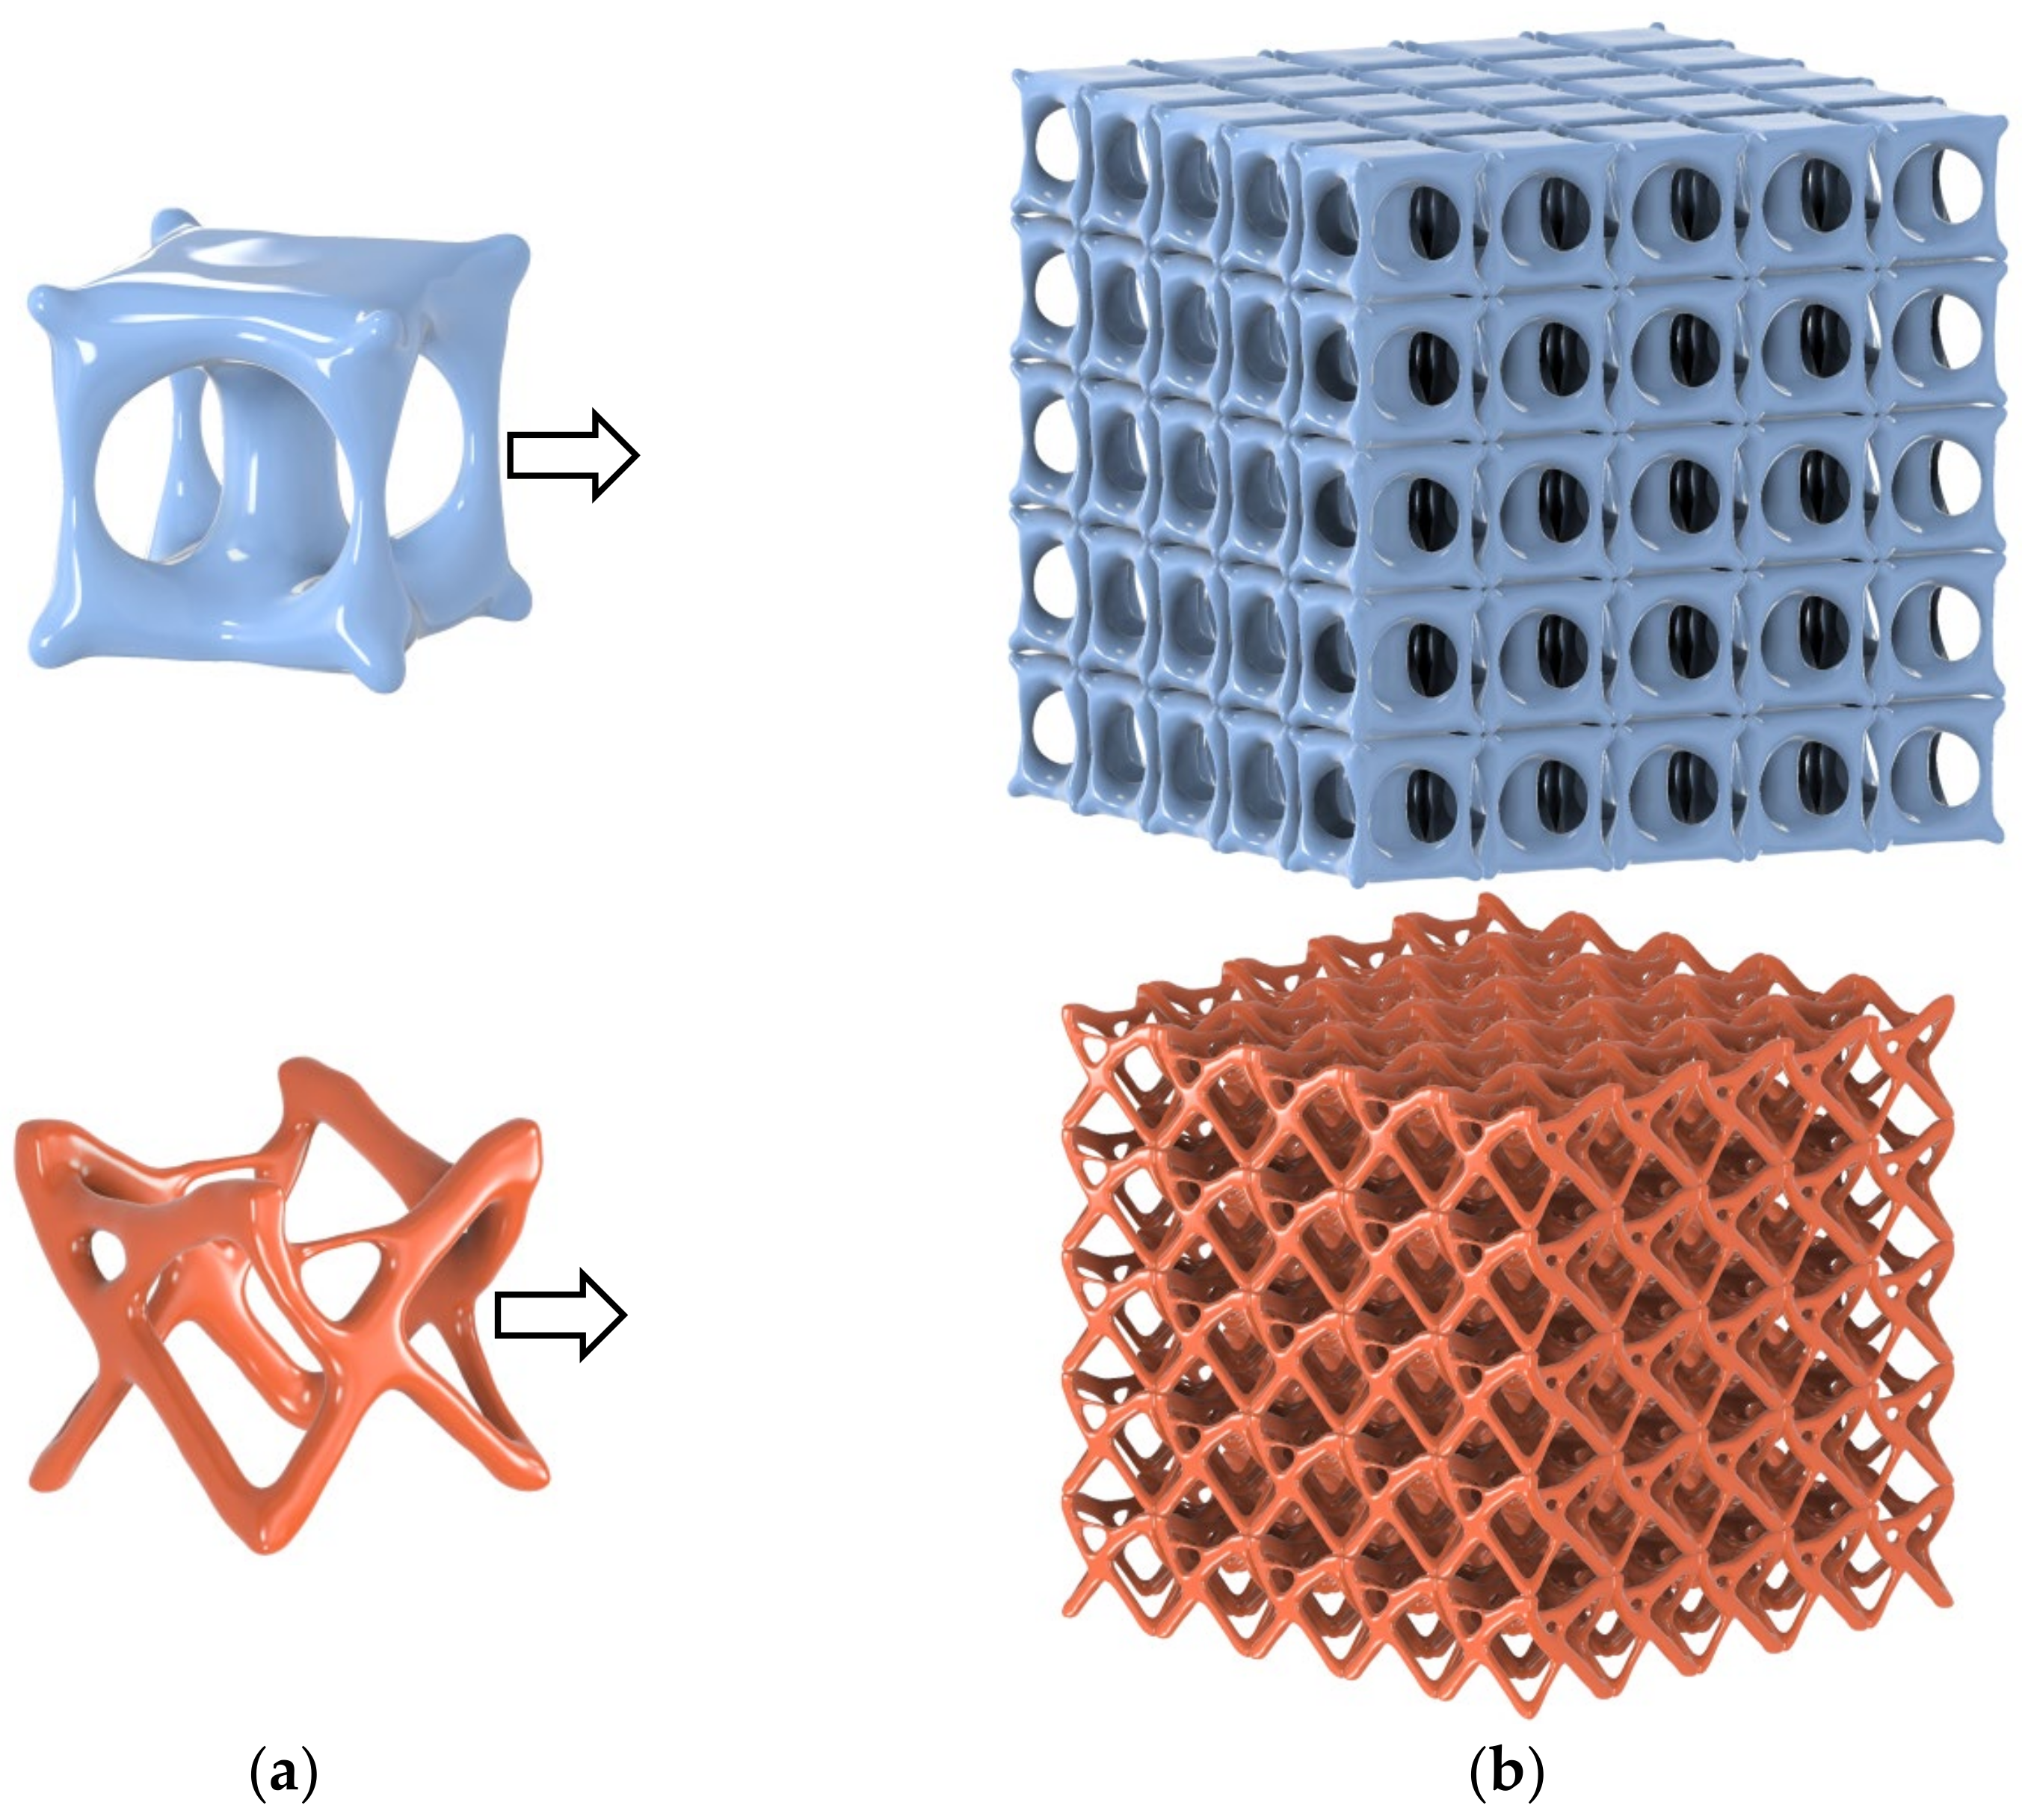
The optimized structures are refined and reconstructed in a specific design volume. After this process, two new custom unit cell lattices are created (Figure 7a). From these lattice cells, new lattice structures are designed (Figure 7b).
After evaluating the Topology Optimization results, the stage of creating the cell by utilizing the optimized structures took place. The homogenized cells were created in a design volume with dimensions 15 × 15 × 15 mm. In order to execute the homogenization study, two solid mesh models were created, with an edge length of 0.7 mm and 75,489, as well as 62,595 tetrahedral elements, respectively. As a result of using the homogenization unit cell block of nTopology software, new homogenized structures are emerging and can now be utilized as materials that will be evaluated by performing a structural static analysis.
4. Lattice Structures Fabrication
For both lattice structures, specimens without supports have been fabricated. The specimens of the proposed lattice structures were manufactured by the FFF printing process using a Zortrax m200 dual fusion 3D printer.
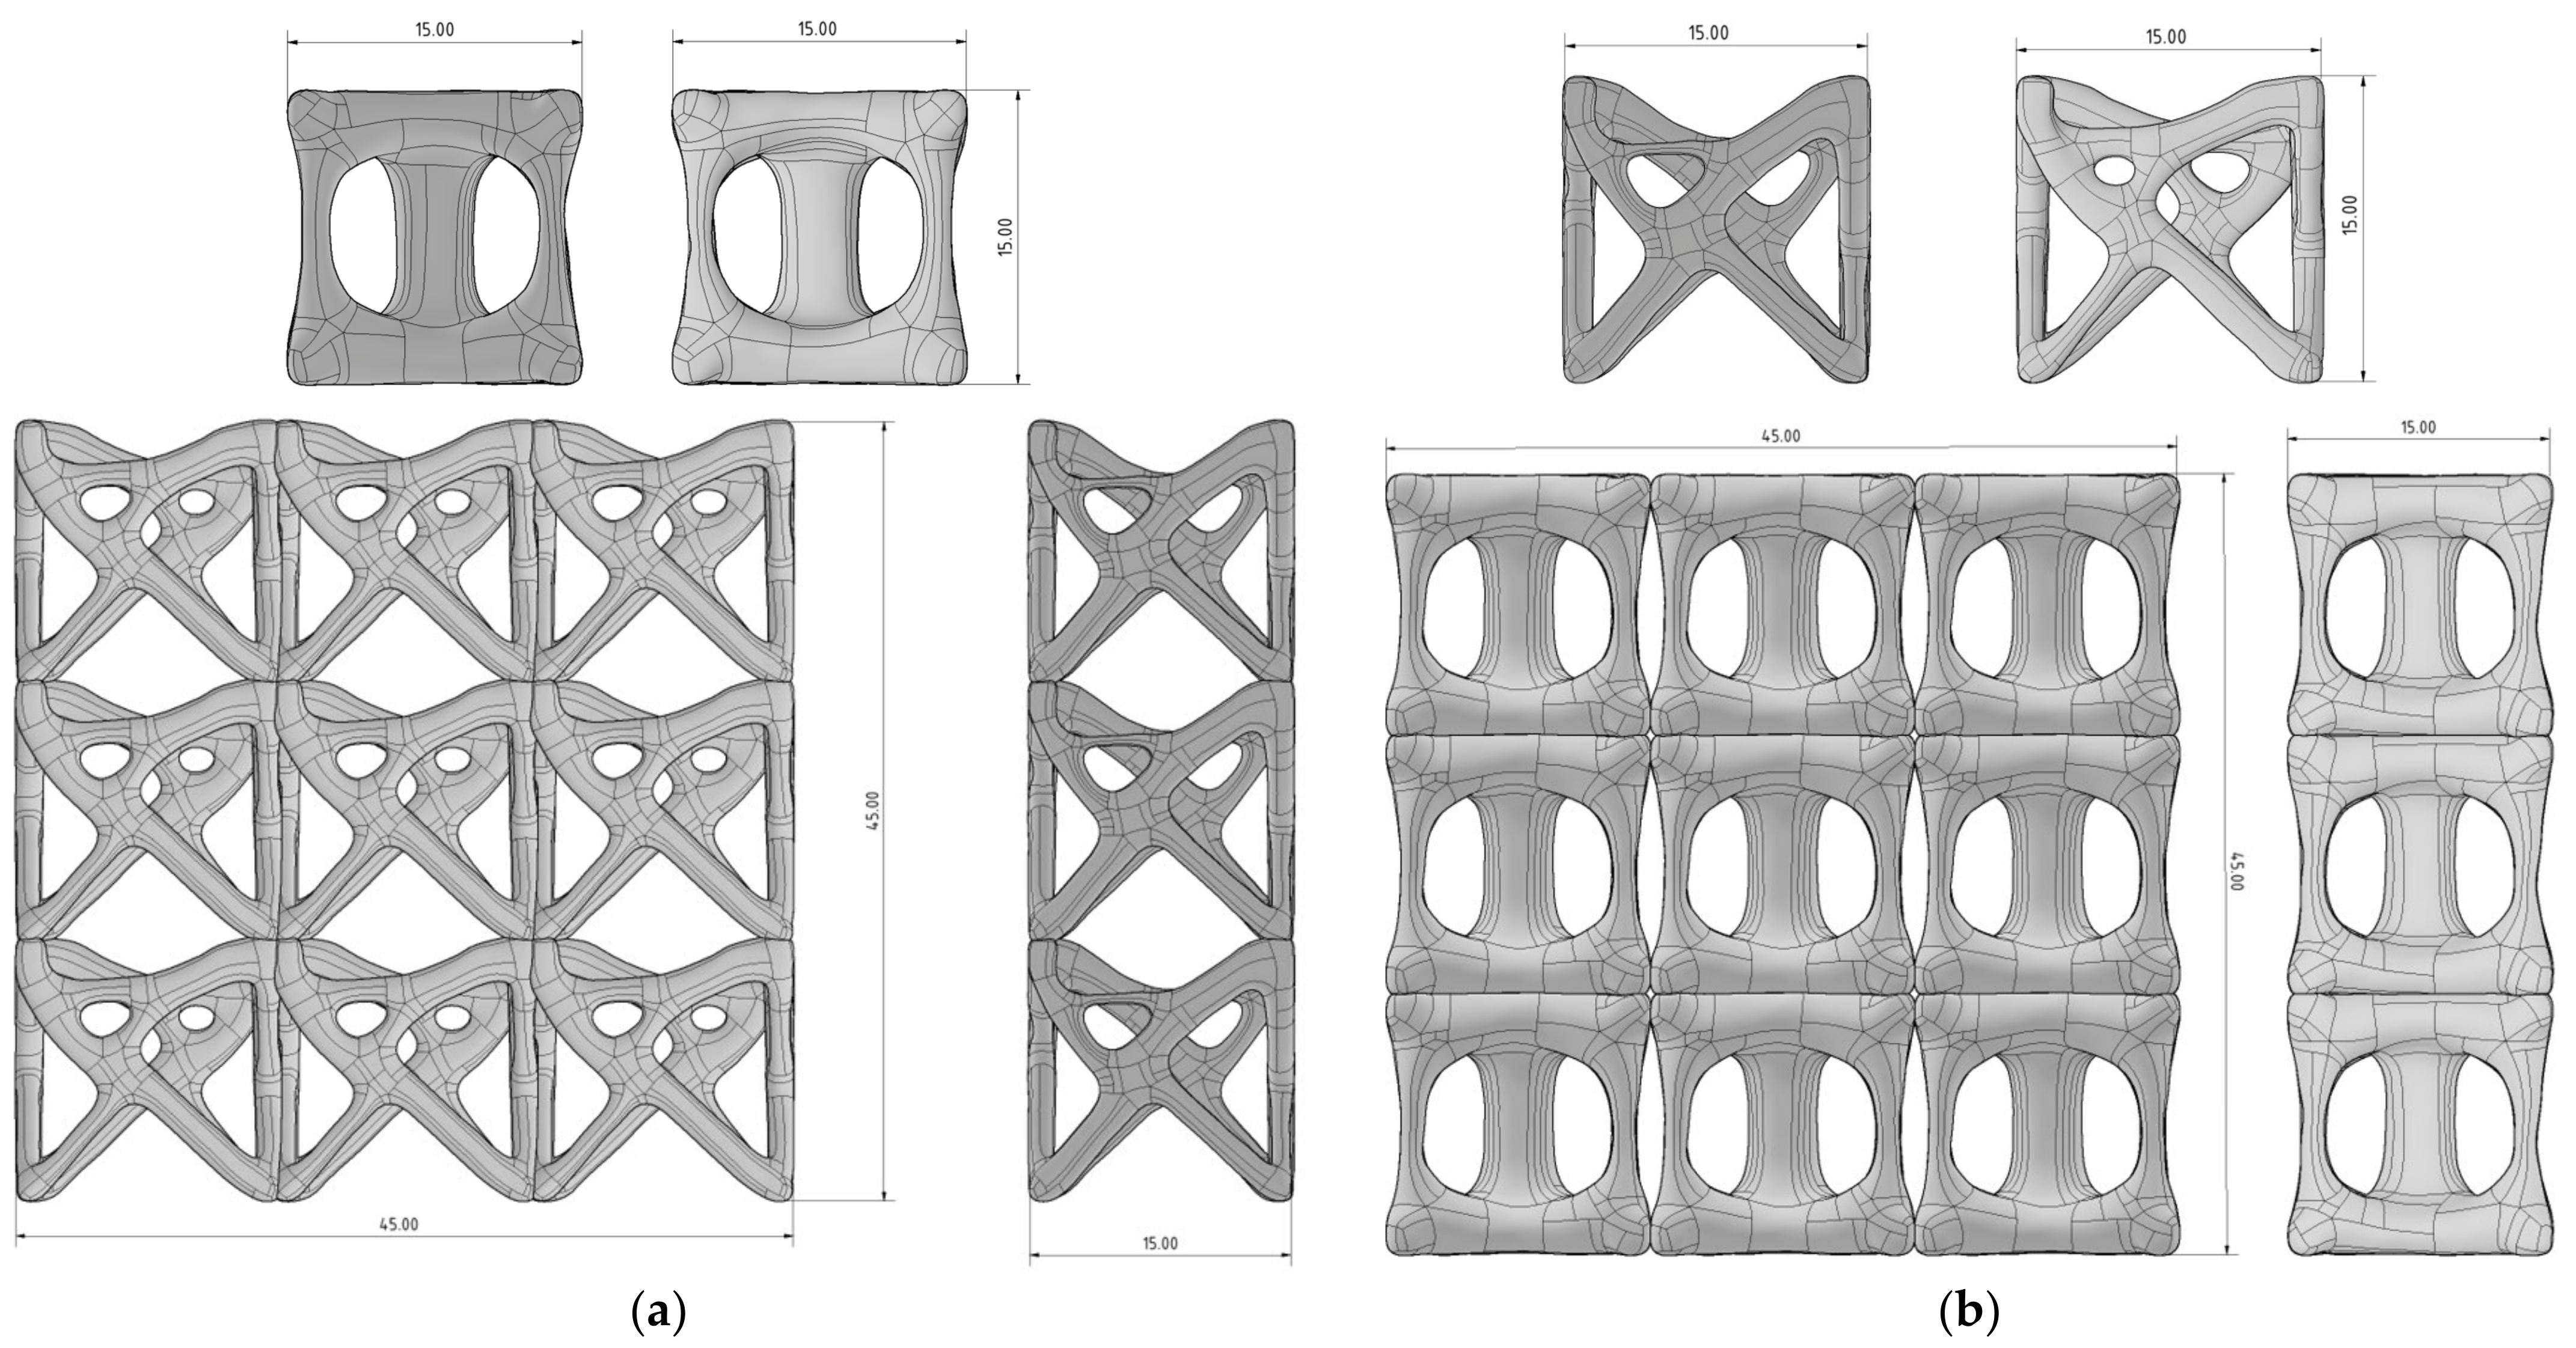
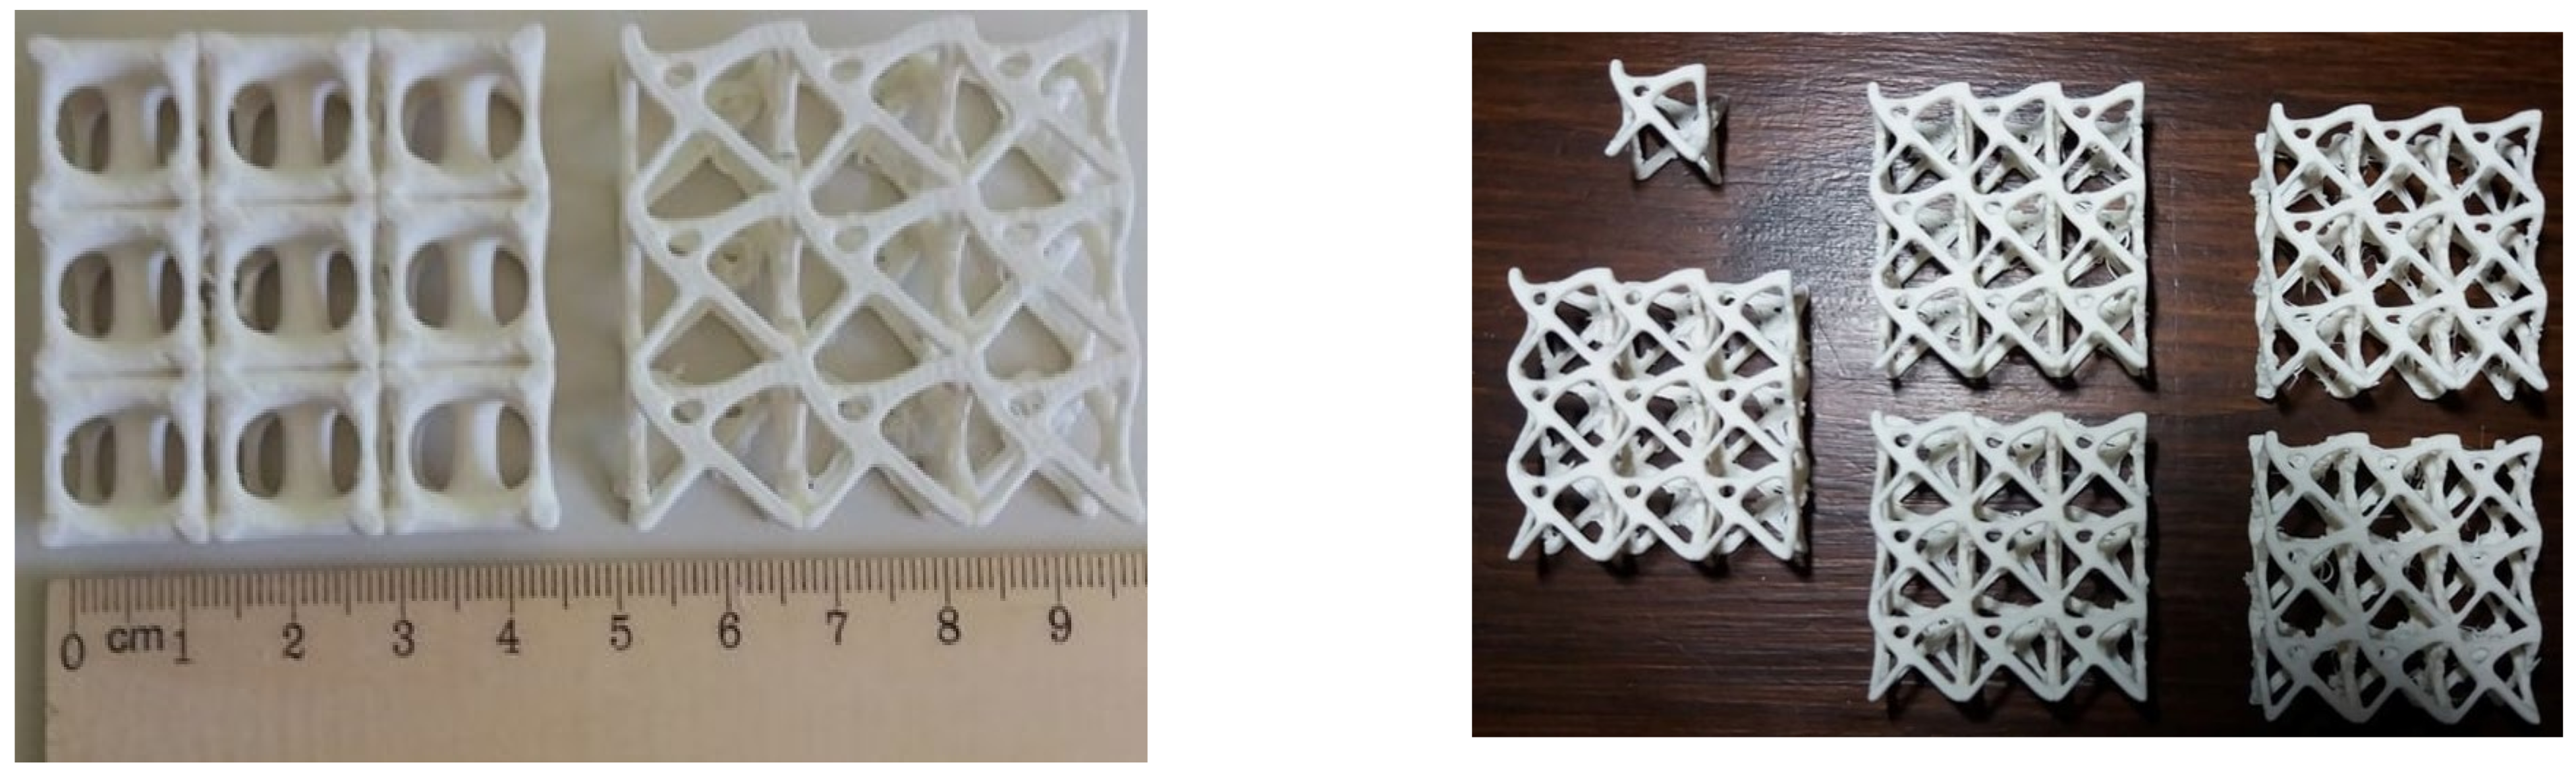
The proposed lattice structures have been evaluated experimentally through compression and tensile strength tests. For compression tests, lattice structures consisting of a single unit cell specimen of 15 × 15 × 15 mm and another of 3 × 3 mapping in a rectangular shape of height: 45 mm, width: 45 mm and thickness: 15 mm have been designed and manufactured. The computer-aided design (CAD) models of both lattice structures illustrated in Figure 8 were employed to investigate the compressive behavior of the lattice structures. Figure 9 shows photographs from the fabricated lattice structures. The outline shapes of these specimens are the same as in Figure 8. The relative density of both structures is 0.4 and 0.1, respectively. In order to ensure the truth of the compression test results, five specimens for each lattice structure were fabricated and tested (Figure 9).
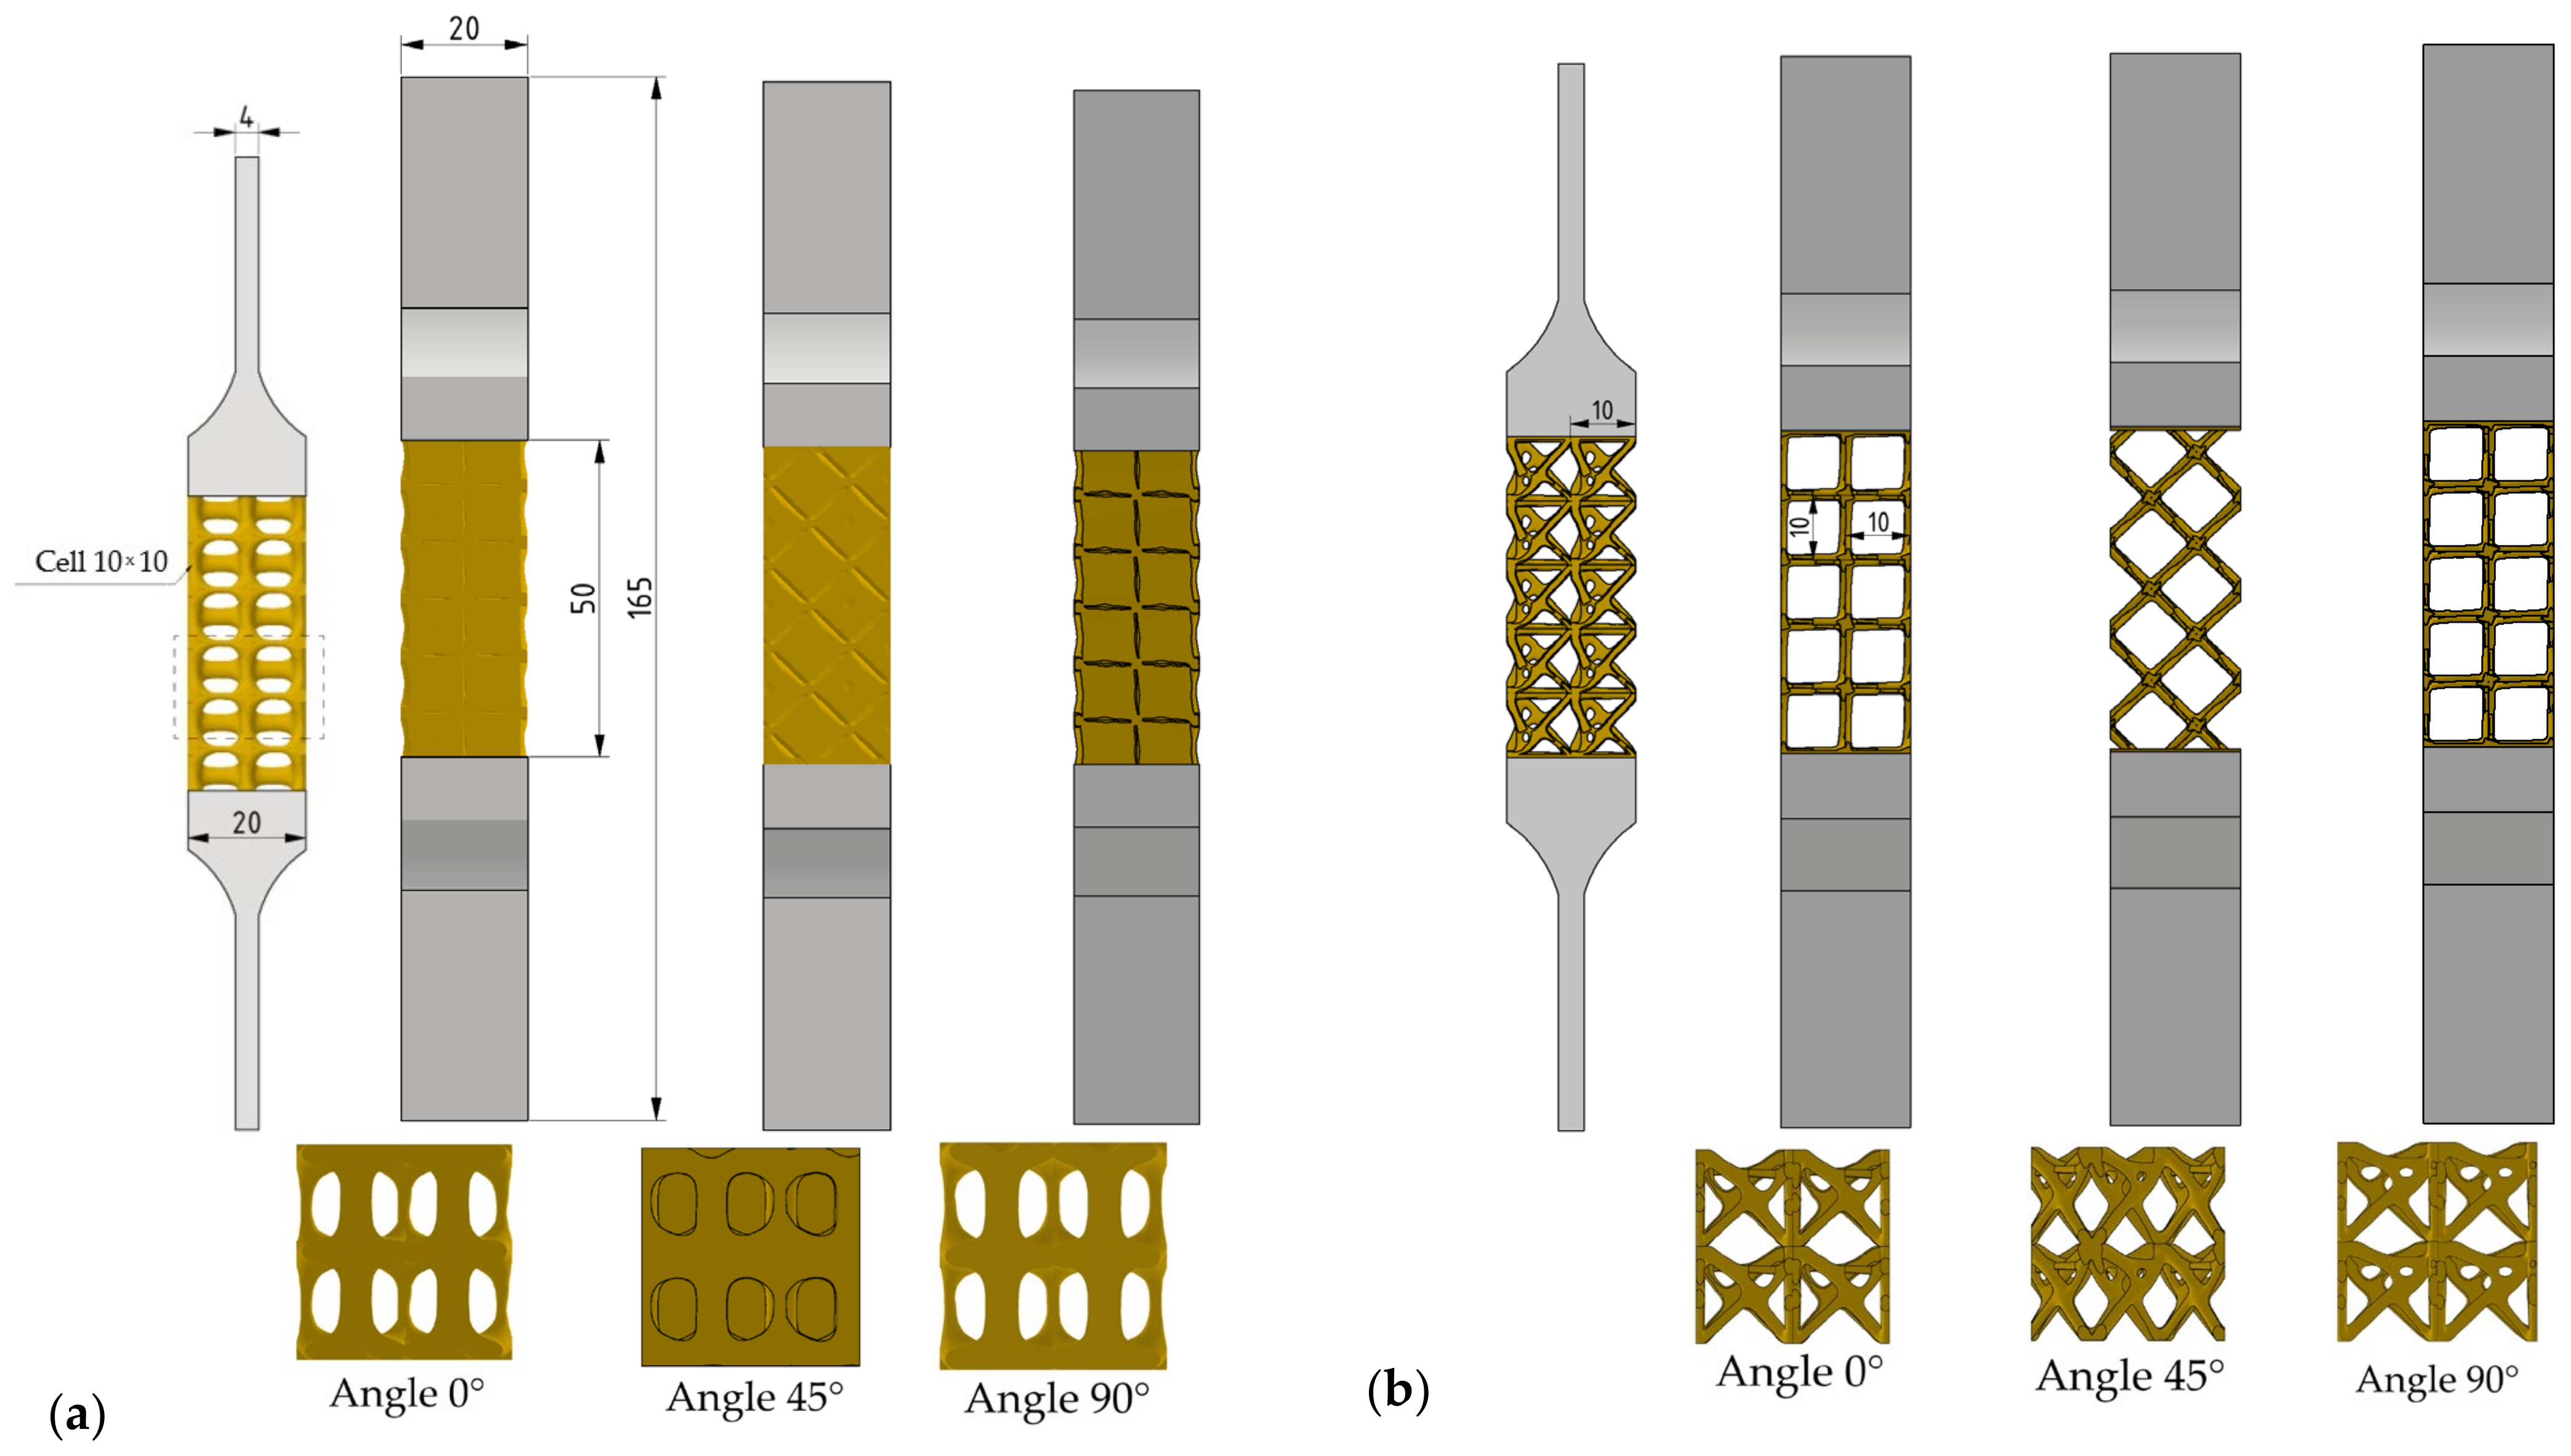
To indicate further the mechanical properties of the proposed lattices, tensile tests were performed. Figure 10 shows the CAD models with the outline dimensions. In order to check the mechanical behavior of the proposed lattices, three specimens for each structure with different cell orientation angles (0°, 45° and 90°) were designed and fabricated. Photographs from the fabricated specimens with different lattice structure mapping angles are presented in Figure 11.
5. Results
5.1. Theoretical Evaluation of Proposed Lattices
The SIMP method predicts an optimal material distribution within a given design space. The other structure characteristics such as anisotropy are not easily integrated into general Topological Optimization algorithms. Respectively, the avoidance of fatigue or buckling effects in microstructures produced with Topology Optimization cannot be guaranteed. Therefore, the homogenization of the topology optimized structures is an appropriated step. An exception is auxetic microstructures, where Topology Optimization is used to design compliant microstructures so that the desired flexibility leads macroscopically to auxetic behavior [36].
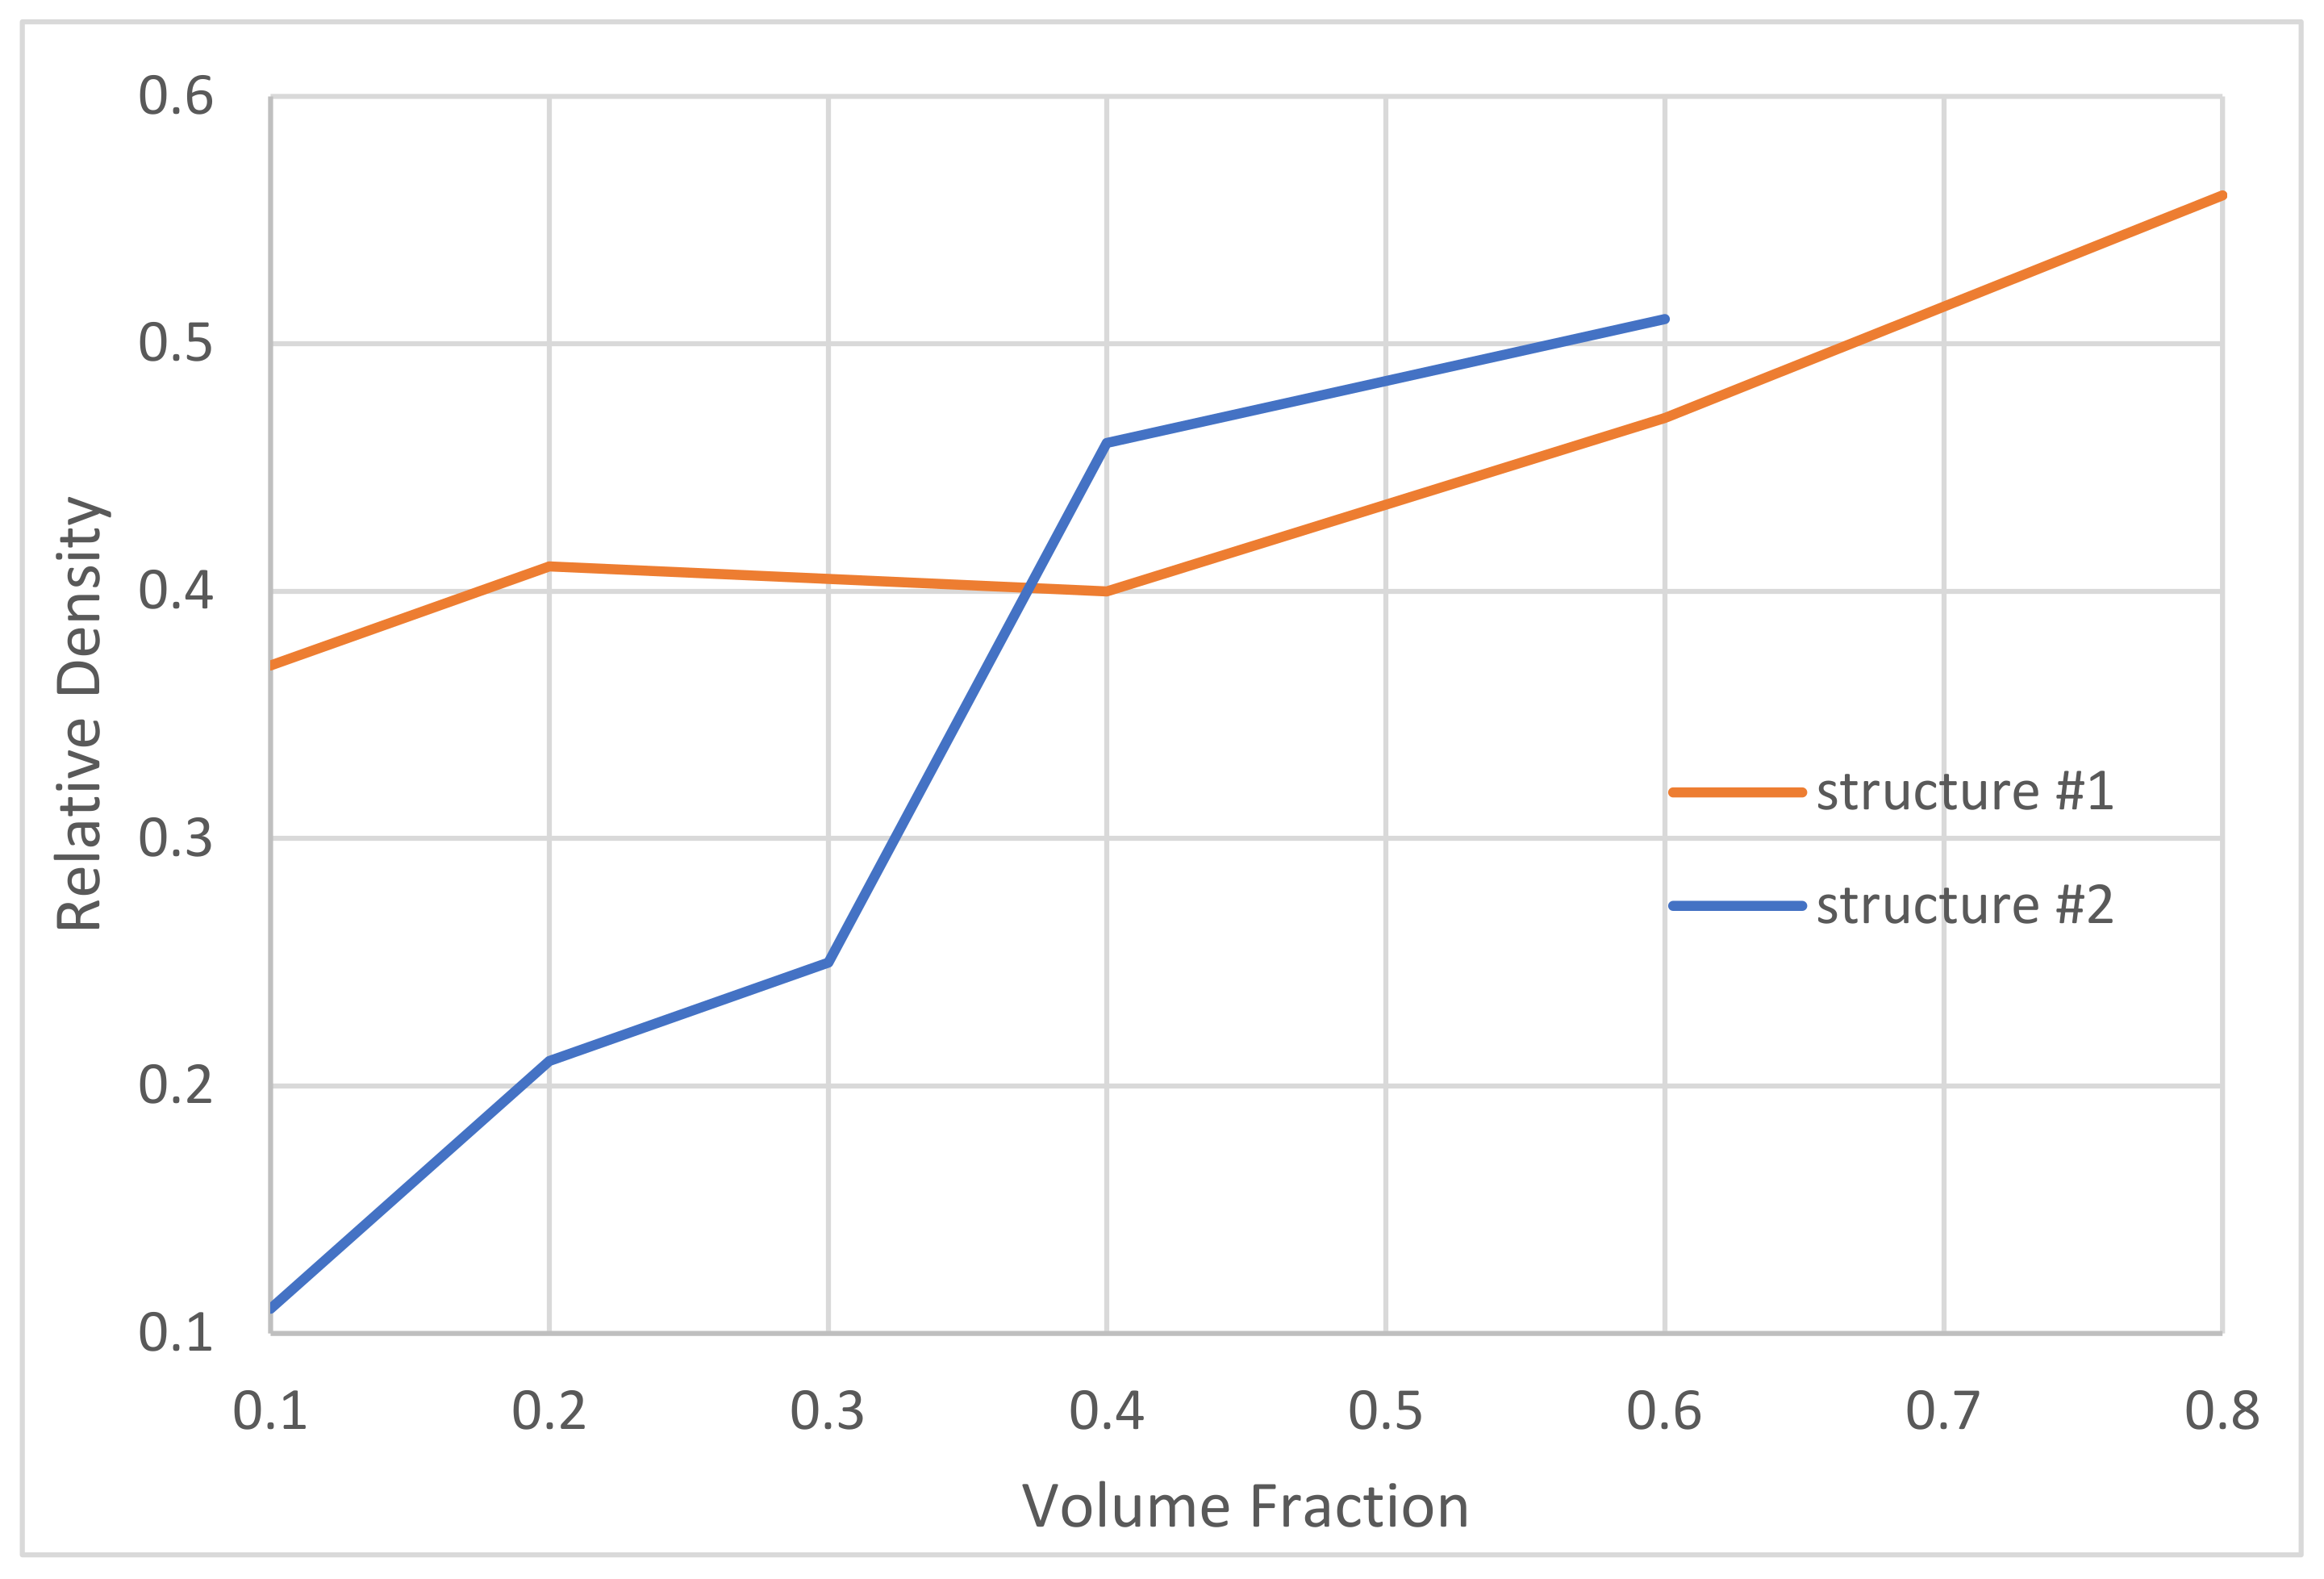
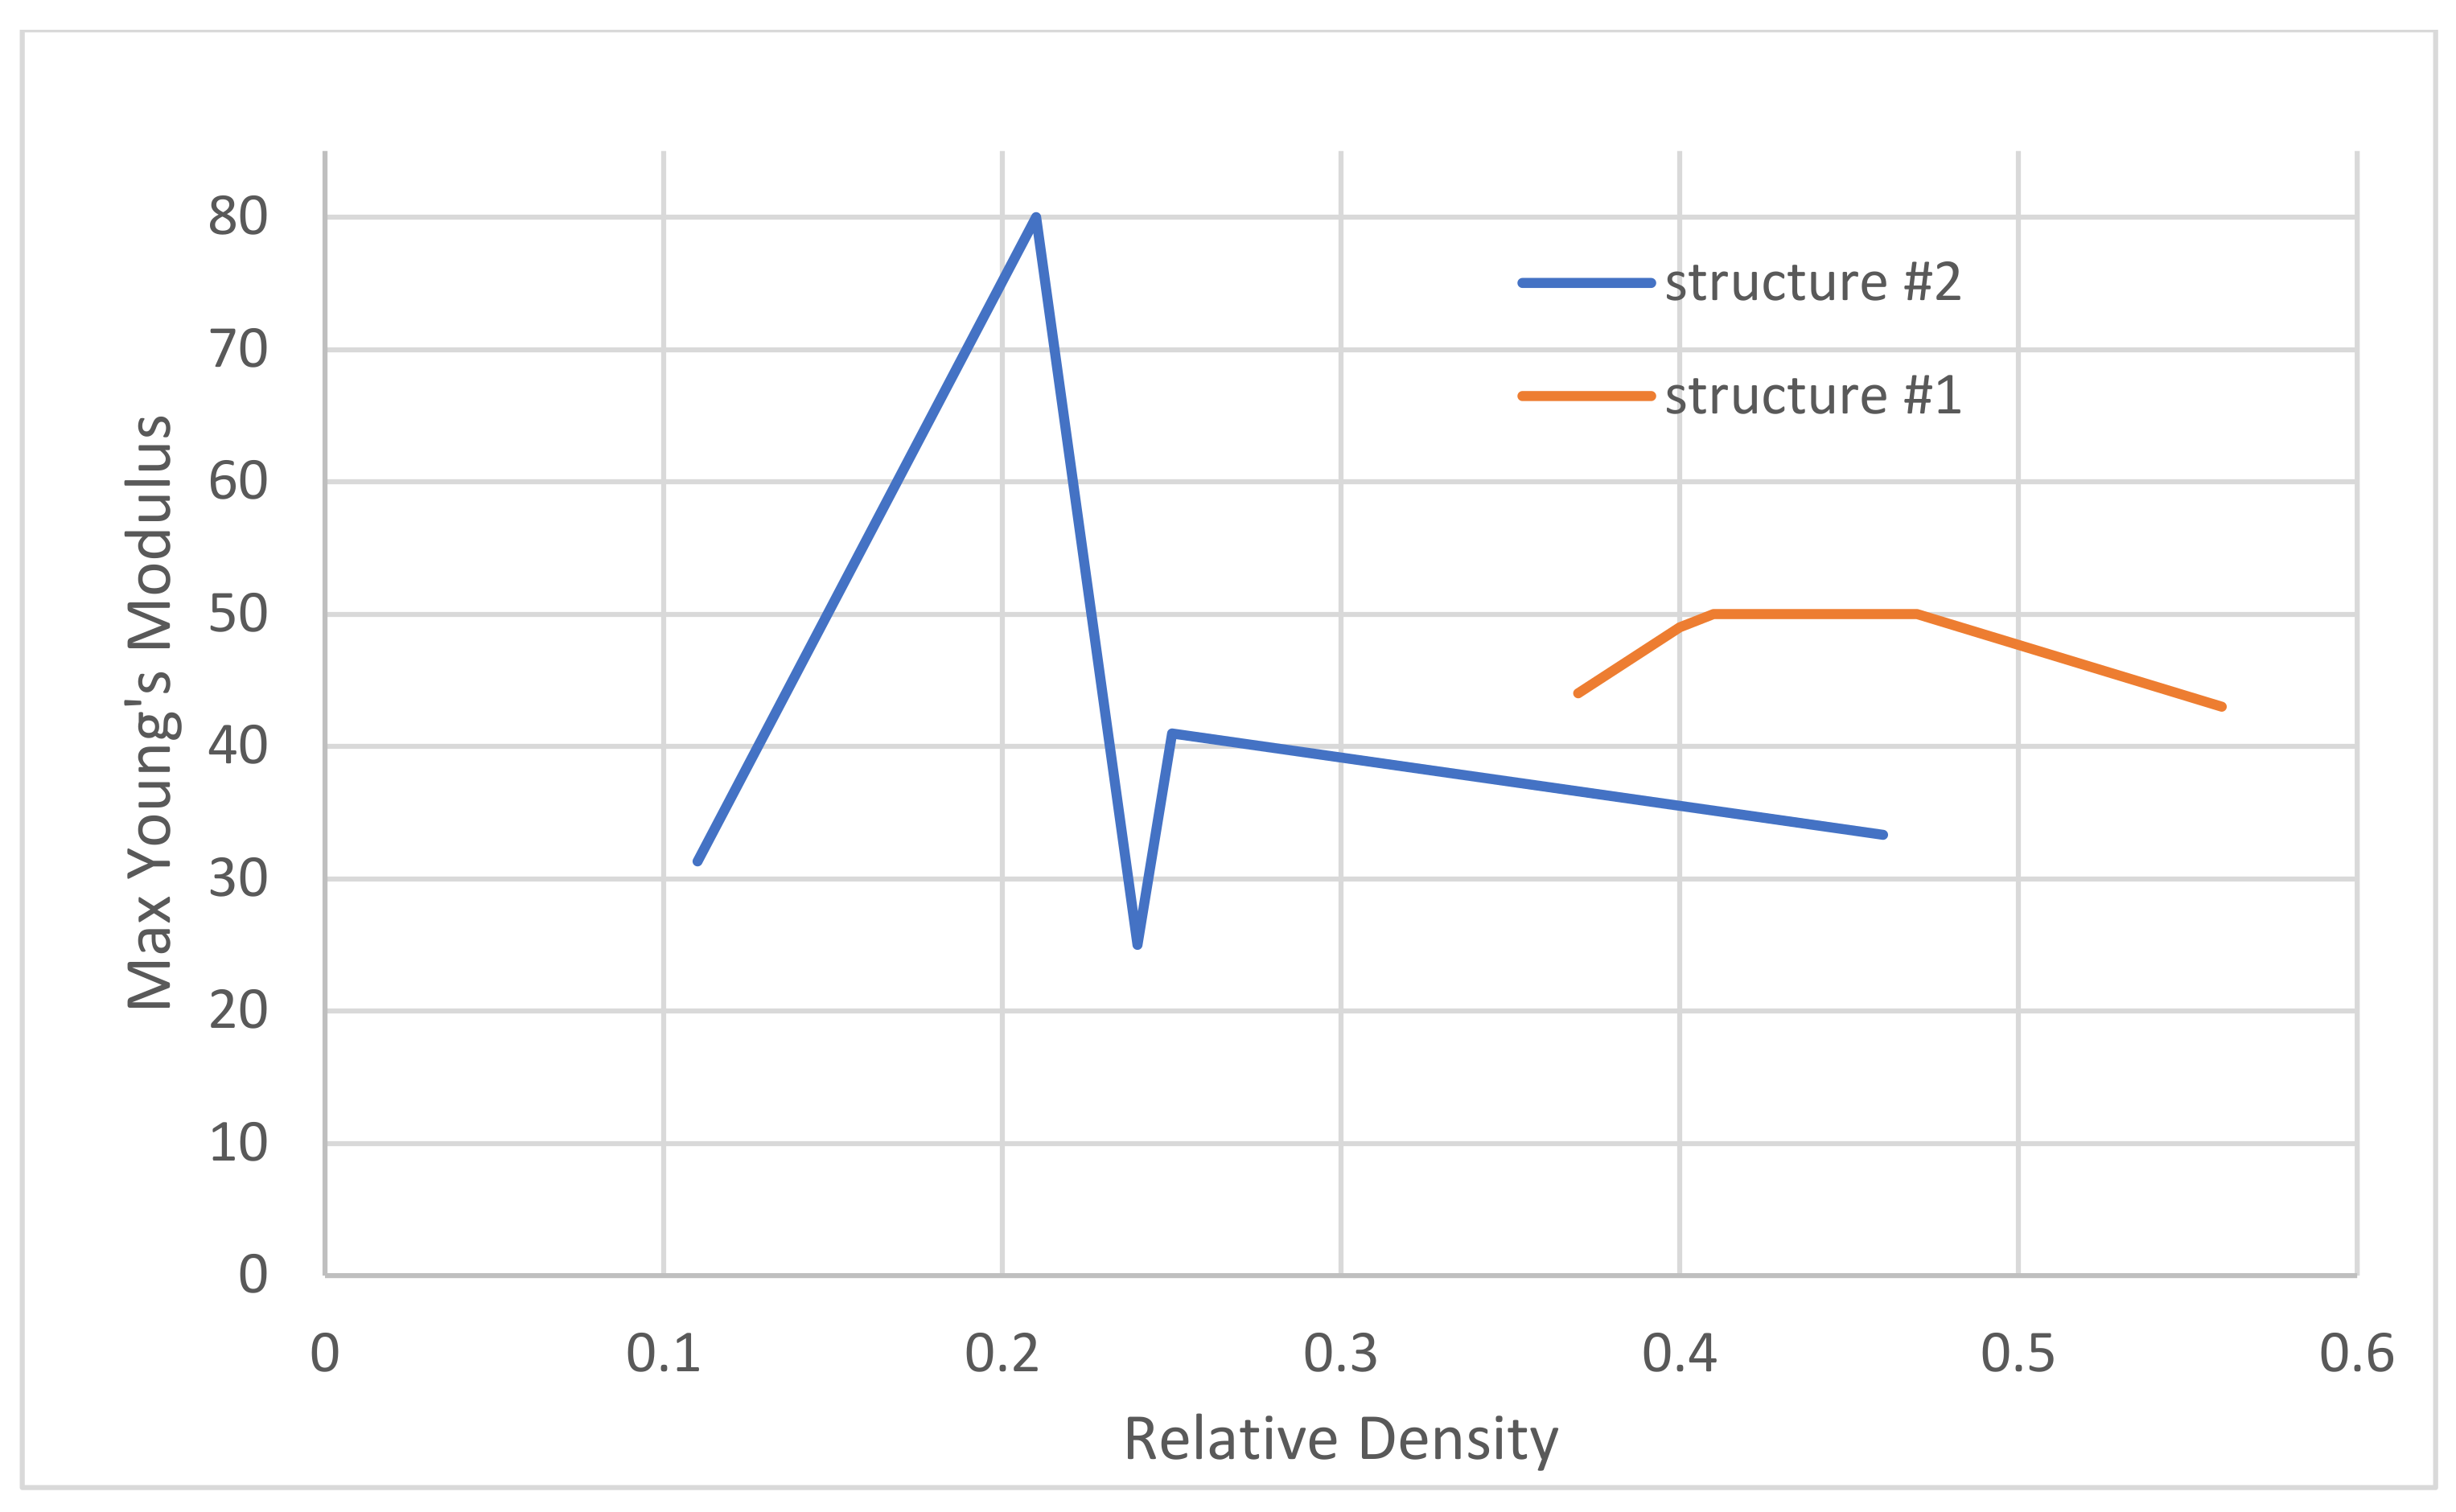
A key parameter to understand lattice behavior is the relative density (). As relative density is defined as the density ratio of the lattice material to the solid material (), if a lattice has high porosity, then the value of the relative density is low; otherwise, a high value of that indicates a low porosity [32]. The relative density increases for the higher volume fraction. In Figure 12, the relative density of the proposed lattices against the volume fraction is presented. The homogenized domain of structure #2 showed similar trends as structure #1; however, the slope is lower. The lower the slope is, the larger the amount of material that can be added for a given relative density (Figure 8). In Figure 13, Maximum Young’s modulus for different relative density values is presented. Structure #2 seems to have better performance in comparison to structure #1 with the use of a lower amount of material.
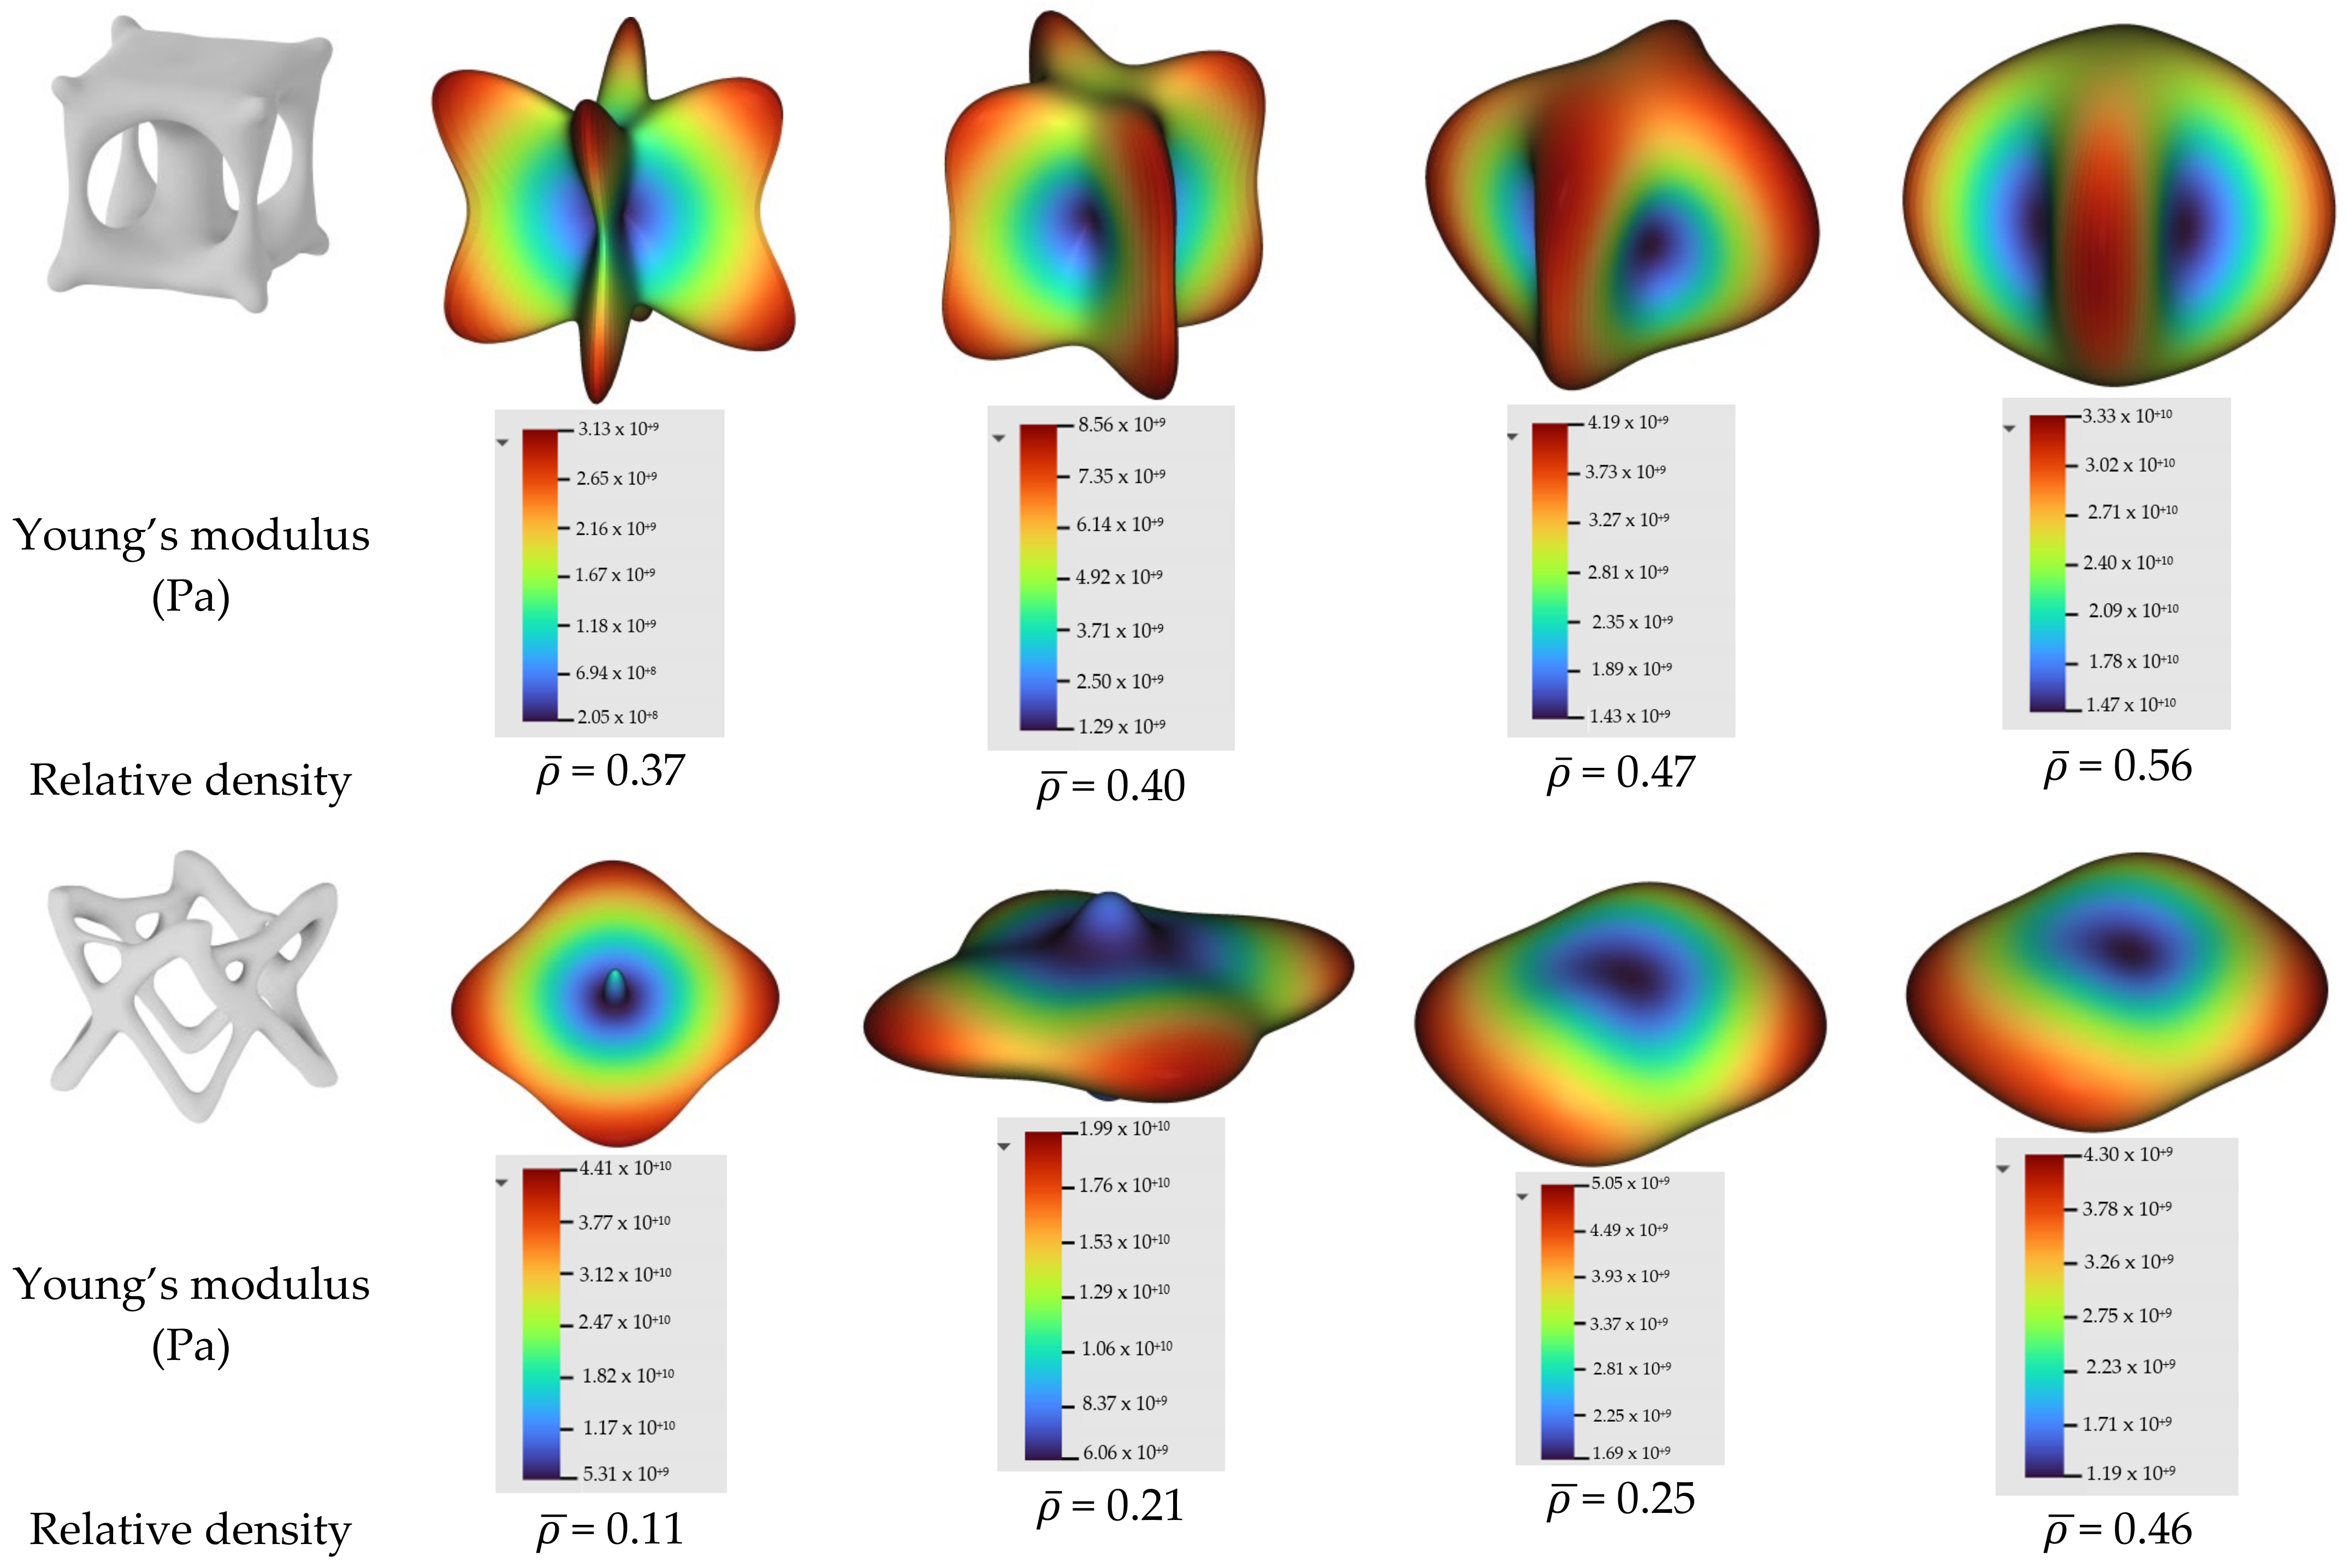
In the current study, a general homogenization method is utilized to evaluate and characterize the results of the above proposed structures. Specifically, the anisotropy of the proposed structures through the measure of the maximum Young’s modulus (Emax) and local minimum Young’s modulus (Emin) is checked (Figure 13). According to Tancogne Dejean, a measure of the anisotropy of the lattice structure is derived from Emax/Emin [37].
5.2. Zener Ratio Calculation
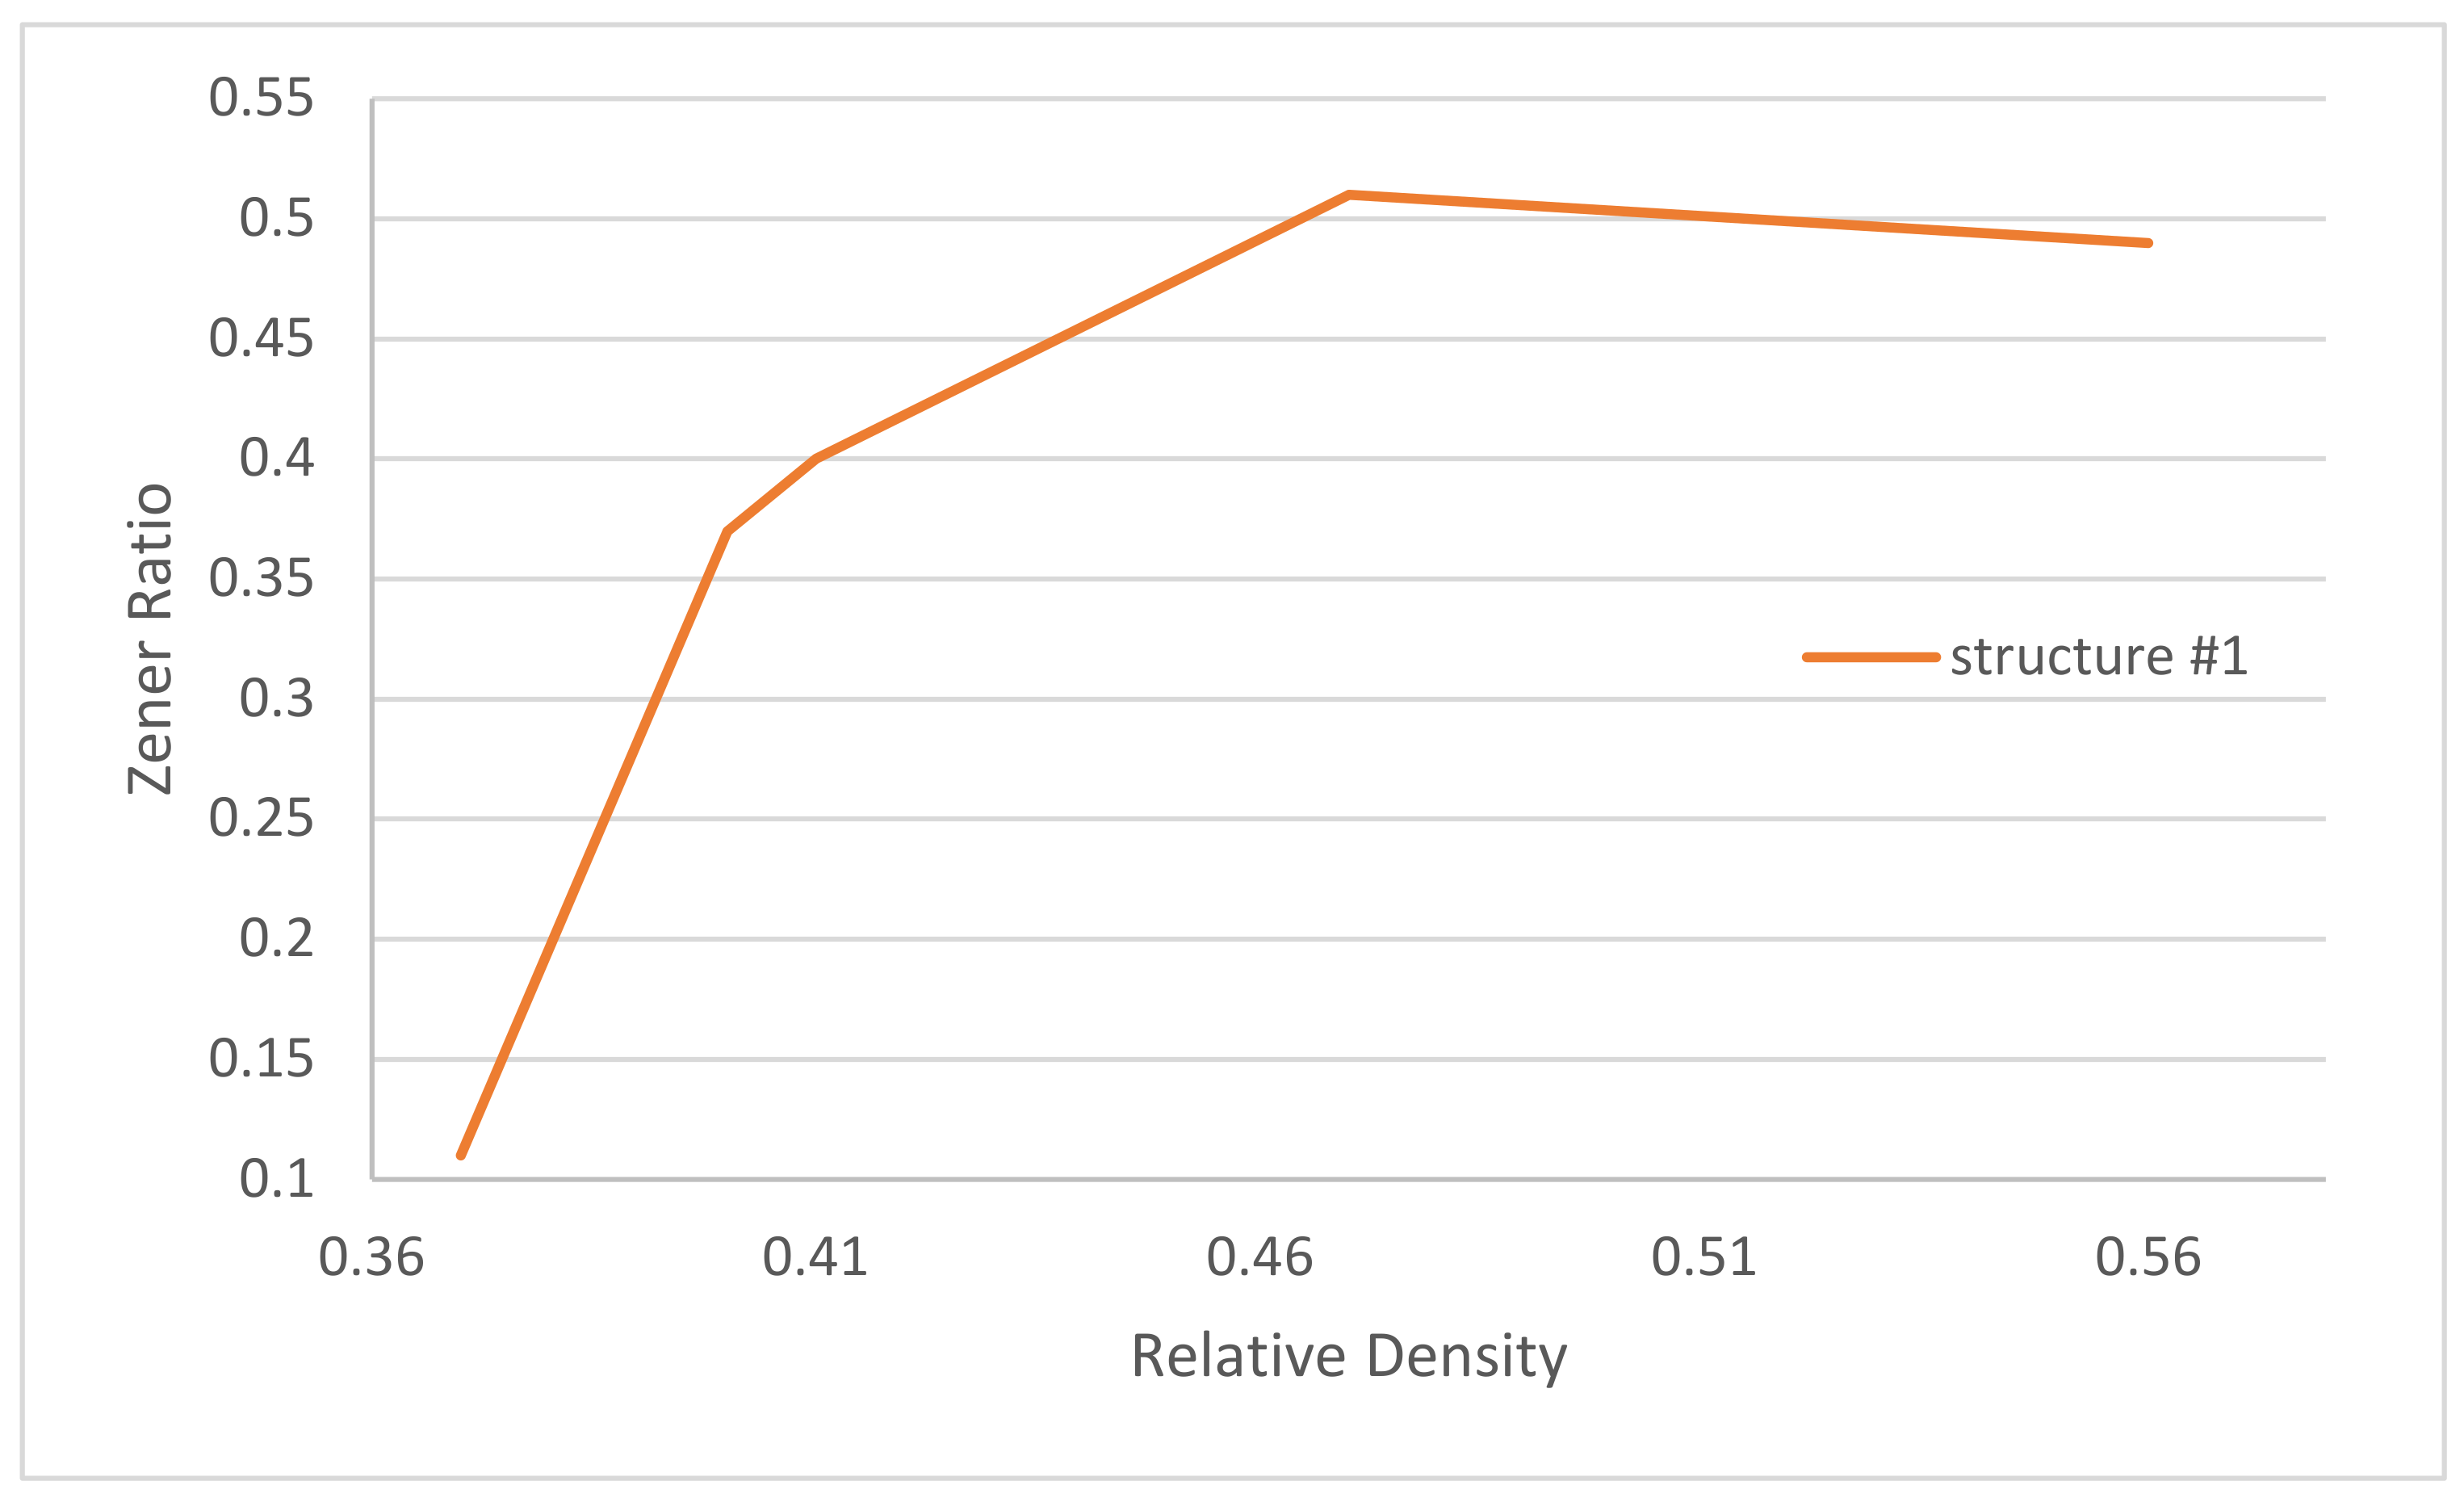
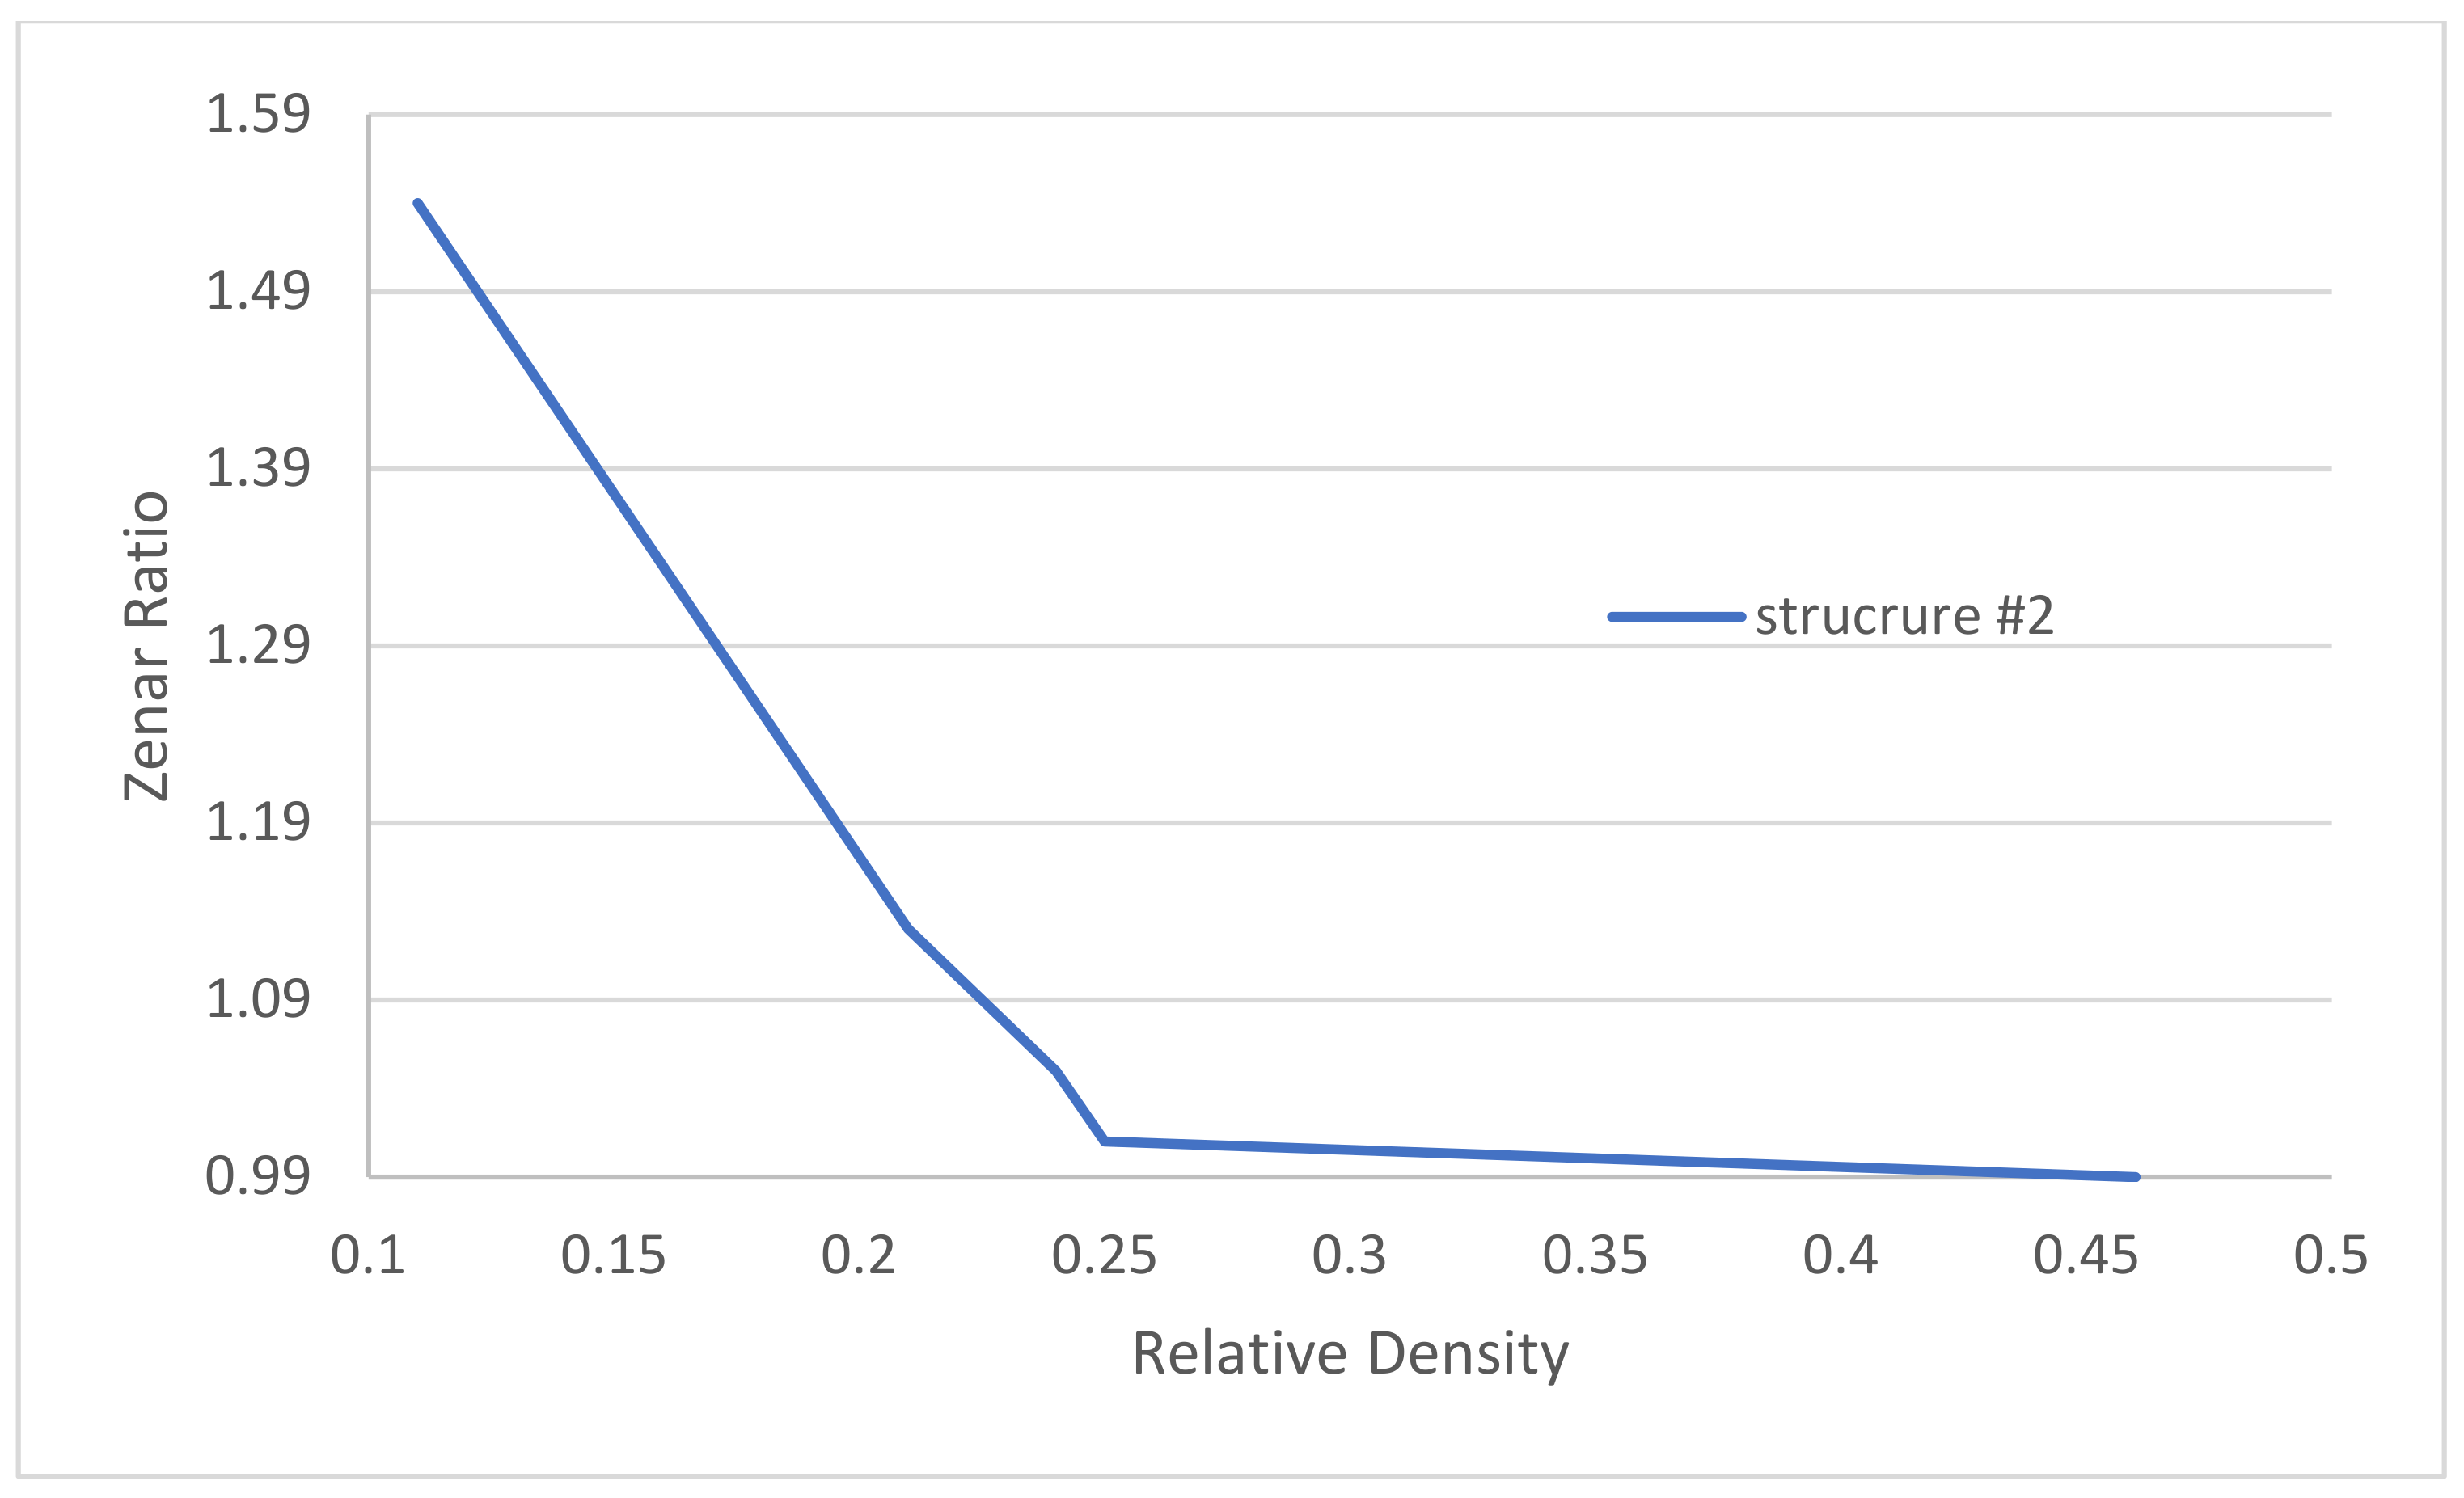
The proposed lattices are characterized from cubic symmetry; the Zener (A) ratio is calculated for each structure. In Figure 14 are presented the results of the Zener ratio for different relative density values. When Z = 1 represents an isotropic material, a deviation less than or greater than unity signifies the degree of anisotropy. Both lattices seem to have anisotropic behavior. Figure 14 and Figure 15 show Zener ratios in different relative density values. In structure #1, the Zener ratio is lower than unity (up to 0.51 for a relative density of 0.48), and vice versa in structure #2, where the Zener ratio is greater than unity (from 0.99 to 1.56). As shown in Figure 14, microstructure #1 has worse isotropy than microstructure #2, and the Young’s modulus surface is produced in three dimensions, instead of structure #2, which has a box-like surface.
Both lattice structures show a significant level of anisotropy in the uniaxial modulus. Structure #2 exhibits lower uniaxial modulus anisotropy. Therefore, for higher relative density values, the anisotropy did not significantly change the uniaxial modulus, especially; for = 0.25, the Zener ratio is equal to 1 (Figure 16).
5.3. Evaluation of Homogenied Microstructure with FE Analysis
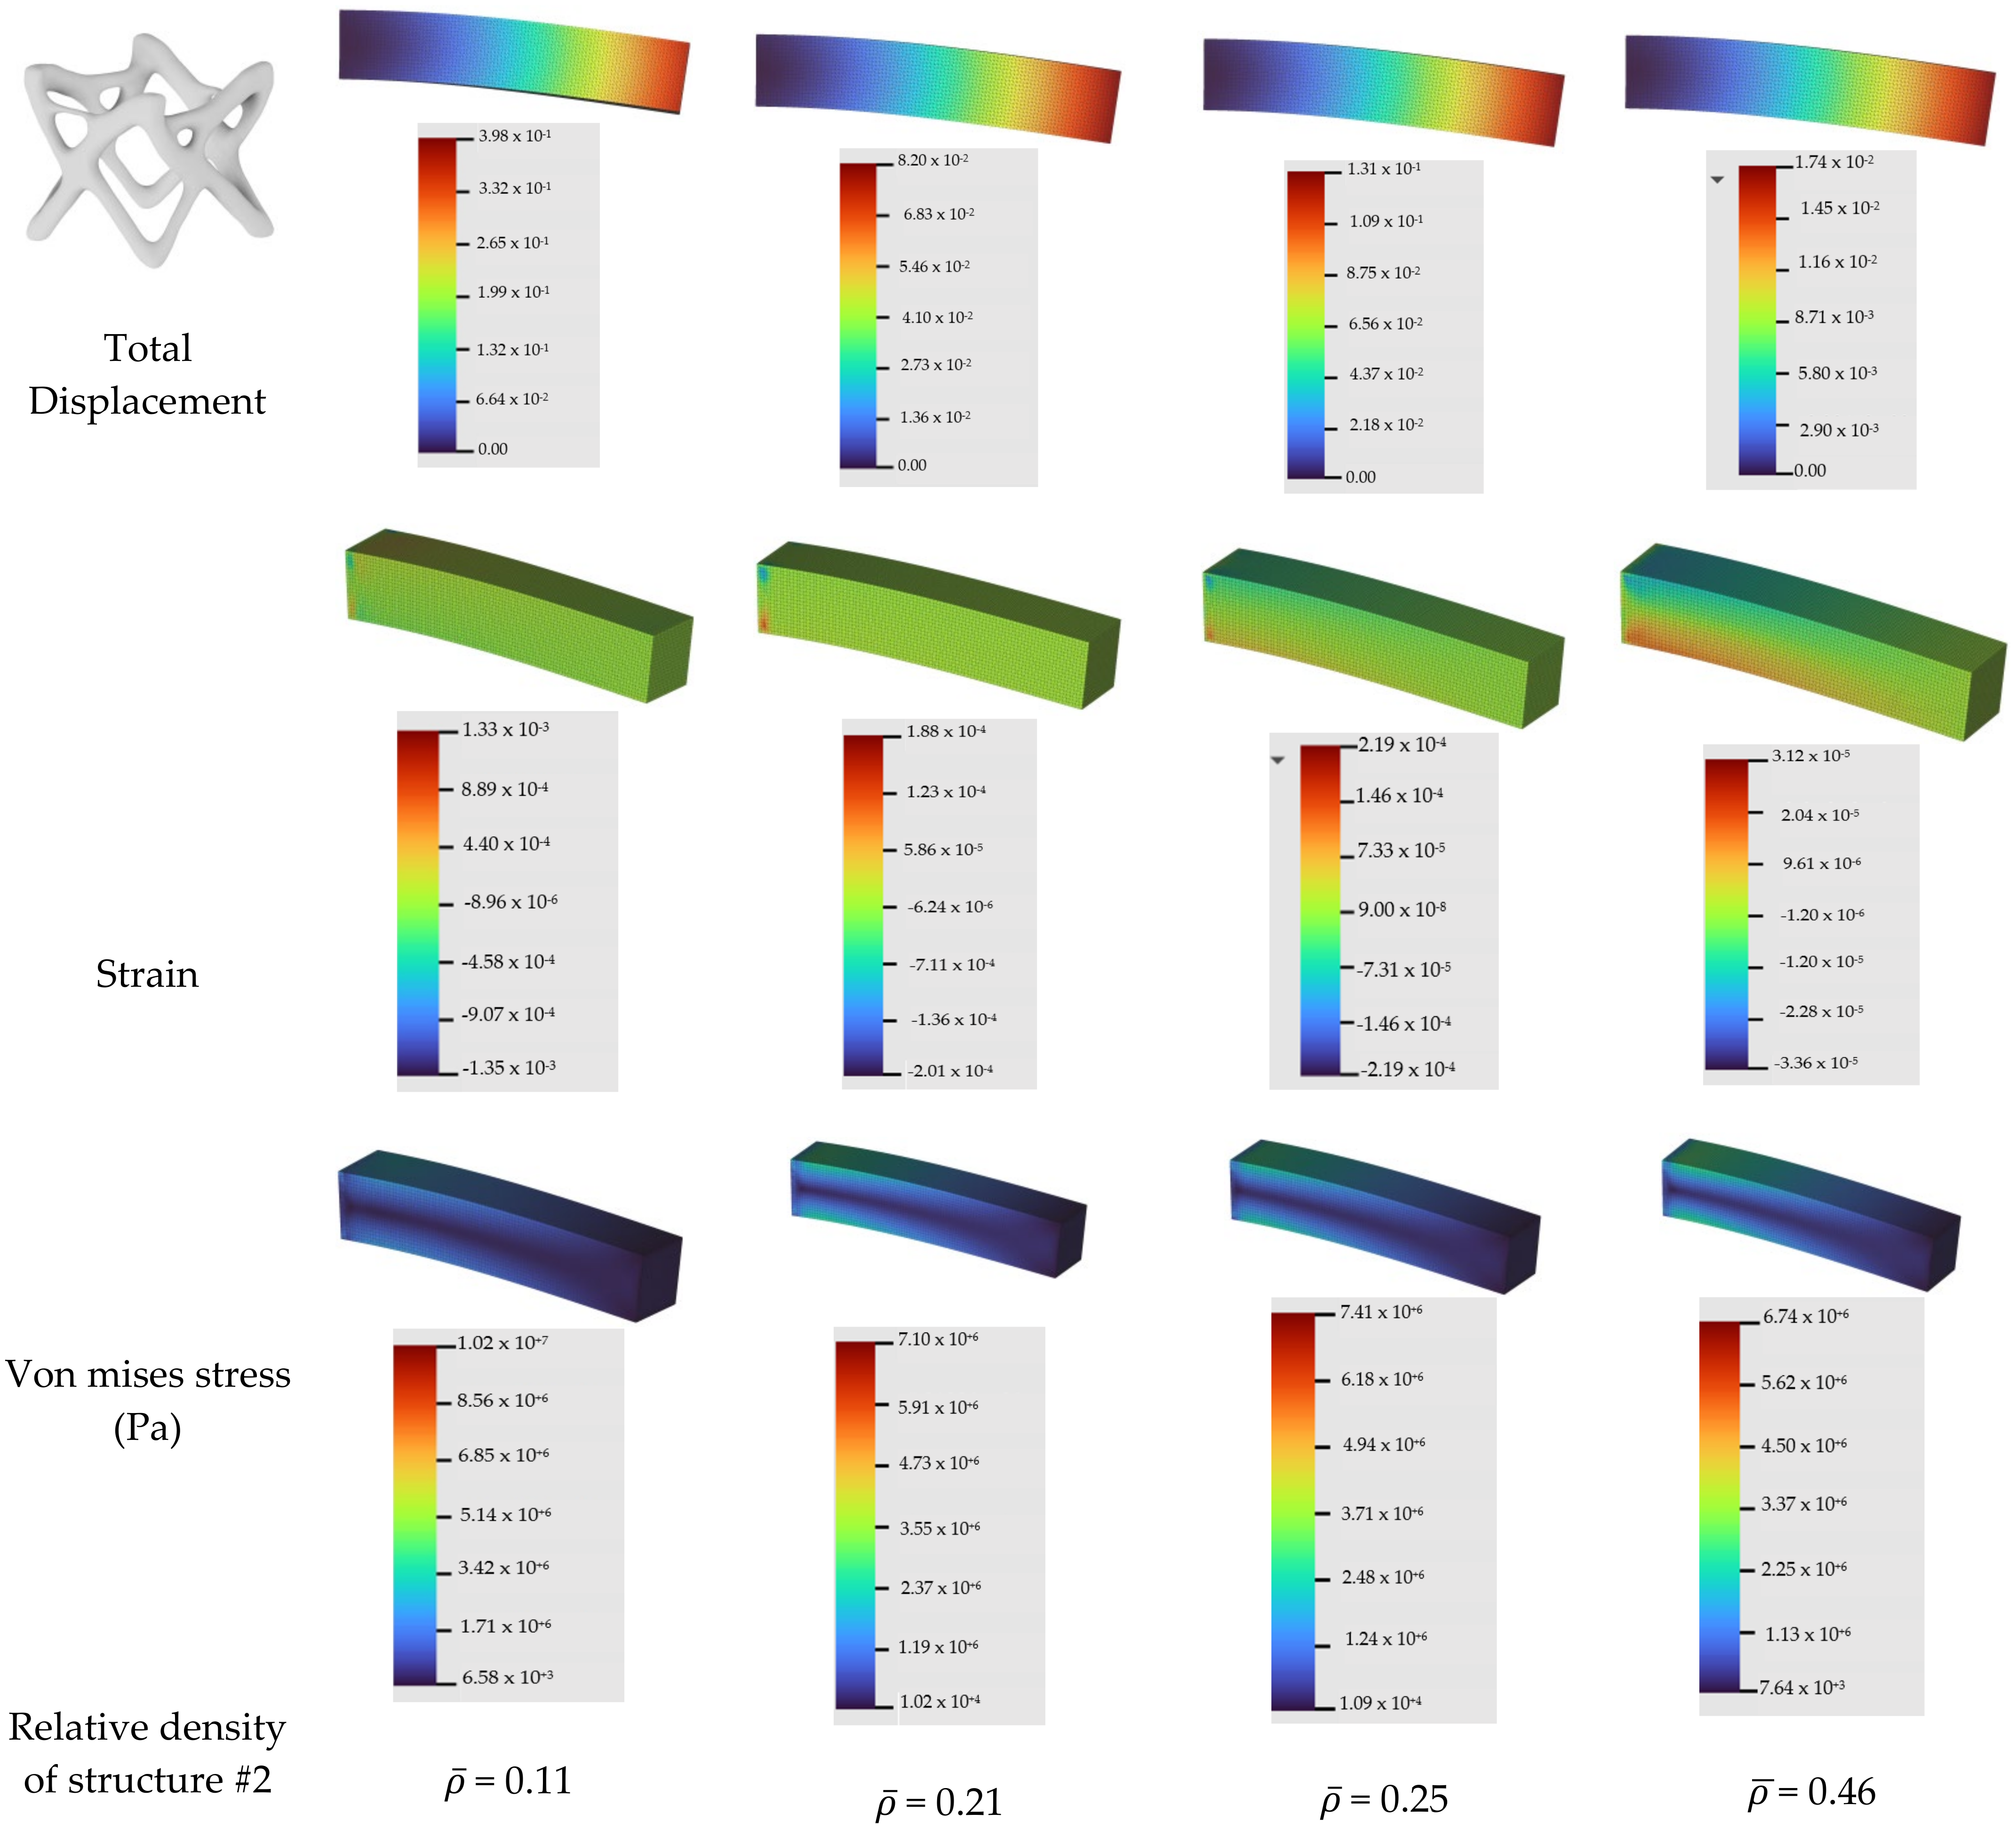
In order to evaluate the homogenized microstructures as an Additive Manufacturing infill, two Finite Element Analysis are executed by the use of a cantilever model with dimension 50 × 10 × 10 mm. A FE mesh of 64.424 tetrahedral elements of the cantilever model is created. According to the boundary conditions, the back face is fixed, and at the end of the model, a vertical force was applied. Afterwards, a FE analysis for each microstructure was executed.
As in the cantilever with microstructure #1, the infill increased so the deflection at the end of the beam was higher. As the relative density increased, the Von mises stress decreased (about 10%). In contrary, the deflection and Von mises stress in microstructure #2 decreased as the relative density increased (Figure 17). From the results, it occurred that microstructure #2 was stiffer and with better isotropy than microstructure #1 and also more efficient, because the stress was lower in the same or lesser amount of material.
5.4. Exrerimental Results
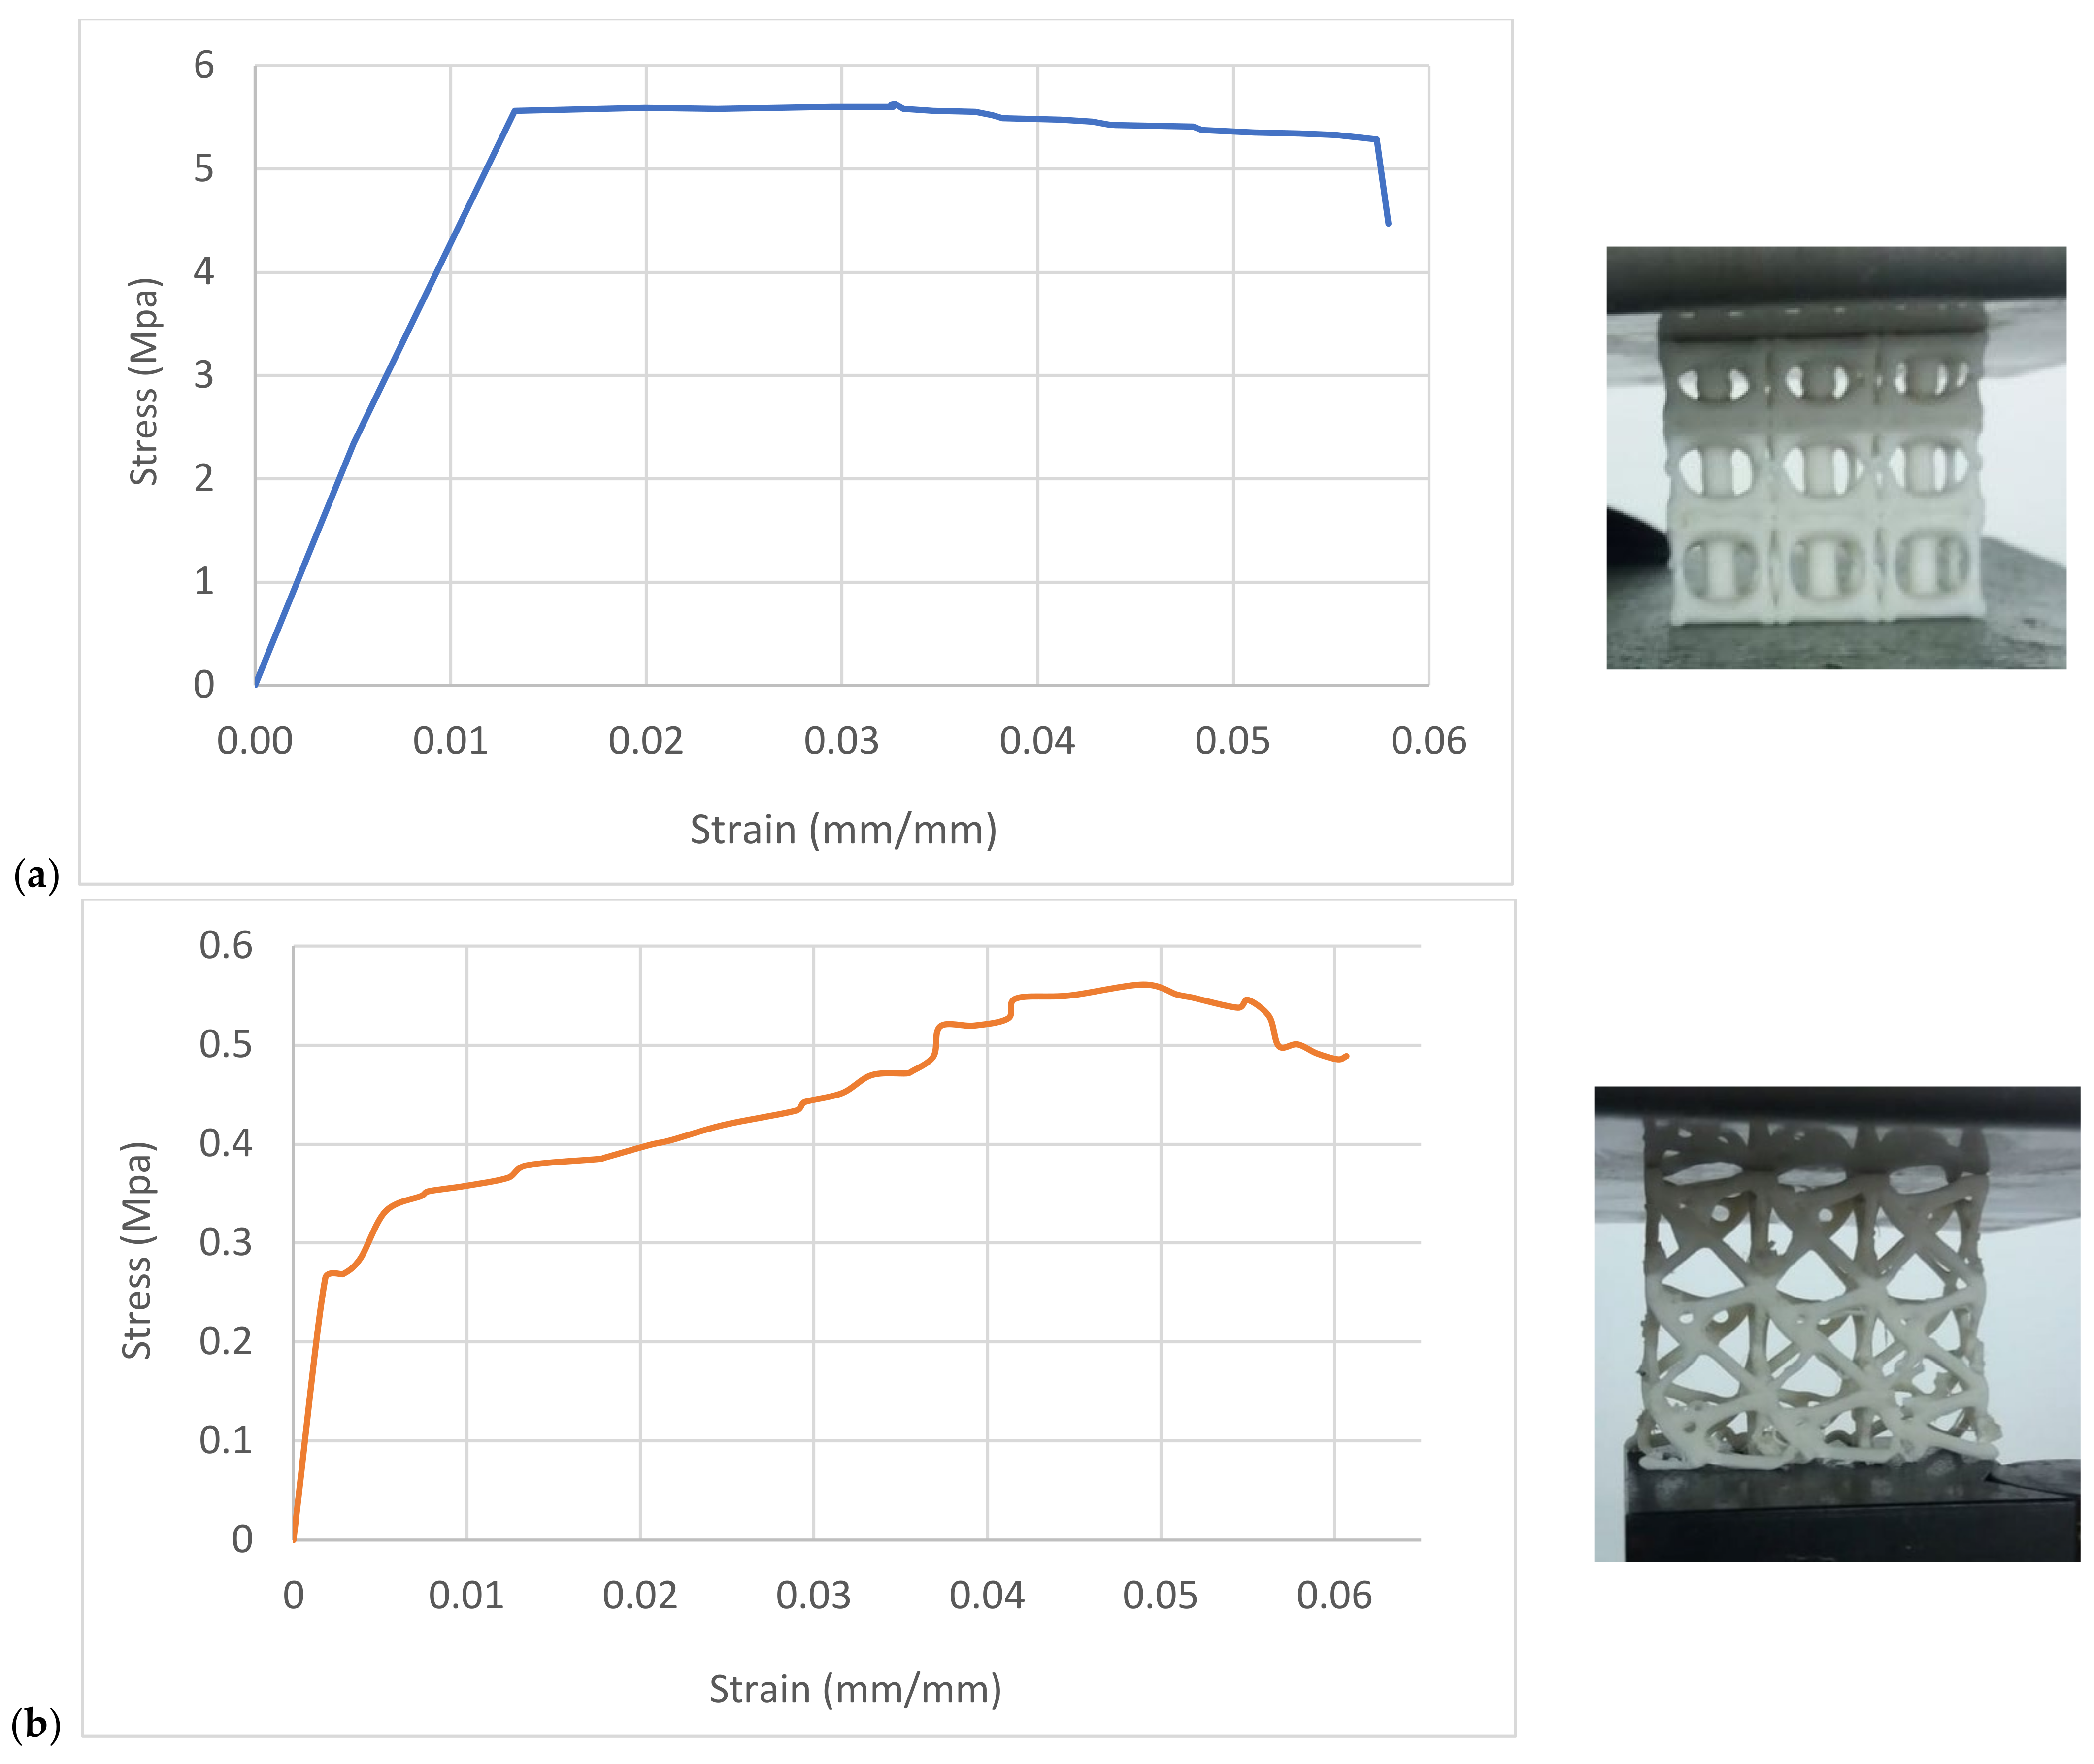
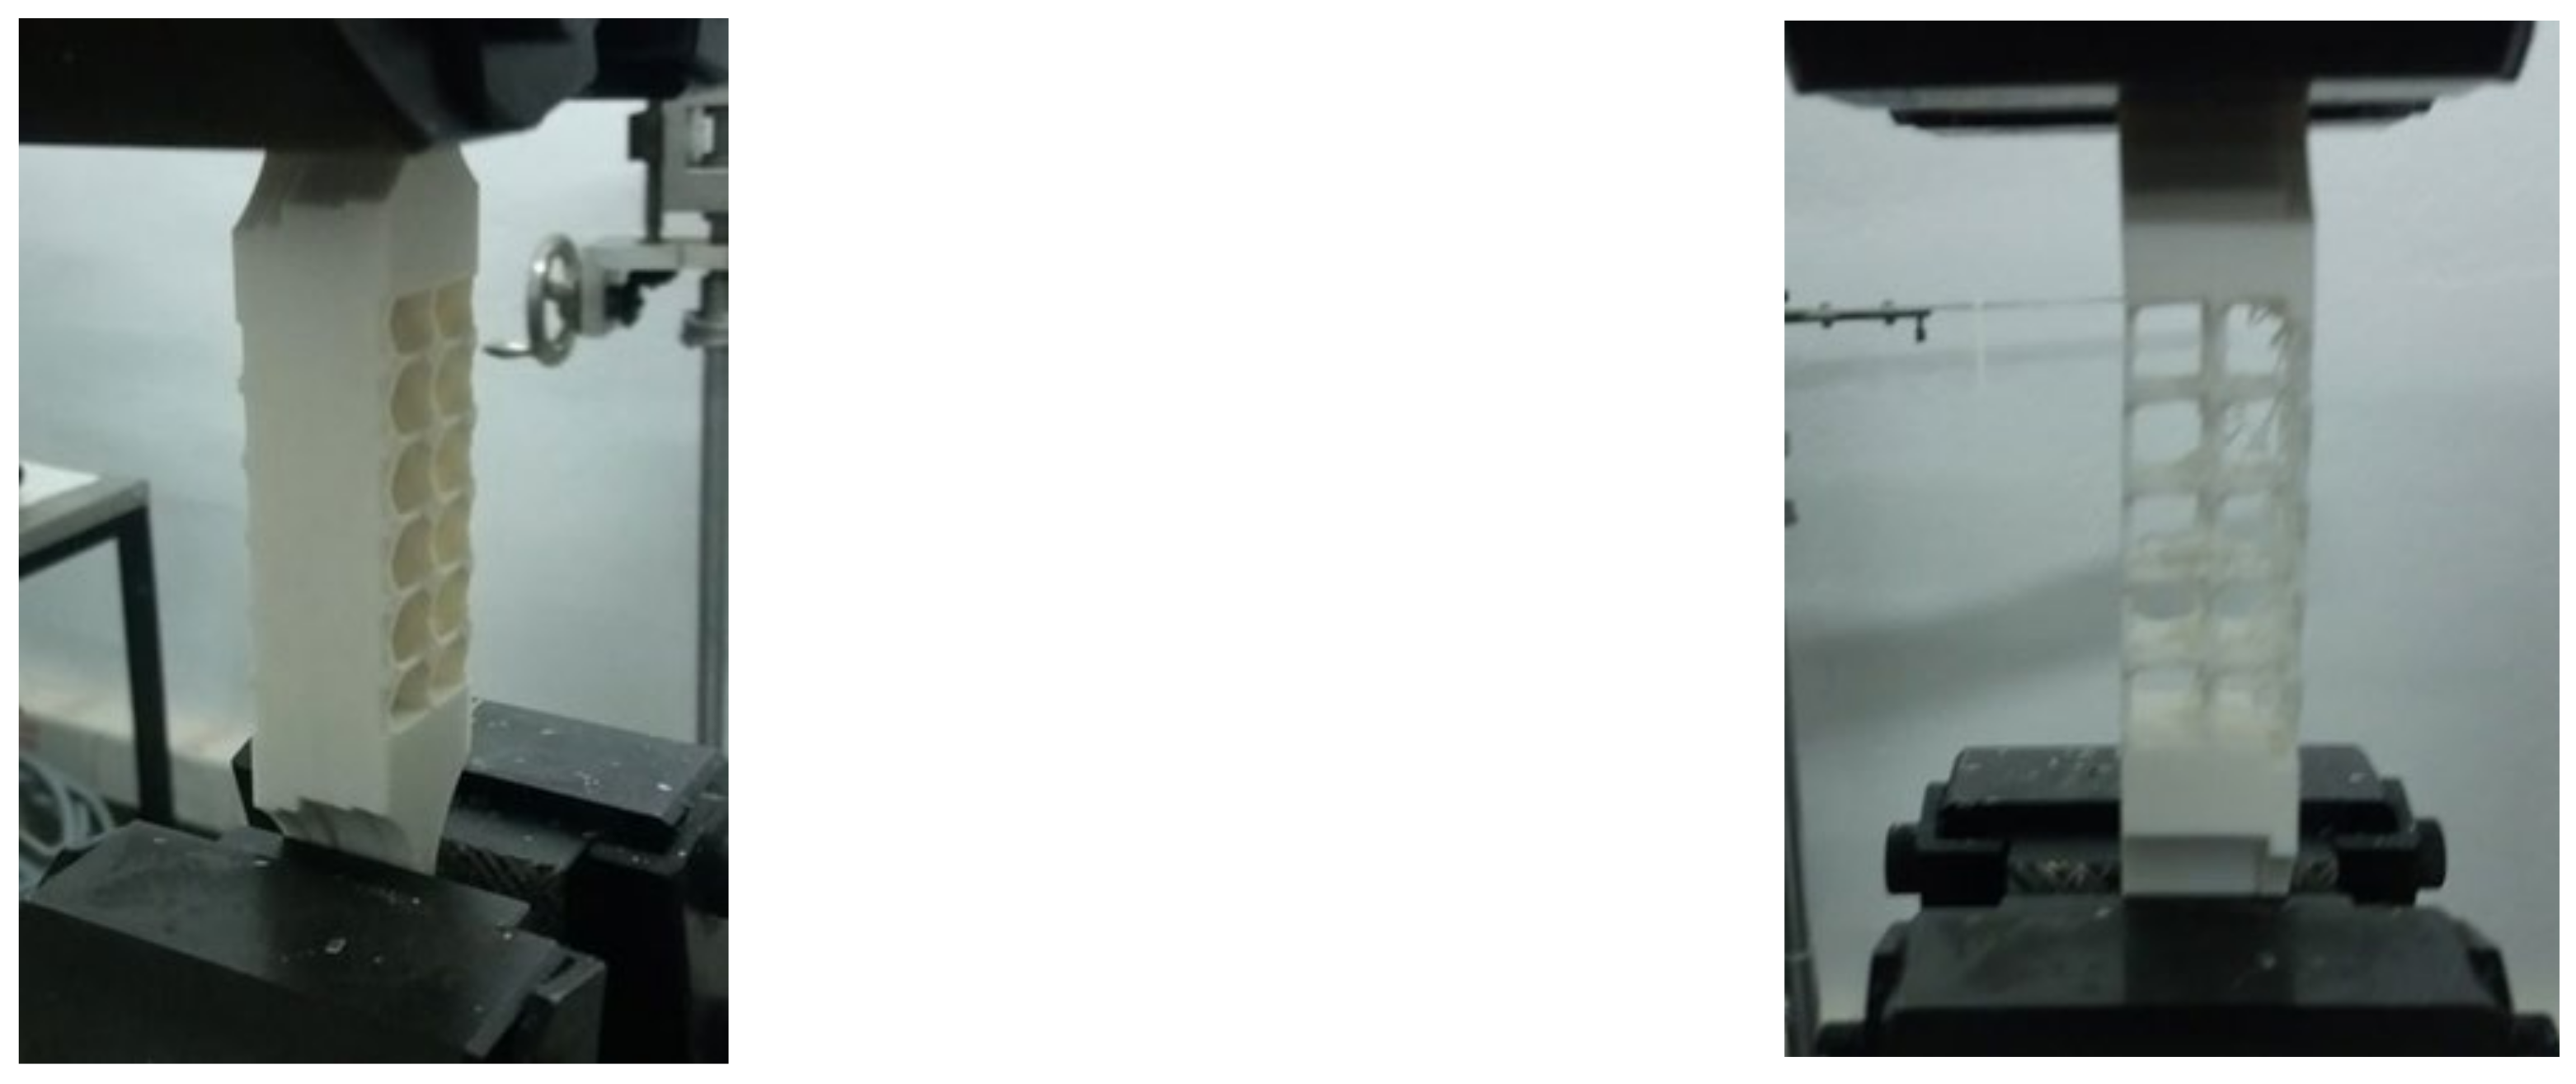
Five specimens of each lattice structures were tested in a compression test with the use of a universal testing machine. The speed of the moving platform was 6 m/min. From the compression test results of each set of five samples, the mean values of the maximum applied force were, for lattice structure #1, 3.613 N and 361 N for lattice structure #2 (Figure 18). The behavior for each lattice is different as the result of their different relative density amounts. The structure #2 relative density is four times larger ( = 0.4) than structure #1 ( = 0.1). As a result of this, structure #2 is much stiffer than structure #1.
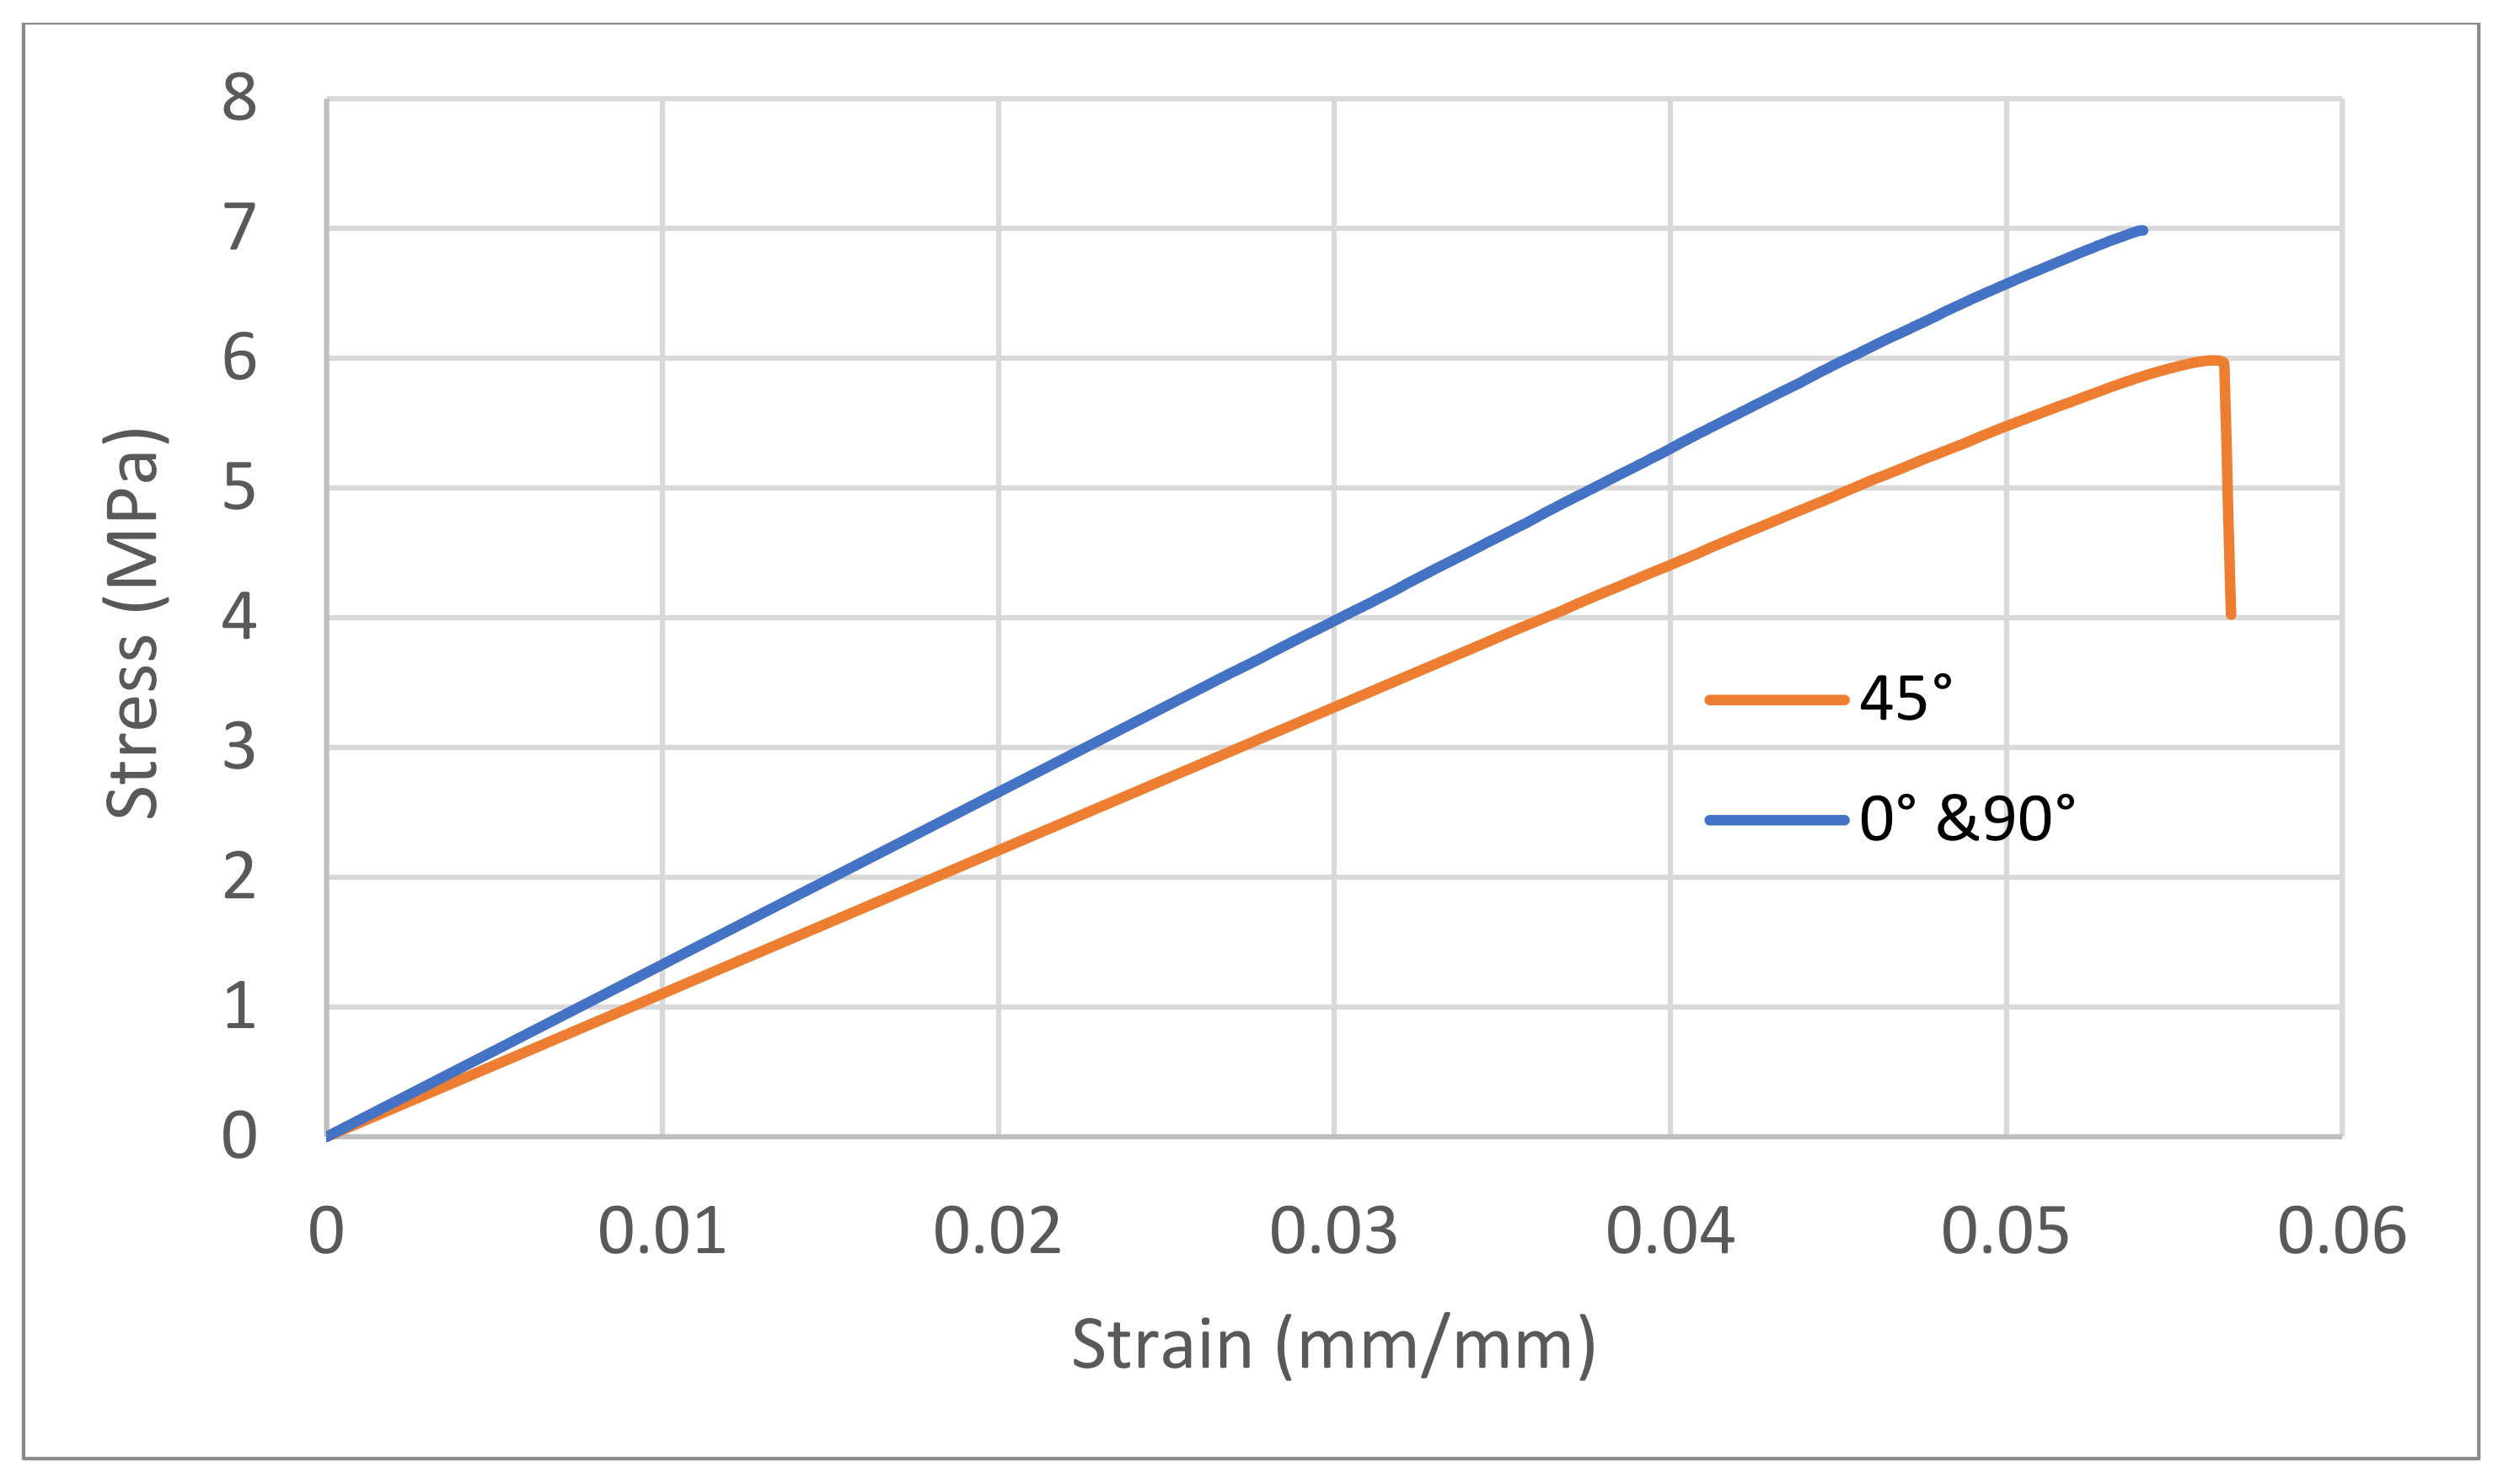
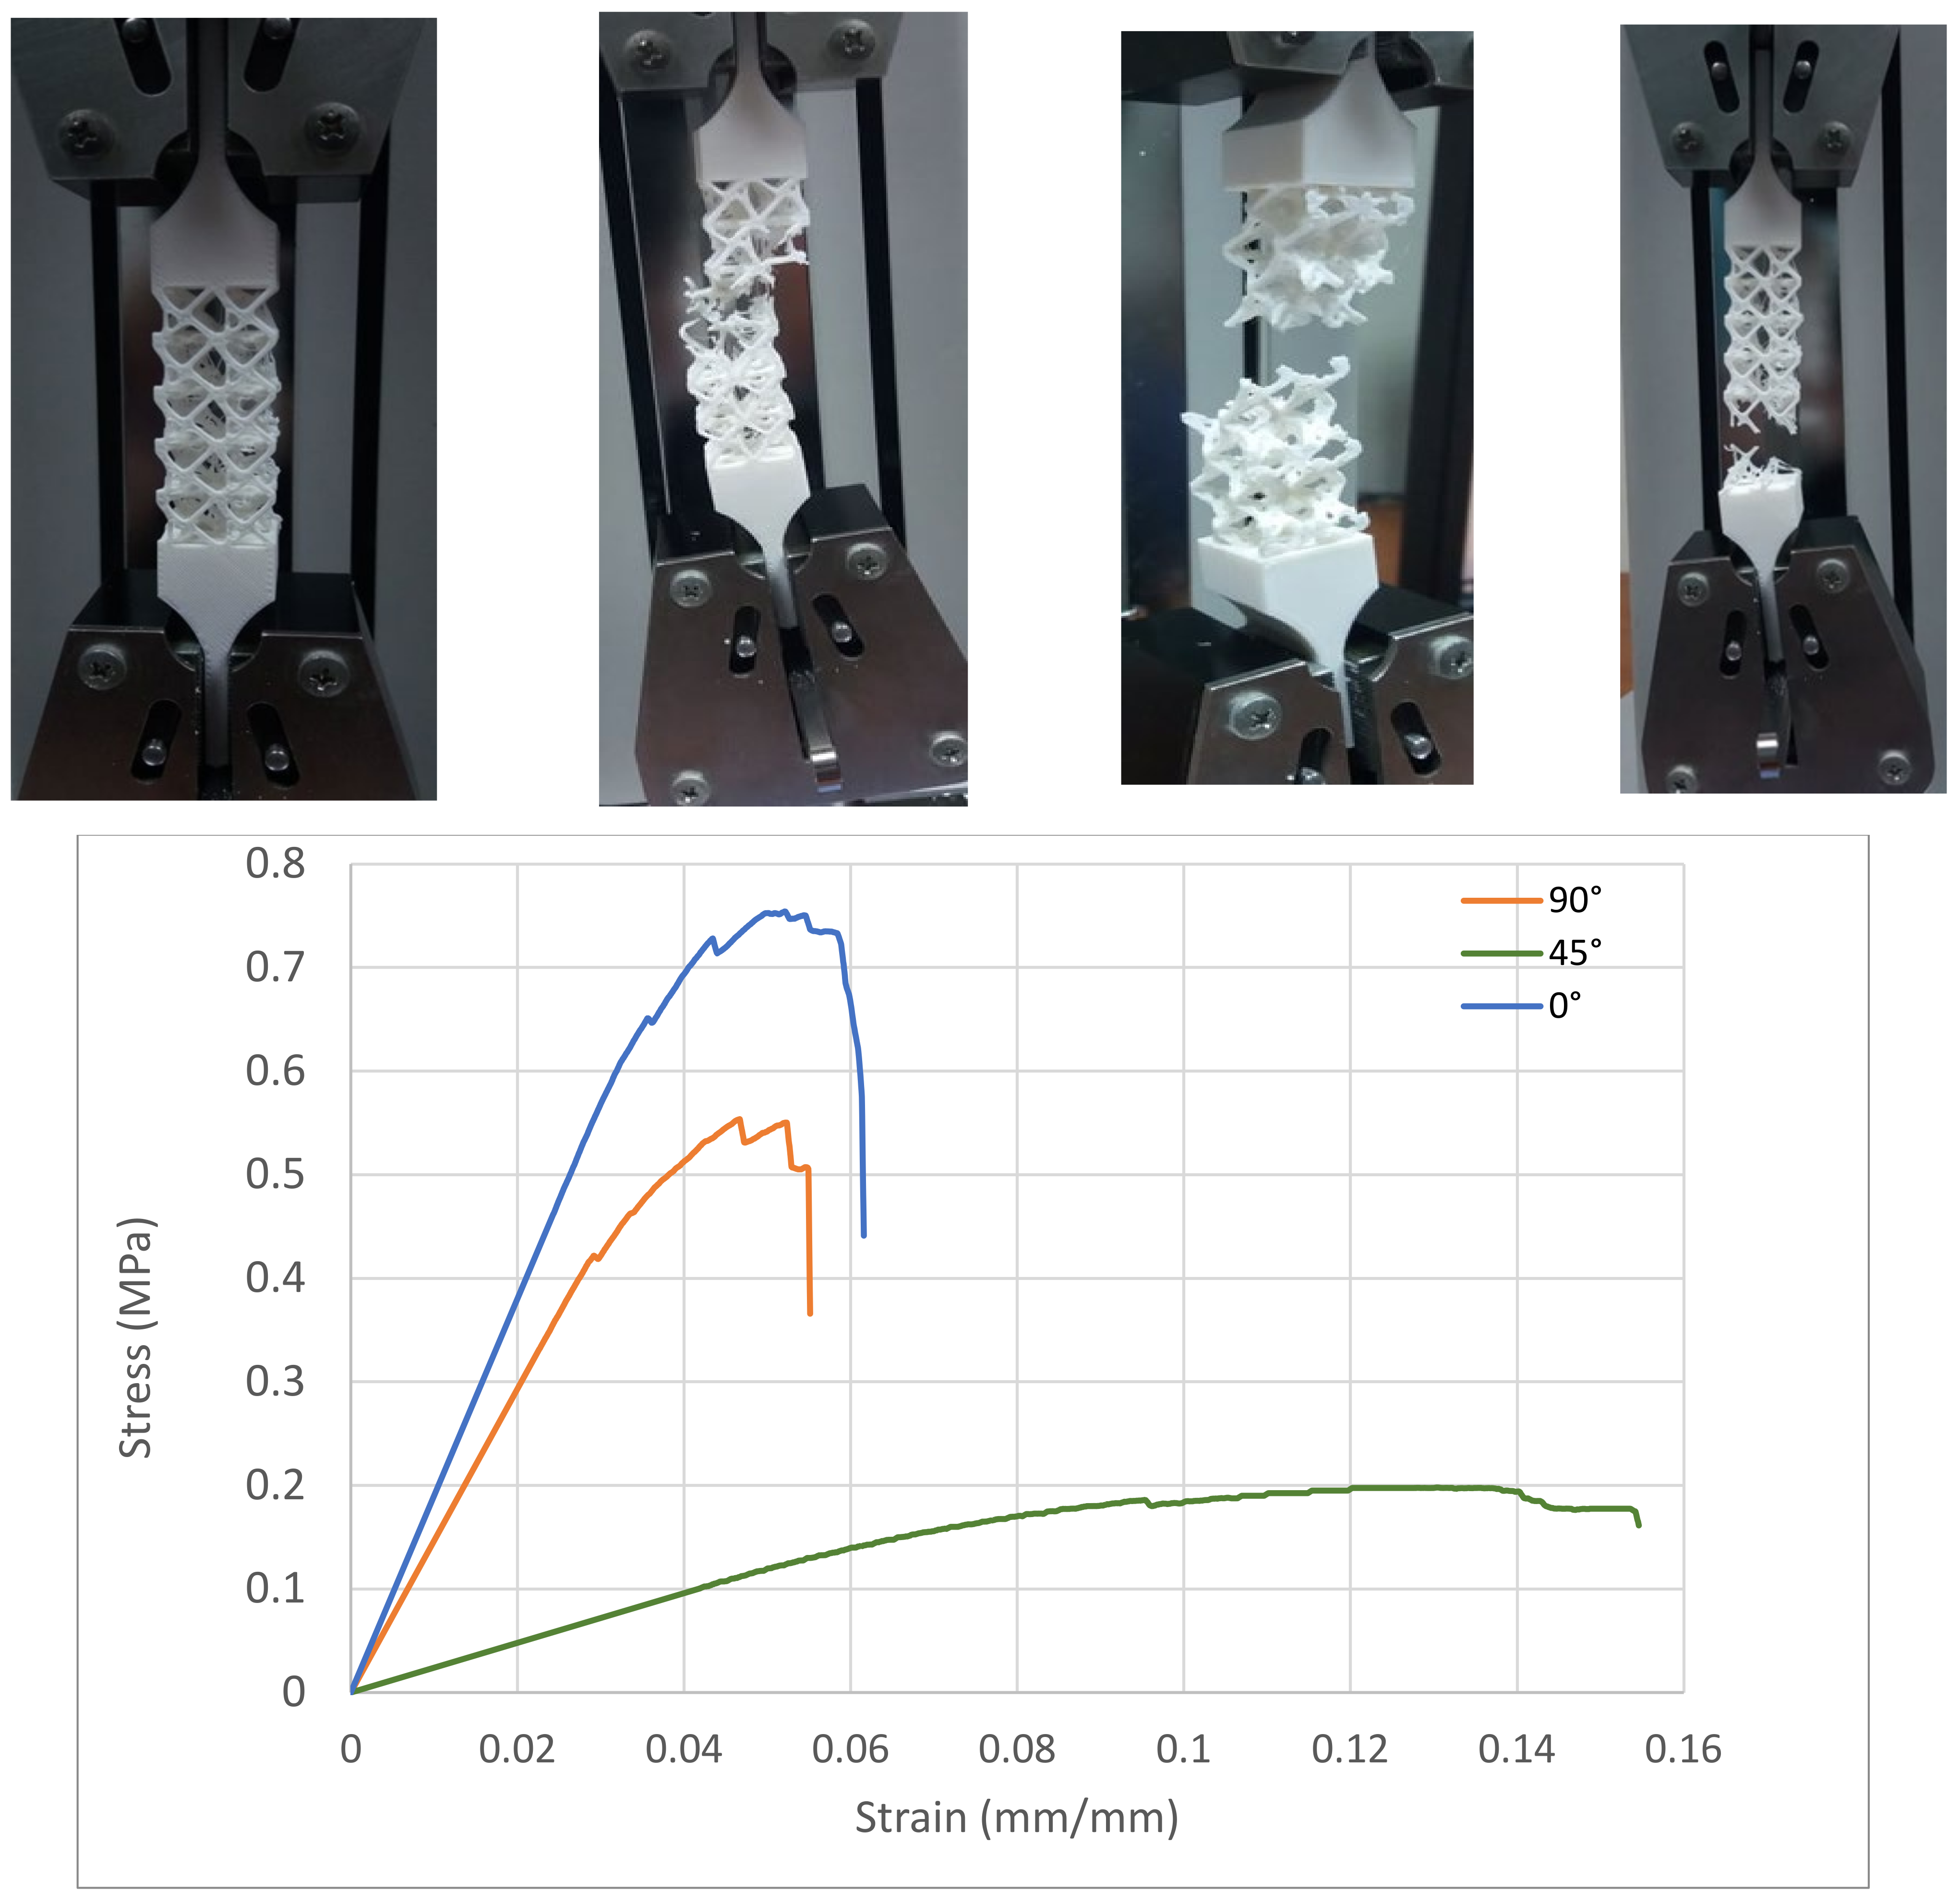
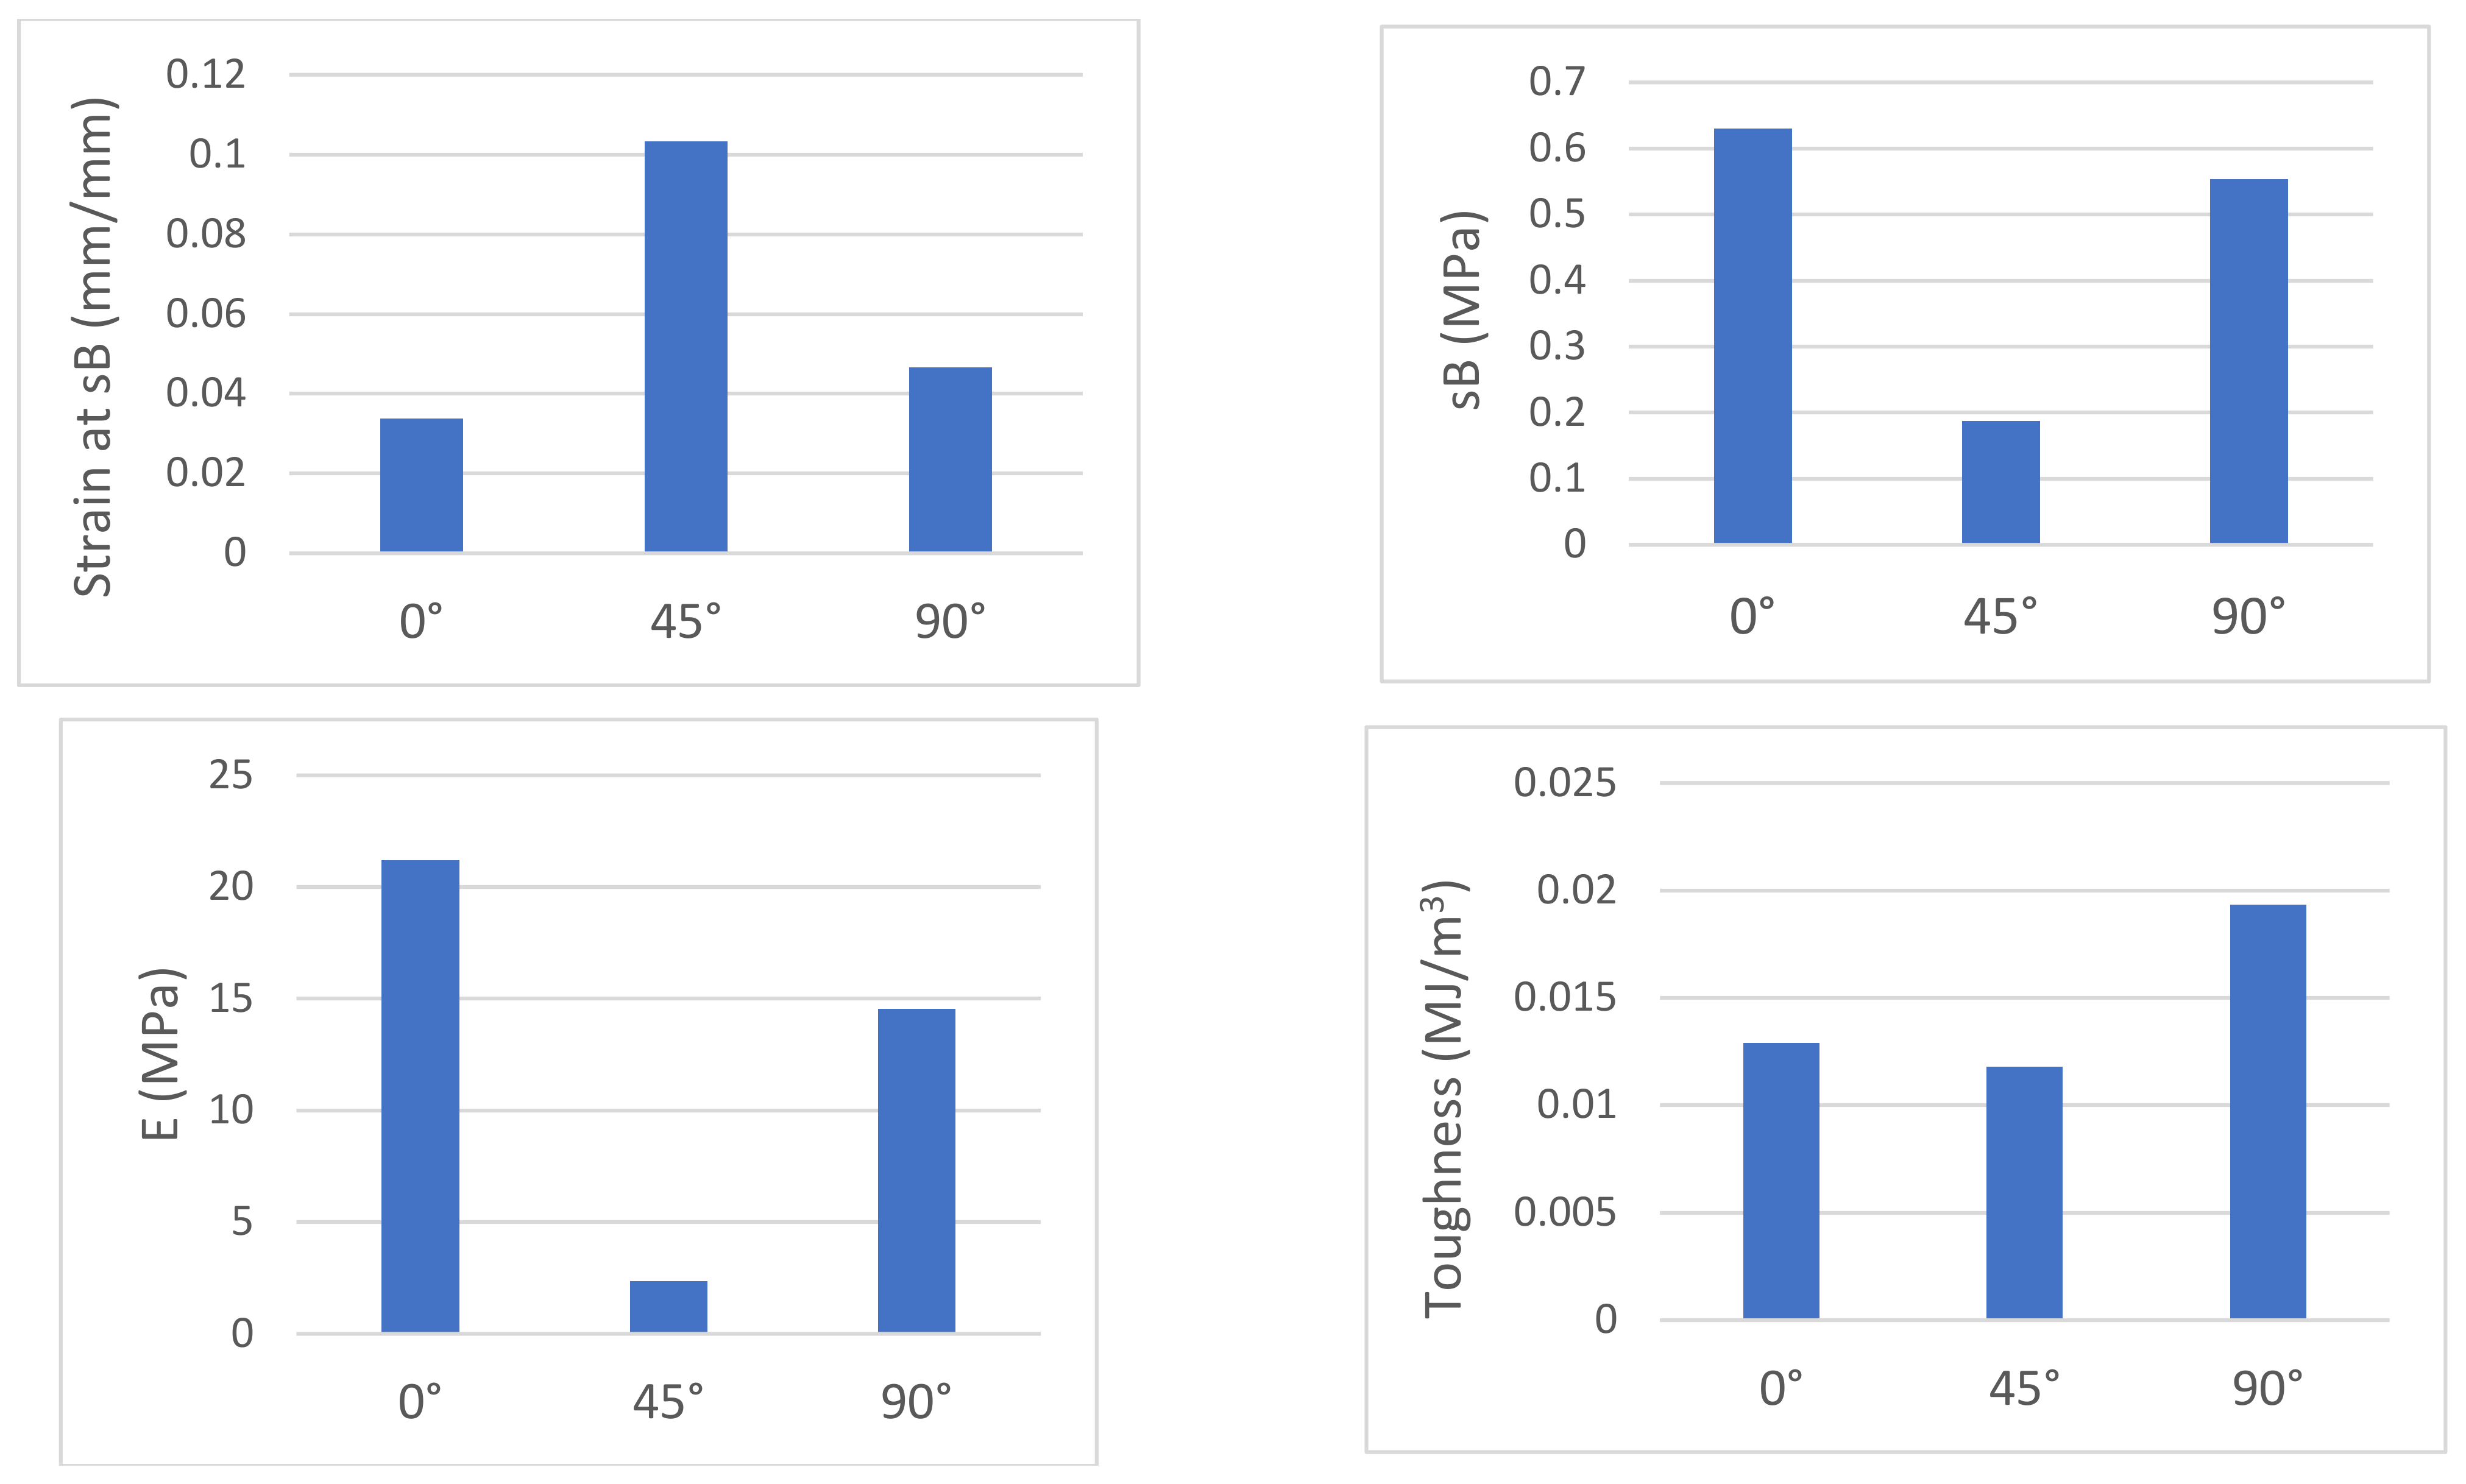
Figure 19, Figure 20, Figure 21 and Figure 22 shows the results of the tensile strength tests. The lattice structure #1 tensile strength force was at least 4500 N for all three specimens. The maximum tensile force for lattice #2 was 301 N, 75 N and 251 N for cell mapping 0°, 45° and 90°, respectively.
6. Discussion
The combination of Additive Manufacturing and Topology Optimization is rapidly advancing in recent years. The outcome optimized structures are often complicated and most times cannot be fabricated with the use of traditional manufacturing methods. More and more researchers develop new methods and algorithms to improve this section. Most of them try to evolve new algorithms and techniques that are usually based on the most well-known methods of SIM, BESO and level set. Anisotropy is not easily integrated into the general topological optimization algorithms, so to evaluate the homogenization of the topology optimized structures is an appropriated step.
In the current manuscript, the SIMP method was adopted to predict the optimal material distribution within the selected cubic volume. Using different boundary conditions, two new microstructures were created as infill in Additive Manufacturing. The TO study has been executed in this paper by taking into account two selected in plane loadings. Other loading cases, if needed for every point of a loaded structure or the use of different zones for the selection of the best microstructures, could lead to the creation of functionally graded lattice structures with varying distributions. This is possible within a multiscale analysis framework [30], provided that the technological restrictions of AM support it. From the TO outcome results, we calculate that the volume mass of the initial cubic domain is reduced significantly for both microstructures.
In most research manuscripts, the researchers present new methods and algorithms based on well-known TO methods to predict the material distribution more accurately and cost-effectively. However, in most cases, the proposed methods do not evaluate other characteristics of the optimized structures, such as isotropy. In the current study, in order to check the isotropy of the optimized lightweight structures, a general homogenization method was used. The proposed microstructures evaluated taking into account the isotropy with calculating the Zener ratio and modulus of elasticity. In addition, the homogenized microstructures strength has been evaluated as infill material in a cantilever model. For the homogenization study, a Representative Volume Element (RVE) was taken for each microstructure. From the results, we can observe that both microstructures have Zener ratios lower or upper to unity. The second microstructure characterized with better and smoother isotropy, and for = 0.25, the Zener ratio is equal to unity, since this Zener ratio did not change significantly.
From the experimental results, it could be seen that, compared to the proposed lattices in the compression test, the significant differences in the stress–strain curve of both structures were the appearance of an elastic–plastic plateau after the initial elastic region and apparent strain behavior. Structure #1 has a significant increased elastic strain behavior and better elastic stability until the fracture point. The stress–strain plateau of structure #2 shows that the lattice inner bonds absorb the energy in a nonuniform way as lattice #1 (Figure 18).
In structure #1, the fracture starts from the top layer of the lattice closer to the moving platform and then fails the middle layer of lattices. The bottom layer of the structures seems to not be affected during the test. On the other hand, the structure #2 failure point starts from the bottom row of the lattice, and after starting the failure of the middle row, the top row of the lattice was affected in the last. This behavior explained the different shapes of the structures, which led to vertical stresses in structure #1 and to shearing stresses in structure #2.
Tensile strength tests help to evaluate and characterize the proposed lattice structures further. The structure #1 lattice is very stiff, and the yield strength is higher than the printing material durability. Therefore, it can be used as the infill in structures where a high durability is demanded; at the same time, the relative density of the proposed structure is 60% lighter than the solid infill. Lattice structure #2, being lighter (relative density 0.1), is an appropriate infill for a lower stress demand structure with very efficient stress–strain behavior. The experimental results show that the mechanical behavior of the lattice structure changes significantly when the cell mapping angle differs.
7. Conclusions
AM enables the fabrication of complex topology optimized lattice structures with high quality and accuracy with the use of mid-range cost 3D printer. The study of new lattices as infill is a significant challenge for the better integration of AM in the industrial production of lightweight and high-strength structures. Unit cells from a solid cubic domain can be designed by using Topology Optimization methods. The mechanical behavior of light and strong lattice structures allows the use of this kind of structure with high efficiency in industrial processing.
The initial choice of optimal microstructures, based on TO, was used as the starting point in the present investigation. Subsequently, the selection of suitable microstructures near to isotropy has been proposed. Further criteria can be used at this step, including the design for AM (with possible supports). Finally, the microstructure is used within a bigger structure by utilizing homogenization procedures and exploiting the options of modern software and hardware. Experimental investigation confirmed the steps of the outlined procedure.
The need of developing a fully parametric decision-making model to control the optimum microstructure under specific design criteria is a keystone for future research. The optimal design can be performed at the level of every point of the structure, leading to functionally graded microstructures.
Author Contributions
Conceptualization, I.N. and G.E.S.; methodology, I.N. and G.E.S.; software, I.N.; validation, I.N. and G.E.S.; formal analysis, I.N. and G.E.S.; investigation, I.N. and G.E.S.; resources, I.N. and G.E.S.; data curation, I.N. and G.E.S.; writing—original draft preparation, I.N. and G.E.S.; writing—review and editing, I.N. and G.E.S.; visualization, I.N.; supervision, G.E.S.; project administration, I.N.; funding acquisition, I.N. and G.E.S. All authors have read and agreed to the published version of the manuscript.
Funding
This research received no external funding.
Institutional Review Board Statement
Not applicable.
Informed Consent Statement
Not applicable.
Data Availability Statement
Not applicable.
Acknowledgments
We thank the nTopology software company for providing us with the academic licenses of nTopology software.
Conflicts of Interest
The authors declare no conflict of interest.
References
- Bikas, H.; Stavropoulos, P.; Chryssolouris, G. Additive manufacturing methods and modelling approaches: A critical review. Int. J. Adv. Manuf. Technol. 2015, 83, 389–405. [Google Scholar] [CrossRef] [Green Version]
- Hajare, D.M.; Gajbhiye, T.S. Additive manufacturing (3D printing): Recent progress on advancement of materials and challenges. Mater. Today Proc. 2022, 58, 736–743. [Google Scholar] [CrossRef]
- Ntintakis, I.; Stavroulakis, G.E.; Plakia, N. Topology Optimization by the Use of 3D Printing Technology in the Product Design Process. HighTech Innov. J. 2020, 1, 161–171. [Google Scholar] [CrossRef]
- Ntintakis, I.; Stavroulakis, G.E.; Sfakianakis, G.; Fiotodimitrakis, N. Utilizing Generative Design for Additive Manufacturing. In Proceedings of the Recent Advances in Manufacturing Processes and Systems; Dave, H.K., Dixit, U.S., Nedelcu, D., Eds.; Springer: Singapore, 2022; pp. 977–989. [Google Scholar]
- Wiberg, A.; Persson, J.; Ölvander, J. Design for Additive Manufacturing—A Review of Available Design Methods and Software. Rapid Prototyp. J. 2019, 25, 1080–1094. [Google Scholar] [CrossRef] [Green Version]
- Vaneker, T.; Bernard, A.; Moroni, G.; Gibson, I.; Zhang, Y. Design for additive manufacturing: Framework and methodology. CIRP Ann. 2020, 69, 578–599. [Google Scholar] [CrossRef]
- Suárez, A.; Veiga, F.; Bhujangrao, T.; Aldalur, E. Study of the Mechanical Behavior of Topologically Optimized Arc Wire Direct Energy Deposition Aerospace Fixtures. J. Mater. Eng. Perform. 2022, 1–13. [Google Scholar] [CrossRef]
- Veiga, F.; Suárez, A.; Aldalur, E.; Goenaga, I.; Amondarain, J. Wire Arc Additive Manufacturing Process for Topologically Optimized Aeronautical Fixtures. 3D Print. Addit. Manuf. 2021. [Google Scholar] [CrossRef]
- Li, X.; Ashraf, M.; Li, H.; Zheng, X.; Wang, H.; Al-Deen, S.; Hazell, P.J. An Experimental Investigation on Parallel Bamboo Strand Lumber Specimens under Quasi Static and Impact Loading. Constr. Build. Mater. 2019, 228, 116724. [Google Scholar] [CrossRef]
- Gong, C.; Bai, Z.; Lv, J.; Zhang, L. Crashworthiness Analysis of Bionic Thin-Walled Tubes Inspired by the Evolution Laws of Plant Stems. Thin-Walled Struct. 2020, 157, 107081. [Google Scholar] [CrossRef]
- Ghazlan, A.; Nguyen, T.; Ngo, T.; Linforth, S.; Le, V.T. Performance of a 3D Printed Cellular Structure Inspired by Bone. Thin-Walled Struct. 2020, 151, 106713. [Google Scholar] [CrossRef]
- Plocher, J.; Panesar, A. Review on Design and Structural Optimisation in Additive Manufacturing: Towards next-Generation Lightweight Structures. Mater. Des. 2019, 183, 108164. [Google Scholar] [CrossRef]
- Seharing, A.; Azman, A.H.; Abdullah, S. A Review on Integration of Lightweight Gradient Lattice Structures in Additive Manufacturing Parts. Adv. Mech. Eng. 2020, 12, 1687814020916951. [Google Scholar] [CrossRef]
- Jiang, J.; Ma, Y. Path Planning Strategies to Optimize Accuracy, Quality, Build Time and Material Use in Additive Manufacturing: A Review. Micromachines 2020, 11, 633. [Google Scholar] [CrossRef]
- Feng, J.; Fu, J.; Lin, Z.; Shang, C.; Niu, X. Layered infill area generation from triply periodic minimal surfaces for additive manufacturing. Comput. Des. 2018, 107, 50–63. [Google Scholar] [CrossRef]
- Podroužek, J.; Marcon, M.; Ninčević, K.; Wan-Wendner, R. Bio-Inspired 3D Infill Patterns for Additive Manufacturing and Structural Applications. Materials 2019, 12, 499. [Google Scholar] [CrossRef] [Green Version]
- Bean, P.; Lopez-Anido, R.A.; Vel, S. Numerical Modeling and Experimental Investigation of Effective Elastic Properties of the 3D Printed Gyroid Infill. Appl. Sci. 2022, 12, 2180. [Google Scholar] [CrossRef]
- Hoang, V.-N.; Tran, P.; Nguyen, N.-L.; Hackl, K.; Nguyen-Xuan, H. Adaptive Concurrent Topology Optimization of Coated Structures with Nonperiodic Infill for Additive Manufacturing. Comput.-Aided Des. 2020, 129, 102918. [Google Scholar] [CrossRef]
- Wu, J.; Wang, C.C.L.; Zhang, X.; Westermann, R. Self-Supporting Rhombic Infill Structures for Additive Manufacturing. Comput.-Aided Des. 2016, 80, 32–42. [Google Scholar] [CrossRef]
- Liu, J.; Gaynor, A.T.; Chen, S.; Kang, Z.; Suresh, K.; Takezawa, A.; Li, L.; Kato, J.; Tang, J.; Wang, C.C.L.; et al. Current and future trends in topology optimization for additive manufacturing. Struct. Multidiscip. Optim. 2018, 57, 2457–2483. [Google Scholar] [CrossRef] [Green Version]
- Sigmund, O.; Maute, K. Topology Optimization Approaches. Struct. Multidisc. Optim. 2013, 48, 1031–1055. [Google Scholar] [CrossRef]
- Tang, Y.; Kurtz, A.; Zhao, Y.F. Bidirectional Evolutionary Structural Optimization (BESO) Based Design Method for Lattice Structure to Be Fabricated by Additive Manufacturing. Comput.-Aided Des. 2015, 69, 91–101. [Google Scholar] [CrossRef] [Green Version]
- Wang, M.Y.; Wang, X.; Guo, D. A Level Set Method for Structural Topology Optimization. Comput. Methods Appl. Mech. Eng. 2003, 192, 227–246. [Google Scholar] [CrossRef]
- Lee, J.; Kwon, C.; Yoo, J.; Min, S.; Nomura, T.; Dede, E.M. Design of Spatially-Varying Orthotropic Infill Structures Using Multiscale Topology Optimization and Explicit de-Homogenization. Addit. Manuf. 2021, 40, 101920. [Google Scholar] [CrossRef]
- Bendsøe, M.P. Optimal shape design as a material distribution problem. Struct. Optim. 1989, 1, 193–202. [Google Scholar] [CrossRef]
- Zhu, J.; Zhou, H.; Wang, C.; Zhou, L.; Yuan, S.; Zhang, W. A Review of Topology Optimization for Additive Manufacturing: Status and Challenges. Chin. J. Aeronaut. 2021, 34, 91–110. [Google Scholar] [CrossRef]
- Sokół, T.; Rozvany, G.I.N. Exact Truss Topology Optimization for External Loads and Friction Forces. Struct. Multidisc. Optim. 2013, 48, 853–857. [Google Scholar] [CrossRef]
- Eschenauer, H.A.; Olhoff, N. Topology Optimization of Continuum Structures: A Review. Appl. Mech. Rev. 2001, 54, 331–390. [Google Scholar] [CrossRef]
- Rozvany, G.I.N. A Critical Review of Established Methods of Structural Topology Optimization. Struct. Multidisc. Optim. 2009, 37, 217–237. [Google Scholar] [CrossRef]
- Rozvany, G.I.N.; Bendso̸e, M.P.; Kirsch, U. Layout Optimization of Structures. Appl. Mech. Rev. 1995, 48, 41–119. [Google Scholar] [CrossRef]
- Zener, C.M.; Siegel, S. Elasticity and Anelasticity of Metals. J. Phys. Chem. 1949, 53, 1468. [Google Scholar] [CrossRef]
- Somnic, J.; Jo, B.W. Status and Challenges in Homogenization Methods for Lattice Materials. Materials 2022, 15, 605. [Google Scholar] [CrossRef] [PubMed]
- Drosopoulos, G.A.; Stavroulakis, E.E. Nonlinear Mechanics for Composite Heterogeneous Structures; CRC Press: Boca Raton, FL, USA, 2022. [Google Scholar]
- Chatzigeorgiou, G.; Meraghni, F.; Charalambakis, N. Multiscale Modeling Approaches for Composites; Elsevier: Amsterdam, The Netherlands, 2022. [Google Scholar]
- Rehme, O.; Emmelmann, C. Rapid manufacturing of lattice structures with selective laser melting. In Laser-Based Micropackaging; International Society for Optics and Photonics: San Jose, CA, USA, 2006; Volume 6107, p. 61070K. [Google Scholar]
- Kaminakis, N.T.; Drosopoulos, G.A.; Stavroulakis, G.E. Design and Verification of Auxetic Microstructures Using Topology Optimization and Homogenization. Arch. Appl. Mech. 2015, 85, 1289–1306. [Google Scholar] [CrossRef]
- Tancogne-Dejean, T.; Diamantopoulou, M.; Gorji, M.B.; Bonatti, C.; Mohr, D. 3D Plate-Lattices: An Emerging Class of Low-Density Metamaterial Exhibiting Optimal Isotropic Stiffness. Adv. Mater. 2018, 30, 1803334. [Google Scholar] [CrossRef] [PubMed]
Figure 1.
Adopted methodology flowchart.

Figure 2.
Represented Volume Element for a square unit cell.

Figure 3.
Intermediate shapes. Different iteration stages (b–e) from the initial design area (a) of Topology Optimized ‘structure #1’: (a) design area, (b) step 5, (c) step 10, (d) step 18 and (e) step 23.
Figure 3.
Intermediate shapes. Different iteration stages (b–e) from the initial design area (a) of Topology Optimized ‘structure #1’: (a) design area, (b) step 5, (c) step 10, (d) step 18 and (e) step 23.

Figure 4.
Iterations steps (a–e) of the Topology Optimization study for ‘structure 2’: (a) design area, (b) step 10, (c) step 20, (d) step 25 and (e) step 33.
Figure 4.
Iterations steps (a–e) of the Topology Optimization study for ‘structure 2’: (a) design area, (b) step 10, (c) step 20, (d) step 25 and (e) step 33.

Figure 5.
(a) Volume fraction per each step (b), and the value of the volume fraction constraints on each iteration step of ‘structure #1’.
Figure 5.
(a) Volume fraction per each step (b), and the value of the volume fraction constraints on each iteration step of ‘structure #1’.

Figure 6.
(a) Volume fraction per each step (b), and volume fraction constraints on each iteration step of ‘structure #2’.
Figure 6.
(a) Volume fraction per each step (b), and volume fraction constraints on each iteration step of ‘structure #2’.

Figure 7.
(a) Refined unit cell structures. (b) Mapping of the 5 × 5 × 5 lattice structures.

Figure 8.
Outline dimensions of unit cells and lattice models for the compression test of (a) structure #1 with a volume fraction constraint = 0.4 and (b) structure #2 with a volume fraction constraint = 0.1.
Figure 8.
Outline dimensions of unit cells and lattice models for the compression test of (a) structure #1 with a volume fraction constraint = 0.4 and (b) structure #2 with a volume fraction constraint = 0.1.

Figure 9.
Fabricated ABS specimens without supports for both structures for the tensile strength test with a relative density of 0.4 for structure #1 and 0.1 for structure #2.
Figure 9.
Fabricated ABS specimens without supports for both structures for the tensile strength test with a relative density of 0.4 for structure #1 and 0.1 for structure #2.

Figure 10.
Outline dimensions of the tensile strength specimens (a,b), each lattice structure fabricated with 0°, 45° and 90° angles of single unit cell mapping.
Figure 10.
Outline dimensions of the tensile strength specimens (a,b), each lattice structure fabricated with 0°, 45° and 90° angles of single unit cell mapping.

Figure 11.
Preparation and printing of the tensile strength samples with 0°, 45° and 90° angles.

Figure 12.
Relative density against the volume fraction of homogenized lattices.

Figure 13.
Maximum Young’s modulus vs. the relative density for both lattice structures.

Figure 14.
Zener ratio values for different relative densities of structure #1.

Figure 15.
Zener ratio values of different relative densities structure #2.

Figure 16.
The elastic moduli of both homogenized lattices in different relative densities ().

Figure 17.
Displacement, strain and Von mises stress of homogenized structures #1 and #2 for different values of relative density.
Figure 17.
Displacement, strain and Von mises stress of homogenized structures #1 and #2 for different values of relative density.


Figure 18.
Specimens’ behavior during the compression test: (a) lattice structure #1 and (b) lattice structure #2.
Figure 18.
Specimens’ behavior during the compression test: (a) lattice structure #1 and (b) lattice structure #2.

Figure 19.
Samples behavior on the tensile strength test, and stress/strain curve of lattice structure #1 for 0°, 45° and 90° angles.
Figure 19.
Samples behavior on the tensile strength test, and stress/strain curve of lattice structure #1 for 0°, 45° and 90° angles.


Figure 20.
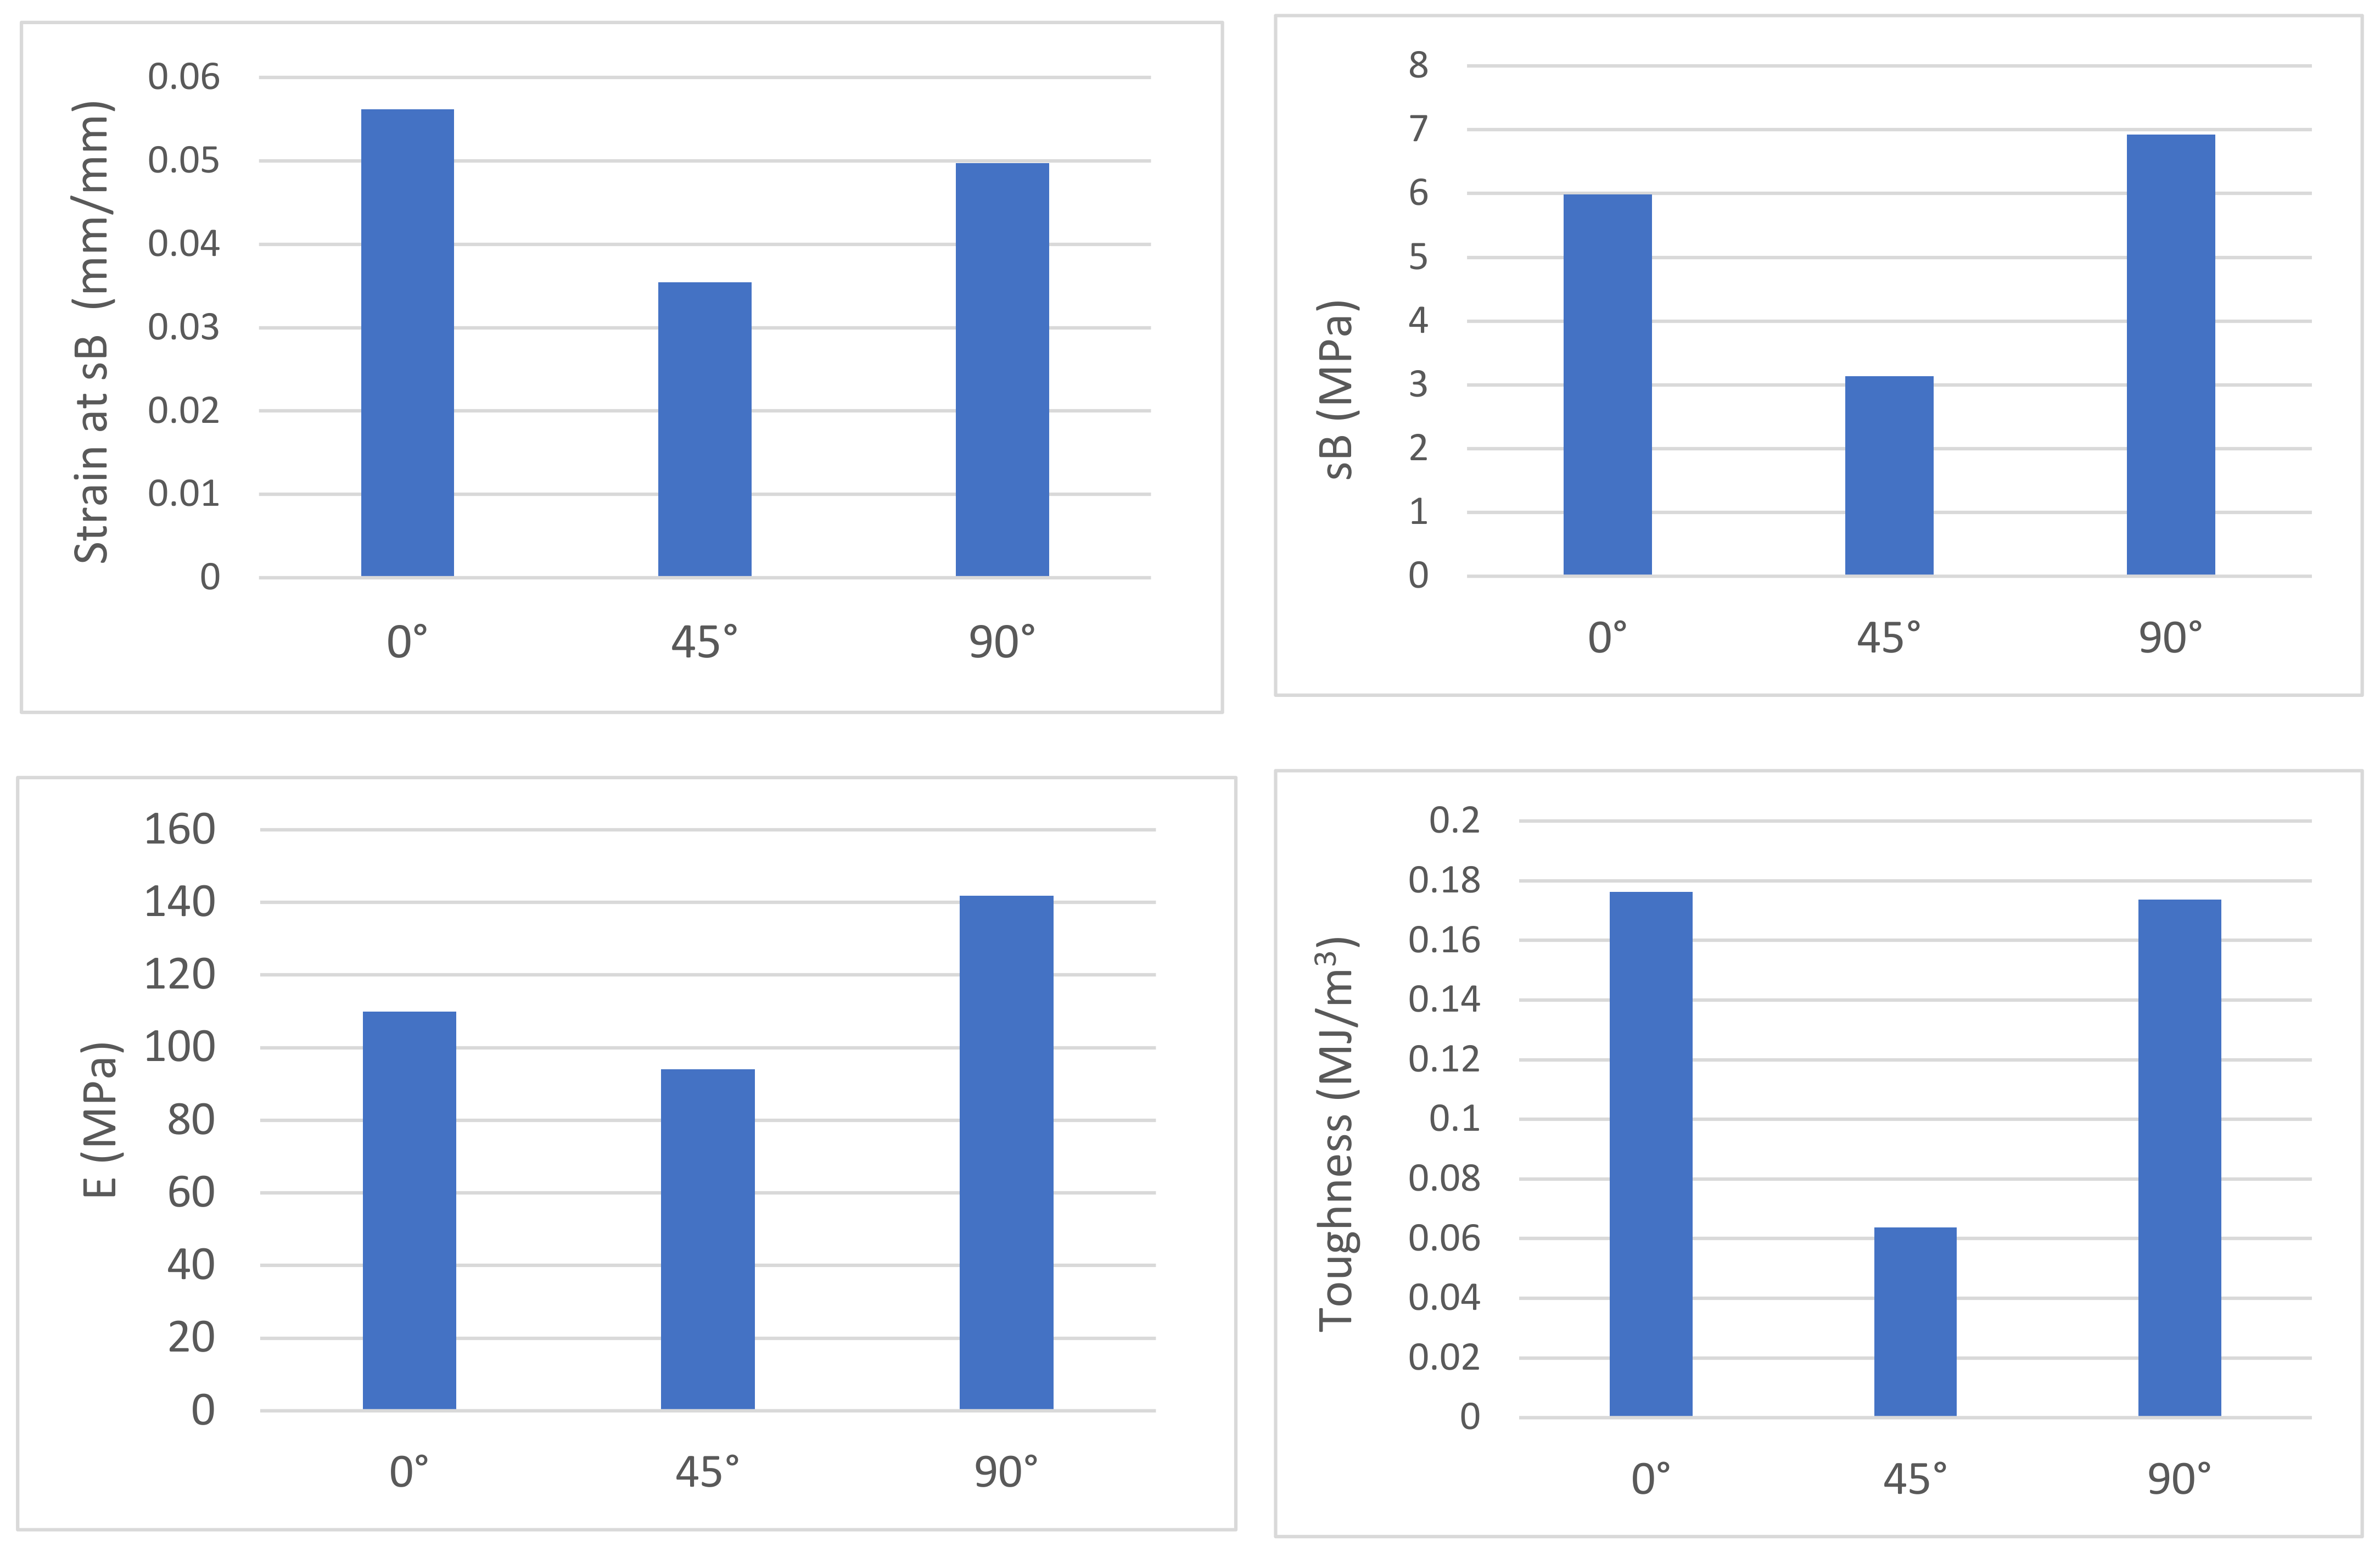
Strain at sB, Modulus of Elasticity, sB value and toughness of lattice structure #1 for different cell mapping angles.
Figure 20.
Strain at sB, Modulus of Elasticity, sB value and toughness of lattice structure #1 for different cell mapping angles.

Figure 21.
Samples behavior on the tensile strength test, and stress/strain curve of lattice structure #2 for 0°, 45° and 90° angles.
Figure 21.
Samples behavior on the tensile strength test, and stress/strain curve of lattice structure #2 for 0°, 45° and 90° angles.

Figure 22.
Strain at sB, Modulus of Elasticity, sB value and toughness of lattice structure #2 for different cell mapping angles.
Figure 22.
Strain at sB, Modulus of Elasticity, sB value and toughness of lattice structure #2 for different cell mapping angles.


Table 1.
Linear isotropic material properties.
| Young’s Modulus (MPa) | Density (kg/mm3) | Poisson’s Ratio |
|---|---|---|
| 187,000 | 0.0079 | 0.33 |
Publisher’s Note: MDPI stays neutral with regard to jurisdictional claims in published maps and institutional affiliations. |
© 2022 by the authors. Licensee MDPI, Basel, Switzerland. This article is an open access article distributed under the terms and conditions of the Creative Commons Attribution (CC BY) license (https://creativecommons.org/licenses/by/4.0/).
Share and Cite
MDPI and ACS Style
Ntintakis, I.; Stavroulakis, G.E. Infill Microstructures for Additive Manufacturing. Appl. Sci. 2022, 12, 7386. https://doi.org/10.3390/app12157386
AMA Style
Ntintakis I, Stavroulakis GE. Infill Microstructures for Additive Manufacturing. Applied Sciences. 2022; 12(15):7386. https://doi.org/10.3390/app12157386
Chicago/Turabian StyleNtintakis, Ioannis, and Georgios E. Stavroulakis. 2022. "Infill Microstructures for Additive Manufacturing" Applied Sciences 12, no. 15: 7386. https://doi.org/10.3390/app12157386
Note that from the first issue of 2016, this journal uses article numbers instead of page numbers. See further details here.