Article

Using Convolutional Neural Networks in the Development of a Water Pipe Leakage and Location Identification System

1
Material and Chemical Research Laboratories, Industrial Technology Research Institute, Hsinchu 310, Taiwan
2
Department of Mechanical and Computer-Aided Engineering, National Formosa University, Yunlin 632, Taiwan
3
Taiwan Water Corporationy, Taoyuan 324, Taiwan
*
Author to whom correspondence should be addressed.
Appl. Sci. 2022, 12(16), 8034; https://doi.org/10.3390/app12168034
Submission received: 13 July 2022 / Revised: 6 August 2022 / Accepted: 9 August 2022 / Published: 11 August 2022
(This article belongs to the Special Issue Human-Computer Interactions 2.0)

Abstract

:
To overcome the challenges brought about by abnormal weather and the growing industrial water consumption in Taiwan, the Taiwanese government is transporting water from the northern to the southern part of the country to help with droughts occurring in Taoyuan and Hsinchu. In addition, the government invested NTD 2.78 billion to build the backup water pipelines necessary in Taiyuan and Hsinchu, which help ensure a stable and safe water supply required for regional economic development. The construction adheres to the four major strategic goals of “open source, throttling, dispatch, and backup”. However, the leakage rate of water pipelines remains high. To help with large-scale right-of-way applications and the timeliness of emergency repairs, establishing a system that can detect the locations of leakages is vital. This study intended to apply artificial intelligence (AI) deep learning to develop a water pipe leakage and location identification system. This research established an intelligent sound-assisted water leak identification system, developed and used a localized AI water leak diagnostic instrument to capture on-site dynamic audio, and integrated Internet of Things (IoT) technology to simultaneously identify and locate the leakage. Actual excavation verification results show that the accuracy of the convolutional neural network (CNN) after training is greater than 95%, and the average absolute error calculated between the output data and the input data of the encoder is 0.1021, confirming that the system has high reliability and can reduce the cost of excavation by 26%.

1. Introduction

Affected by the United States–China trade war and the global pandemic, the global industrial supply chain is being restructured at an accelerated pace. Therefore, many high-end products are moving back to Taiwan for manufacturing. The manufacturing of these high-end products requires a considerable amount of water. For instance, Taiwan Semiconductor Manufacturing Company consumes about 215,000 tons of water per day to manufacture 5 and 3 nm advanced transistors in Tainan Science Park, their main base for production. It is estimated that the water demand will increase to 325,000 tons per day by 2026, and the average water consumption rate will increase by more than 1.51%. This phenomenon can be expected to increase the average industrial water consumption to more than 1.51% in the future. Taiwan’s total annual water consumption is 16.713 billion tons, of which 9.98% is industrial usage, and 49.81% of industrial water consumption comes from the tap water supply system, accounting for 5.06% of the total water consumption. From the GDP of 2018, which was 2.75%, every 1% of water consumption has indirectly contributed to 0.54% of economic growth. Therefore, tap water is an important resource for domestic economic development. However, owing to the abnormal climate, Taiwan’s industrial water usage has continued to increase in recent years. The Taiwanese government is transporting water from the northern to the southern part of the country to help with droughts occurring in Taoyuan and Hsinchu. In addition, they have invested NTD 2.78 billion to build the necessary backup water pipelines, demonstrating the importance of water resources management. The current domestic annual water leakage rate is 14.25%. Suppose the leakage rate of water pipes inside and outside factories can be effectively reduced. In that case, it is estimated that domestic water resources can be strengthened and saved, and domestic economic growth can be stabilized.
Most leaking water pipes are found in the urban underground pipe network. The main pipe is used to transport water, and smaller pipes are used to distribute water to users and factories. Hence, the distribution of the pipes is dendritic. At present, it is possible to locate and repair leaking pipes via a program to reduce water loss. A popular technique developed by Fuchs and Riehle [1] over the past 20 years can be used to locate leaks through acoustic/vibration signal analysis. At two access points on either side of the suspected leak location, accelerometers or hydrophones are used to collect vibrational or acoustic signals. Related technology is used to estimate the time delay between two acquisition signals, and the method is commonly used to determine the leakage location in buried pipelines [1,2,3,4]. For the technique to be effective, the propagation velocity of the acoustic signal and the exact pipe length must be known in advance. The study of sound waves propagating in metal or plastic pipes has received much attention for many years. The dispersion propagation model of buried underground water pipelines was studied [5,6], and the results were explained physically. Muggleton et al. [7] developed a low-frequency theoretical model of buried liquid-filled pipelines for predicting wave velocity and validated them experimentally in the case of evacuated pipelines and pipelines buried in soil or water [8,9]. The pipe conditions—such as pipe thickness, material properties, and surrounding media—are known from these studies, and the propagation velocity can be calculated using the corresponding theoretical model. In practice, if some pipeline conditions are unknown, the propagation velocity can be measured in situ using known simulated leaks, for example, by releasing water from a fire hydrant [10]. Furthermore, although the Taiwan Water Corporation constructs a community pipe network for the water pipeline system in each region and determines whether there are water leaks through the monitoring of changes in pressure and flow, the cost of this method is high owing to the need to install water meters (pressure gauges and flow meters). At present, the pipelines in urban areas are generally PVC pipelines, and the pipeline pressure is below 2 kg/cm2. The leakage signal rapidly decays, and it is difficult to effectively monitor long-distance leakages, unlike in a steel pipe system. The community pipeline network can only provide information on whether the area contains a leak and cannot provide the exact location of the leak for excavation and repair. Therefore, in practice, it remains necessary for experienced leak detectors to conduct on-site leak detection in the area to determine the location of the leak. However, when conducting sound-based leak detection on-site, interference from ambient sound often causes the leak detector to misjudge, resulting in errors in leak detection and lowering leak repair efficiency. Take the international manufacturers of leak detection instruments (SEWERIN and EchoShore) as an example: their leak detection equipment performs leak detection via frequency band variation and manual judgment, which is easily affected by environmental noise. In addition, pipes suitable for leak detection equipment are made from rigid materials, differing from the current situation in Taiwan, where most main water pipelines are still PVC pipelines. This makes it difficult for the equipment to be adapted for use in the localized water pipeline transportation system. The above helps us understand the importance of leak detection.
The traditional judgment of water pipe leakage depends on the judgment of professionals, but its efficiency is very low. To help with large-scale right-of-way applications and the timeliness of emergency repairs, establishing a system that can detect the locations of leakages is vital. This study intended to apply artificial intelligence (AI) deep learning to develop a water pipe leakage and location identification system.
In recent years, artificial intelligence (AI) applications have continued to thrive in various industries, and deep learning has been widely used. Since deep learning can be used to perform deep analysis of signals and learn the implicit structure of signals, trained models are less affected by environmental noise, unmatched recording settings, and other factors. Therefore, these models are more suitable to be applied to sound event detection systems with strong key properties [11]. Deep learning has proved to be a very powerful tool because of its ability to handle large amounts of data [12,13]. Among them, the convolutional neural network (CNN) is widely used. The structure of the convolutional neural network enables it to use the two-dimensional structure of input data; compared with other deep learning architectures, CNNs can produce better results in image and speech recognition. This research established an intelligent sound-assisted water leak identification system by developing and using a localized AI water leak diagnostic instrument to capture on-site dynamic audio, applying a CNN for leak detection, and integrating Internet of Things (IoT) technology to simultaneously identify and locate leakages. In addition, the system was imported into a personal handheld device or a back-end platform. The leak detector can interact with the site remotely to assess the current status of the pipelines, which greatly enhances the efficiency of water leakage detection and provides a wider range of pipeline status information. The system will be beneficial to big data analysis on cloud platforms in the future and help predict and prevent pipeline leakages.

2. System Architecture, Theoretical Methods, and Experiments

The architectural diagram of the intelligent sound-assisted water leak identification system is shown in Figure 1. In this study, an acoustic and vibration diagnostic system for structural deterioration was constructed first, including an acoustic wave sensing unit, an acoustic and vibration diagnostic module, and a communication module for signal transmission between the acoustic wave sensing unit and the acoustic and vibration diagnostic module; then, construction equipment was used to collect more than ten thousand pieces of data. After multiple pieces of audio data were processed into noise, the audio was dissociated by the Mel-scale Frequency Cepstral Coefficient (MFCC). Finally, a CNN was used to create a database to identify whether the sound was ambient or from a leakage. In addition, a mobile version of the cloud-based intelligent water leakage signal diagnostic and management platform was also developed, as shown in Figure 2.

2.1. Raw Data Collection

The subject of research in this study is audio captured from the ground above field pipelines in various districts of the Taiwan Water Corporation. These data signals are mixed with various random environmental audio and underground leakage audio, so the events corresponding to each time point cannot be clearly marked. Therefore, it is necessary to introduce unsupervised learning algorithms (otherwise called swarming algorithms) to perform labeling. However, if the original signal is directly sent to the unsupervised learning algorithm for learning, the “curse of dimensionality” can arise [14], compromising the labeling. To address this issue, this study extracted representative features from the original data, and the algorithms then used these representative features to learn. In this study, the encoder in the autoencoder is used to complete feature extraction.

2.2. Using MFCC for Speech Recognition and Normalization

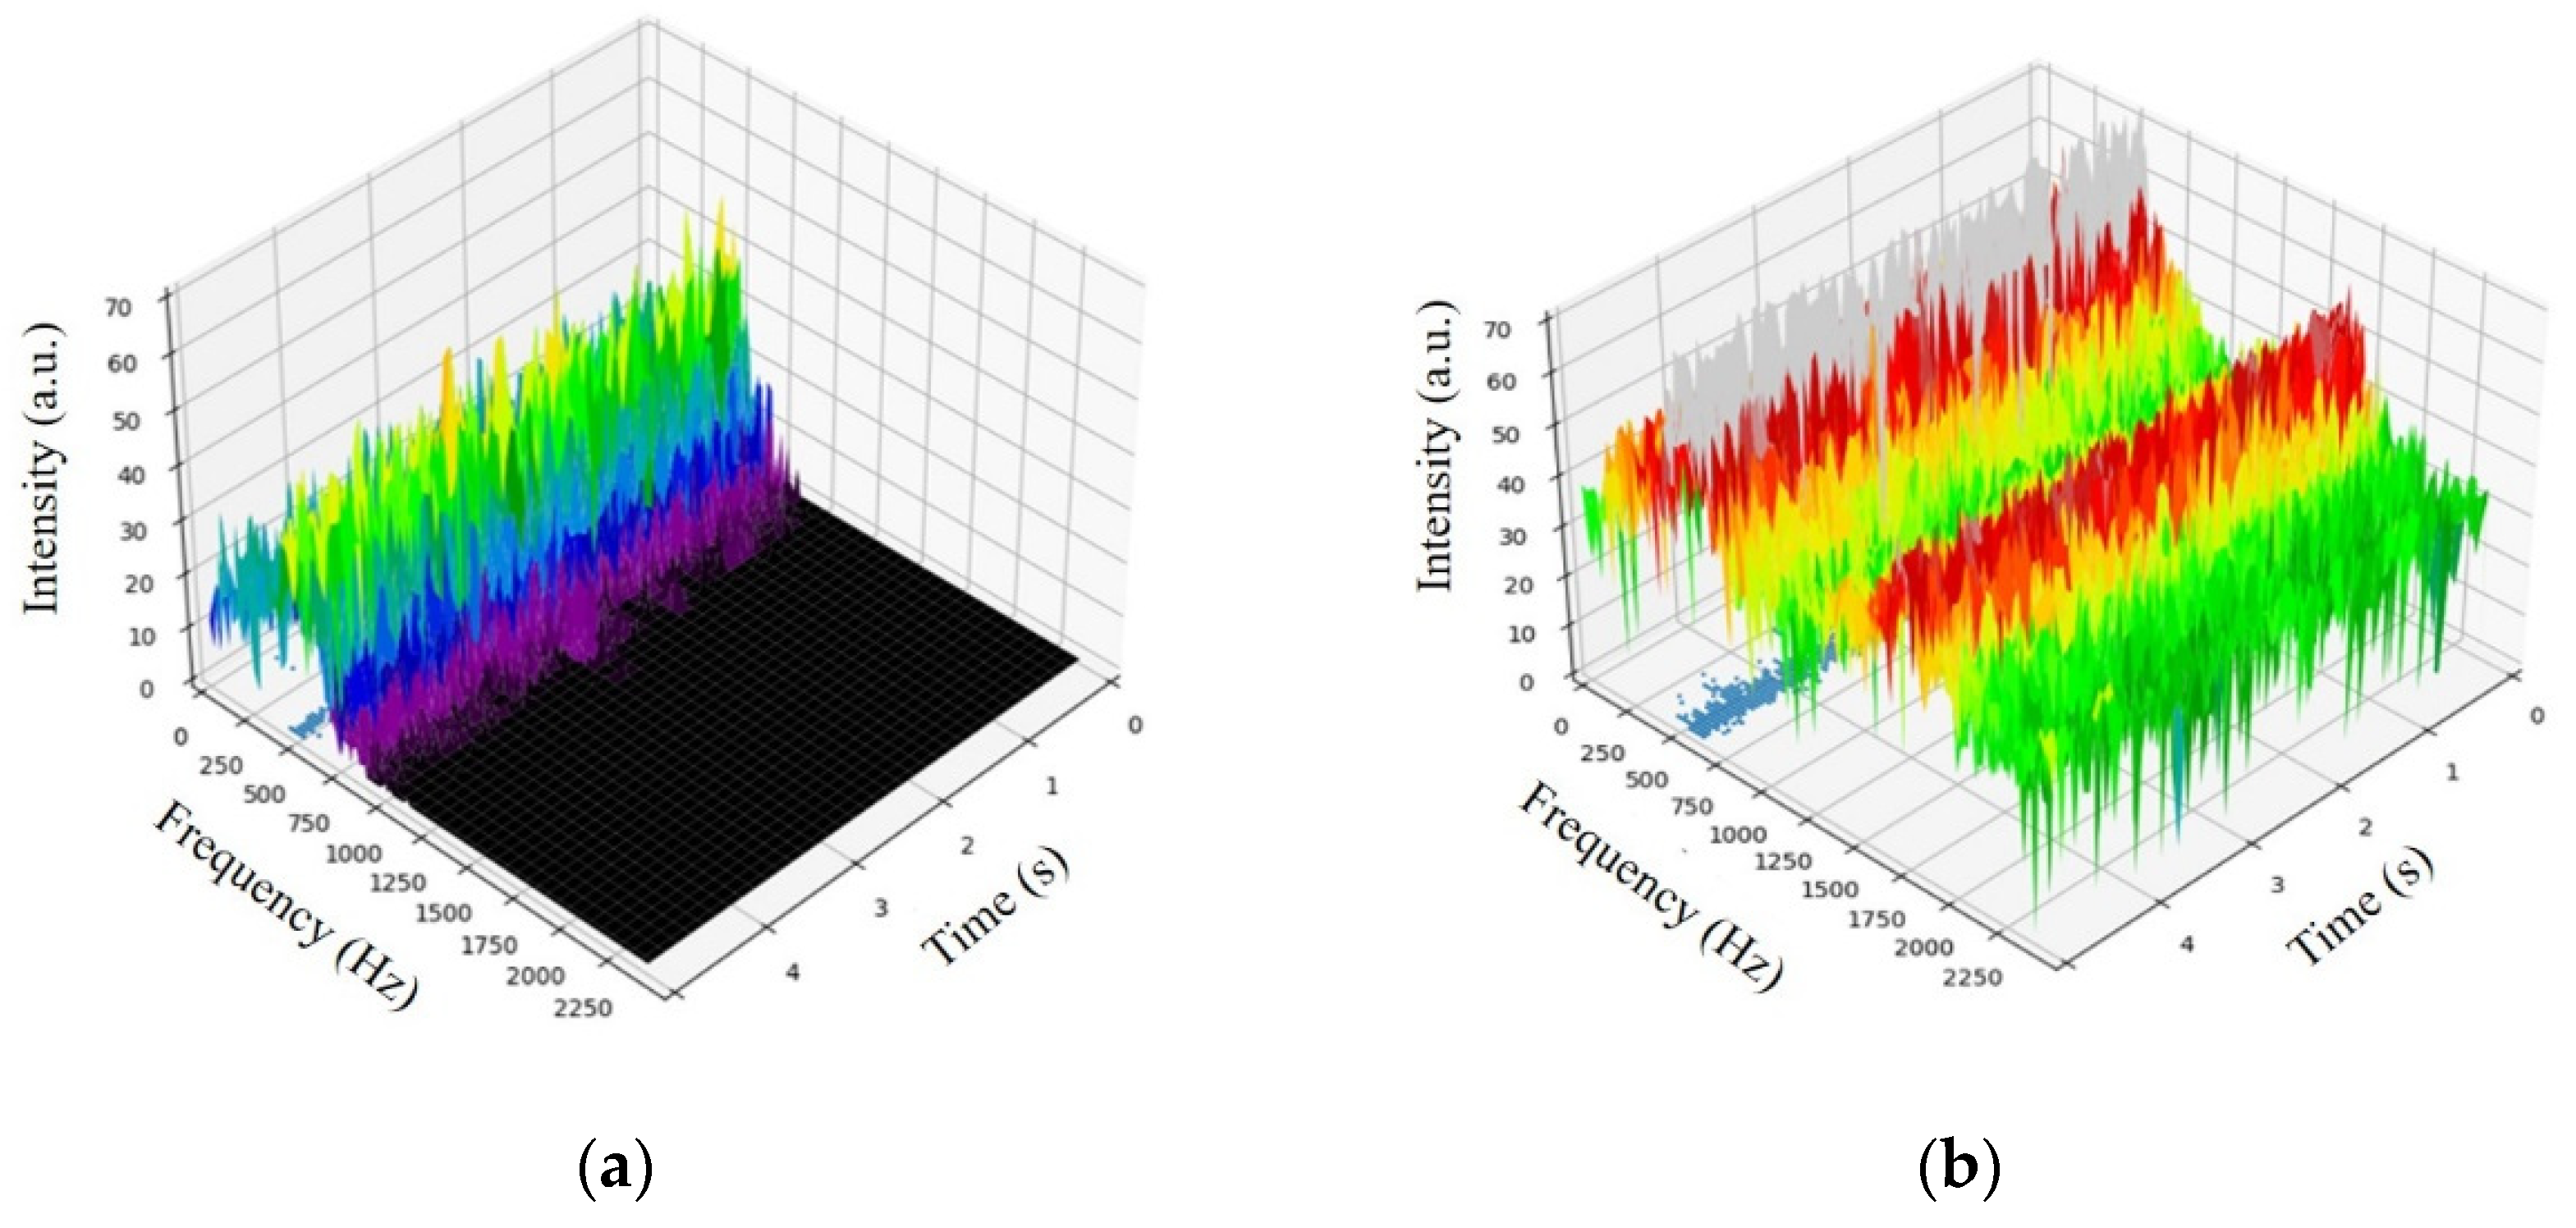
The acoustic signal captured in this study was subjected to the MFCC for speech recognition after discrete square-wave Fast Fourier Transform (FFT). The number of filters is 30, the MFCC has 20 dimensions, the frequency range is 0–44,100 Hz, the Fast Fourier Transform (FFT) has 2048 points, and the size of the sound frame used for the sound file is 5 s. In addition, to avoid overly drastic changes between sound frames, two sound frames can be overlapped by 20 milliseconds (ms) to obtain the time-spectrum data graph, as shown in Figure 3. The three axes are amplitude, frequency, and time, respectively. Figure 3a is the time–frequency characteristic of environmental audio, and Figure 3b is the time–frequency characteristic of PVC pipe leak detection.
Each acoustic signal must be normalized before being trained with deep learning algorithms. The normalization method used in this study is min–max normalization. The readings obtained by sampling 13 times at a certain time point n form a vector (or a one-dimensional array); the maximum and minimum values of the readings measured each time are formed into two vectors,   X [ n ] R 13 × 1 and X m a x [ n ] R 13 × 1 . X [ n ] is normalized with the following formula:
X n o r m [ n ] = X [ n ] X m i n [ n ] X m a x [ n ] X m i n [ n ]
Using the difference method, the normalized measurement reading at the current time point X n o r m [ n ] is subtracted from the measurement reading at the previous time point X n o r m [ n 1 ] (as shown in Formula (2)):
X d i f f [ n ] = | X n o r m [ n ] X n o r m [ n 1 ] | R 13 × 1
where X d i f f is a differential signal.
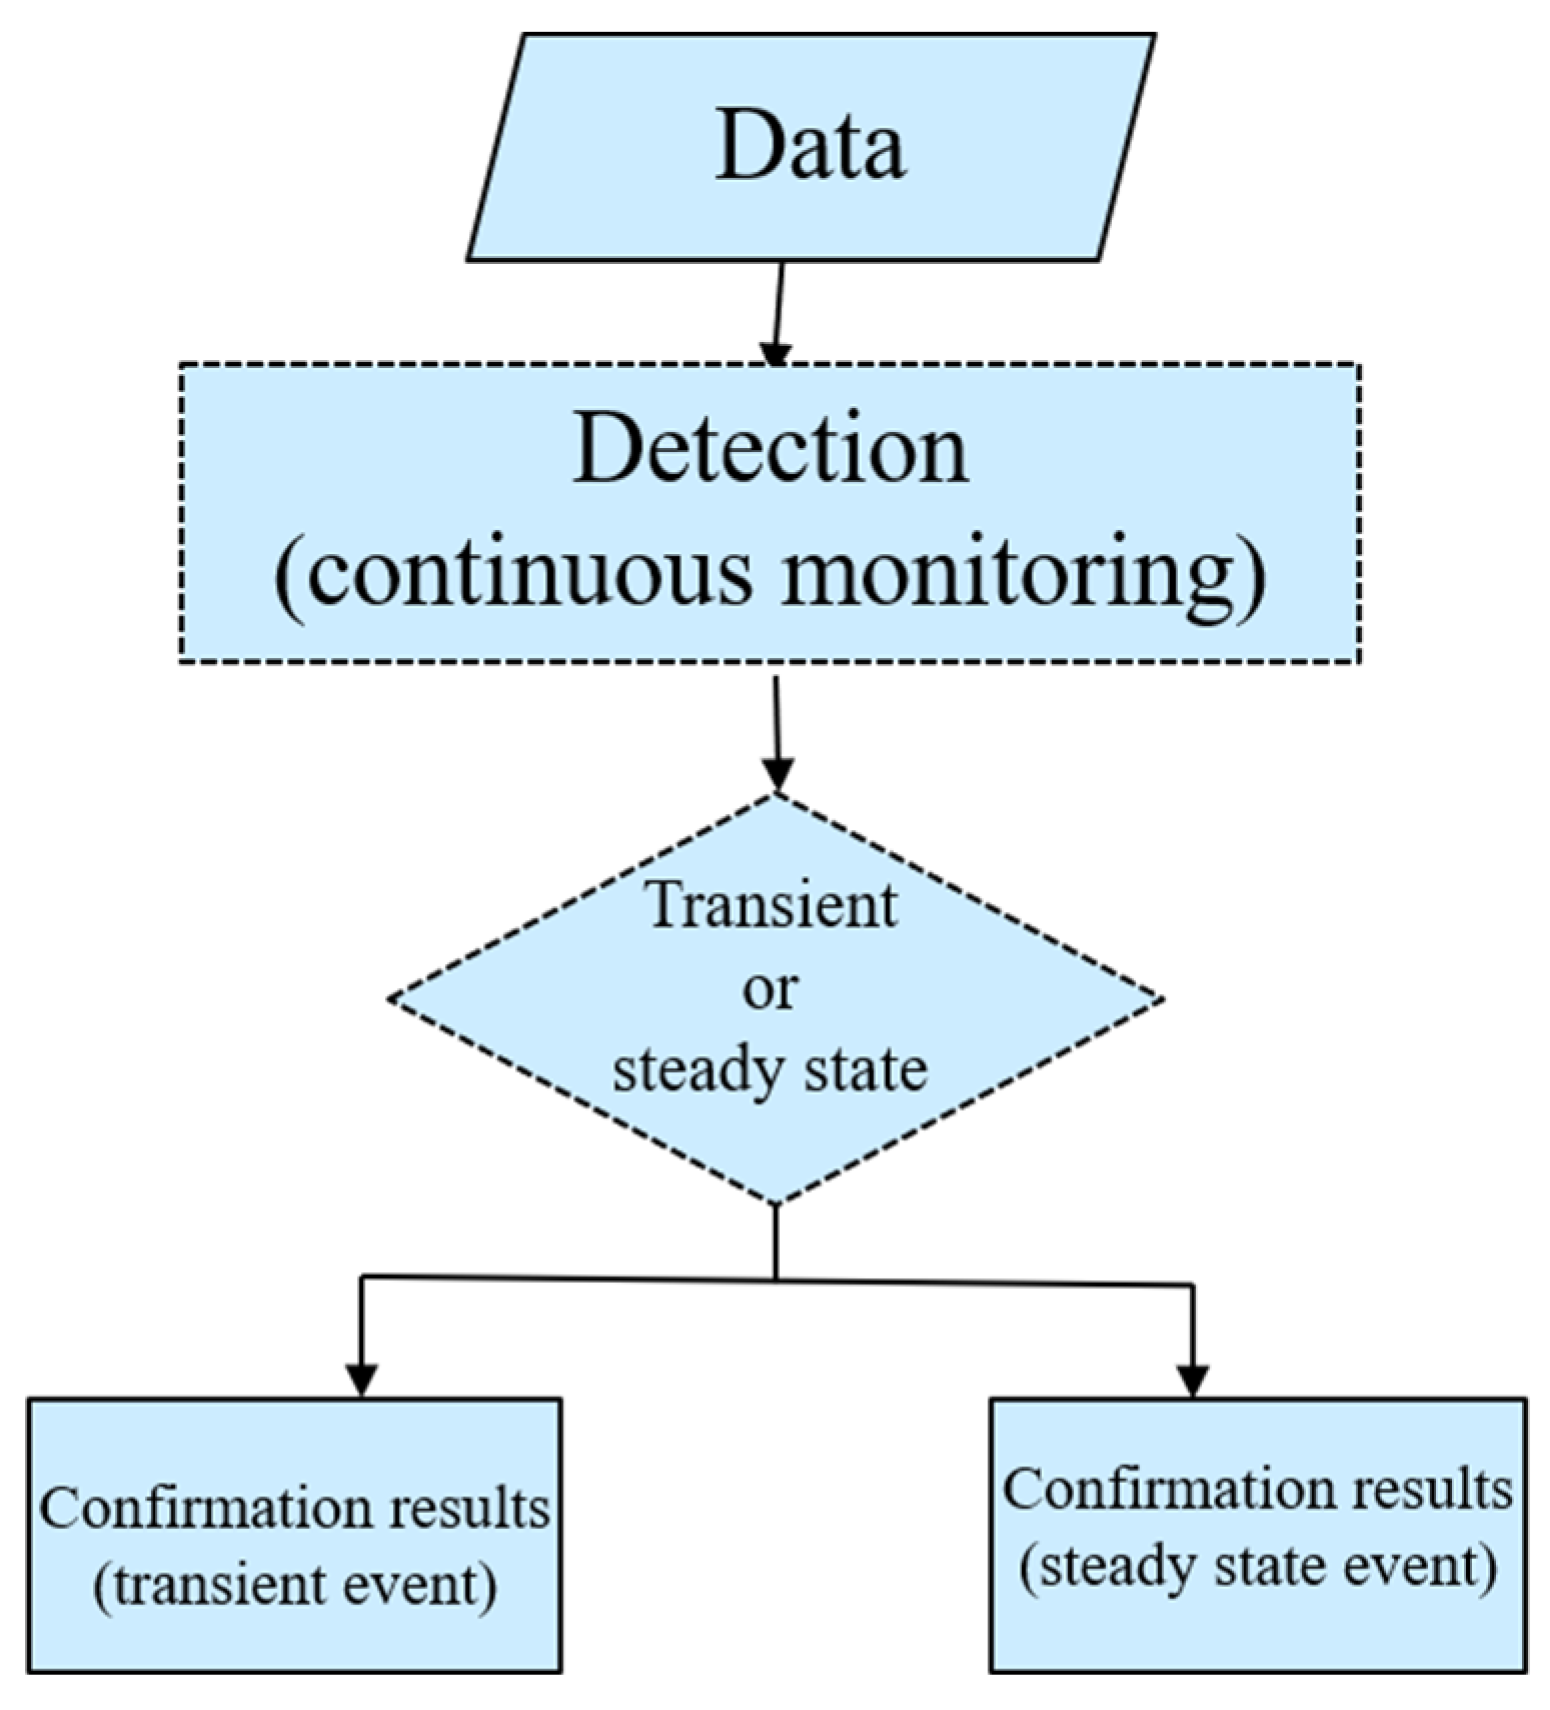
The sum of the differential signals is calculated, and a threshold is established, as shown in Formula (3):
n = 2 16 X d i f f [ n ] T [ 1   1 1 ] T > threshold
If the sum of the differential signals is greater than the threshold, it can be determined that the input sound wave signal is a transient signal with a sharply changing waveform; otherwise, it can be determined that the input sound wave signal is a steady-state signal with stable and moderate waveform changes.

2.3. Autoencoding with CNN

Convolutional autoencoders are based on CNNs, including convolutional layers, pooling layers, and upsampling layers. Since CNNs have achieved excellent image recognition results, the image itself is a two-dimensional matrix of pixels. Therefore, the two-dimensional matrix in the monitoring window can also be directly input to CNNs. The operations performed by the convolutional, pooling, and upsampling layers are explained below.
The convolutional layer performs convolution on the input image and the kernel. The kernel is usually a square 3 × 3 matrix, denoted by Ⓧ. Taking Figure 4 as an example, the kernel will first operate on the orange area in the upper left corner of the original image (the orange area is also a 3 × 3 square matrix, the same as the kernel) to calculate the Hadamard product of these two matrices.
0 × 0 + 0 × 0 + 0 × 1 + 0 × 1 + 1 × 0 + 0 × 0 + 0 × 0 + 0 × 1 + 0 × 1 = 0 .
This product can be used as the first value of the feature map on the right in Figure 4. Next, the kernel will continue to calculate the Hadamard products on the original image from left to right, from top to bottom, until the entire image is scanned by the kernel, producing a complete feature map. To further output the feature map with the same size as the original image, padding should be added on the periphery of the original image so that the output feature map and the original image before padding is added share the same size.
The purpose of the pooling layer [15] is to further reduce the feature map output using the convolutional layer while retaining the obvious features in the feature map. There are two common pooling operations: max pooling and mean pooling. In this study, max pooling is used to reduce feature maps. Take Figure 5 as an example of pooling. First, the input image is divided into several rectangular regions, and the maximum value is output for each subregion. Usually, the size of the subregion is 2 × 2. This mechanism works because the precise location of a feature is far less important than its rough location relative to other features.
The pooling layer will continuously reduce the spatial size of the data, decreasing the number of parameters and the amount of computation, which also prevents overfitting to a certain extent. The operations performed by the upsampling layer are quite simple; it directly resamples each area of the feature map. The detailed method can be directly seen in 
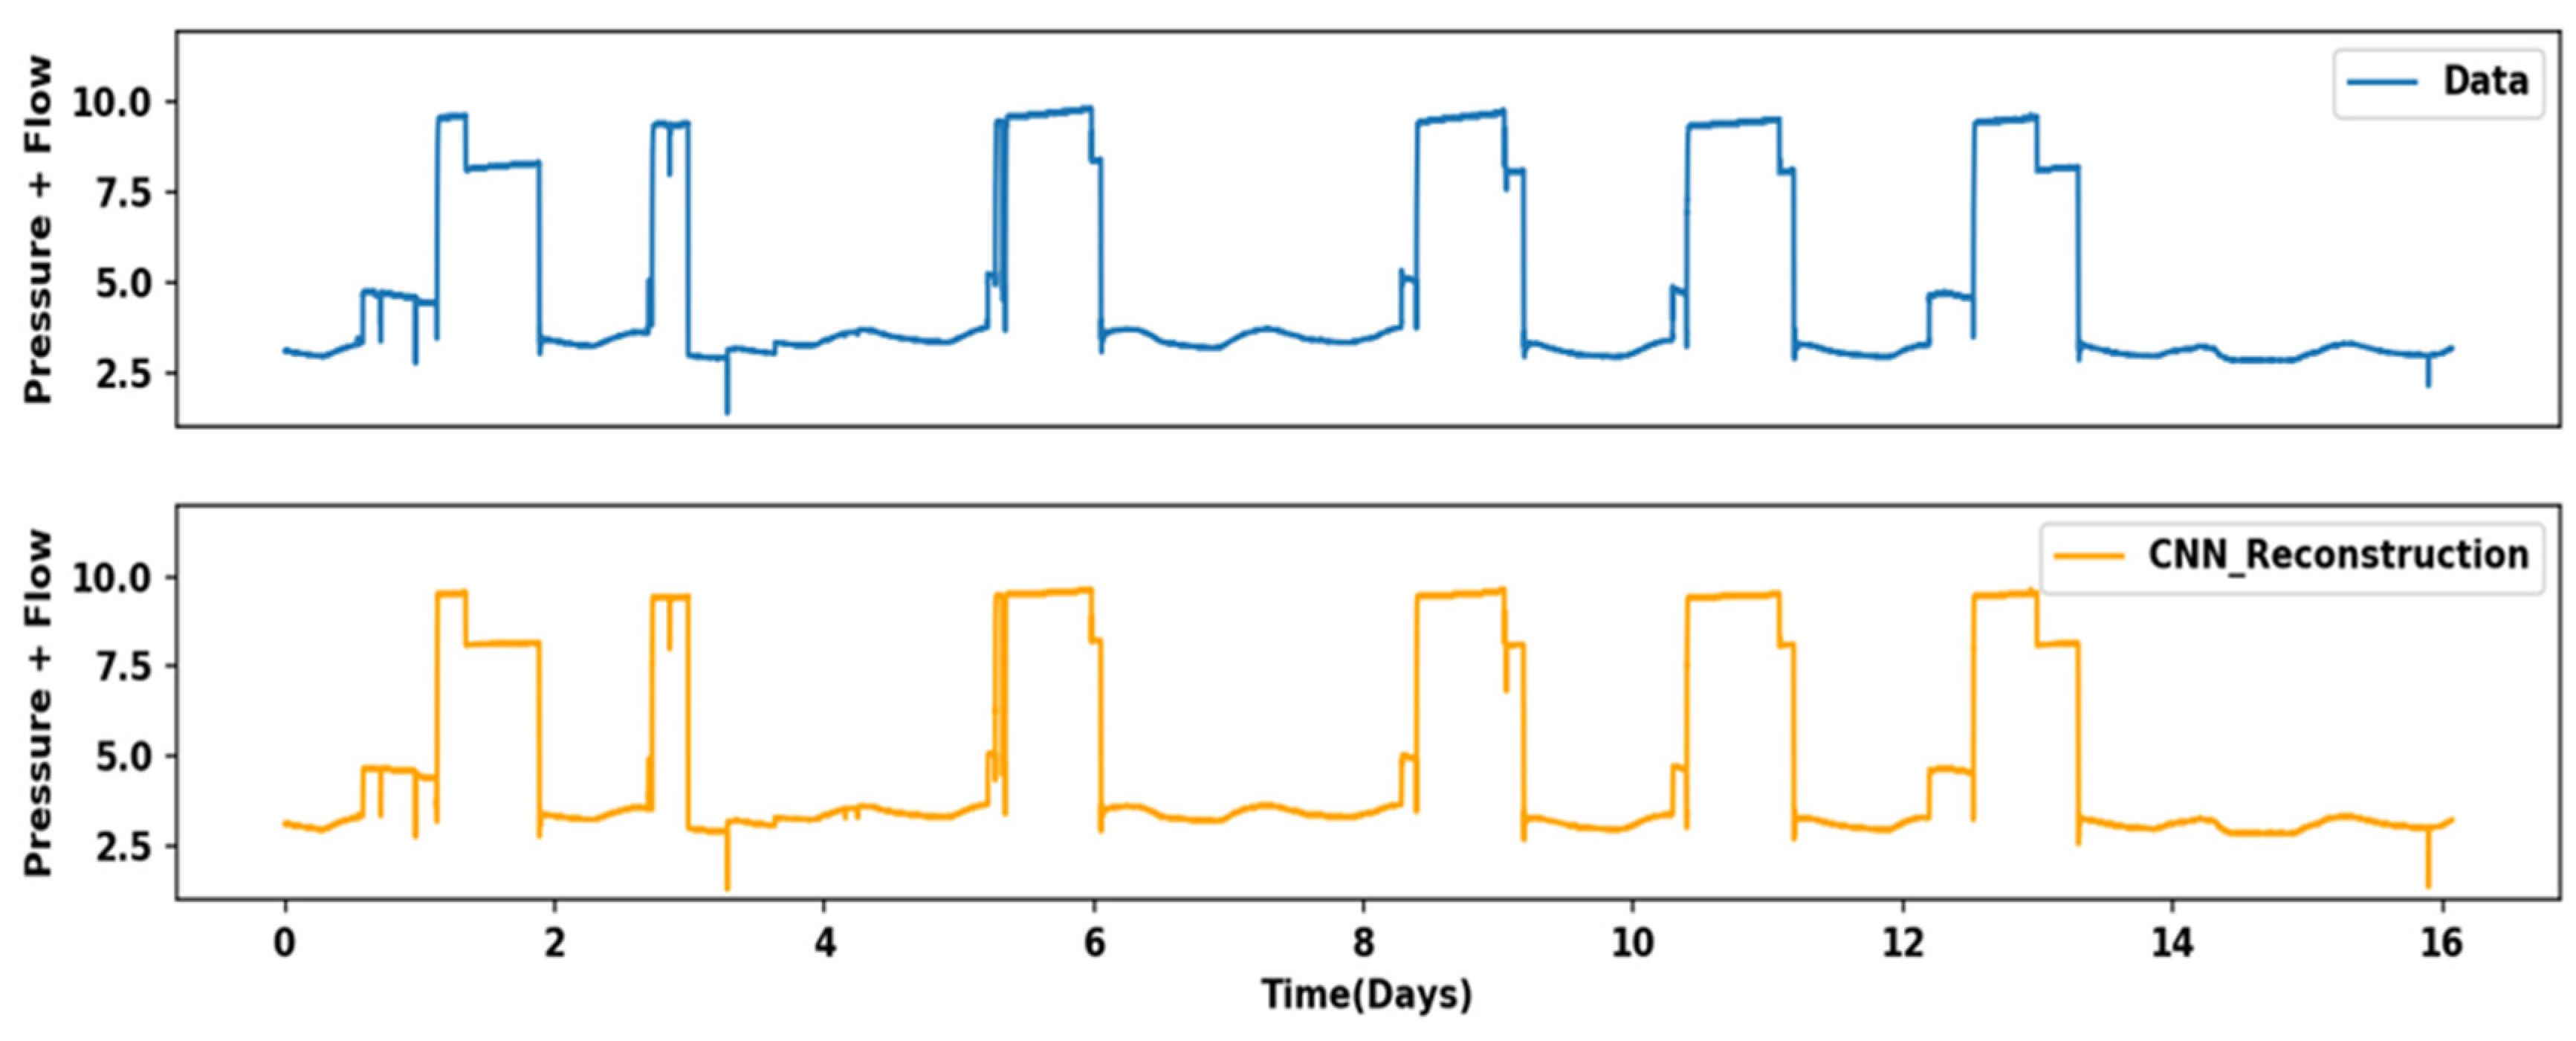
Figure 6. Finally, the architecture of the autoencoder is shown in Figure 7. The original image is a 13 × 16 matrix compressed by the encoder to obtain a 13 × 4 encoding matrix. It is worth noting that, by design, the pooling layer in the encoder sets the size of the sub-regions to be 1 × 2. This helps preserve the correlation between the timing information on the compression matrix and the sensor. The upsampling layer [16] in the decoder is also aimed at timing amplification.

3. Results and Discussion

3.1. Data Collection and Analysis

The subject of research of this study is audio captured from the ground above field pipelines in various districts of the Taiwan Water Corporation. This research collected a total of 19,716 data signals. After analyzing and evaluating the results, 94 actual excavations and 5297 valid signals were recorded. At least two training acoustic signals stored in the database were input into the training model for training. The acoustic signals must be normalized, and the input includes the normalized training acoustic signals and verification acoustic signals, as shown in Figure 8. Then, according to the training results, a CNN-based diagnostic model is constructed. The acoustic signal to be measured is input into the diagnostic model to predict the accuracy and determine whether the pipeline is leaking, and the detection accuracy of the algorithm is checked to determine whether it has achieved working conditions.
This study used a CNN to learn steady-state data from training data and used test data to test whether the autoencoder can successfully detect transient occurrences. The criterion for transient determination is that if the error between the restored signal of the autoencoder and the original signal exceeds the thresholds set in this study (the threshold is set to 16 for the length of the monitoring window and set to 13 for the sensor count), it will be judged as transient, as shown in Figure 8. In the figure, we can see that the autoencoder determines the state of the pipeline system: “0” is steady, and “1” is transient. Figure 9 is the detection result of the convolutional autoencoder in working conditions, which is the normalized value of the original signal of each sensor and the normalized value of the sensor reading at each time point. It can be seen in the figure that the test data have obvious signal changes at four time points, and the autoencoder can correctly determine that the pipeline system is in a transient state at those time points.
Next, in order to confirm that the features that can best represent the data are extracted, it is necessary to observe the restoration effect of the autoencoder as an indicator. The better the restoration, the higher the chance that the extracted features are representative. Figure 10 is the restoration result of the CNN autoencoder; Figure 11 shows the errors obtained by subtracting the restoration result from the original signal. Taking Figure 10 as an example, for the convenience of presenting the original signal and the restoration result, the figure shows the summation of the original signal after normalization and the summation of the signal readings after restoration by the convolutional autoencoder. In Figure 10, we can see that the signal restored by the convolutional autoencoder is close to the original signal. In addition, this study further analyzed the errors of the CNN autoencoder. We can see that the CNN autoencoder has a mean absolute error of about 0.1021, which confirms that the CNN autoencoder in this study has an excellent restoration effect.

3.2. Establishment of Identification Model

The flow chart of the overall system of the intelligent sound-aided water leakage identification model is shown in Figure 12. The system in this project mainly adopts “rolling monitoring”, sets up a monitoring window to analyze the data in the window, and completes “detection” and “identification” in sequence. Then, the latest sampled data are included in the monitoring window, the oldest data in the monitoring window are removed, and the above process is repeated. The feature extraction part in Figure 12 is the process developed in this study. The key steps are as follows:
(a)
Establish the training database;
(b)
Develop the intelligent sound-aided water leakage identification model;
(c)
Establish the automatic encoder based on the convolutional layer;
(d)
Establish the automatic encoder based on the full connection layer;
(e)
Compare and verify the detection performance of the above algorithms;
(f)
Extract features based on deep learning technology.
According to the field signal database collected from a bamboo seedling field, the “deep automatic coder” and “convolutional neural network” were used as the working condition detection and feature extraction methods to learn the steady-state data (leakage data) in the training field signal database, and the test data were used to test whether the automatic coder can successfully detect transient occurrences, as shown in Figure 13. The criterion for transient determination is the error between the restored signal of the automatic encoder and the original signal. If the error exceeds the threshold value (the threshold value is a signal-to-noise ratio of 500) set in this study, it is determined to be transient, as shown in Figure 14.
Pre-labeled data are imported into the convolutional neural network for fitting, and the most representative characteristics of the data are obtained. Whether the prediction index of the convolutional neural network conforms to the label characteristics is observed. If the reduction is better, it means that the extracted features are more representative. Figure 15 is a graph of model training results and errors. In the displayed training curve, the accuracy of the validation data set (orange line) reaches 92%, indicating that the model has the ability to reliably test the characteristics of water leakage sound.

3.3. Water Pipe Leakage and Localization Identification Field Experiment

In this study, an AI water pipe leakage and location identification system and a database based on the CNN autoencoder were developed to assist leak detection personnel in conducting intelligent inspection and water leakage diagnosis. To prove that the system is reliable, we worked with the leak detection personnel of the Taiwan Water Corporation. We had them carry AI water leakage diagnostic instruments to conduct system verification in the pipeline network in Hsinchu and Miaoli. The AI water leakage diagnostic instruments are used in conjunction with the intelligent cloud sound-assisted water leakage diagnostic service system to conduct pipeline inspections and leak detection during inspections. When the system finds that there is a leak in the pipe section, the area of the leakage will be reported, as shown in Figure 16. According to the area reported by the system and the results of AI diagnosis, a marking will be sprayed at the leak, as shown in Figure 17. Factory personnel is then informed to conduct an excavation to verify whether the underground pipeline is leaking, as shown in Figure 18. This study actually recorded and counted relevant verification information, including excavation results, leakage volume, pipe diameter, etc., to verify the effectiveness of the CNN autoencoder AI water pipe leakage and location identification system and database.
From April 2020 to the end of March 2022, the leak detection personnel in the third area of the Taiwan Water Corporation used AI water leakage diagnostic equipment to inspect 214 road sections. The AI reported 214 leakage points, and markings were sprayed to indicate leakage locations. The statistics of the 214 leakage locations after excavation and the details of the pipe types are shown in Table 1. Most pipes are PVC pipes, accounting for 97.20% of the overall excavation results, totaling 208 pieces, and joint pipes account for 1.87%. No leakage was found in two cases (0.93%). Therefore, the data showed that the PVC pipe was the main cause of the leakage, followed by the joint pipe.
Table 2 shows detailed information on different pipe diameters in 214 locations of leakages after excavation. The results show that leaking pipes whose diameter is less than 80 mm (i.e., pipelines for the end-user) account for 69.16% of the overall excavation results (148 pieces in total). Of the analyzed pipes, 100 mm pipes account for 19.16% (41 pieces in total), 150 mm pipes account for 5.61% (12 pieces in total), and 200 mm pipes account for 3.74% (8 pieces in total). Pipes whose diameter exceeds 250 mm account for 1.40% (three cases in total), and no leakage was found in two cases, accounting for 0.93% of the excavation. The above data show that pipeline end-users with diameters less than 80 mm are the main factor in leakage events.
Table 3 shows that this research assisted the Taiwan Water Corporation in successfully preventing leakages at 212 locations. A total of 16,531 CMD leakages were blocked, and the total leakage amount was calculated for different pipe diameters. The results show that the overall leakage amount from pipes for end-users whose diameters are below 80 mm is 6811.4 CMD, accounting for 41.2% of the overall leakages; leakage from 100 mm pipes is 5665.4 CMD, accounting for 34.27%; leakage from 150 mm pipes is 1748.3 CMD, accounting for 10.58; leakage from 200 mm pipes is 1434.8 CMD, accounting for 8.68%; and leakage from pipes above 250 mm is 871.1 CMD, accounting for 5.27%. Statistics show that the majority of leakages occur in pipes for end-users below 80 mm, which accounts for 12,476.8 CMD (75.47%) of the overall leakages, and the second highest contributor to leakage is the 100 mm diameter pipe.
Finally, from April 2020 to the end of March 2022, this study conducted a leakage search and diagnosis in Hsinchu and Maioli based on the CNN autoencoder AI water pipe leakage detection and location identification system database, helping the Taiwan Water Corporation mark 214 locations of leakages. Excavation verification showed that 212 were tap water leaks, and the remaining 2 were false positives, as shown in Figure 19. Therefore, according to the diagnostic results of 214 locations of leakages in this experiment, the diagnostic accuracy rate of the localized AI water leakage diagnostic instrument is (212/214) × 100% = 99.07%. In addition to successfully identifying 212 locations of leakages, this study also successfully assisted the Taiwan Water Corporation in preventing the leakage of 16,531 CMD leaks, proving that the system has a fairly stable leak diagnostic effect. It can effectively diagnose micro-leakage and large-scale leaks in water pipelines and narrow down the area of the leakage. In addition, factory leak inspectors can interact with on-site leak inspectors remotely, helping them assess the current status of pipelines in real time and reducing the possibility of misjudgment, which reduces the workload of leak inspectors and greatly improves the efficiency of water leak detection.

4. Conclusions

This research successfully developed and established an intelligent sound-assisted water leak identification system that uses a localized AI water leak diagnostic instrument to capture on-site dynamic audio and integrates IoT technology to simultaneously identify and locate the leakage.
A CNN is used as the basis for leak detection. The model can predict the leak’s coordinates, size, and probability, and the process does not rely on leak detection personnel to perform leak diagnosis. Professional leak detection personnel can interact remotely to understand the current on-site statuses of pipelines, greatly enhancing the efficiency of water leakage detection.
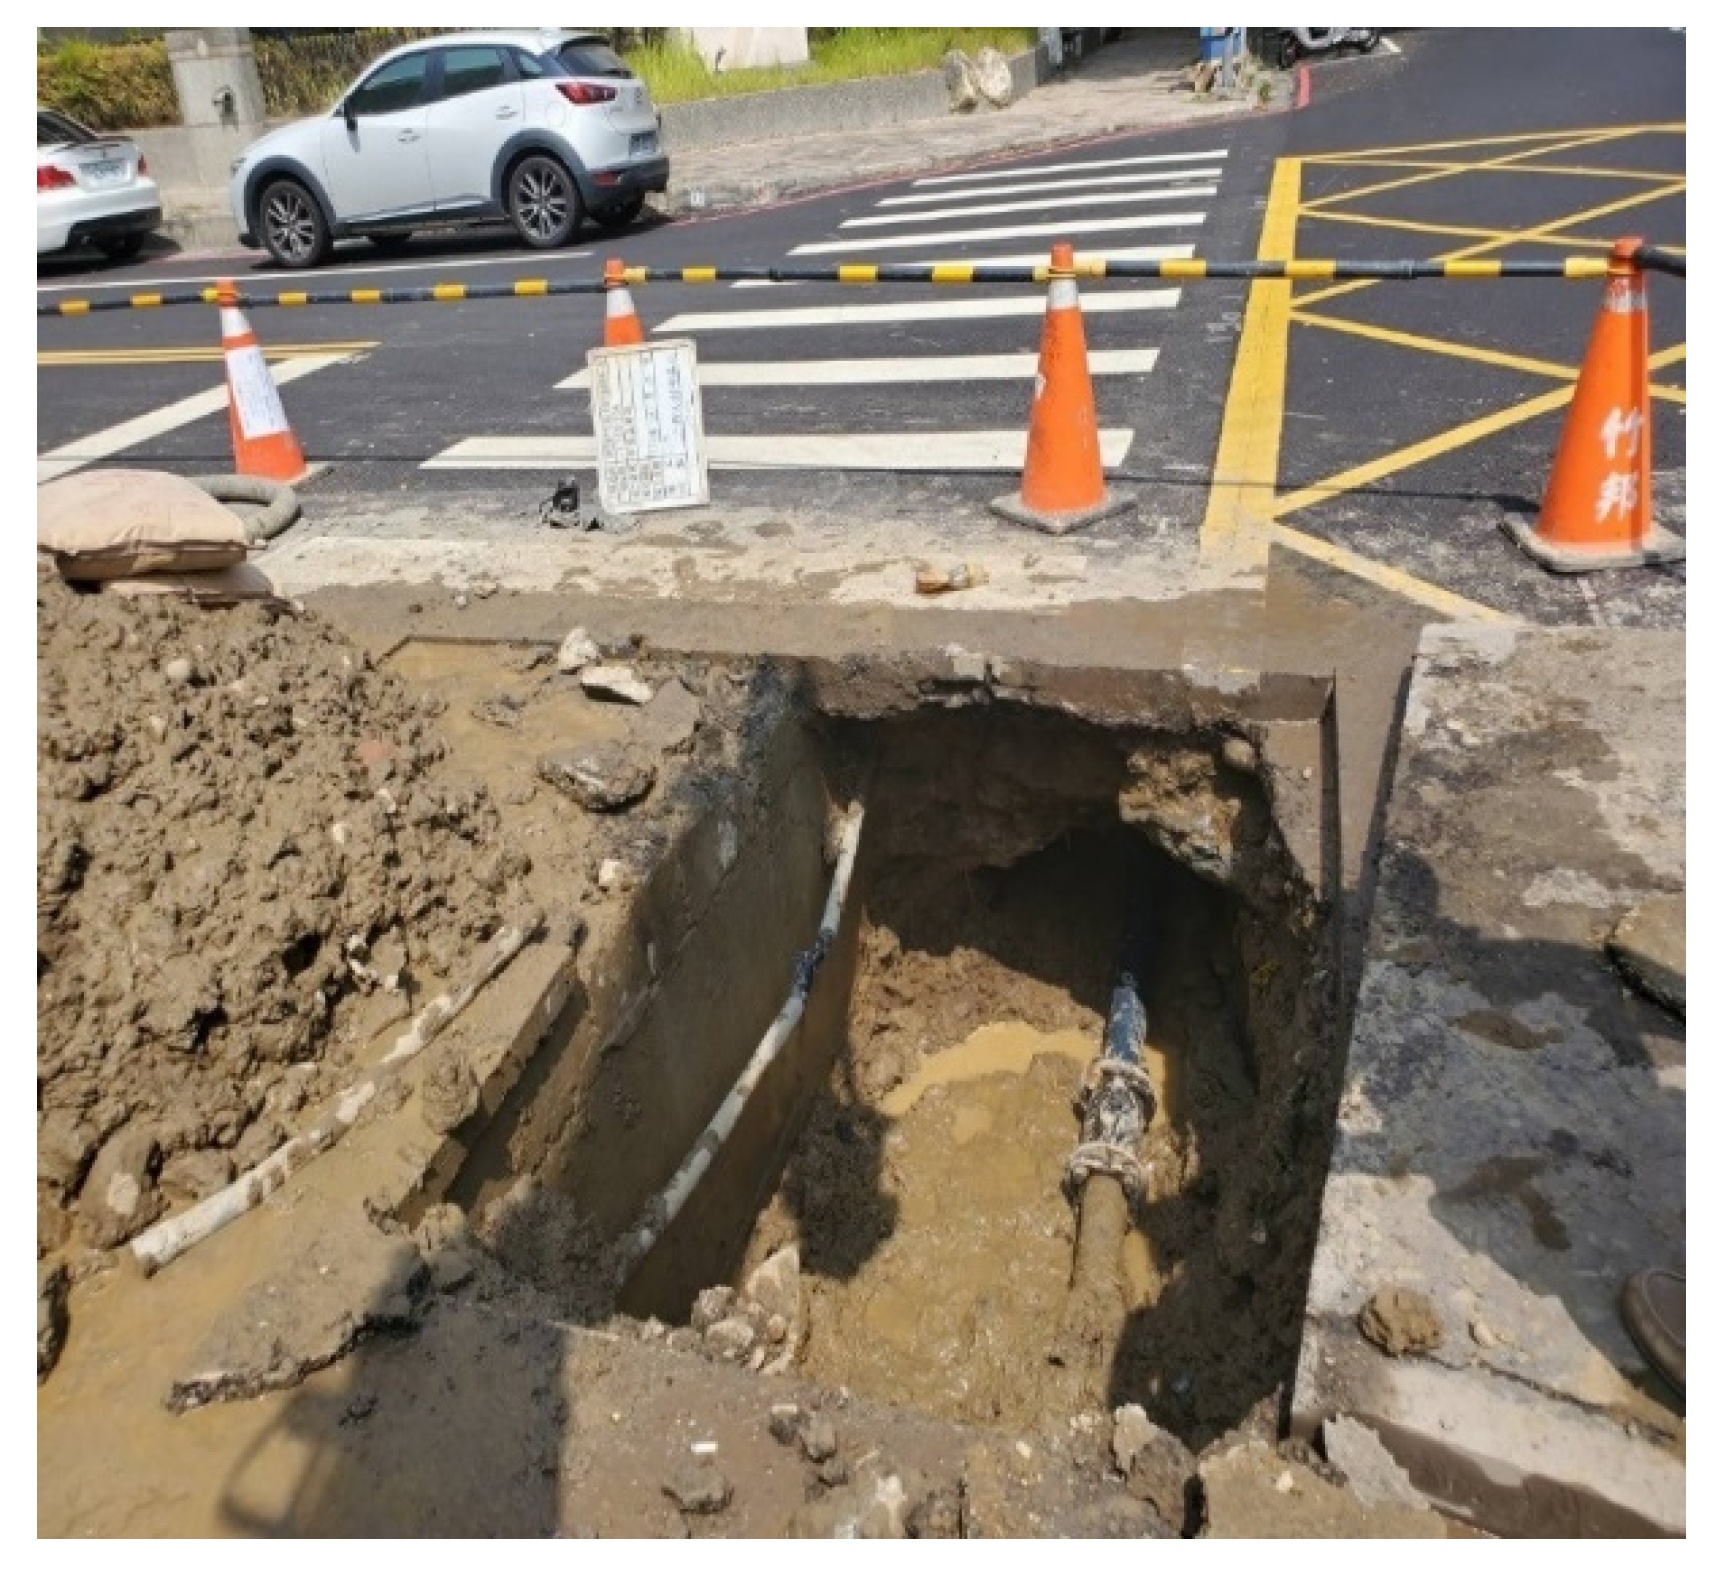
The results of testing the model proposed in this study show that the accuracy of the CNN after training is greater than 95%. The average absolute error calculated between the output data and the input data of the encoder is 0.1021, demonstrating that the proposed model outperforms existing methods in the detection of PVC pipe leaks. In addition, actual excavation data were used to verify the credibility of this AI system. The results confirm that the system has high reliability and can reduce the cost of excavation by 26%.
In the future, we expect non-professionals to use AI water leakage diagnostic instruments to inspect the regional pipeline network so that locations with suspected leakages can be found effectively and quickly (about four times the speed of traditional methods). The leakage status of the pipeline network can be tracked and managed, and limiting the area of the suspected water leakage can increase the efficiency of water leakage detection, improve the current leakage diagnosis and detection rate, improve the management efficiency of overall pipeline integrity, and reduce the workload of professional leak detection personnel.

Author Contributions

Data curation, H.-C.C., S.-N.L. and A.-H.C.; Formal analysis, H.-C.C. and A.-H.C.; Investigation, Y.-L.T. and A.-H.C.; Methodology, Y.-L.T., H.-C.C. and S.-N.L.; Project administration, Y.-L.T.; Resources, T.-L.L.; Validation, H.-C.C.; Visualization, H.-C.C., S.-N.L. and A.-H.C.; Writing—original draft, A.-H.C.; Writing—review & editing, A.-H.C. All authors have read and agreed to the published version of the manuscript.

Funding

This research received no external funding.

Institutional Review Board Statement

Not applicable.

Informed Consent Statement

Not applicable.

Data Availability Statement

Data are contained within the article.

Acknowledgments

The authors give special thanks to MCL, Industrial Technology Research Institute, for its support. The authors would like to thank the Taiwan Water Corporation for support.

Conflicts of Interest

The authors declare no conflict of interest.

References

  1. Fuchs, H.V.; Riehle, R. Ten years of experience with leak detection by acoustic signal analysis. Appl. Acoust. 1991, 33, 1–19. [Google Scholar] [CrossRef]
  2. Liston, D.A.; Liston, J.D. Leak detection techniques. J. N. Engl. Water Work. Assoc. 1992, 106, 2. [Google Scholar]
  3. Gao, Y.; Brennan, M.J.; Joseph, P.F.; Muggleton, J.M.; Hunaidi, O. A model of the correlation function of leak noise in buried plastic pipes. J. Sound Vib. 2004, 277, 133–148. [Google Scholar] [CrossRef]
  4. Gao, Y.; Brennan, M.J.; Joseph, P.F. A comparison of time delay estimators for the detection of leak noise signals in plastic water distribution pipes. J. Sound Vib. 2006, 292, 552–570. [Google Scholar] [CrossRef]
  5. Long, R.; Vine, K.; Lowe, M.J.S.; Cawley, P. Monitoring acoustic wave propagation in buried cast iron water pipes. Rev. Prog. Quant. Nondestruct. Eval. 2001, 20, 1202–1209. [Google Scholar] [CrossRef]
  6. Long, R.; Cawley, P.; Lowe, M.J.S. Acoustic wave propagation in buried iron water pipes. Proc. R. Soc. A Math. Phys. Eng. Sci. 2003, 459, 2749–2770. [Google Scholar]
  7. Muggleton, J.M.; Brennan, M.J.; Pinnington, R.J. Wavenumber prediction of waves in buried pipes for water leak detection. J. Sound Vib. 2002, 249, 939–954. [Google Scholar]
  8. Muggleton, J.M.; Brennan, M.J.; Linford, P.W. Axisymmetric wave propagation in fluid-filled pipes: Wavenumber measurements in invacuo and buried pipes. J. Sound Vib. 2004, 270, 171–190. [Google Scholar]
  9. Muggleton, J.M.; Brennan, M.J. Leak noise propagation and attenuation in submerged plastic water pipes. J. Sound Vib. 2004, 278, 527–537. [Google Scholar] [CrossRef]
  10. Hunaidi, O.; Wang, A.; Bracken, M.; Gambino, T.; Fricke, C. Acoustic methods for locating leaks in municipal water pipe networks. In Proceedings of the International Conference on Water Demand Management, Dead Sea, Jordan, 30 May–3 June 2004; pp. 1–14. [Google Scholar]
  11. Cakir, E.; Heittola, T.; Huttunen, H.; Virtanen, T. Multi-label vs. combined single-label sound event detection with deep neural networks. In Proceedings of the 2015 23rd European Signal Processing Conference (EUSIPCO), Nice, France, 31 August–4 September 2015. [Google Scholar]
  12. Song, K.; Han, J.; Cheng, G.; Lu, J.; Nie, F. Adaptive neighborhood metric learning. IEEE Trans. Pattern Anal. Mach. Intell. 2021, 44, 4591–4604. [Google Scholar]
  13. Cheng, G.; Yang, C.; Yao, X.; Guo, L.; Han, J. When deep learning meets metric learning: Remote sensing image scene classification via learning discriminative CNNs. IEEE Trans. Geosci. Remote Sens. 2018, 56, 2811–2821. [Google Scholar] [CrossRef]
  14. Har-Peled, S.; Indyk, P.; Motwani, R. Approximate nearest neighbor: Towards removing the curse of dimensionality. Theory Comput. 2012, 8, 321–350. [Google Scholar]
  15. Nagi, J.; Ducatelle, F.; Di Caro, G.A.; Cireşan, D.; Meier, U.; Giusti, A.; Nagi, F.; Schmidhuber, J.; Gambardella, L.M. Max-pooling convolutional neural networks for vision-based hand gesture recognition. In Proceedings of the 2011 IEEE International Conference on Signal and Image Processing Applications (ICSIPA), Kuala Lumpur, Malaysia, 16–18 November 2011; pp. 342–347. [Google Scholar]
  16. Li, Y.; Liu, D.; Li, H.; Li, L.; Wu, F.; Zhang, H.; Yang, H. Convolutional neural network-based block up-sampling for intra frame coding. IEEE Trans. Circuits Syst. Video Technol. 2017, 28, 2316–2330. [Google Scholar]
Figure 1. AI-IoT-Based AI Leakage Detection and Localization System.
Applsci 12 08034 g001
Figure 2. Intelligent cloud water leakage signal diagnostic and management platform (mobile interface).
Applsci 12 08034 g002
Figure 3. Time-spectrum data graphs obtained by MFCC speech recognition: (a) ambient sound and (b) PVC pipe leakage.
Applsci 12 08034 g003
Figure 4. Diagram of operations performed by the convolutional layer.
Applsci 12 08034 g004
Figure 5. Diagram of operations performed by the pooling layer.
Applsci 12 08034 g005
Figure 6. Diagram of operations performed by the upsampling layer.
Applsci 12 08034 g006
Figure 7. An autoencoder based on a CNN.
Applsci 12 08034 g007
Figure 8. Diagram of CNN autoencoder restoring error value and threshold.
Applsci 12 08034 g008
Figure 9. CNN autoencoder in working conditions: detection result graph.
Applsci 12 08034 g009
Figure 10. Comparison between the reconstructed signal of the CNN autoencoder and the original signal.
Applsci 12 08034 g010
Figure 11. Differences between the reconstructed signal of the CNN autoencoder and the original signal.
Applsci 12 08034 g011
Figure 12. Flow chart of the whole system of intelligent sound-aided water leakage identification model.
Applsci 12 08034 g012
Figure 13. Flow chart of automatic encoder system.
Applsci 12 08034 g013
Figure 14. Schematic diagram of automatic encoder restoration error value and threshold value.
Applsci 12 08034 g014
Figure 15. Training results and error values of convolutional neural networks.
Applsci 12 08034 g015
Figure 16. Leak detection personnel of Taiwan Water Corporation used localized AI water leakage diagnostic instruments to determine the scope of leakage.
Applsci 12 08034 g016
Figure 17. Leak detection personnel of Taiwan Water Corporation sprayed markings within the specified area.
Applsci 12 08034 g017
Figure 18. Factory personnel conducted excavation verification of markings.
Applsci 12 08034 g018
Figure 19. 8 April 2020–March 2022 excavation verification statistics.
Applsci 12 08034 g019
Table 1. Localized AI water leakage diagnostic instrument excavation verification: leaking pipe category statistics.
Type of Leaking PipeNumber of Excavation PiecesOverall Percentage
PVC pipe20897.20%
Junction tube41.87%
No leakage20.93%
Sum214100%
Table 2. Localized AI water leakage diagnostic instrument excavation verification: leaking pipe diameter statistics.
Leaking Pipe DiameterNumber of Excavation PiecesOverall Percentage
<80 mm14869.16%
100 mm4119.16%
150 mm125.61%
200 mm83.74%
>250 mm31.40%
No leakage20.93
Sum214100%
Table 3. Localized AI water leakage diagnostic instrument excavation and verification of leakage statistics of each pipe diameter.
Diameter of Leaking PipeLeakage TotalOverall Percentage
<80 mm6811.4 CMD41.20%
100 mm5665.4 CMD34.27%
150 mm1748.3 CMD10.58%
200 mm1434.8 CMD8.68%
>250 mm871.1 CMD5.27%
No leakage00%
Sum16,531 CMD100%
Publisher’s Note: MDPI stays neutral with regard to jurisdictional claims in published maps and institutional affiliations.

