
Numerical Simulation Research on Plane Alignment Parameters of Desert Highway

1
School of Civil Engineering, Lanzhou Jiaotong University, Lanzhou 730070, China
2
Ningxia Highway Survey and Design Institute Co., Ltd., Yinchuan 750000, China
*
Author to whom correspondence should be addressed.
Appl. Sci. 2022, 12(19), 9579; https://doi.org/10.3390/app12199579
Submission received: 3 August 2022
/
Revised: 18 September 2022
/
Accepted: 21 September 2022
/
Published: 23 September 2022
(This article belongs to the Special Issue Prevention and Control of Wind-Blown Sand/Snow Disasters on Railway and Highway)
Abstract
:Using the plane alignment design of the Wuhai–Maqin highway as the background of this study, based on the Fluent–Euler two-fluid model, the response law of the wind–sand flow to the embankment under different angles, different curve radii, and different surface windward factors were studied. Additionally, the accuracy of the numerical simulation was verified by the distribution of sand accumulation on the embankment site. The results show that when the wind–sand flow passes through the embankment, and when the angle between the wind direction and the straight embankment gradually decreases from 90° (vertical) to 0° (parallel), the speed-division range is correspondingly shortened. Under the influence of plane alignment, the diversion effect leads to a certain difference in the flow-field structure at different positions of the line. The convex windward embankment has the effect of dredging the wind–sand flow outward. The concave windward embankment has the effect of gathering the wind–sand flow inward. The dredging and gathering effects of the flat curve on the wind–sand flow decreases with the increase in the radius. In the plane linear design, line direction should be parallel to the dominant wind direction as much as possible. If a flat curve needs to be set, the convex windward curve should be given priority, and a large radius curve should be selected as much as possible.
1. Introduction
Arid and semi-arid areas account for more than 30% of the global land area, and deserts account for 10.3% of land area [1]. Among them, the desert area in China is about 700,000 km2, accounting for about 19% of the global desert area, mainly concentrated in the inland basins and plateau areas in the northwest and north of China [2,3]. To promote the economic development of the northwest region, highway construction has gradually extended to desert areas, but desert highways are easily affected by wind–sand weather. If the selection of plane alignment design parameters is unreasonable, it will further lead to the occurrence of sand damage, such as sand accumulation and wind erosion on the road embankment, which will affect driving safety [4,5]. For this reason, many researchers have carried out a large number of wind-tunnel tests, numerical simulations, and field data analyses to determine reasonable plane alignment parameters and ensure driving safety.
In recent years, scholars [6,7,8,9] have systematically studied the relationship between the curve radius, the driving speed, and the driver’s heart-rate change by means of experiments and modeling from the perspective of driving safety. The minimum and recommended values of the road curve radius in the Gobi Desert area have been determined. According to the experience gained from many lines built crossing the desert (Taklimakan Desert highway, Lanzhou–Xinjiang high-speed railway, Iran railway), the influence of wind–sand activity characteristics should be fully considered in the early design stage [10,11,12,13]. At the same time, the data of existing lines where sand damage often occurs should also be analyzed to provide ideas for later designs. Li and Chu [14] summarized and analyzed the route selection data of the Baotou–Lanzhou railway and found that the route selection in the desert area should avoid the moving sand dunes as much as possible, and the flat curve is easy to use as the large radius curve. Feng [15] summed up the experience of the route selection of the Korla–Golmud railway and put forward the suggestion that the outer side of the curve should face the main wind direction of the selected route in the sandstorm area. Ma [16] put forward the plan to lead the road with bridges through the floating sand dune area in a section of the Hotan–Ruoqiang railway line. Although the above scholars have elaborated on the basic principles of railway-line selection in the Gobi Desert area, the mechanisms of action need further study.
Computational fluid dynamics (CFD) have been widely used in the fields of bridges [17], railways [18], and construction engineering [19], and it has become an important way for researchers to study wind-blown sand movement [20,21,22,23]. Therefore, scholars [24,25] used numerical simulation to study the interaction mechanism between wind–sand flow and embankments. In 2008, Wu [26] used the Fluent–Euler two-fluid model to describe the mechanism of action between wind–sand flow and embankments and optimized the parameters of the embankment under the action of wind–sand flow. Li [27] used wind-tunnel experiments and numerical simulation to study the flow-field-distribution characteristics of embankments and cuttings under the action of wind–sand flow. Shi [28] used the Euler two-fluid model to analyze the flow-field changes and sand accumulation characteristics when wind–sand flows through the embankment. At present, the research on the response law of wind–sand flow and embankments is mainly based on wind-tunnel experiments and numerical simulation, and the analysis is mainly carried out from a two-dimensional perspective, but the three-dimensional numerical simulation of sand flow combined with a flat-curve embankment is rarely involved.
The paper relies on the Tengger Desert section of the Wuhai–Maqin Highway, and is based on the CFD software, as well as the angle between the wind direction and the line direction. The embankment flow-field of different curve elements were numerically simulated, and the influence of the angle and curve elements on airflow velocity was systematically studied. In the present work, after comparing and verifying the sand accumulation situation on the highway, the design points of the plane alignment parameters are summarized, which provides a reference for the selection of highway routes in desert areas.
2. Numerical Simulation
2.1. Model Description
According to the embankment cross-section parameters of the Wuhai–Maqin highway, a 3D simplified model was established. The width of the embankment surface was 26 m, the height of the embankment was 2 m, and the grade of the side slope is 1:3. In the model, the angle between wind direction and the straight-line embankment was recorded as α (α is taken as 30°, 50°, 90°). In order to ensure the full development of the flow field, the calculation domain of the overall model after trial calculation adopted X × Y × Z = 180 m × 60 m × 32 m [29,30], as shown in Figure 1a. The radius of the embankment in the curved section was denoted as R (R = 400 m, 1000 m, 2000 m, 3000 m), and the computational domain adopted X × Y × Z = 160 m × 300 m × 32 m, as shown in Figure 1b.
According to the existing literature, in order to ensure the full development of the flow field, the height of the model from the upper boundary of the computational domain should be at least 5H (H is the height of the model, and the height of the subgrade model in this paper was 2 m), at least 10H from the entrance, and at least 20H from the exit [31,32]. Therefore, the set computational domain size was reasonable and had no effect on the simulation results.
2.2. Numerical Method
The sand particle size in the study area was 0.075~0.25 mm, the sand particle size in the wind–sand flow was set to be 0.1 mm, the sand density was 2650 kg/m3, and the sand kinematic viscosity coefficient was 0.047 kg/(m∙s) [33]. The volume fraction of sand grain phase was 0.03, the inlet wind speed adopted logarithmic flow wind speed, and the maximum wind speed measured in the test section was 18m/s, so the axial wind speed at the entrance of the model was 18m/s, and its typical wind speed profile can be calculated using Equation (1) [34,35]:
where is the velocity at the height of z, is the frictional wind speed, is the Von Kármán constant, which is taken as 0.4. z is the height, and is the rough length.
Numerical simulations were carried out by the CFD code ANSYS Fluent (version 2020 R1). The desert wind-blown sand flow is generally in a saturated state, and the sand volume fraction is large, so it should be simulated by a two-fluid model. Therefore, the calculation model adopted the Euler two-fluid unsteady model, and the solution algorithm adopted simplec [36,37]. The wind speed in the study area was not greater than 50 m/s, and the sand was mainly affected by gravity. The wind–sand flow can be regarded as an incompressible fluid. The heat exchange between wind–sand flows can be ignored, so the energy equation was not considered. The two equations of the continuity equation, momentum equation, and the turbulence model were considered when studying the characteristics of wind–sand movement. The calculated residuals are controlled to 10−5 to ensure that the results are convergent and accurate.
2.3. Boundary Conditions and Computational Mesh
The selection of boundary conditions for the 3D model is shown in Table 1.
The computational meshes used in this study were generated by SnappyHexMesh. All the cells were unstructured hexahedral grids to adapt to complex model surfaces. In addition, the area around the embankment was locally refined. The mesh size of the locally refined part of the angled embankment model was controlled at 0.1 m, and the other area was controlled at 0.4 m. In the flat-curve embankment model, the mesh size of the local refinement was controlled at 0.1 m, and the other size was controlled at 0.5 m.
2.4. Reliability Verification
In order to verify the reliability of the flow field in numerical simulation, a flow-field model with the same size as the wind-tunnel test in Reference [38] was established in this paper. On the basis of the above parameter settings, the wind-speed profile of the numerical simulation and the wind-tunnel experiment were compared. The wind-tunnel model established in the literature [38] was 1.45 m high × 22 m wide, and the frictional wind speed was 0.6395 m/s. The measured wind speed and simulated wind speed are shown in Figure 2. It can be seen that the wind speed profile results from the wind-tunnel test and numerical simulation were in good agreement. Therefore, the flow-field structure and related calculation parameters set in this paper were reasonable and reliable.
3. Results and Analysis
3.1. Analysis of the Results of the Angle Embankment Model
3.1.1. Distribution Characteristics of the Wind–Sand Flow Field
Taking the sand-carrying wind of 18 m/s as the inlet velocity of the flow field, the wind–sand movement law of the straight embankment under different angles conditions (α = 90°, 50°, 30°) is simulated, and the cross-section at the middle position of the flow field (Y = 30 m) is taken to compare the flow-field structure changes around the embankment. It can be seen from Figure 3 that, when the wind–sand flow passes through the embankment, the speed is divided into zones. The wind–sand flow forms a deceleration zone, an acceleration zone, a high-speed zone, and a low-speed zone at the windward side of the slope toe, slope surface, road shoulder, road center, and the leeward side of the slope foot, respectively. However, under the action of different angles, the structure of the wind–sand flow field around the embankment is different. When the angle α is 90°, the wind–sand flow can form an obvious deceleration and acceleration area at the toe of the embankment. When α is reduced to 30°, the deceleration area on the windward side of the embankment and the vortex area on the leeward side of the embankment are significantly reduced, the changes of each wind speed block are difficult to distinguish, and the transition of the wind–sand flow passing through the embankment is gentle.
It can be seen that, under the condition of constant wind speed, the degree of speed change around the embankment decreases with the decrease in the angle α between the wind direction and the line direction, and the speed-zone range of the wind–sand flow when passing the embankment is also reduced. The reason for this is that the change of the incoming wind direction changes the slope and the width of the road embankment. When the angle α is 90°, the cross-section of the embankment passing by the wind–sand flow is 38 m wide, the grade of the side slope is 1:3, the embankment has a great hindering effect on the wind–sand flow, and the flow-field division of the embankment cross-section is obvious. When the angle α is 30°, the cross-section of the embankment passing by the wind–sand flow is 76 m wide, and the grade of the side slope is 1:6. The increase in the pavement width and the decrease in the grade of the side slope reduces the energy loss of the wind–sand flow when passing through the embankment, the speed change is gentle, and the zoning phenomenon is not obvious.
In order to further study the law of wind-blown sand movement at different positions along the line, when the angle α is 50°, flow-field analysis is carried out on the cross-section of the embankment at different positions (Y = 10 m, Y = 30 m, Y = 50 m), and the results are shown in Figure 4. It can be seen that there are obvious differences in the flow-field distribution of the three embankment cross-sections. The variation of airflow around the embankment under oblique wind conditions is different from the symmetrical flow-field structure under orthogonal wind conditions. The flow-field distribution changes with the position of the road, especially at the shoulder of the road: when Y = 10 m, the airflow on the upper shoulder of the windward slope is relatively dispersed, and when Y = 50 m, the airflow on the upper shoulder of the windward slope is gradually tight. The reason for this is that when the oblique wind–sand flow passes through the embankment, the wind–sand flow at the starting point of the line first crosses the embankment. Due to the angle between the wind direction and the line, the line has a lateral dredging effect on the wind–sand flow, and part of the air flow is transported to the direction of the line, resulting in a relatively dispersed airflow on the upper shoulder of the road at the starting point of the line. When the guided airflow and the airflow behind the line converge, the airflow on the upper shoulder of the windward slope behind the line gathers.
It can be seen that, under the condition of constant wind speed, the distribution of the flow field around the embankment is not only related to the cross-sectional parameters of the embankment, but also to the position of the line.
3.1.2. Characteristics of Horizontal Wind Speed Distribution
The near-surface wind speed has a significant impact on the movement of sand particles. The horizontal speed of the axis wind speed of 18 m/s at different heights from the embankment is analyzed, and the variation law of airflow speed around the embankment is studied, as shown in Figure 5.
It can be seen from Figure 5 that, at the same height at different angles, the speed of the wind–sand flow is basically the same. When the angle α between the wind direction and the line is 90°, 50°, and 30°, and when the distance from the top of the embankment is 0.3 m and 0.5m, the maximum wind speeds are 16.45 m/s, 15.85 m/s, 14.29 m/s, and 17.46 m/s, 16.40 m/s and 14.65 m/s; they are 1.05, 1.00, 0.91, and 1.11, 1.03, 0.93 of the initial wind speed, respectively. With the decrease in the angle, the wind erosion effect of the airflow on the road shoulder gradually weakens.
On the slope of the windward side of the embankment, the speed decreases. At the shoulder of the windward side of the embankment, the speed reaches the maximum due to the influence of the current-collecting effect, and the speed decreases to the minimum at the position of 1/3 of the embankment surface; the wind speed changes around the embankment. It gradually decreases as the angle between the wind direction and the line decreases.
3.1.3. Distribution Characteristics of Sand Accumulation on Embankment
Figure 6 shows the cloud map of sand accumulation around the embankment at t = 60 s at different angles. When the angle α = 90°, the sand accumulation is mainly distributed at the toe of the windward slope of the embankment, the toe of the leeward slope, and the rear area away from the leeward slope. The distribution of sand accumulation is relatively uniform. Comparing Figure 6b,c, it can be seen that the sand accumulation at the starting position of the line is far less than that at the end of the line, and the smaller the angle is, the greater the difference in the amount of sand accumulation on both sides. It shows that, when there is an angle between the wind direction and the line, the line has a lateral dredging effect on the wind–sand flow, so that some sand particles change from the linear movement across the embankment to the lateral movement along the line direction, resulting in the accumulation of sand particles at the far end of the line.
When there is an angle between the wind direction and the line direction, the wind has a certain ability to transport and divert the sand accumulation on the roadside slope: the smaller angle α is between wind direction and the line, the stronger the transportation ability is and the less sand accumulation there is around the embankment. In the design process, the angle between the line and the main wind direction should be minimized.
3.2. Analysis of the Results of the Flat-Curve Embankment Model
3.2.1. Distribution Characteristics of the Wind–Sand Flow Field
Taking the section at Y = 150 m in the middle of the line, the activity law of the wind–sand flow field around the embankment under different curve radii is studied, as shown in Figure 7. The distribution characteristics of the flow field of the embankment are similar to those of the angle embankment model, and the value of the radius does not change the distribution characteristics of the flow field of the embankment.
When the radius is 1000 m, intercept the cross-sectional flow field of the embankment when the curve is convex (concave) curve face the wind at the position of Y = 150 m, as shown in Figure 8. The flow-field distribution of the two is similar, and the convex and concave curve facing the wind does not change the flow-field distribution of the embankment.
In order to further study the relationship between the flow-field distribution of the embankment cross-section and the different positions of the line, when the radius of the convex windward embankment was 400 m, two sections of Y = 10 m and Y = 150 m were taken for flow-field analysis, and the results are shown in Figure 9. It was found that there is a certain difference in the distribution of the flow field between the two, especially at the shoulder position. When Y = 10 m, the wind–sand flow at the windward shoulder was relatively tight, while it was relatively sparse at Y = 150 m. This is because the middle of the line is in contact with the air flow first, and the convex windward curve has a lateral conduction effect on the air flow, which causes the wind–sand flow at the shoulder at the middle point of the line (Y = 150 m) to be more dispersed than the wind–sand flow at the shoulders at the points on both sides of the line (Y = 10 m).
On the other hand, the two sides of the line on the concave windward embankment contact the wind–sand flow earlier than the middle point, and the line had a converging effect on the air flow.
3.2.2. Characteristics of Horizontal Wind Speed Distribution
For the section at z = 1.5 m on the windward side, the wind–sand velocity at positions 3 m, 5 m, 10 m, 20 m (s = 3 m, 5 m, 10 m, 20 m) was extracted from the midpoint of the slope foot of the line. The results are shown in Figure 10. It can be seen that the wind speed change of the sand-carrying wind is distributed in a “V” shape, the speed at the midpoint of the line is the smallest, and the speed on both sides is the largest, and the speed change range gradually decreases with the increase in the curve radius, indicating that the convex curved embankment has a lateral transport effect on wind–sand flow. Additionally, the smaller the radius is, the stronger the lateral transport ability is.
The horizontal wind speed of the concave windward curve is also extracted. The results are shown in Figure 11. It can be seen that the wind speed of the sand-carrying wind is distributed in an inverted “U” shape. As the value of the curve radius increases, the difference in wind–sand flow velocity decreases gradually, indicating that the concave curve embankment had a gathering effect on the wind–sand flow, and the smaller the radius, the stronger the gathering ability is.
3.2.3. Distribution Characteristics of Sand Accumulation on the Embankment
When the simulation time is t = 60 s, the sand accumulation around the subgrade slope does not change much. Therefore, the sand cloud map of t = 60 s is selected for analysis, as shown in Figure 12 and Figure 13. It can be seen that the convex windward curve embankment has a lateral diversion effect on the wind–sand flow, and the wind–sand flow spreads to both sides before reaching the embankment, and the sand accumulation in the middle of the line on the windward side is less than that on both sides. However, when the radius is small, the sand particles on both sides of the line will accumulate on the road due to the excessive concentration, affecting driving safety. With the increase in the radius of the flat curve, the distribution of sand accumulation in the line gradually becomes uniform, and the large amount of sand accumulation on both sides is significantly reduced.
The phenomenon of sand accumulation on the concave windward embankment is opposite to that of the convex windward. The sand accumulation is mainly distributed in the middle area along the road. The reason for this is that the sand accumulates in the middle part along the road after reaching the embankment. Therefore, it is easy to generate sand accumulation; when the radius is 400 m, the gathering effect of the middle part along the road is strong, and when the radius of the curve increases, the distribution of sand accumulation along the road is gradually uniform, and the large amount of sand accumulation in the middle area is significantly reduced.
To sum up, the convex windward embankment is conducive to the outward drainage of the wind–sand flow, while the concave windward embankment is easy to make the wind–sand flow gather inward.
4. Field Verification
In order to better grasp the characteristics of wind–sand activities in this area, a full-element meteorological observation station was established at line K166 + 600, and the data of wind speed and wind direction in summer 2021 can be counted. The calculation of drift potential (DP) is listed in Equation (2) [39]. According to Equation (2), the sand-moving wind rose, and the sand-drift potential in this area can be obtained, as shown in Figure 14. In summer, the east-southeast (ESE) wind is dominant, and the resultant drift direction (RDD) is 298.27°.
where DP is the drift potential, V is the average wind velocity at 10 meter height, Vt is the impact threshold wind velocity (Vt = 5.75 m/s [40]), and t is the time wind blew, expressed as a percentage in a wind summary.
In order to verify the accuracy of the numerical simulation in actual engineering, the three-dimensional aerial survey of unmanned aerial vehicle was used to photograph and process the sand distribution around the embankment at K166 + 100 in April and August 2021 (Figure 15).
It can be seen from Figure 15 that the angle between the sand-moving wind direction and the line direction is about 50°. There was basically no sand accumulation on either side of the line in April 2021. In August 2021, it can be seen that there was a small amount of sand at the foot of the windward side slope. There is a lot of sand accumulation at the foot of the slope on the leeward side, and the sand accumulation on the lower side of the line was far more than the sand accumulation on the upper side. Comparing with Figure 6b, it can be found that the two have good consistency.
Figure 16 is a map of sand accumulation around the embankment with a curve radius of R = 5500 m. The tangent of the curve is 1048 m. In this paper, only a circular curve with a tangent length of 300 m from the center of the circle was selected, and the line direction was at a certain angle to wind direction. It can be seen that there was some sand accumulation on both sides of the embankment at the intersection of the curve, while there was almost no sand accumulation on both sides of the embankment at the starting position of the curve. Considering the influence of wind direction and the angle of the line on the sand accumulation, it can also be seen that the concave curve had a gathering effect on the sand particles, resulting in sand accumulation in the middle of the line. This phenomenon can better verify the sand cloud map of the concave windward embankment.
5. Conclusions
The plane alignment parameter has a great influence on the change of the flow-field structure near the embankment, which not only changes the movement trajectory of the wind–sand flow on the embankment surface, but also affects the movement mode and gathering positions of the blown sand particles. Using numerical simulation, combined with the analysis of the sand accumulation form in the field, the following conclusions are obtained:
(1) When the oblique wind–sand flow crosses the embankment, the separation scale of the moving wind–sand flow can be reduced, and the severity of the wind-speed change around the road decreases with the decrease in the angle between wind direction and line direction.
(2) The change of the flow-field structure of the plane alignment embankment is not only related to the characteristics of the embankment itself, but the flow-field structure of the road at different locations along the road is also different due to the diversion effect generated when the oblique airflow passes through the embankment.
(3) The convex windward embankment has the effect of dredging the wind–sand flow outward, and the concave windward embankment collects the wind–sand flow inward, and the dredging and collection effects both weaken with the increase in the radius.
(4) In the design of plane alignment in desert areas, preliminary investigations should be fully conducted to grasp the characteristics of local wind and sand, and a straight-line parallel to the dominant wind direction. If a flat curve needs to be set to avoid obstacles, a convex windward curve is preferred, and a small radius curve should be avoided.
Author Contributions
Conceptualization, L.L. and Z.T.; methodology, Z.T.; software, Z.T.; validation, W.Y., Z.L.; investigation, W.Y.; writing—original draft preparation, L.L. and Z.T.; writing—review and editing, W.Y., Z.L; funding acquisition, L.L. and W.Y. All authors have read and agreed to the published version of the manuscript.
Funding
This research was funded by the Department of Transportation of Ningxia, grant number 20200173.
Institutional Review Board Statement
This study did not involve humans or animals.
Informed Consent Statement
This study did not involve humans.
Data Availability Statement
This study did not report any data.
Conflicts of Interest
The authors declare no conflict of interest.
References
- Okin, G.S.; Gillette, D.A.; Herrick, J.E. Multi-scale controls on and consequences of aeolian processes in landscape change in arid and semi-arid environments. J. Arid Environ. 2006, 65, 253–275. [Google Scholar] [CrossRef]
- Wang, T. Progress in sandy desertification research of China. J. Geogr. Sci 2004, 14, 387–400. [Google Scholar]
- Zhong, D.C. Dynamic Evolution of China’s Sand Sea; Gansu Culture Press: Lanzhou, China, 1998. [Google Scholar]
- Han, Z.W.; Wang, T.; Sun, Q.W.; Dong, Z.; Wang, X. Sand harm in Taklimakan Desert highway and sand control. J. Geogr. Sci. 2003, 13, 45–53. [Google Scholar] [CrossRef]
- Lei, J.Q.; Wang, X.Q.; Wang, D.; Zhou, C.; Xia, X. The blown sand disaster to the Tarim Desert Highway in Xinjiang, China. Sci. China Ser. D Earth Sci. 2002, 45, 165–173. [Google Scholar] [CrossRef]
- Ling, L.; Wu, H.X. Expressway Traffic Safety Analysis. Highw. Transp. Sci. Technol. 2003, S1, 123–126. [Google Scholar]
- Wang, F.; Li, X.G.; Guo, H.; Hu, J. Optimization of straight segment index between highway curves of desert grassland based on driver’s visual interest region. J. Jilin Univ. 2020, 50, 114–120. [Google Scholar]
- Tong, S.J.; Wang, P. Analysis of Minimum Radius of Circular Curve under Influence of Different Elevations and Different Levels of Wind for High Grade Highways. Highway 2012, 12, 61–64. [Google Scholar]
- Zhou, H.Z. Research on the Alignment Parameters of the Expressway in the Gobi Desert Area of Qinghai Province; Chang’an University: Xi’an, China, 2011. [Google Scholar]
- Zakeri, J.A.; Maryam, F. Railway route design in desert areas. Am. J. Environ. Eng. 2012, 2, 13–18. [Google Scholar] [CrossRef]
- Jabbar, A.Z. Investigation on railway track maintenance in sandy-dry areas. Struct. Infrastruct. Eng. 2012, 8, 135–140. [Google Scholar]
- Shi, L.; Wang, D.Y.; Li, K.C. Windblown sand characteristics and hazard control measures for the Lanzhou–Wulumuqi high-speed railway. Nat. Hazards 2020, 104, 353–374. [Google Scholar] [CrossRef]
- Zu, R.P.; Xue, X.; Qiang, M.R.; Yang, B.; Qu, J.; Zhang, K. Characteristics of near-surface wind regimes in the Taklimakan Desert, China. Geomorphology 2008, 96, 39–47. [Google Scholar] [CrossRef]
- Li, X.; Chu, Y.C. Route selection and treatment of Shapotou Desert, the first desert railway in China-Baolan Line. J. Railw. Eng. Soc. 2005, S1, 173–176. [Google Scholar]
- Feng, D.Q. Route Selection of the Korla-Golmud Railway in Storm Sand Area. Railw. Eng. 2012, 6, 110–113. [Google Scholar]
- Ma, S.J. Study on Route Selection of Hotan-Ruoqiang Railway in Windblown sand area. Railw. Eng. 2021, 61, 139–143. [Google Scholar]
- Scanlan, R.H. The action of flexible bridges under wind, II: Buffeting theory. J. Sotmd Vib. 1978, 60, 201–211. [Google Scholar] [CrossRef]
- Song, Y.; Zhang, M.; Øiseth, O.; Rønnquist, A. Wind deflection analysis of railway catenary under crosswind based on nonlinear finite element model and wind tunnel test. Mech. Mach. Theory 2022, 168, 104608. [Google Scholar] [CrossRef]
- Jun, Y.; Li, Q.S. Wind tunnel and full-scale study of wind effects on a super-tall building. J. Fluids Struct. 2015, 58, 236–253. [Google Scholar]
- Cheng, J.J.; Lei, J.Q.; Li, S.Y.; Wang, H.F. Effect of hanging-type sand fence on characteristics of wind-sand flow fields. Wind Struct. 2016, 22, 555–571. [Google Scholar] [CrossRef]
- Janardhan, P.; Narayana, H. Numerical modelling of shelter effect of porous wind fences. Wind Struct. 2019, 29, 313–321. [Google Scholar]
- Ke, S.T.; Dong, Y.F.; Zhu, R.K.; Wang, T. Wind-sand coupling movement induced by strong typhoon and its influences on aerodynamic force distribution of the wind turbine. Wind Struct. 2020, 30, 433–450. [Google Scholar]
- Zhang, Y.N.; Jiang, C.; Zhan, X.H. Modelling the multi-physics of wind-blown sand impacts on high-speed train. Wind Struct. 2021, 32, 487–499. [Google Scholar]
- Paz, C.; Suarez, C.; Gil, C.; Concheiro, M. Numerical study of the impact of windblown sand particles on a high-speed train. J. Wind Eng. Ind. Aerodyn. 2015, 145, 87–93. [Google Scholar] [CrossRef]
- Guo, Z.J.; Liu, T.H.; Chen, Z.W.; Liu, Z.; Monzer, A.; Sheridan, J. Study of the flow around railway embankment of different heights with and without trains. J. Wind Eng. Ind. Aerodyn. 2020, 202, 104203. [Google Scholar] [CrossRef]
- Wu, S.Z.; Liu, N.; Bo, T.L. Numerical Simulation and Wind Tunnel Experiment of Flow Field near the Highways. J. Lanzhou Univ. 2008, 4, 27–34. [Google Scholar]
- Li, C.; Gao, Y.; Huang, H. Numerical Simulation of Wind Erosion Damage Rules for Desert Highway. Rock Soil Mech. 2011, 32, 642–647. [Google Scholar]
- Shi, L.; Jiang, F.Q.; Han, F. Numerical Simulation of Response Law of Wind-blown Sand Flow around the Railway Embankment. J. China Railw. Soc. 2014, 36, 82–87. [Google Scholar]
- Xin, G.W.; Cheng, J.J.; Yang, Y.H. Study on Effect of Characteristics of Hanging-type Concrete Sand Barrier Opening and Wind-sand Field. J. China Railw. Soc. 2016, 38, 99–107. [Google Scholar]
- Xu, J.G.; Huang, N.; Shi, G.T.; Zhang, X.A. Numerical Simulation of Wind-sand Flow field of Railway Gentle Embankment. J. Lanzhou Jiaotong Univ. 2021, 40, 78–85. [Google Scholar]
- Xu, B.; Zhang, J.; Huang, N.; Gong, K.; Liu, Y. Characteristics of Turbulent Aeolian Sand Movement Over Straw Checkerboard Barriers and Formation Mechanisms of Their Internal Erosion Form. J. Geophys. Res. Atmos. 2018, 123, 6907–6919. [Google Scholar] [CrossRef]
- Li, X.J.; Jiang, F.Q. Numerical Simulation Analysis of Response Law of Wind-blown Sand Flow around Wind-break Wall in Gobi Area. Railw. Stand. Des. 2016, 60, 47–51. [Google Scholar]
- Xin, G.W.; Huang, N.; Zhang, J.; Dun, H. Investigations into the design of sand control fence for Gobi buildings. Aeolian Res. 2021, 49, 100662. [Google Scholar] [CrossRef]
- Zhang, K.; Qu, J.J.; Zhang, X.X.; Zhao, L.; Li, S. Protective Efficiency of Railway Arbor-Shrub Windbreak Forest Belts in Gobi Regions: Numerical Simulation and Wind Tunnel Tests. Front. Environ. Sci. 2022, 10, 885070. [Google Scholar] [CrossRef]
- Zhang, K.; Tian, J.J.; Qu, J.J. Sheltering effect of punched steel plate sand fences for controlling blown sand hazards along the Golmud-Korla Railway: Field observation and numerical simulation studies. J. Arid Land 2022, 14, 604–619. [Google Scholar] [CrossRef]
- Mahgoub, A.O.; Ghani, S. Numerical and Experimental Investigation of Utilizing the Porous media Model for Windbreaks CFD Simulation. Sustain. Cities Soc. 2021, 65, 102648. [Google Scholar] [CrossRef]
- Wang, H.; Takle, E.S. A Numerical Simulation of Boundary-Layer Flows Near forest Belts. Bound. Lay Meteorol. 1995, 75, 141–173. [Google Scholar] [CrossRef]
- Xin, G.W.; Huang, N.; Zhang, J. Wind-tunnel experiment on sand deposition mechanism and optimal measures of wind-break wall along railway in strong wind area. Chin. J. Theor. Appl. Mech. 2021, 52, 635–644. [Google Scholar]
- Fryberger, S.G. Dune form and wind regime. US Geol. Surv. Prof. Pap. 1979, 1052, 137–169. [Google Scholar]
- Zhang, K.C.; An, Z.S.; He, M.Z.; Zhang, L.Y.; Wang, J.G.; Hou, Y.G. Aeolian sand environments and disaster prevention along Zhongwei section of the Wuhai-Maqin Highway. Arid Land Geography. 2021, 44, 983–991. [Google Scholar]
Figure 1.
CFD model of embankment.

Figure 2.
Comparison of wind-speed profiles between wind-tunnel test and numerical simulation.
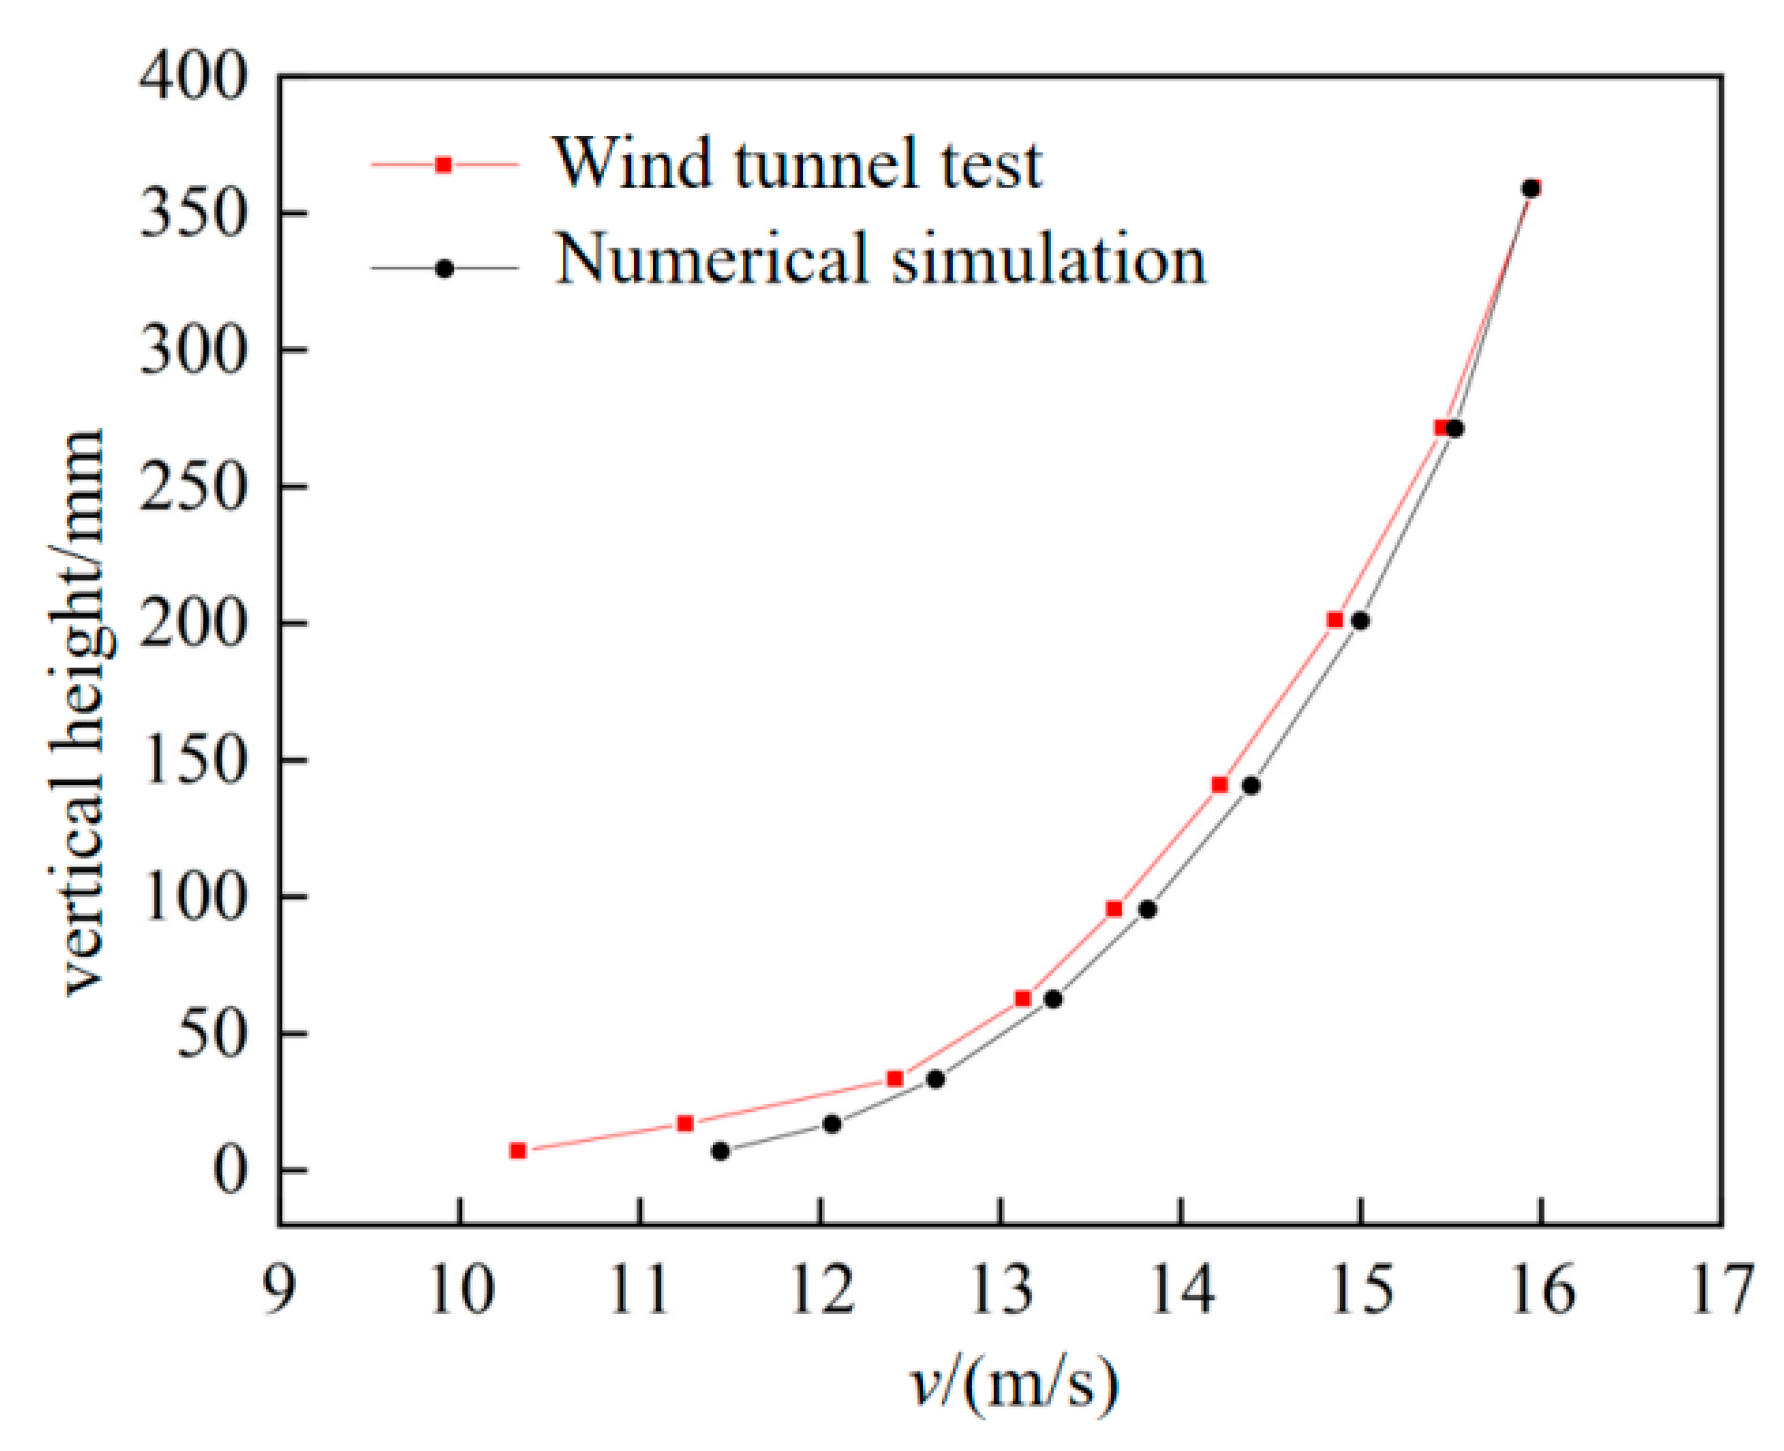
Figure 3.
Flow-field distribution of embankment cross-section at different angles.

Figure 4.
Flow-field distribution of embankment cross-section at different positions of the line when α = 50°.
Figure 4.
Flow-field distribution of embankment cross-section at different positions of the line when α = 50°.
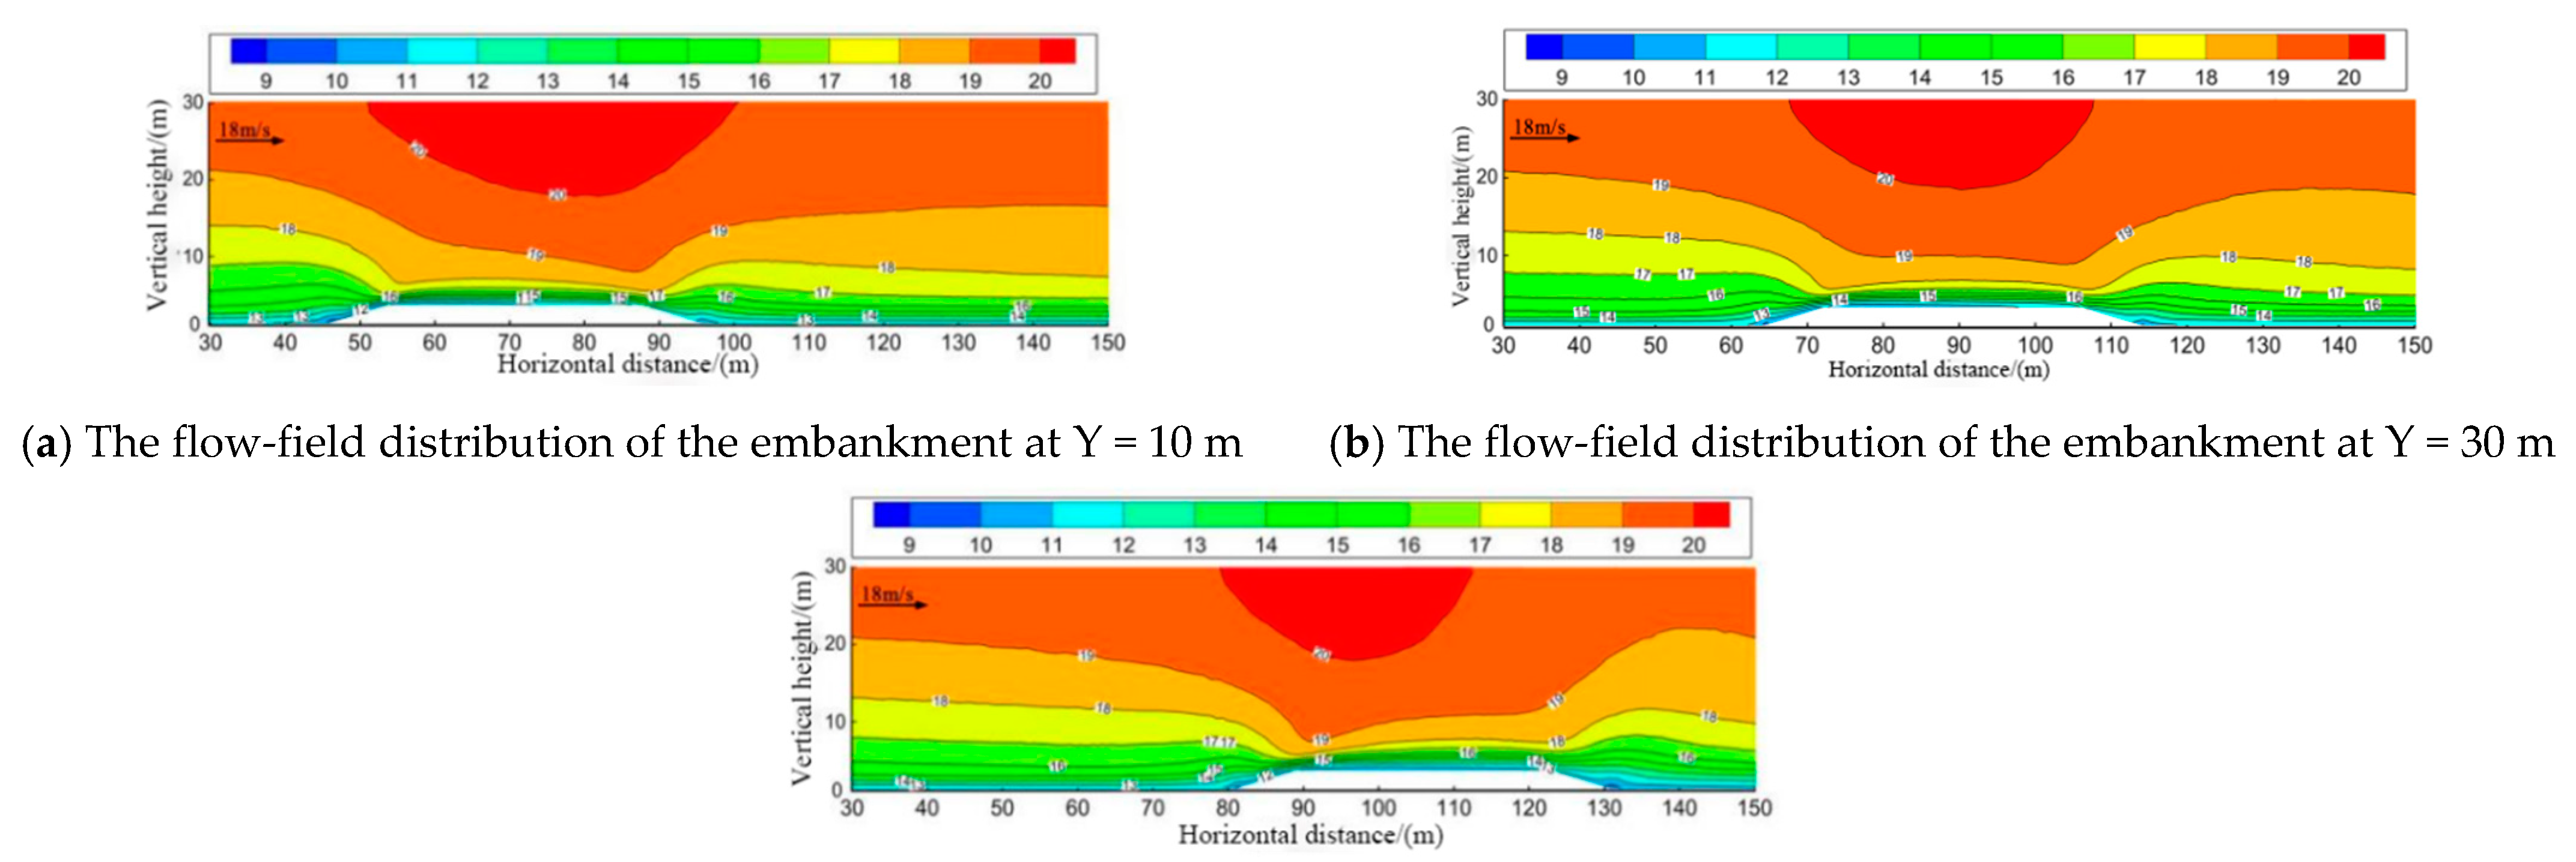
Figure 5.
Wind-speed distribution at different heights from the top of the embankment. (a) Change of wind speed at 0.3 m from the top of the embankment. (b) Change of wind speed at 0.5 m from the top of the embankment.
Figure 5.
Wind-speed distribution at different heights from the top of the embankment. (a) Change of wind speed at 0.3 m from the top of the embankment. (b) Change of wind speed at 0.5 m from the top of the embankment.

Figure 6.
Sand accumulation around embankment under different the wind direction conditions.
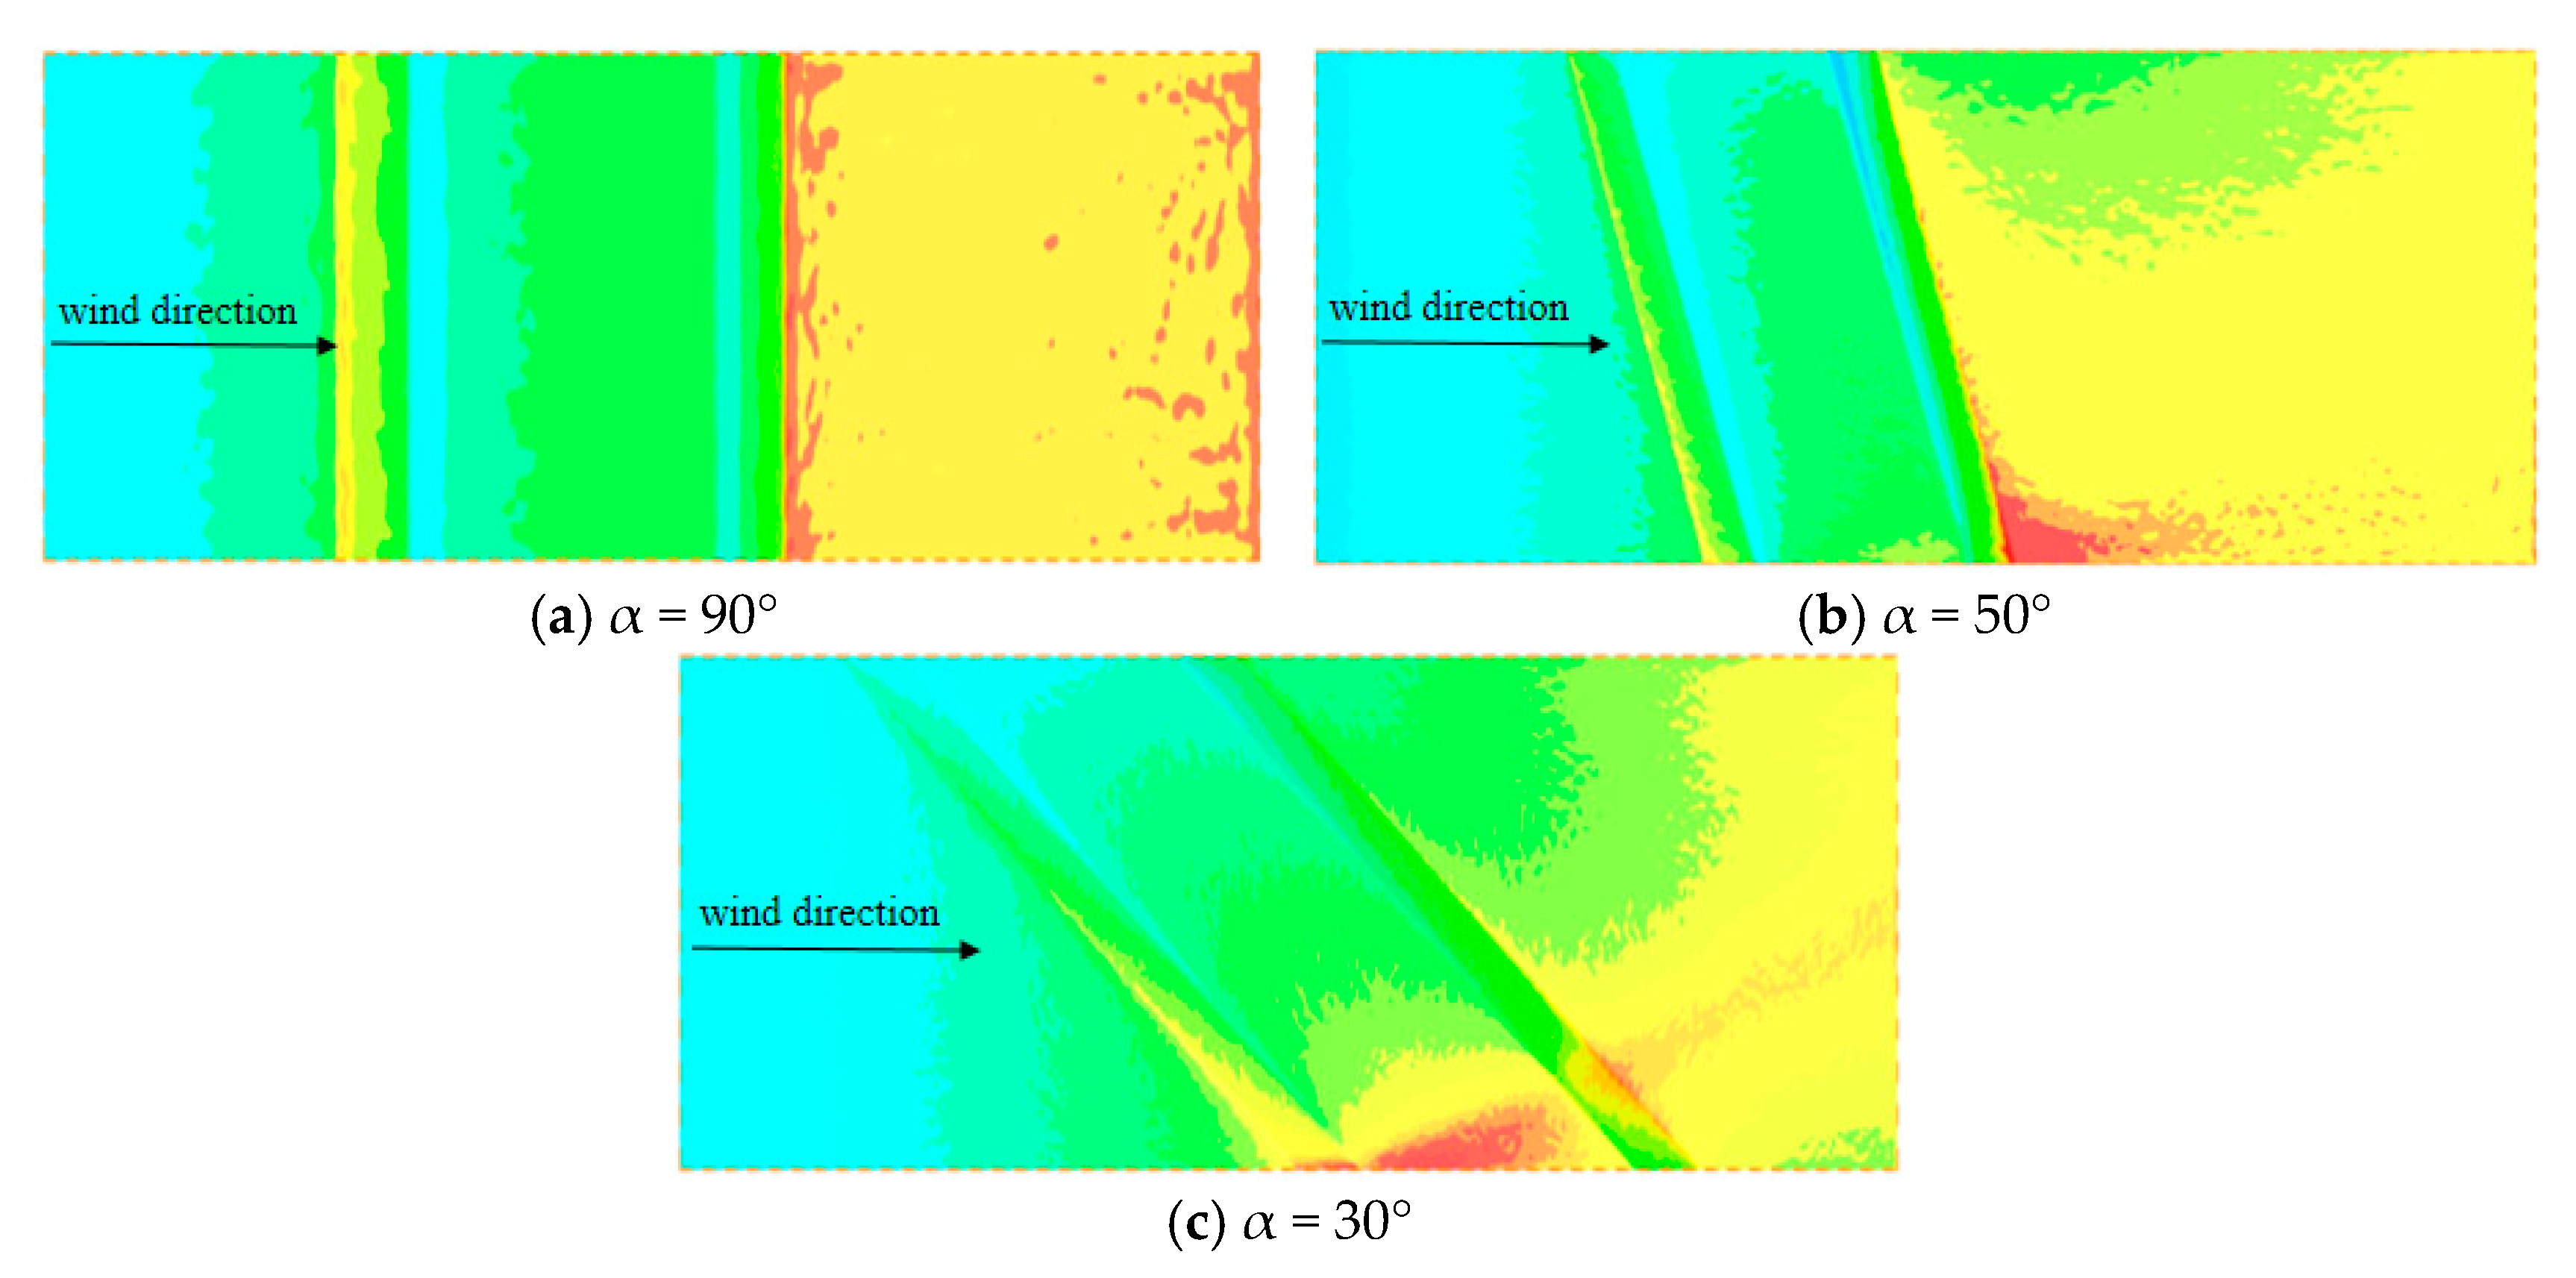
Figure 7.
Flow-field distribution at the cross-section of the embankment on the convex side windward Y = 150 m.
Figure 7.
Flow-field distribution at the cross-section of the embankment on the convex side windward Y = 150 m.
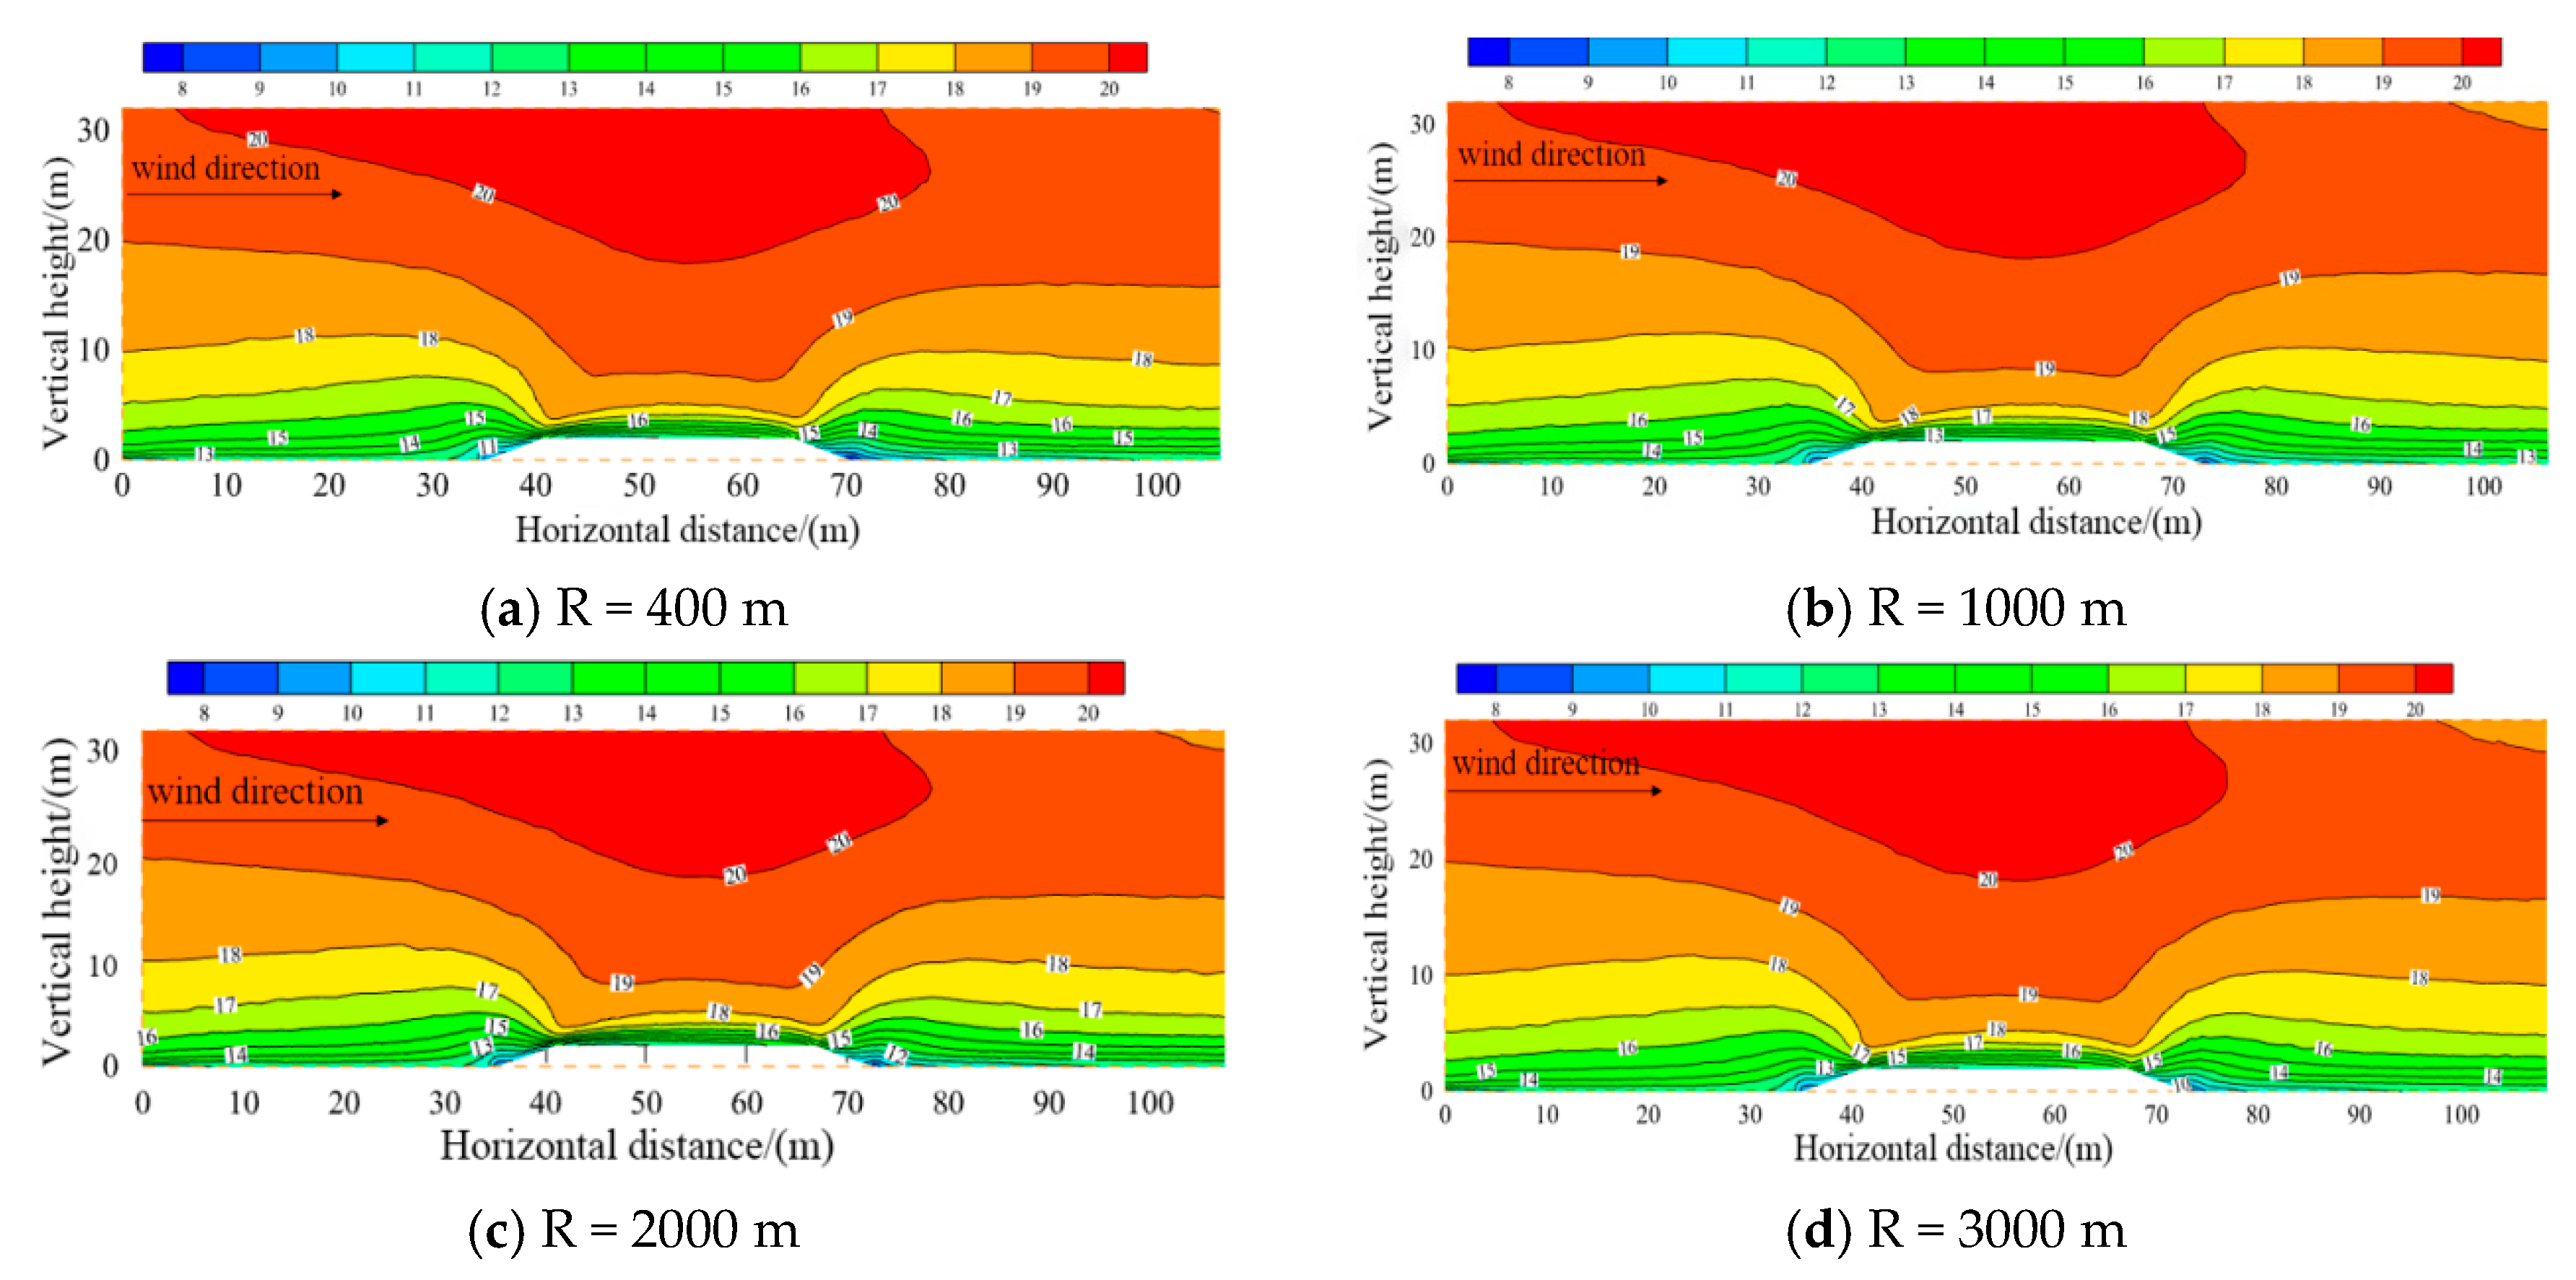
Figure 8.
Flow-field distribution at the cross-section of embankment Y = 150 m under different surface windward forms.
Figure 8.
Flow-field distribution at the cross-section of embankment Y = 150 m under different surface windward forms.

Figure 9.
Flow-field distribution of embankment cross-section at different line positions on convex windward curve.
Figure 9.
Flow-field distribution of embankment cross-section at different line positions on convex windward curve.
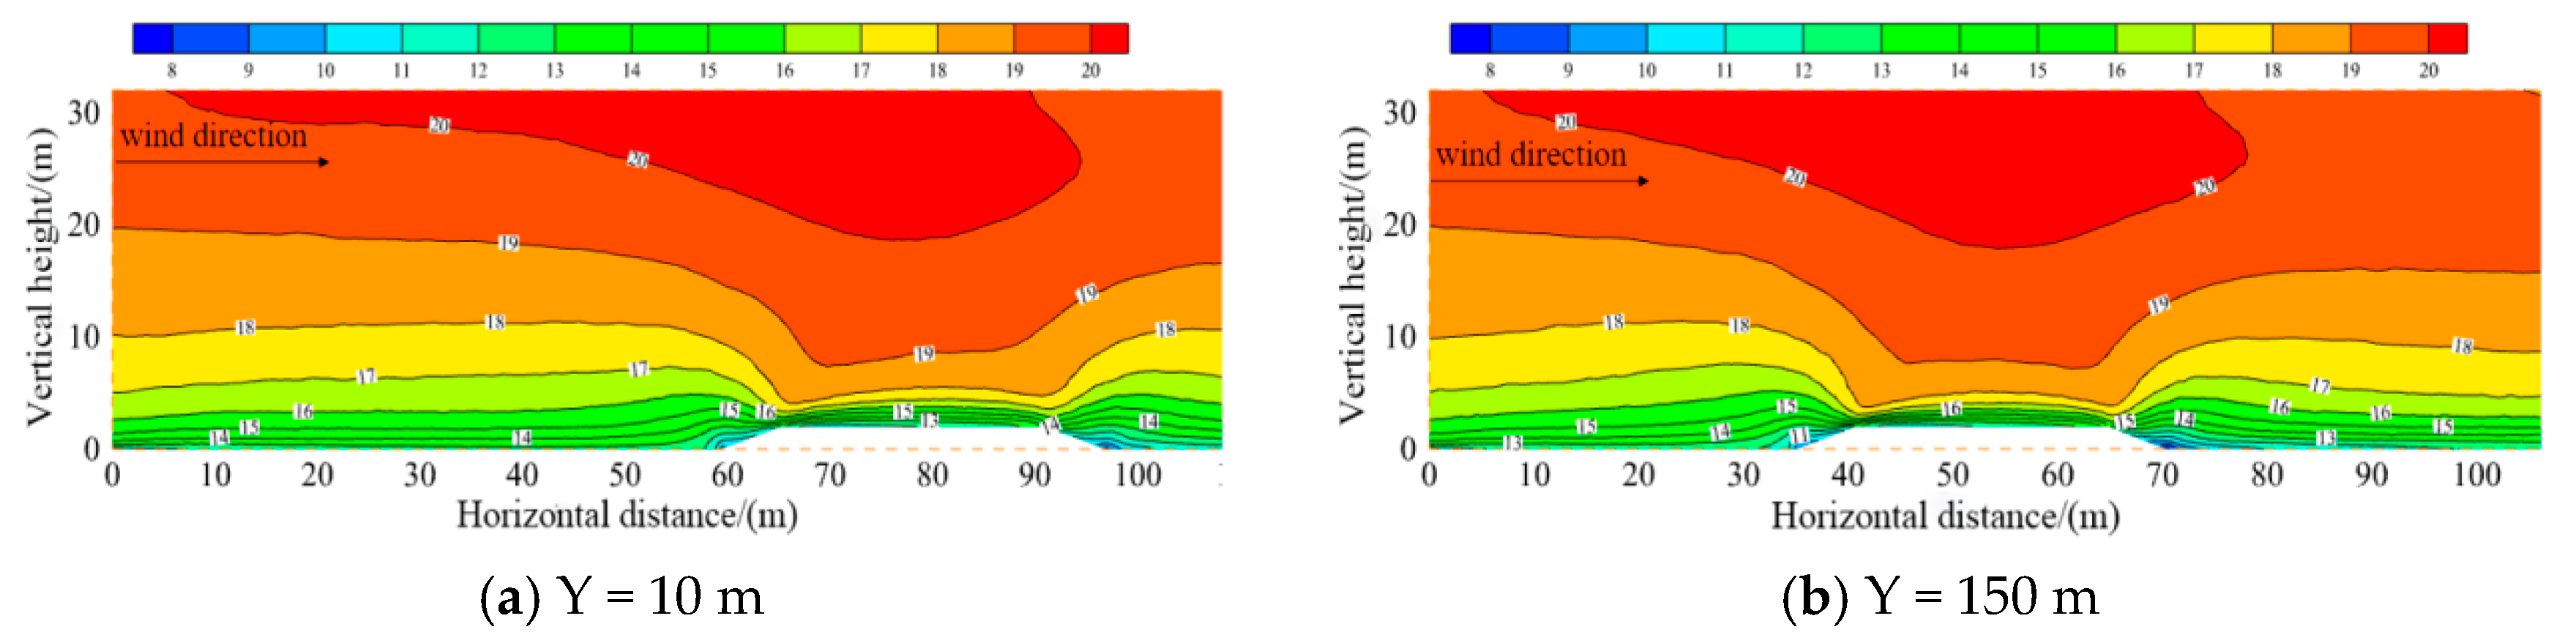
Figure 10.
Wind-speed variation on the windward side of the Z = 1.5 m convex curve.
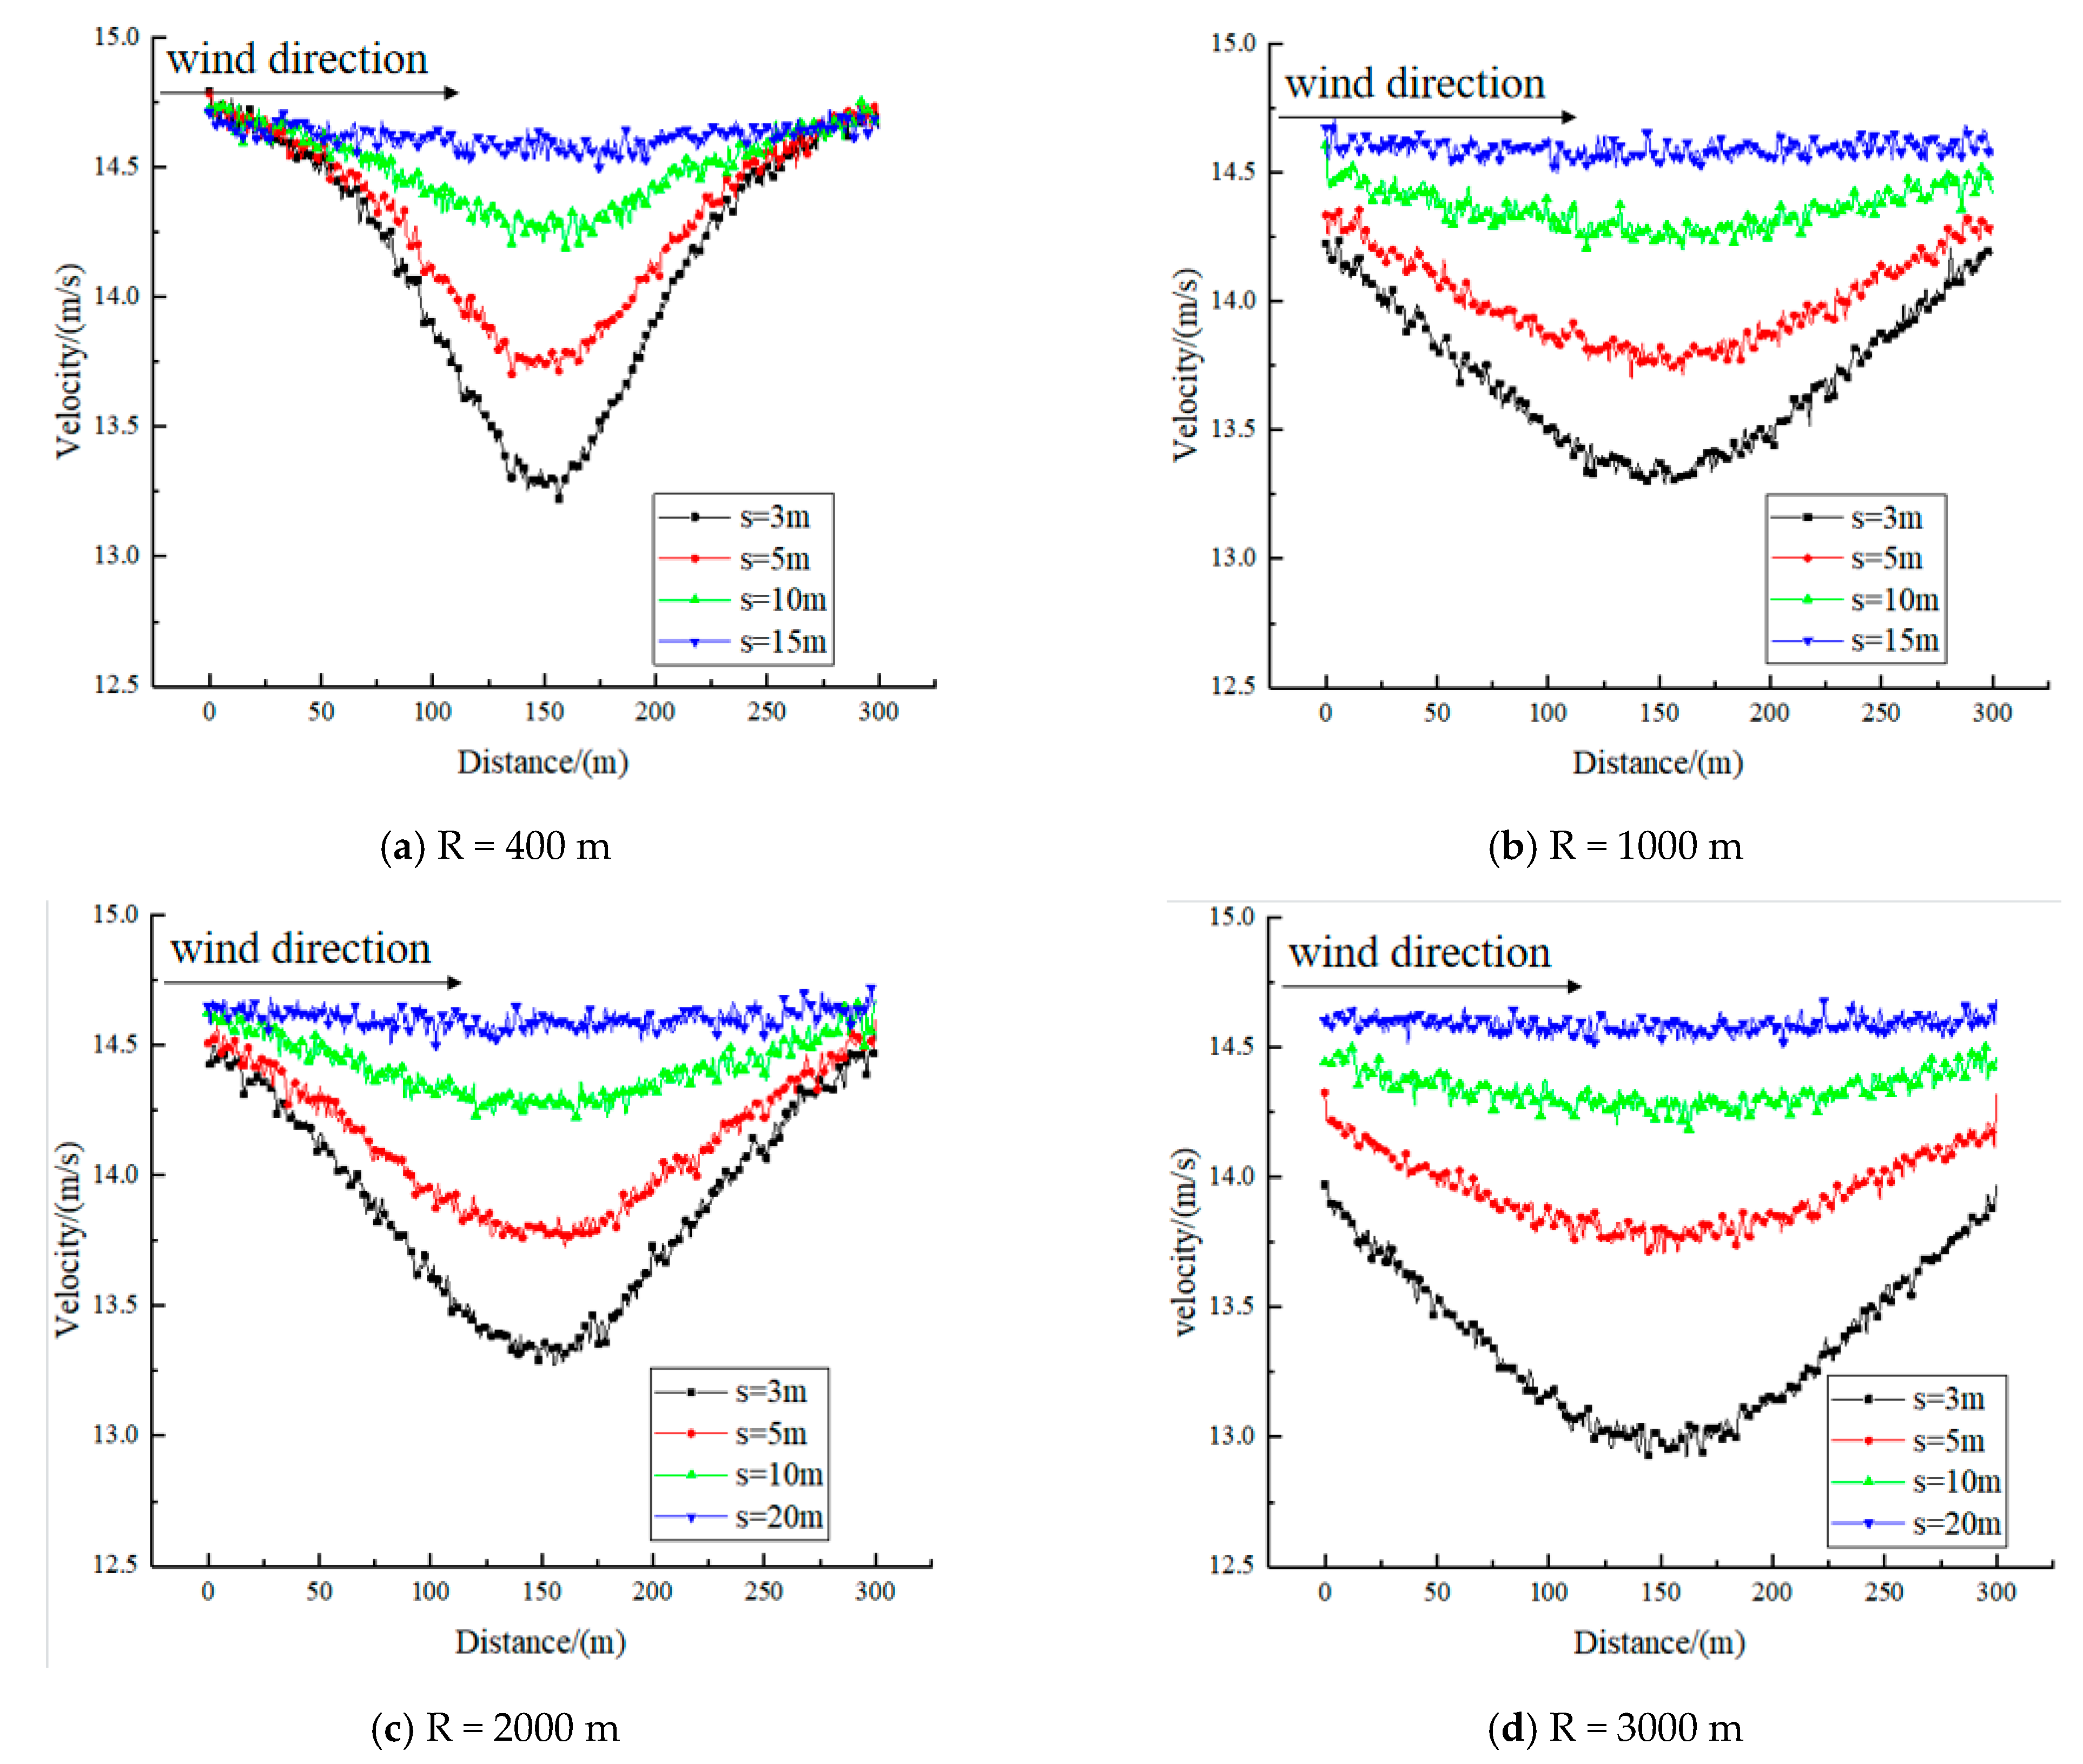
Figure 11.
Wind-speed variation on the windward side of the concave curve at Z = 1.5 m.

Figure 12.
Sand cloud map of the convex windward embankment (t = 60 s).
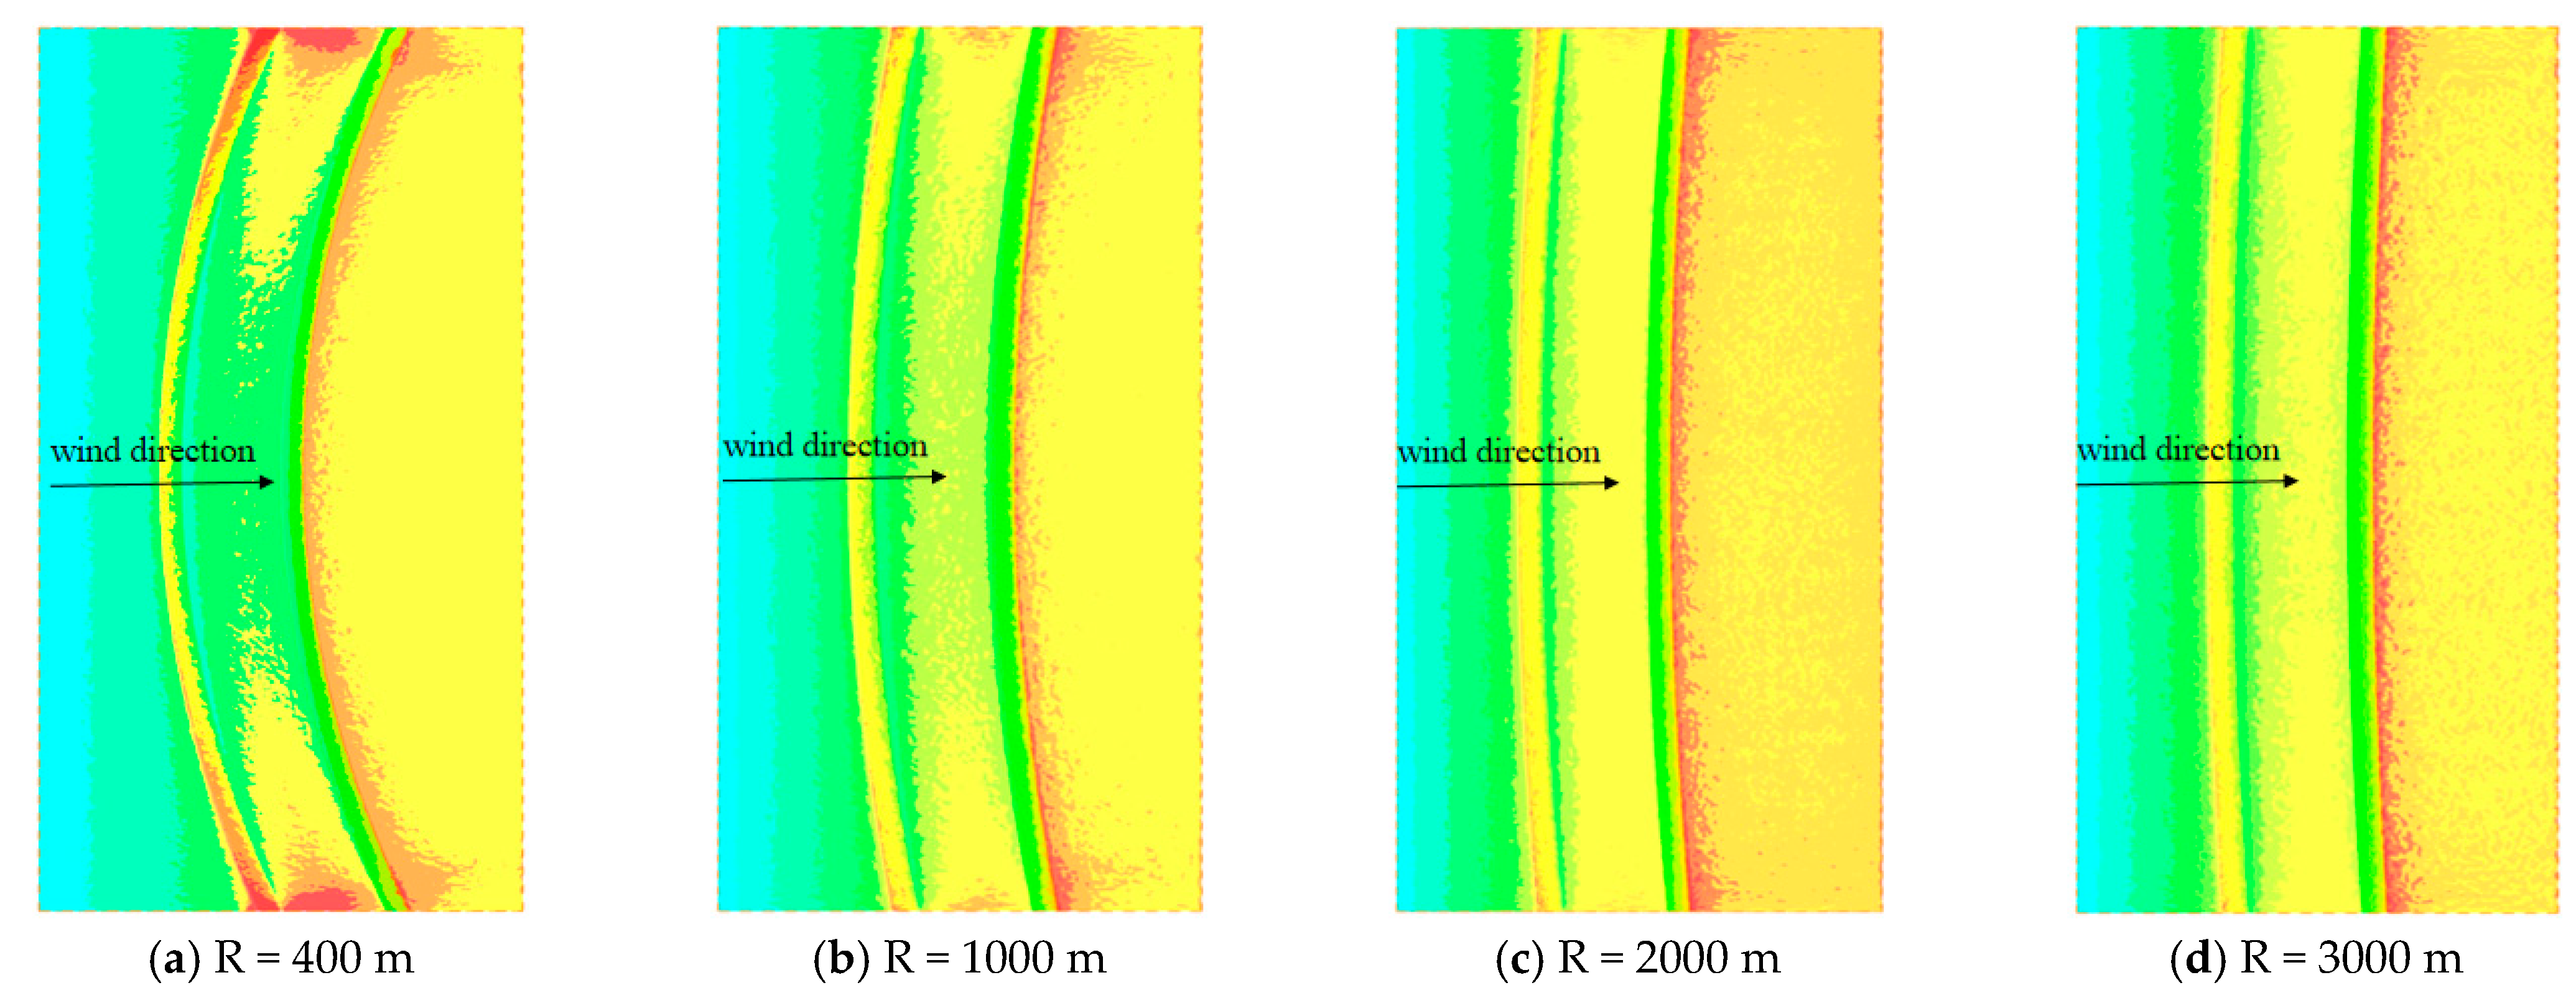
Figure 13.
Sand cloud map of the concave windward embankment (t = 60 s).
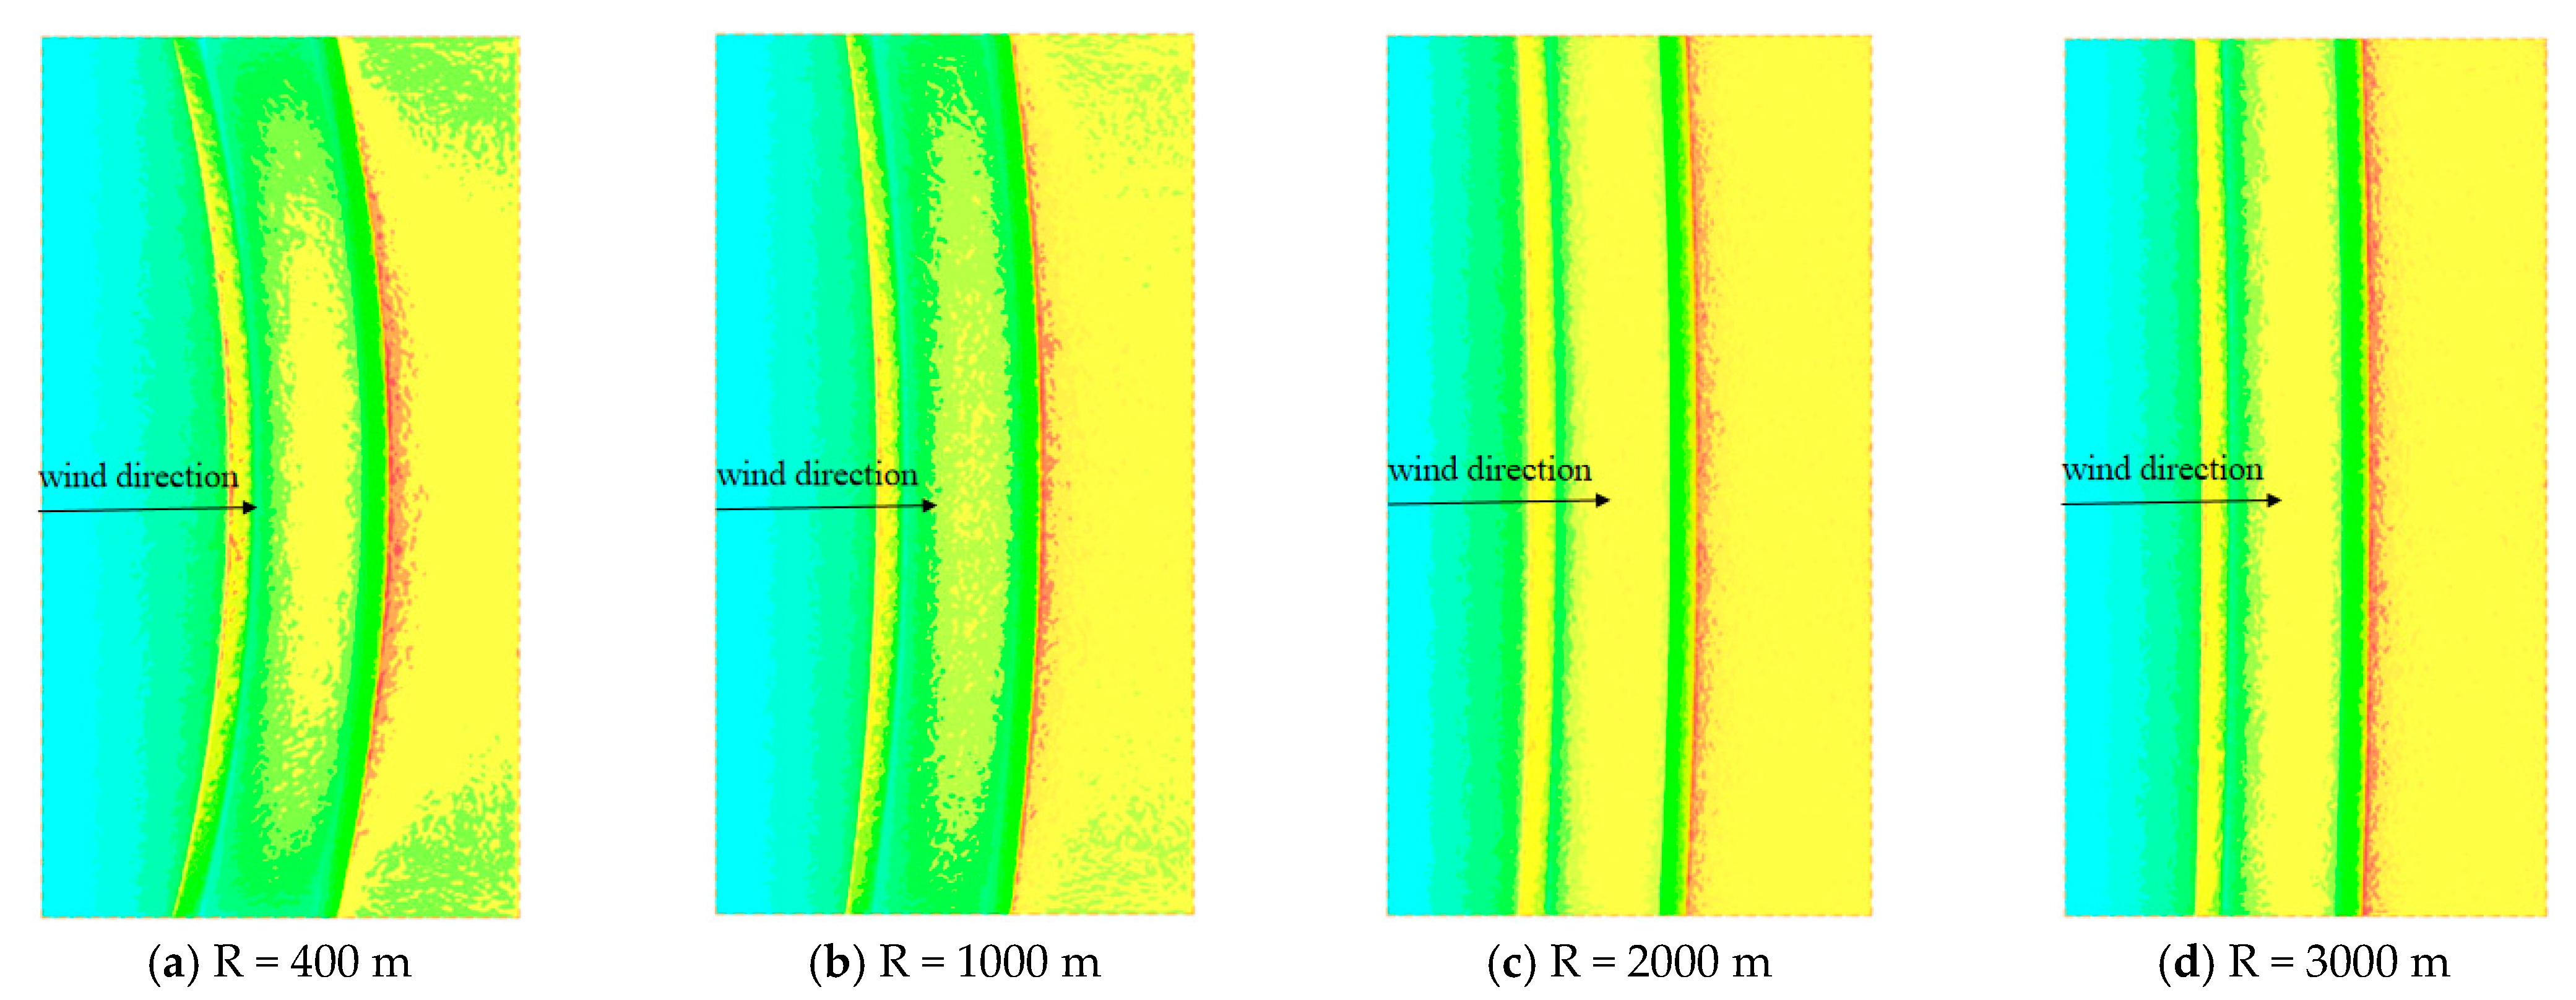
Figure 14.
The sand-moving wind rose and drift potential at K166 + 600 of Wuhai–Maqin highway.
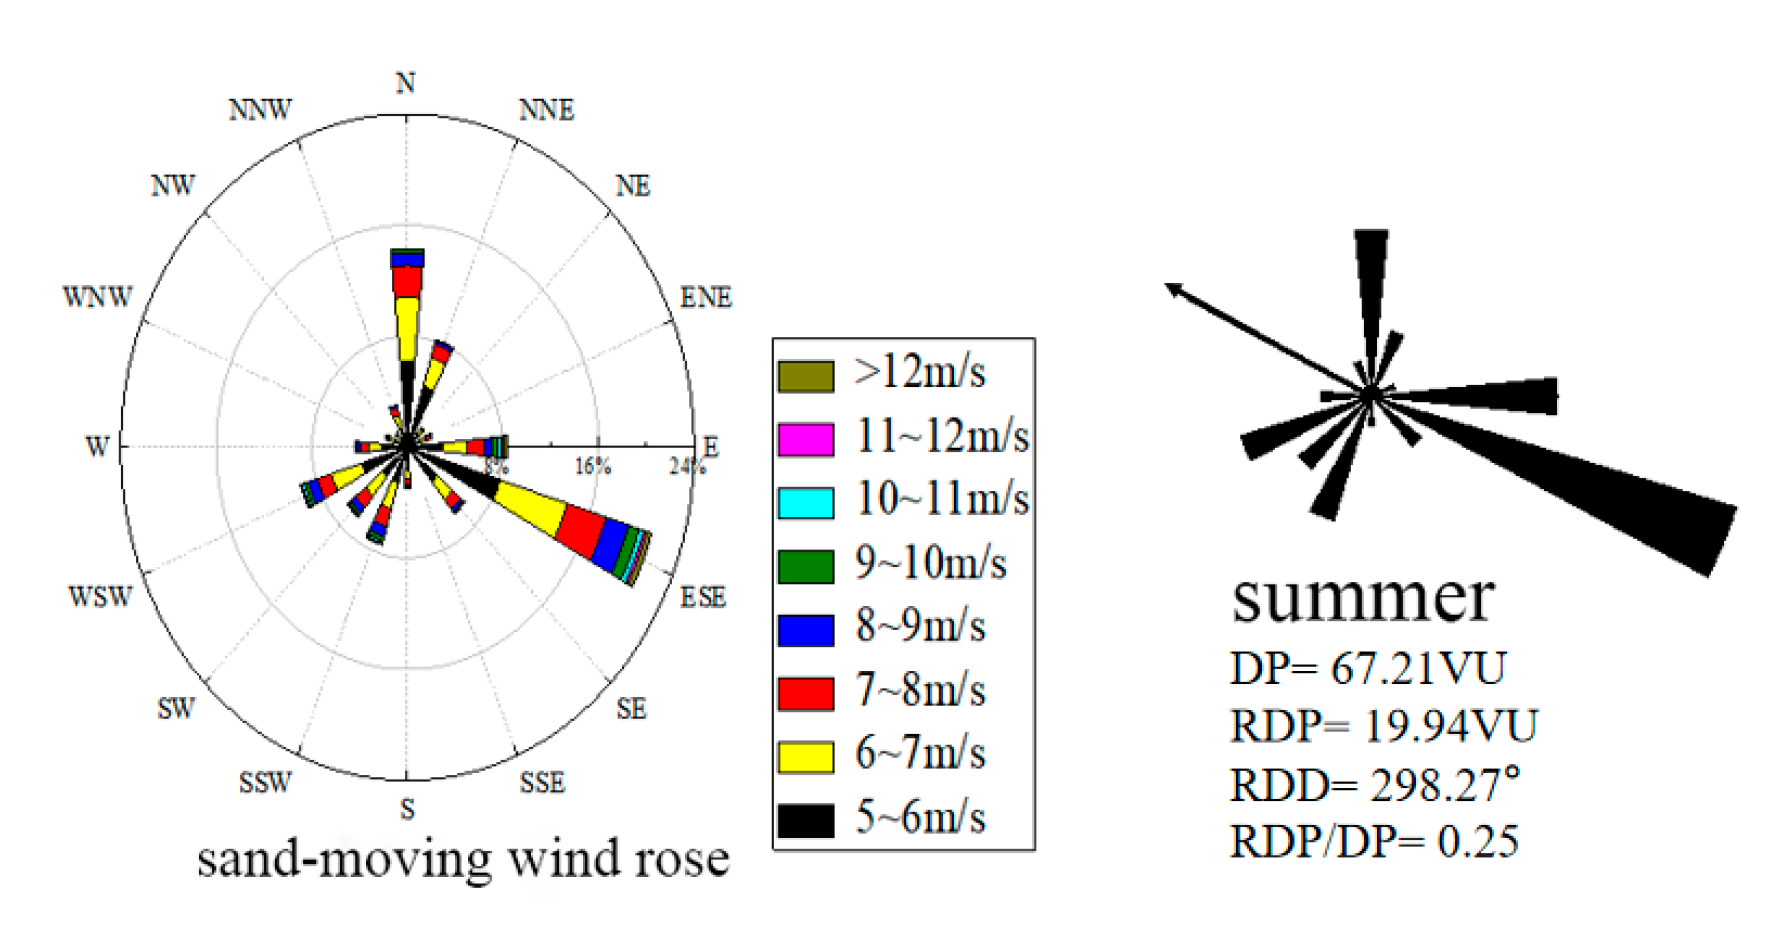
Figure 15.
Distribution of on-site sand accumulation at K166 + 100 of Wuma highway.
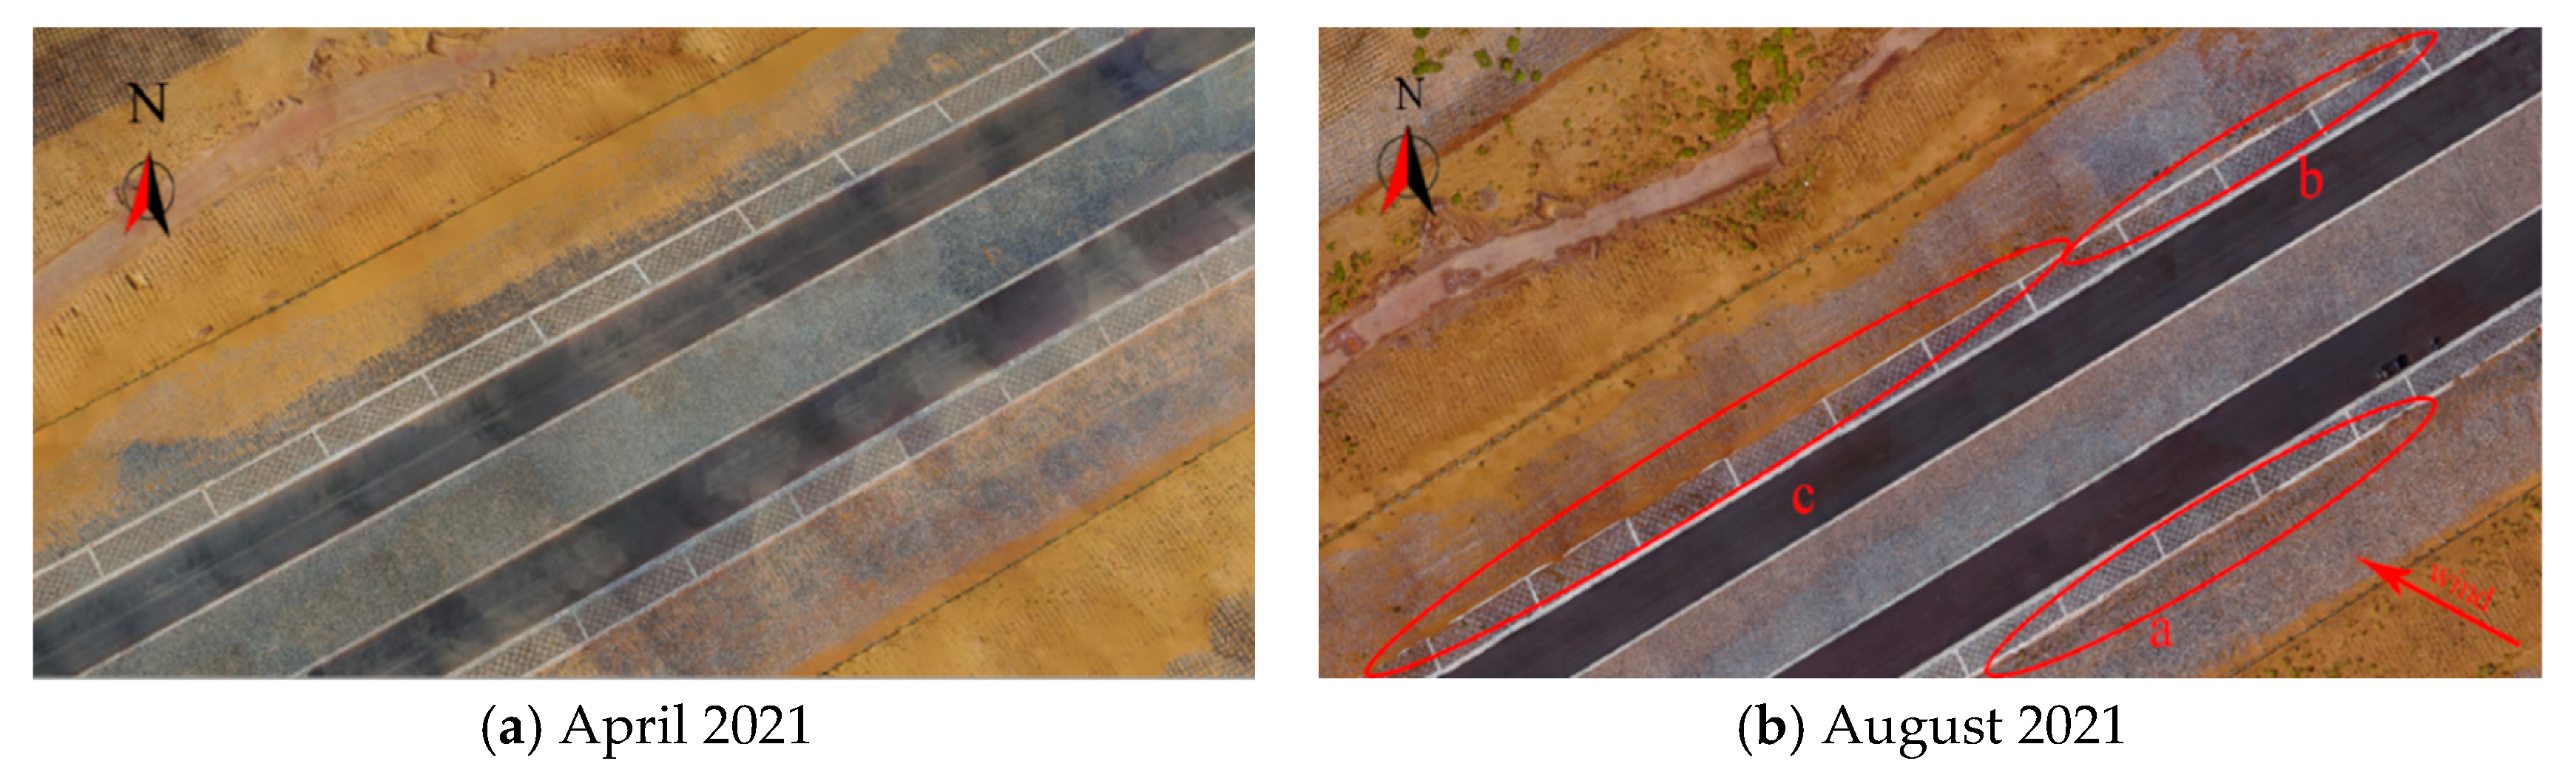
Figure 16.
Distribution of on-site sand accumulation at K167 + 670 of Wuhai–Maqin highway.


Table 1.
3D model boundary conditions.
| Constraint Type | |
|---|---|
| Inlet | velocity-inlet |
| Outlet | outflow |
| Top vall | symmetry |
| Two sidewalls | symmetry |
| Bottom wall | wall |
Publisher’s Note: MDPI stays neutral with regard to jurisdictional claims in published maps and institutional affiliations. |
© 2022 by the authors. Licensee MDPI, Basel, Switzerland. This article is an open access article distributed under the terms and conditions of the Creative Commons Attribution (CC BY) license (https://creativecommons.org/licenses/by/4.0/).
Share and Cite
MDPI and ACS Style
Li, L.; Tao, Z.; Yin, W.; Liu, Z. Numerical Simulation Research on Plane Alignment Parameters of Desert Highway. Appl. Sci. 2022, 12, 9579. https://doi.org/10.3390/app12199579
AMA Style
Li L, Tao Z, Yin W, Liu Z. Numerical Simulation Research on Plane Alignment Parameters of Desert Highway. Applied Sciences. 2022; 12(19):9579. https://doi.org/10.3390/app12199579
Chicago/Turabian StyleLi, Liangying, Zhizhong Tao, Wenhua Yin, and Zhibo Liu. 2022. "Numerical Simulation Research on Plane Alignment Parameters of Desert Highway" Applied Sciences 12, no. 19: 9579. https://doi.org/10.3390/app12199579
Note that from the first issue of 2016, this journal uses article numbers instead of page numbers. See further details here.