Article

AHA-AO: Artificial Hummingbird Algorithm with Aquila Optimization for Efficient Feature Selection in Medical Image Classification

by
Mohamed Abd Elaziz
1,2,3,4,*,
Abdelghani Dahou
5,6,
Shaker El-Sappagh
1,7,
Alhassan Mabrouk
8 and
Mohamed Medhat Gaber
1,9,*
1
Faculty of Computer Science and Engineering, Galala University, Suez 435611, Egypt
2
Artificial Intelligence Research Center (AIRC), Ajman University, Ajman 346, United Arab Emirates
3
Department of Mathematics, Faculty of Science, Zagazig University, Zagazig 44519, Egypt
4
Department of Electrical and Computer Engineering, Lebanese American University, Byblos 13-5053, Lebanon
5
Mathematics and Computer Science Department, University of Ahmed DRAIA, Adrar 01000, Algeria
6
LDDI Laboratory, Faculty of Science and Technology, University of Ahmed DRAIA, Adrar 01000, Algeria
7
Information Systems Department, Faculty of Computers and Artificial Intelligence, Benha University, Banha 13518, Egypt
8
Mathematics and Computer Science Department, Faculty of Science, Beni-Suef University, Beni Suef 62511, Egypt
9
School of Computing and Digital Technology, Birmingham City University, Birmingham B4 7XG, UK
*
Authors to whom correspondence should be addressed.
Appl. Sci. 2022, 12(19), 9710; https://doi.org/10.3390/app12199710
Submission received: 26 August 2022 / Revised: 16 September 2022 / Accepted: 20 September 2022 / Published: 27 September 2022
(This article belongs to the Special Issue The Applications of Machine Learning in Biomedical Science)

Abstract

:
This paper presents a system for medical image diagnosis that uses transfer learning (TL) and feature selection techniques. The main aim of TL on pre-trained models such as MobileNetV3 is to extract features from raw images. Here, a novel feature selection optimization algorithm called the Artificial Hummingbird Algorithm based on Aquila Optimization (AHA-AO) is proposed. The AHA-AO is used to select only the most relevant features and ensure the improvement of the overall model classification. Our methodology was evaluated using four datasets, namely, ISIC-2016, PH2, Chest-XRay, and Blood-Cell. We compared the proposed feature selection algorithm with five of the most popular feature selection optimization algorithms. We obtained an accuracy of 87.30% for the ISIC-2016 dataset, 97.50% for the PH2 dataset, 86.90% for the Chest-XRay dataset, and 88.60% for the Blood-cell dataset. The AHA-AO outperformed the other optimization techniques. Moreover, the developed AHA-AO was faster than the other feature selection models during the process of determining the relevant features. The proposed feature selection algorithm successfully improved the performance and the speed of the overall deep learning models.

1. Introduction

Recently, automatic medical image recognition (AMIR) techniques have gained more attention, since they have been applied for the diagnosis of diseases at early stages [1,2]. To handle this task, several methods that depend on the use of different techniques have been developed [3,4,5]—for example, machine learning methods for inverse problems that arise in medical [6,7] and super-resolution methods [8,9,10]. In the same context, deep learning (DL) has become one of the most widely used AMIR methods for this task [11]. DL models have achieved impressive predictive capabilities and have outperformed clinicians [12]. Despite the notable success of DL models, they still require large volumes of labeled training samples. Therefore, to address this limitation, transfer learning (TL) has been adopted [13]. Typically, TL uses a pre-trained model, which is typically trained on a very large image dataset (e.g., ImageNet). Then, the model is fine-tuned using a smaller dataset. Experimentally, TL has become the go-to methodology for training image classification models [14,15]. These models are used to extract features from datasets and then use those features to improve the prediction process. However, there are irrelevant and noisy features that can lead to the degradation of the prediction quality. Therefore, feature selection techniques can be used to tackle the process. This can be achieved by removing these irrelevant features. This can lead to the improvement of medical image recognition models [16], computational costs [4], and parameterization [17].
Moreover, feature selection based on meta-heuristic (MH) optimization techniques has been proven to be effective in addressing a wide variety of real-world applications. Instead of a single solution in traditional optimization, a set of potential solutions enables them to effectively explore the optimal solution. Various MH methodologies have been proposed for computer-aided diagnosis [18]. To minimize the number of parameters (weights) in a convolutional neural network (CNN), Samala et al. [19] proposed a technique for multidimensional path building to detect breast cancer. They utilized two techniques: transfer learning and recognizing characteristics. CNNs pre-trained with significant lesions were used. This was followed by a random forest classifier, and they used a genetic algorithm (GA) with random selection and crossover. Their study observed a significant variation in features and a decrease in parameter activities when using their proposed approach. Surbhi et al. [20] used adaptable PSO for automated diagnosis of brain tumors by using the gray-level cooccurrence matrix (GLCM) to extract features. This model improved the image quality and eliminated noise treatment, and bone strips were performed.
In general, there are several methods of FS based on MH techniques. DL models have been proposed to improve medical image classification. However, these methods suffer from some limitations that affect their performance in classification. For example, the MH technique can attract local optima, and this can lead to the degradation of the efficiency of the model through the selection of irrelevant features. This motivated us to propose an alternative medical image classification technique using the integration of TL for feature extraction and the modified Artificial Hummingbird Algorithm (AHA) [21] as a feature selection technique.
The Artificial Hummingbird Algorithm has been proposed as an optimization technique and applied for solving different optimization problems, such as determining the optimal allocation of renewable distributed generators (RDGs) [22], engineering design problems [23], predicting the tribological behavior of Cu-Al2O3 [24], and optimal planning of multiple-renewable-energy-integrated distribution systems [25]. However, by analyzing the performance of the AHA, we found that there is clear room for improvement during the exploitation of the search domain. Therefore, the Aquila Optimization (AO) algorithm [26] is applied to achieve this task. AO has been applied to different applications, including hyperspectral image classification [27], Cox proportional hazards [28], and semi-/fully automated segmentation of gastric polyps [29].
The medical image classification technique developed here depends on the integration of the advantages of TL and feature selection (FS) based on MH methods. The first step in this model is to split the dataset into training and testing sets. Then, the training set is used to teach the developed model, and this is performed in two stages. The first stage is the use of the TL technique to generate context-specific representations. Thus, a fine-tuned MobileNetV3 is used to extract the features. The second stage is the presentation of a new FS method for filtering the extracted features of the image and picking only the most relevant features to enhance the overall model for medical image classification. The presented FS model depends on the improvement of the performance of the AHA by using the AO algorithm. This can be done by generating a set of solutions that refer to the subset of selected features. Then, the quality of these solutions is assessed by using the error classification and the ratio of selected features as fitness values. After that, the best solution is allocated. This provides a better fitness value. Thereafter, a competition between the operators of the AHA and AO is applied to update the solutions. The next process is the assessment of the efficiency of the selected solution according to the best solution. This is carried out by removing the irrelevant features from the testing set and using performance measures to compute the efficiency of the classification process. The main difference between the method developed here and the other techniques is the integration between MobileNetV3 and the FS based on a modified version of AHA using the AO algorithm. Each of these techniques has its own strengths that lead to the improvement of the convergence rate and the quality of the selected features. This will influence the performance in classification.
The contributions of this study are as follows:
  • Proposal of a novel FS method based on improving the behavior of the Artificial Hummingbird Algorithm using Aquila Optimization. This model aims to choose the most important features from each image representation to make the classification process more efficient (using a reduced set of features).
  • Presentation of a comprehensive experimental study of the proposed system with a comparison of the proposed method with various state-of-the-art methods by utilizing four real-world datasets.
The organization of the article is as follows. An overview of current work on diagnostic imaging is given in Section 2. In Section 3, in addition to Aquila Optimization (AO) and the Artificial Hummingbird Algorithm (AHA), we provide the background of transfer learning for feature extraction. Section 4 provides a detailed presentation of the proposed system. Section 5 presents the experimental results of our image classification technique. Section 6 discusses the drawbacks of the proposed image recognition method. Lastly, in Section 7, the paper is summarized, and directions for future work are given.

2. Related Work

Ayan and Ünver [30] used the Xception and VGG16 structures to fine-tune transfer learning. The design of Xception was substantially altered with the addition of two fully linked levels and multiple-output tiers with a SoftMax activation mechanism. As per the theory, the channel’s initial layer has the greatest potential for generality. The previous eight layers of the VGG16 architecture have been stopped, and the fully linked levels have been altered. Similarly, the testing periods for every image were 16 ms for the VGG16 and 20 ms for the Xception network. The methods used in [31] included InceptionV3, ResNet18, and GoogLeNet. A conclusion was reached by using convolutional networks. To see whether a vote might be utilized to come to an accurate diagnosis, they tested each model against the premise. The classifier results were merged by using the strong majority in this investigation. This meant that the diagnosis went with the group that had a high proportion of first-time voters. According to the average of this model’s testing results, this approach took an average of 161 ms per image. On top of that, they were able to classify X-ray images with great accuracy. Pneumonia could be detected using deep CNNs, as per the results of this research. We used standard algorithms as a component in our approach to categorize data in order to keep computation costs at a minimum.
The results were obtained in many test sets by utilizing bi-linear classification methods and SVM classifiers to extract features from the VGG and ResNet models [32]. About 13 W of dermatological images were trained using a mix of data-driven methods and InceptionV3, with results in the test dataset that were similar to those of dermatologists, as reported in [33]. The ISBI-2016 skin lesion analysis approach for cancer diagnosis [34] used skin lesion fragmentation to classify cancer. As a consequence, a move-categorization process was recommended for classification purposes. The use of several convolutional neural networks (CNNs) combined with dynamic pattern training simulated intra-class fighting amongst cancer cells and the background noise that resulted from this [35]. Instead of starting from scratch with random initialization settings, Kawahara et al. [36] used a pre-trained CNN to detect skin images across a whole dataset. After this pre-training, the CNN’s training time was cut in half, resulting in an accuracy rate of 84.8% for five different courses. Lopez et al. [37] used a DL technique for early diagnosis. TL was used to create this VGGNet-based model. The generated model had a primary collection of 78.56% when used with the ISIC-2016 archive data. The expanded and un-augmented data from [38] were used to evaluate the performance of a CNN model for the detection of lesions. According to the authors, DL methods may be beneficial, but there is little evidence to support them. A more significant dataset improved the network performance of the classifier over a model that did not have it.
CNNs have been widely used in medical image analysis in recent years because of their broad feature extraction abilities, which have shown impressive results. Yu et al. [34] presented a multi-stage residual-network-based approach to automatically detecting malignant tumors in dermoscopic images in order to identify melanomas. VGG and ResNet networks bi-linearly combined with SVM classifiers yielded some of the highest detection scores on several testing datasets, with high-level information being collected by Ge et al. [32]. Based on [39], a multi-level fully convolutional network was built. Using multi-CNN cooperation, Zhang et al. [40] created a model for identifying target class lesions. Their method was more accurate in detecting lesions, and its usefulness was tested with the right information. It was possible to build a robust ensemble structure for early cancer diagnosis by using dynamic classification methods. Thus, we could build an improved and distinguishable model. In [41], the authors proposed a cross-net-based combination of several fully convolutional networks in order to detect skin lesions on their own for this purpose. MobileNet and DenseNet were linked [42] for the classification of melanomas.
The use of meta-heuristic optimization methods has proven effective in resolving a wide variety of challenging optimization issues. For example, Shankar, K. et al. [43] created a new idea for Alzheimer’s disease by utilizing neuroimaging analytics with the Gray Wolf Optimization (GWO) technique. Getting rid of unwanted areas is an excellent place to start when doing any photo editing. To further enhance speed, recovered images were submitted to a CNN for the extraction of features. Using OptCoNet, which was developed by Goel et al. [44], they claimed to be able to distinguish between normal individuals with COVID-19 and those with pneumonia. They used the GWO to fine-tune the convolution layer’s hyperparameters. Their research revealed that the suggested method helped with automated patient examinations and decreased the workload of the model’s medical framework. Mohamed et al. [45] used the Dragonfly and enhanced Firefly Algorithms (FFA) to classify images as normal or anomalous in order to develop the design for denoising images. Because of this change, the maximum transmission ratio dropped substantially, resulting in better performance. The use of the Whale Optimization Algorithm (WOA) and Levy flight in [46] improved melanoma detection. Two datasets were analyzed with the newly created architecture, with an efficiency of 87% on both. When confronted with a vast solution space [47], some models experienced premature convergence and local minima. This constraint often leads to sluggish model stability due to poor scheduling algorithms. We urgently need a worldwide solution to the task-scheduling issue. As a result, the goal of this article is to identify the best options for improving the rate of convergence.

3. Background

3.1. Efficient Neural Networks

Computer vision applications, such as image classification, image segmentation, and object detection, have been dominated by deep learning models that have been applied differently and implemented in novel architectures [48,49]. For instance, convolutional neural networks have been widely exploited due to their well-known ability of automatic feature extraction. However, deep learning models are not always efficient, and their performance is not always optimal due to several challenges, including the lack of data and the quality of the learned representations, hyperparameters, and network structure (components), leaving a large margin for improvement and optimization. Recently proposed networks, such as MobileNetV3 [50], EfficientNet [51], DenseNet [52], and MnasNet [53], have been successfully applied in computer vision tasks in which the researchers’ goal was the optimization of the network structure, time and resource complexity, and overall performance of the model. The depthwise convolution structure proposed in an efficient DL model such as MobileNetV3 can be used to replace the canonical convolution structure. The proposed depthwise convolution structure is more efficient than the canonical convolution structure in terms of the exploitation of spatial information, which is applied separately on each input channel, and the minimization of the model size [54].
Furthermore, efficient models that adopt the depthwise convolution structure use fewer resources and fewer training parameters, provide a higher prediction quality, and take a short time to train. In addition, various techniques have been adopted to increase the efficiency of DL models, including knowledge distillation, weight sharing, data augmentation, data parallelism, matrix factorization, and attention mechanisms [55]. For instance, knowledge distillation transfers the knowledge learned by a teacher (original) model to a student (distilled/new) model. The weight-sharing technique uses pre-trained model weights on large amounts of data to improve the new model’s performance without retraining from scratch. Data augmentation uses different data transformation techniques to increase the size of the training data. Data parallelism uses multiple training devices, such as GPUs or TPUs, to boost the training speed. Matrix factorization tends to reduce the model size alongside the feature representation space of the feature vectors. An attention mechanism boosts a model’s robustness by focusing on the most relevant features during the learning process rather than considering all features. For example, MobileNetV3 improves the latency and accuracy over those of the previous versions by 3.2% and 20%, respectively, in comparison with MobileNetV2 through the adoption of the following techniques and components: using the NetAdapt algorithm as a network architecture search (NAS) to select the optimal network structure, depthwise separable convolution, 1 × 1 convolution (pointwise convolution), an inverted residual block [56], a squeeze-and-excite block (SE block) [53], and the h- s w i s h activation function [57,58]. In this study, we used MobileNetV3 as our main feature extractor in the proposed framework; more details on the network architecture and the parameters are introduced in Section 4.

3.2. Aquila Optimizer (AO)

This section presents the basic formulation of Aquila Optimization (AO) algorithm [26]. The AO algorithm generally imitates Aquila’s social behavior to catch its target. AO is a population-based optimization algorithm that is equivalent to other metaheuristic (MH) algorithms and generates a population X of N solutions. To carry out this technique, the following equation was employed:
X j i = L B i + r 1 × ( U i L i ) , , j = 1 , 2 , . . . . . , N i = 1 , 2 , , D
where U i and L i are the search domain’s boundaries. r 1 represents random numbers whose values are in the interval [ 0 , 1 ] and a D-dimensional space.
The following phase in the AO technique is for either exploring or exploiting until the best solution is identified. According to [26], exploration and exploitation can be accomplished with two approaches.
Exploration uses the best solution X n e w and the average of the solutions ( X a v g ), and its mathematical formulation is as follows:
X j ( t + 1 ) = X n e w ( t ) × 1 e E + ( X a v g ( t ) X n e w ( t ) r a n d ) ,
X a v g ( t ) = 1 N i = 1 N X ( t ) , i = 1 , 2 , , D
The greatest number of epochs is denoted by E. 1 e E is used to control the searching ability of AO in the exploration stage. The Levy flight L and X n e w are used in the exploration stage to upgrade the solutions, as introduced in the following equation:
X j ( t + 1 ) = X n e w ( t ) × L + X r a n d ( t ) + ( y x ) r a n d o m ,
L = s × r 2 × σ | r 3 | 1 β , σ = Γ ( 1 + β ) × s i n e ( π β 2 ) Γ ( 1 + β 2 ) × β × 2 ( β 1 2 ) , β = 1.5 , s = 0.01
In Equation (5), r 2 and r 3 are values that are generated at random. X r a n d refers to a random solution. Moreover, a spiral shape is formed by using the two parameters y and x, which are defined as:
x = R × s i n ( θ ) , y = R × c o s ( θ )
R = r 1 + Q × D 1 , θ = S × D 1 + θ 1 , θ 1 = 3 × π 2 , Q = 0.00565 , S = 0.005
where r 1 [ 0 , 20 ] is a random value.
Similarly to exploration, the initial strategy employed in [26] to boost the solutions in the exploitation phase was based on X n e w and X a v g , and it is defined as:
X j ( t + 1 ) = ( X n e w ( t ) X a v g ( t ) ) × α r + ( U × r + L ) × δ , U = ( U L )
where α and δ are the adjustment parameters used during the exploitation phase. r [ 0 , 1 ] refers to a random value. Moreover, in the second strategy of exploitation, the solution will be updated by using the quality function ( Q F ) , L, and X n e w . This can be achieved with the following formula:
X j ( t + 1 ) = Q F × X n e w ( t ) G ( G 1 × X ( t ) × r ) G 2 × L + r × G 1
Q F ( t ) = e 2 × r ( ) 1 ( 1 E ) 2
where G 1 and G 2 represent a parameter of the motions applied to track X b and a parameter that decreases from 2 to 0, respectively; these parameters are defined as:
G 1 = 2 × r ( ) 1 , G 2 = 2 × ( 1 e E )
Figure 1 depicts the steps of AO.

3.3. Artificial Hummingbird Algorithm

In this section, we will go over the methods of a new MH methodology called the Artificial Hummingbird Algorithm (AHA), which simulates hummingbird activity. Axial, diagonal, and omnidirectional flights are the three forms of flight abilities; these abilities are used for foraging techniques. There are also other sorts of search tactics, such as guided, migrating, and territorial foraging, as well as a visit table to mimic a hummingbird’s memory. The initial population X of N hummingbirds is constructed using Equation (12).
X j = L B + r × U B L B , j = 1 , 2 , , N
In Equation (12), L B and U B represent the boundaries of the search domain. r [ 0 , 1 ] is a random vector. Moreover, the visit table of the best solution is formed as:
V T j i = 0 i f j i n u l l j = i , j = 1 , , N , i = 1 , , N
In the case of i = j , V T j i = n u l l refers to the amount of food consumed by a hummingbird at a certain food source. In contrast, V T j i = 0 refers to the jth hummingbird visiting the food source i.

3.3.1. Guided Foraging

A hummingbird is assumed to search for food at the maximum visit rate and then select the one with the maximum nectar-refilling rate from X as its optimal solution for the guided foraging behavior. This foraging makes use of the three flight abilities of omnidirectional, diagonal, and axial flight. The concept of axial flight is shown in this formula:
D i = 1 i f i = R 0 e l s e , i = 1 , , d ,
In addition, the concept of diagonal flight is shown as follows:
D i = 1 i f i = P j , j 1 , k , i = 1 , , d , 0 e l s e .
P = r a n d p e r m k , k [ 2 , r 1 ( d 2 ) + 1 ]
The concept of omnidirectional flight can be formulated as:
D i = 1 , i = 1 , , d ,
where R represents random values in the interval [1,d] and r 1 [ 0 , 1 ] is a random number. r a n d p e r m k stands for a random integer in [ 1 , k ] , and the behavior of guided foraging can be represented as:
V i t + 1 = X i , t t + a × D × X i t X i , t t , a N ( 0 , 1 )
In Equation (17), X i , t t stands for the ith food source at the tth iteration. X i , t t refers to the target solution visited by hummingbird i. Therefore, X i can be updated as:
X i t + 1 = X i t i f f X i t f ( V i t + 1 ) V i t + 1 o t h e r w i s e
where f is the fitness value.

3.3.2. Territorial Foraging

Once the flower nectar has been consumed, a hummingbird is more likely to search for a new source of food than to visit other flowers. As a result, the bird may readily migrate to a nearby spot inside its own territory, where a new food source could be located as a potential replacement for the existing one. The mathematical formula designed to simulate hummingbirds’ local foraging behavior and a potential food source is as follows:
V i t + 1 = X i , t t + b × D × X i t , b N ( 0 , 1 )

3.3.3. Migration Foraging

In the case that a hummingbird’s favorite feeding spot runs out of food, it migrates to a more distant spot. A migration coefficient is computed using the AHA. The hummingbird’s process of finding a food source with one of the worst nectar-refilling rates will result in its transition to a new food picked at random from the entire search space if the number of iterations surpasses the migration coefficient’s predetermined value. As a result, this hummingbird will stop eating at the old source and start eating at the new one, changing the visit table. The following is a description of a hummingbird’s migration foraging from the source with the lowest nectar-refilling rate to a new one produced at random:
X w ( t + 1 ) = L B + r × U B L B ,
where X w refers to the worst fitness value. The steps of the AHA are given in Figure 2.

4. Proposed Method

4.1. Deep Learning for Feature Extraction

This section presents detailed information about the implementation of MobileNetV3 used in our framework for medical image feature extraction. To benefit from the transfer learning technique, we used the pre-trained weights of MobileNetV3 on the ImageNet dataset [56] to acquire the knowledge of previously trained models with different settings and to fine-tune the weights on the medical datasets used in our study. The model takes a 224 × 224 image as an input and outputs a feature vector of size 128 to be exploited in the feature selection phase. In addition, we only trained specific layers of the model to reduce the training time and the model size; the top layers were replaced with 1 × 1 point-wise convolution layers for the extraction of features and classification of images. More specifically, the weights of MobileNetV3 were kept fixed during the fine-tuning process, which included 16 bottleneck layers, a 2D convolution layer, and an adaptive average pooling layer, as shown in Figure 3. Meanwhile, we updated the weights of the new layers during the training process, and they replaced the vanilla MobileNetV3 classifier’s layers (top layers) with two 1 × 1 point-wise convolution layers for feature extraction and classification, respectively. Our experiments used different medical image datasets to fine-tune the MobileNetV3-Large version of the MobileNetV3 and perform feature extraction. Figure 3 shows the model architecture that was implemented and integrated as the backbone feature extractor of our proposed framework.
MobileNetV3 was fine-tuned to boost performance in medical image classification, where the learned activation values of a certain layer were stored as vectors representing the input images. The model was composed of 16 bottleneck layers [56] containing inverted residual blocks, which were kept fixed during the fine-tuning process, and only the top layers were used to learn the characteristics of the training samples from each medical dataset. The inverted residual blocks’ core component was the depthwise separable convolution layer. In addition, in a certain layer, the depthwise separable convolution layer could contain a squeeze-and-excite (SE) block [53], which was used for relevant feature selection on a channel-wise basis. A 3 × 3 depthwise separable convolution replaced the point-to-point convolution by using one filter for each input channel, which helped to reduce the model’s computational complexity. The 1 × 1 point-wise convolution was used on all of the channels in the inverted residual block to convert the output into a linear combination, which can be seen as a multilayer perceptron (MLP). The depthwise separable convolution block consisted of four different components placed in the following order: ( 1 × 1 C o n v ) ( B N ) ( R e L U / h - s w i s h ) ( 3 × 3 C o n v ) ( B N ) ( R e L U / h - s w i s h ) ( 1 × 1 C o n v ) ( B N ) ( R e L U / h - s w i s h ) . Two types of activation functions were used interchangeably in the model; these were the rectified linear unit (ReLU) and a function recently proposed by [57,58] named h- s w i s h . The h- s w i s h activation function integrates the ReLU6 activation function to reduce the computational resources on small devices and replace the sigmoid function [57], as defined in Equation (21).
h - s w i s h ( x ) = x · σ ( x ) σ ( x ) = R e L U 6 ( x + 3 ) 6
where σ ( x ) represents the piecewise linear hard analog function.
Furthermore, we placed a 1 × 1 point-wise convolutional layer before the final classification layer to perform feature extraction, where the output of this layer was flattened to form the feature vectors. The extracted feature vectors were fed to the feature selection algorithm to select the most relevant features and reduce the representation space. We fine-tuned the model on an NVIDIA GTX 1080 GPU with the following settings: 100 epochs, batch size of 32, learning rate of 1 × 10 4 the RMSprop optimizer, and a dropout of 0.38. Data augmentation was used to increase the size of the training data and prevent overfitting with the following data transformations: image resizing, random vertical flip, random crop, random horizontal flip, and color jitter. In addition, the batch normalization (BN) process was used on each mini-batch to standardize the data and overcome overfitting.

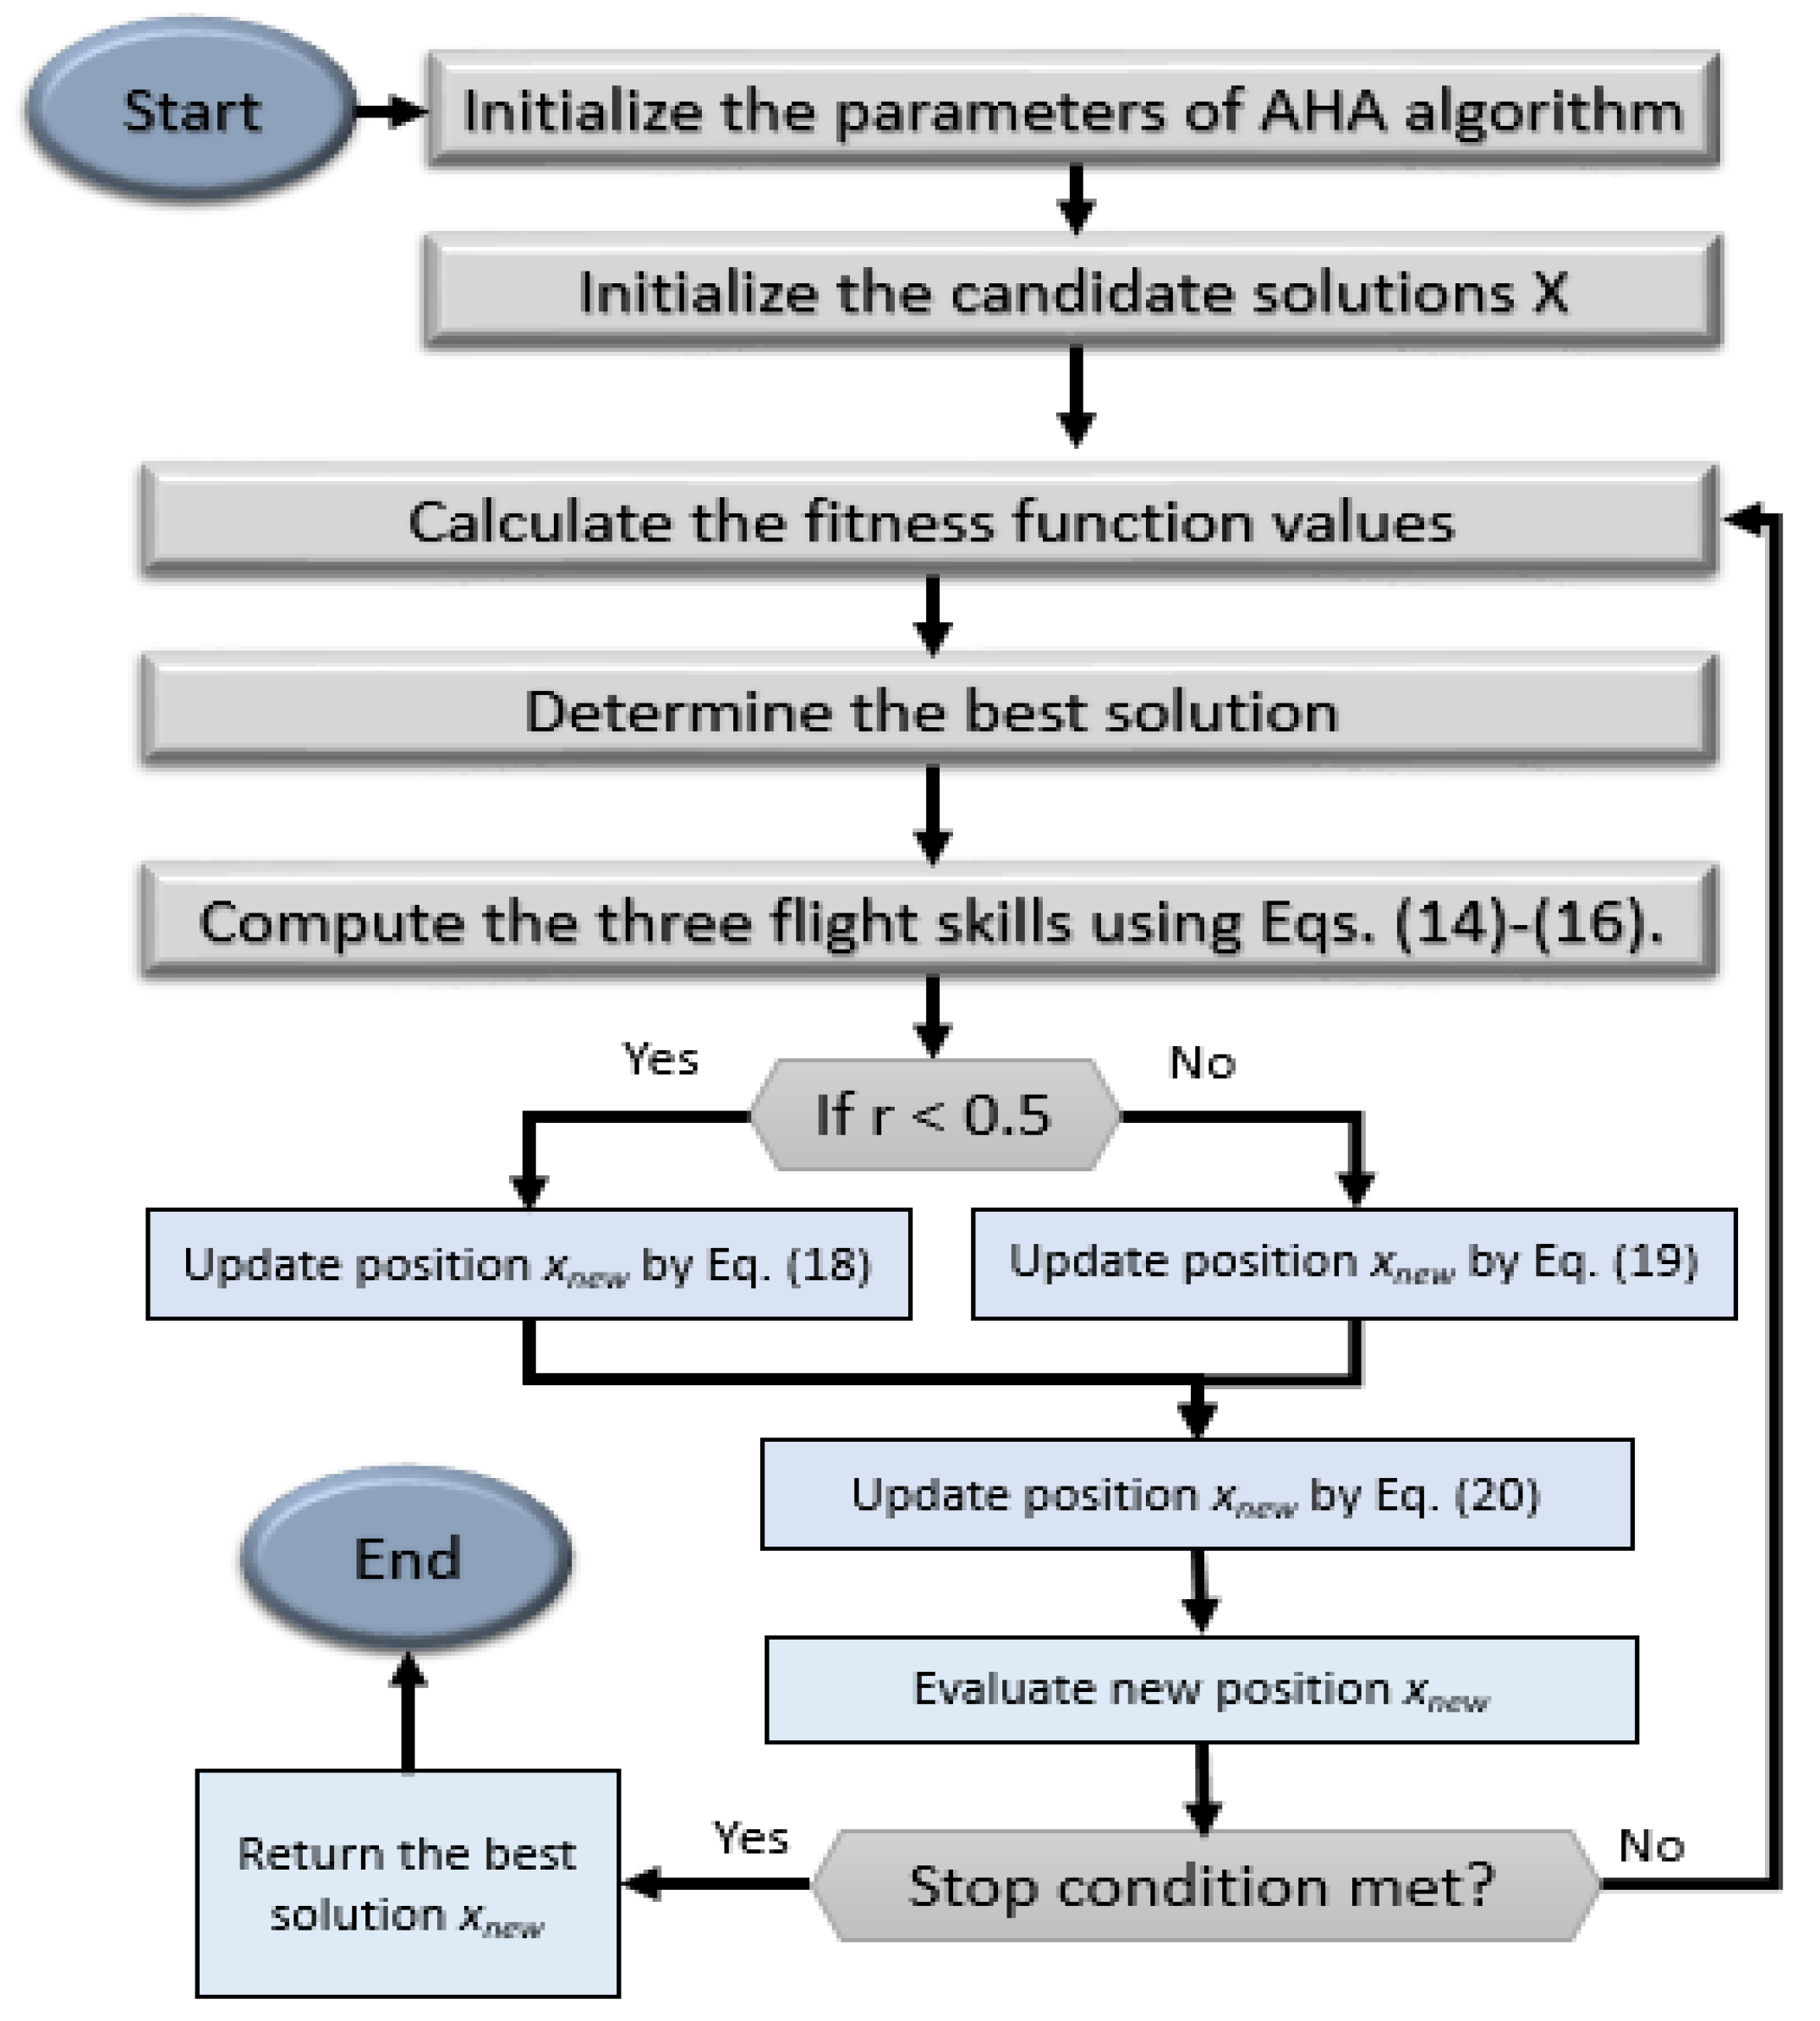
4.2. Feature-Selection-Based AHA-AO

In this section, the main stages of the proposed FS approach are introduced, as shown in Figure 4. In the method developed here, which is named AHA-AO, the aim is to enhance the exploitation ability of AHA by using the AO method.
The AHA-AO begins by splitting the input dataset into training and testing sets, which represent 70% and 30% of the instances of input data. Then the initial population X is constructed by using the following formula:
X j = r a n d × ( U B L B ) + L B , j = 1 , 2 , . . . , N , i = 1 , 2 , . . . , D
where N shows the number of solutions. D stands for the dimension of each X j . L B and U B refer to the boundaries of the search domain.
Thereafter, the Boolean form of X i is obtained using Equation (23).
B X i j = 1 i f X i j > 0.5 0 o t h e r w i s e
Thereafter, the fitness value of X i is computed according to its binary form B X i and the training set by using the following formula:
F i t i = λ × γ i + ( 1 λ ) × | B X i | D i m ,
In Equation (24), ( | B X i | D i m ) stands for the ratio of features selected from the training set. γ i denotes the error classification value obtained using K N N (at K = 5 ). In this study, the KNN algorithm is applied because it is simple and easy to implement, and it is considered more stable than other classification techniques that have few parameters. The parameter λ represents the weight value for ( | B X i | D i m ) and γ i .
The next step is the allocation of the best fitness value F i t b and its corresponding solution X b . After that, the current population X is updated in two stages; during the first stage (i.e., exploration), the operators of the AHA are used to update X, as shown in Equations (14)–(18). However, during the second stage (i.e., exploitation), the integration of the operators of the AHA and AO is applied to update X. This is achieved using replacing the exploitation phase of the AHA with the exploitation phase of AO. Therefore, the main weakness of the AHA results from this phase. This process is formulated using the Equations (4)–(9).
If the conditions have been met, the next step in the AHA-AO is to return X n e w . Alternatively, the upgrading steps are repeated.
Finally, the dimension of the testing set is reduced according to the binary form of X b , and the KNN algorithm is used to assess the quality of this dimension reduction process that is achieved by using the AHA-AO technique.

5. Experimental Results

In this section, we evaluate the performance of our proposed feature selection optimization technique (AHA-AO) and compare it with five of the most effective feature selection techniques, namely, PSO, MFO, WOA, AO, and AHA. The parameter settings of each one of these methods are given in Table 1. In addition, each of these methods was run 25 times in order to have fair comparison, since they depend on random parameters.
To verify the superiority of the performance of the AHA-AO in comparison with that of the other algorithms, we utilized four image datasets, namely, the ISIC-2016, PH2, Chest-XRay, and Blood-Cell datasets. A description of each dataset is given in Table 2, and examples are given in Figure 5.
Raw images were used to train the CNN models and the extracted deep features were used by the FS optimizer to select the best features from these deep features. The number of deep features from the Chest-XRay and ISIC-2016 datasets was 128 features, and 512 deep features from the PH2 and Blood-cell datasets were utilized. Optimized feature sets were used to train the three classification algorithms of DT, LDA, and SVM. For a fair comparison, we used the default settings for the three classifiers in all experiments. In total, we conducted five experiments with different datasets and different algorithms to test the proposed algorithm. Some datasets were used to build binary classifiers, such as ISIC-2016 and Chest-XRay; the PH2 dataset was used to build a three-class classifier, and Blood-Cell was used to build a four-class classifier.

5.1. Performance Measures

Six metrics were used to evaluate the performance of the tuned classifiers (i.e., accuracy, balanced accuracy (BA), F1-score, recall, precision, and time in seconds). The balanced accuracy and F1-score are used to report the accuracy of results for imbalanced datasets, as introduced in Equations (26) and (29), respectively. The average results of these metrics are reported in the following section. The whole optimizer had an extra metric (i.e., features) that reported the number of features selected by a specific optimizer.
A c c u r a c y = T P + T N T P + T N + F P + F N
B a l a n c e d A c c u r a c y ( B A ) = 1 2 × T P T P + F N + T N F P + T N
R e c a l l = T P T P + F N
P r e c i s i o n = T P T P + F P
F 1 - S c o r e = 2 × P r e c i s i o n × R e c a l l P r e c i s i o n + R e c a l l

5.2. Experiment 1: Results without the Feature Selection Optimization

We added an additional feature selection optimization step after the deep feature learning process. The n features extracted from the CNN model were used by an FS optimizer that selected the best m < n features. This step was tested by using many well-known optimizers, plus the proposed one. The resulting feature set was expected to improve the performance of the classifiers, even though it added some extra time for the machine learning pipeline to finish the whole processing. To measure how much the additional FS optimization step improved the performance, we evaluated the deep learning model without using a feature selection optimizer and reported the results. Table 3 shows the performance of directly training regular machine learning classifiers based on the deep features extracted from the CNN model. In other words, Table 3 illustrates the results of the three classifiers (DT, LDA, SVM) for each dataset without using any FS algorithms. The top row shows the results for the ISIC-2016 dataset, the second row shows the results for the PH2 dataset, the third row shows the results for the Chest-XRay dataset, and the last row shows the results for the Blood-Cell dataset. For the ISIC-2016 dataset, the SVM achieved the best results compared to DT and LDA (accuracy = 0.8602, recall = 0.8601, precision = 0.8546, and F1-score = 0.8567). For the PH2 dataset, the SVM still achieved the best results (accuracy = 0.9571, recall = 0.9571, precision = 0.9574, and F1-score = 0.957). The SVM achieved the best results for the Chest-XRay dataset as well (accuracy = 0.8718, recall = 0.8717, precision = 0.8906, and F1-score = 0.865); it also did for the Blood-Cell dataset (accuracy = 0.8846, recall = 0.8845, precision = 0.905, and F1-score = 0.8865). In the next subsections, we describe the use of an extra step after the deep learning process to select the best list of features from the deep features extracted by the CNN module.

5.3. Experiment 2: Results Based on the ISIC-2016 Dataset

The results of all optimizers based on the ISIC-2016 dataset are reported in Table 4. The optimizers selected from 128 features that were extracted using the DL algorithm. The resulting feature sets were used to train the binary classifiers for the difference between the malignant and benign classes. The AHA-AO selected the lowest number of features compared to the other optimizers. PSO, MFO, WOA, AO, AHA, and AHA-AO selected 86 (67.2%), 58 (45.3%), 56 (43.8%), 53 (41.4%), 60 (46.9%), and 52 (40.6%) of the raw features, respectively. Based on the best 52 features, the AHA-AO achieved the best results based on the SVM classifier (i.e., accuracy = 0.8734, BA = 0.7654, F1-score = 0.8683, recall = 0.8734, and precision = 0.8667). In addition, the AHA-AO achieved superior results with the LDA (accuracy = 0.8628, BA = 0.7588, F1-score = 0.859, recall = 0.8628, and precision = 0.8569) and DT (accuracy = 0.8179, BA = 0.7208, F1-score = 0.8193, recall = 0.8179, and precision = 0.8207) compared to the results when using the LDA and DT with other optimizers. The models with the extra FS step achieved better performance than the deep learning models without this step; see Table 3. Because the AHA-AO used the smallest feature set, the time complexity of the model was better than that of the other optimizers for all classifiers (i.e., 0.0398 with DT, 0.0349 with LDA, and 0.1132 with SVM). As noted, the LDA classifier had the shortest time of 0.0349 compared to the times taken by all of the other classifiers. The SVM had the shortest time of 0.1132 compared with all other SVM classifiers with the other optimizers. Note that all of the performance metrics were consistent, so an algorithm with the highest accuracy would have the highest values for the other metrics. DT is a simple classifier. Thus, it was not able to fit a dataset well. As a result, it achieved the lowest performance with all feature selection optimizers. The best-performing DT was based on the AHA optimizer’s feature set (BA = 0.8285), and the worst DT was based on the AO feature set (BA = 0.7942). Using the BA as a metric for comparison, DT achieved a performance of 0.6991, 0.6641, 0.6791, 0.6859, 0.7274, and 0.7208 with PSO, MFO, WOA, AO, AHA, and AHA-AO, respectively. The SVM achieved the best results with the PSO feature set (accuracy = 0.8628, BA = 0.7488, F1-score = 0.8573, recall = 0.8628, and precision = 0.8551). However, compared to the DT and LDA, it took the longest time of 0.155. Similarly, the SVM achieved the best results with the MFO optimizer (accuracy = 0.8628, BA = 0.7437, F1-score = 0.8564, recall = 0.8628, and precision = 0.8544). However, it had the longest time of 0.1232. Based on the WOA feature set, the LDA had the best results (accuracy = 0.8602, BA = 0.7571, F1-score = 0.8567, recall = 0.8602, and precision = 0.8546), and it had the shortest time of 0.0379. The LDA achieved the best results with the AO feature set (accuracy = 0.8628, BA = 0.7387, F1-score = 0.8554, recall = 0.8628, and precision = 0.8538), and, again, it had the best time of 0.0373. With the AHA optimizer, the LDA achieved the highest results (accuracy = 0.8681, BA = 0.747, F1-score = 0.861, recall = 0.8681, and precision = 0.8598), and it was the fast classier (i.e., time = 0.038). As a result, the SVM worked better with the features selected by the AHA-AO, PSO, and MFO; the LDA achieved the best results with the WOA, AO, and AHA. To conclude, the proposed AHA-AO achieved the best results with the three classifiers. This means that the AHA-AO selected the best features that captured the majority of the variance in the ISIC-2016 dataset.

5.4. Experiment 3: Results Based on the PH2 Dataset

The results of all optimizers based on the ISIC-2016 dataset are reported in Table 5. In this experiment, the feature selection optimizers selected from 512 features that were learned by the DL module. The feature optimization techniques selected different numbers of features (i.e., 107 (20.9%), 141 (27.5%), 159 (31.1%), 221 (43.2%), 222 (43.4%), and 326 (63.7%) with AHA-AO, AHA, AO, WOA, MFO, and PSO, respectively). The selected feature sets were used to train classifiers for a three-class classification problem to separate the common nevus, atypical nevus, and melanoma classes. Even though this was a more complex classification task than that in Experiment 1, most classifiers achieved better results in Experiment 2 than in Experiment 1. As can be clearly noticed in Table 5, the proposed AHA-AO selected the smallest feature set (107 features), and it achieved the best results with the SVM classifier (accuracy = 0.975, BA = 0.9792, F1-score = 0.975, recall = 0.975, and precision = 0.975) compared to the results of other classifiers tuned with all other optimizers. The resulting models with the extra FS step achieved better performance than the deep learning models without this step; see Table 3. We noticed a huge difference between the AHA-AO and the other optimizers regarding the time. All classifiers took less time compared to their corresponding classifiers with other optimizers. In other words, the AHA-AO-based SVM had the shortest time (0.0523) compared with all other SVM classifiers. The AHA-AO-based LDA had the shortest time (0.0937) compared with all other LDA algorithms, and the DT had the shortest time (0.0482) compared to all other classifiers. The DT showed high results compared with those of other DT algorithms (accuracy = 0.9107, BA = 0.9048, F1-score = 0.9115, recall = 0.9107, and precision = 0.9192); in addition, it achieved the lowest time complexity (0.0482). Next to the AHA-AO, the AHA selected 141 features, and AO selected 159 features. The AHA achieved the highest results when using the LDA classifier (accuracy = 0.9643, BA = 0.9702, F1-score = 0.9643, recall = 0.9643, and precision = 0.9643), but this classifier took a longer time (0.1095) than DT and SVM did. With the AO feature set, the SVM showed a higher performance compared to that of DT and LDA (accuracy = 0.9643, BA = 0.9702, F1-score = 0.9643, recall = 0.9643, and precision = 0.9643). It is clear that the proposed hybrid algorithm improved the performance of both AHA and AO by either selecting fewer features or achieving better results. Of all of the optimizers, the best time complexity was achieved by the AHA-AO using the DT classifier (0.0482). In addition, the SVM based on the AHA-AO features had the best time complexity compared to that of all other SVM classifiers, and the LDA had the best time complexity compared to that of all other LDA classifiers. As a result, the proposed algorithm improved both the performance and the speed of all algorithms. The WOA feature set achieved the best results when used to train both the LDA and SVM (accuracy = 0.9679, BA = 0.9732, F1-score = 0.9679, recall = 0.9679, and precision = 0.9681), but the LDA took a longer time for training (0.1445) than the SVM did (0.0961). The MFO feature set achieved similar results to those of the WOA when using the SVM classifier (accuracy = 0.9643, BA = 0.9702, F1-score = 0.9643, recall = 0.9643, and precision = 0.9644), but the MFO-based SVM classifier was faster than the WOA-based SVM classifier. Although PSO selected the largest number of features, it showed similar results to those of the MFO and WOA optimizers when using both the LDA and the SVM classifier (accuracy = 0.9643, BA = 0.9702, F1-score = 0.9643, recall = 0.9643, and precision = 0.9648). We noticed that having a large number of features did not help the classifiers to fit the data well and achieve good results. This meant that many of the features selected using PSO, MFO, WOA, AO, and AHA added much noise in the resulting dataset without adding any variance in the data. On the other hand, the proposed optimizer selected the best 107 features, which added sufficient variance in the data, with the least noise. As a result, the resulting feature set achieved the highest results and, at the same time, the shortest time. As observed in Experiment 1, the DT classifier achieved the worst results with all optimizers. Its best results were achieved by using the AHA feature set (accuracy = 0.925, BA = 0.9256, F1-score = 0.9251, recall = 0.925, and precision = 0.9293), and it took the shortest time compared to the LDA and SVM based on the AHA features. In addition, DT achieved the worst results when using the WOA feature set (accuracy = 0.8786, BA = 0.869, F1-score = 0.8794, recall = 0.8786, and precision = 0.8991). The LDA achieved the best results with the WOA optimizer’s features (accuracy = 0.9679, BA = 0.9732, F1-score = 0.9679, recall = 0.9679, and precision = 0.9681) and the worst results with the AHA-AO feature set (accuracy = 0.9571, BA = 0.9643, F1-score = 0.9571, recall = 0.9571, and precision = 0.9573). The SVM achieved the best results with the proposed AHA-AO algorithm and the worst results with the AHA features (accuracy = 0.9607, BA = 0.9673, F1-score = 0.9607, recall = 0.9607, and precision = 0.961).
To sum up, Experiment 2 showed the superiority of the proposed AHA-AO optimizer compared to the other five optimizers with regard to either the performance or the time. The AHA-AO selected the best feature set (107 features) that had the least noise and the highest variance. Building a classifier based on this feature set is expected to be more preferable in real environments because it will be more interpretable, faster, and more accurate.

5.5. Experiment 4: Results Based on the Chest-XRay Dataset

This experiment was based on the Chest-XRay dataset in order to train binary classifiers to differentiate between normal patients and those with pneumonia. The results are reported in Table 6. The resulting models with the extra FS step achieved better performance than the deep learning models without this step; see Table 3. Regarding the number of selected features, PSO selected the smallest number of features (79) compared to the other optimizers (MFO (91), WOA (98), AO (91), AHA (99), and AHA-AO (96)). Because it was based on the smallest number of features, the PSO-based LDA achieved the shortest time (0.1306). We discovered that the proposed AHA-AO optimizer achieved the best results compared to all other optimizers. These results were achieved by the SVM classifier (accuracy = 0.8686, BA = 0.8274, F1-score = 0.8617, recall = 0.8686, and precision = 0.8869). However, the SVM had a long processing time (0.6623). The fastest AHA-AO-based classifier was the LDA (i.e., time = 0.1783); even though it was not the best compared to the other optimizers’ classifiers, this time was comparable to the best time of the PSO-based LDA (0.1306). The slowest AHA-AO-based classifier was the DT (0.5981), but it had a comparable time to that of the other DT classifiers with other FS optimizers. As a result, even though they did not achieve the best learning time, the AHA-AO-based classifiers achieved a better-than-average time. The slowest classifier in Table 6 was the SVM based on the MFO optimizer (0.7427). PSO selected the smallest number of features, but its performance suffered for all classifiers. The POS-based DT had the worst performance compared to all other classifiers (accuracy = 0.8013, BA = 0.7487, F1-score = 0.7875, recall = 0.8013, and precision = 0.8177). The PSO-based LDA classifier had the best time (0.1306), but its other performance metrics were not high (accuracy = 0.8446, BA = 0.7953, F1-score = 0.8339, recall = 0.8446, and precision = 0.87). We noticed that the SVM achieved the best results compared to those of DT and LDA for all optimizers (accuracy = 0.8478, BA = 0.8004, F1-score = 0.838, recall = 0.8478, and precision = 0.8706 for PSO, accuracy = 0.8574, BA = 0.8132, F1-score = 0.8492, recall = 0.8574, and precision = 0.8774 for MFO, accuracy = 0.8558, BA = 0.8103, F1-score = 0.847, recall = 0.8558, and precision = 0.8778 for WOA, accuracy = 0.8558, BA = 0.8111, F1-score = 0.8473, recall = 0.8558, and precision = 0.8763 for AO, and accuracy = 0.8542, BA = 0.8081, F1-score = 0.8451, recall = 0.8542, and precision = 0.8767 for AHA). In this experiment, we noticed that selecting more features was not correlated with an enhancement in the performance, but it sometimes increased the time. For example, the PSO-based DT classifier was based on 79 features and achieved a BA of 0.7487; the MFO-based DT used 91 features and achieved a BA of 0.7641; the WOA-based DT used 98 features and achieved a BA of 0.7778; the AO-based DT achieved a BA of 0.7722 with only 91 features; the AHA-based DT achieved a lower BA of 0.756 with 99 features. Similar behaviors were followed with the LDA and SVM classifiers with all optimizers. As a result, it was not a matter of the number of features, but it depended on the quality of the selected features. PSO selected only 79 features, but they achieved bad results; AHA selected 99 features, but they still achieved bad results. On the other hand, the AHA-AO optimizer selected 96 features, which was less than the AHO and WOA, but achieved the highest results.

5.6. Experiment 5: Results Based on the Blood-Cell Dataset

In this experiment, we evaluated the performance of the proposed FS optimizer in comparison with the other list of optimizers based on the Blood-Cell dataset. The results of this experiment are shown in Table 7. The resulting models with the extra FS step achieved better performance than the deep learning models without this step; see Table 3. As can be noticed in Table 7, the list of selected features from the proposed AHA-AO optimizer succeeded in achieving the best results in terms of both accuracy and time. In addition, the AHA-AO selected the smallest number of features compared to the other optimizers (347 (67.8%), 225 (43.9%), 226 (44.1%), 125 (24.1%), 132 (25.8%), 65 (12.7%)). The AHA-AO-based SVM achieved the best results compared to those of the other optimizers’ classifiers (accuracy = 0.8862, BA = 0.8862, F1-score = 0.8878, recall = 0.8862, and precision = 0.9053), and its time was the best compared to those of the other SVM classifiers with other optimizers (0.2579, 0.53, 0.6661, 0.7249, 0.7944, and 0.8885 for AHA-AO, AHA, AO, WOA, MFO, and PSO). Regarding the time, the AHA-AO-based LDA achieved the best time compared to all other classifiers (0.1887), and its performance was comparable to that of the best-performing LDA of PSO (accuracy = 0.8826, BA = 0.8825, F1-score = 0.8844, recall = 0.8826, and precision = 0.903). The AHA-AO-based DT had the shortest time compared to the other DT classifiers for all optimizers (0.4053). As a result, the features selected by the proposed AHA-AO model achieved the best performance with the SVM classifier and the best time when using the LDA. In addition, the AHA-AO-based SVM and DT classifiers achieved the best times compared to the SVMs and DTs of other optimizers, respectively. It can be noticed that the SVM classifier achieved better results compared to the DT and LDA for all optimizers. With the PSO features, the SVM had a performance with accuracy = 0.8858, BA = 0.8858, F1-score = 0.8877, recall = 0.8858, and precision = 0.906. With the MFO features, the SVM had accuracy = 0.8838, BA = 0.8838, F1-score = 0.8859, recall = 0.8838, and precision = 0.9055. With the WOA features, the SVM had accuracy = 0.8838, BA = 0.8838, F1-score = 0.8856, recall = 0.8838, and precision = 0.9041. With the AO features, the SVM achieved a performance of accuracy = 0.8838, BA = 0.8838, F1-score = 0.886, recall = 0.8838, and precision = 0.9058. With the AHA features, the SVM achieved results of accuracy = 0.8846, BA = 0.8846, F1-score = 0.8863, recall = 0.8846, and precision = 0.9035. The DT classifier achieved the worst results with all optimizers, except with AO, with which it achieved a result better than that of LDA (accuracy = 0.8806, BA = 0.8805, F1-score = 0.8822, recall = 0.8806, and precision = 0.898). To sum up, the proposed AHA-AO optimizer succeeded in selecting the best feature set of 65 features out of 512 deep features. The total number of features was smaller than the numbers of features selected by other optimizers. However, these features achieved the best results and the best time compared to those of the other optimizers. These results prove the superiority of the proposed algorithm and how it enhances the results of its base components of AO and AHA.

5.7. Comparison with Studies in the Literature

In this study, we proposed a new feature selection optimization technique and analyzed its performance with four different datasets. The proposed optimizer helped all machine learning models to improve their performance and their speed. As shown in Figure 6, the proposed optimizer selected the smallest number of features from all datasets, except for the Chest dataset. These features were the most informative features because they supported the machine learning algorithms in achieving the best results, as shown in Figure 7. In addition, the trained classifiers were faster based on the selected features of the AHA-AO algorithm, as shown in Figure 8. To sum up, using the proposed AHA-AO as a a feature selection technique in the machine learning pipeline has been proven to (1) allow the selection of the best feature set, (2) improve the performance of the model, and (3) speed up the learning process. This section compares the proposed approach with the state-of-the-art medical image classification techniques in the literature.
Table 8 shows the results of some important methods. For a fair comparison, we concentrate on studies that used the same datasets. For the ISIC-2016 dataset, the following advanced skin cancer identification methods were compared: a method based on segregation and then validation [34]; a method that relied on feature fusion [32]; a method correlated with Fisher coding and deep residual networks [39]; a multi-CNN interactive learning model [40]; an ensemble method [59]; an integration of a Fisher vector and CNN fusion [41]. Yu et al. [34] proposed a fully convolutional residual network (FCRN) for segmentation, and further enhanced it by adding a multi-scale contextual information strategy to expand its capabilities. Furthermore, for a categorization task, they combined the FCRN with several deep residual networks. Ge et al. [32] discovered a technique for combining two types of features of a deep CNN, namely, global and local features. To retrieve these features, they used a deep residual network and a bilinear pooling approach. Yu et al. [39] introduced a technique based on the ResNet model and a local descriptor encoding mechanism. To train the pre-trained ResNet, they employed a huge natural ImageNet dataset. Next, based on Fisher vector (FV) encoding, these local deep descriptors were combined to create a global image representation. Lastly, using an SVM, the FV representations were employed to diagnose melanoma. Zhang et al. [40] discovered a technique for jointly running deep CNNs and allowing them to train on one another. Each pair of neural networks’ learnt image representations was combined as the entry of a network that had a fully connected design that forecasted if the pair of image data belonged to the same category. Therefore, if one of the neural networks correctly classified, a fault made by the other caused a synergic mistake, which required an additional effort to modify the network. This network can be constructed from start to finish using classification faults from each network. Yu et al. [41] suggested a cross-net-based combination of several fully convolutional networks to detect skin lesions on its own. They used multiple convolutional networks to select semantic regions and local colors and patterns in skin images. In addition, they used FV to encode the selected features.
For the PH2 dataset, the following technologies for melanoma diagnosis were evaluated together. One involved an artificial neural network, as introduced in [60]; in addition, they developed a decision-support system. Sparse kernel models for representing feature data in a high-dimensional feature vector were proposed by [61]. They developed a method for segmenting and classifying lesion images based on sparse representations. They also employed discriminative sparse kernel coding to simultaneously learn a kernel-based dictionary and a linear classifier. According to [62], U-Net can be used to automatically detect malignant tumors. To tackle the limitation of overfitting, U-Net was employed with a spatial dropout, and several augmentation techniques were added to the training examples to ensure more samples. As part of their IoT framework, the authors of [63] employed transfer learning and CNNs. They used convolutional neural networks (CNNs) as resource extractors. They tested the effects of combining twelve CNN architectures with seven distinct classification models. A hierarchical architecture founded on two-dimensional pixels in the images and ResNet was introduced in [64] for advanced deep learning. They improved the quality of dermoscopy images by combining locally and globally enhanced images. Later, using TL, a ResNet approach was developed for these mapped images and learned features. The retrieved features were modified using the grasshopper optimization approach, and the Naive Bayes classification algorithm was used.
The Chest-XRay dataset was used to compare various advanced methods for the detection of pneumonia. In [65], the authors examined the use of generative adversarial networks (GANs) to enrich a dataset by producing chest X-ray data samples. GANs offer a method for learning about the underlying architectures of medical images, which can subsequently be used to make high-quality and realistic samples. In [66], the authors proposed an automatic transfer-learning method based on CNNs using concepts pre-trained with DenseNet121.
In order to identify and count basic blood cells in the Blood-Cell dataset, the following identification and counting methods were used. As a result of the CNN’s solution, SVM-based classifiers were able to classify data, as proposed in [67]. In addition, a granularity feature and SVM were used in [68]. In order to automate the entire procedure, CNNs were presented as a deep learning method in [69].
The bottom line is that we can remove superfluous features from high-dimensional medical image representations obtained by convolutional neural networks (CNNs) by using our strategy. However, this method’s drawback is its complexity in terms of both time and memory. Our next steps will be to decrease the complexity and enhance the performance of the suggested technique. In addition, other augmentation techniques can be studied in the future to optimize the effectiveness of our model.

6. Limitations of the Study and Future Work

The proposed method was performed through a set of steps that began with extracting the features from medical images. This extraction process was achieved by using MobileNetV3. MobileNetV3 was fine-tuned on the medical image datasets to learn more complex and meaningful representations, and it helped to extract relevant feature representations. Then, the extracted features were fed to the feature selection phase, which depended on the improvement of the behavior of the new metaheuristic algorithm called the Artificial Hummingbird Algorithm. This improvement was performed by using Aquila Optimization to enhance the diversity of agents during the search process. This led to an enhancement in the convergence rate towards the optimal subset of relevant features. Due to the rapid calculation of the threshold parameters and the high reliability of the output, the AHA-AO achieved a high convergence rate, indicating that it prevented trapping in optimal solutions and was well balanced between the exploitation and exploration phases.
Our study proposes an advanced feature selection optimization technique that improves the performance of deep learning and machine learning models. However, there are still some limitations for the proposed algorithm. The most important problems are the time and the memory. In future work, we plan on lowering the complexity and enhancing the performance of the suggested model. In addition, we will introduce an AHA-AO based on a multi-objective FS technique for higher-dimensional space with a low number of instances to enhance the classification results by reducing the number of features, allowing us to use more accurate classifiers. Furthermore, the implementation of hyper-heuristic techniques in FS could be a significant research area.

7. Conclusions

Given the great significance of medical image recognition and the particular problem of small medical image datasets, the focus of this work is on how a CNN model (i.e., MobileNetV3) could be implemented with feature selection optimization for small datasets, and the performance was evaluated. Initially, the features of the small medical image datasets were obtained by using a MobileNetV3 model, which is considered the most recent transfer learning model, and the MobileNetV3 method is compared with other high-efficiency methods. The proposed approach was improved in order to create more relevant feature vector representations that are beneficial to the medical field by using medical imaging datasets. Moreover, a unique metaheuristic technique based on selected features combined the Artificial Hummingbird Algorithm (AHA) with Aquila Optimization (AO) to select the relevant features. To check whether our approach worked well, it was tried on the following datasets: the ISIC-2016, PH2, Chest-XRay, and Blood-Cell datasets. The findings revealed that the proposed optimization strategy outperformed existing feature selection techniques that are currently in use. Furthermore, tests with several other cutting-edge medical image classification systems revealed that the proposed approach is a good procedure. Future studies will examine the growing availability of medical data and their use in medical care. The combination of different categorization algorithms is also a fascinating research issue, as it might help practitioners enhance the performance of the present methods.

Author Contributions

Conceptualization, M.A.E., A.D. and A.M.; methodology, M.A.E., A.D. and A.M.; software, M.A.E., A.D. and A.M.; validation, M.A.E., A.D. and S.E.-S.; formal analysis, M.A.E., A.D. and S.E.-S.; investigation, M.A.E., A.D. and S.E.-S.; writing—review and editing, M.A.E., A.D., S.E.-S., A.M. and M.M.G.; visualization, M.A.E., A.D., S.E.-S., A.M. and M.M.G.; supervision, M.A.E. and M.M.G. All authors have read and agreed to the published version of the manuscript.

Funding

This work has received financial support from the European Regional Development Fund (tRDF) and the Galician Regional Government, under the agreement for funding the Atlantic Research Center for Information and Communication Technologies (atlanTTic). This work was also supported by the Spanish Government under re-search project “Enhancing Communication Protocols with Machine Learning while Protecting Sensitive Data (COMPROMISE)” (PID2020-113795RB-C33/AEI/10.13039/501100011033).

Data Availability Statement

The data available upon request.

Conflicts of Interest

The authors declare that there are no conflicts of interest regarding the publication of this paper.

References

  1. Wang, L.; Wang, H.; Huang, Y.; Yan, B.; Chang, Z.; Liu, Z.; Zhao, M.; Cui, L.; Song, J.; Li, F. Trends in the application of deep learning networks in medical image analysis: Evolution between 2012 and 2020. Eur. J. Radiol. 2022, 146, 110069. [Google Scholar] [CrossRef] [PubMed]
  2. Kisilev, P.; Walach, E.; Barkan, E.; Ophir, B.; Alpert, S.; Hashoul, S.Y. From medical image to automatic medical report generation. IBM J. Res. Dev. 2015, 59, 2:1–2:7. [Google Scholar] [CrossRef]
  3. Liu, F.; Tian, Y.; Chen, Y.; Liu, Y.; Belagiannis, V.; Carneiro, G. ACPL: Anti-Curriculum Pseudo-Labelling for Semi-Supervised Medical Image Classification. In Proceedings of the IEEE/CVF Conference on Computer Vision and Pattern Recognition, Virtual, 19–20 June 2022; pp. 20697–20706. [Google Scholar]
  4. Cheng, J.; Tian, S.; Yu, L.; Gao, C.; Kang, X.; Ma, X.; Wu, W.; Liu, S.; Lu, H. ResGANet: Residual group attention network for medical image classification and segmentation. Med. Image Anal. 2022, 76, 102313. [Google Scholar] [CrossRef] [PubMed]
  5. Mahapatra, D. Unsupervised Domain Adaptation Using Feature Disentanglement And GCNs For Medical Image Classification. arXiv 2022, arXiv:2206.13123. [Google Scholar]
  6. Gao, Y.; Liu, H.; Wang, X.; Zhang, K. On an artificial neural network for inverse scattering problems. J. Comput. Phys. 2022, 448, 110771. [Google Scholar] [CrossRef]
  7. Yin, W.; Yang, W.; Liu, H. A neural network scheme for recovering scattering obstacles with limited phaseless far-field data. J. Comput. Phys. 2020, 417, 109594. [Google Scholar] [CrossRef]
  8. Ding, M.H.; Liu, H.; Zheng, G.H. Shape reconstructions by using plasmon resonances. ESAIM Math. Model. Numer. Anal. 2022, 56, 705–726. [Google Scholar] [CrossRef]
  9. Deng, Y.; Liu, H.; Zheng, G.H. Mathematical analysis of plasmon resonances for curved nanorods. J. Math. Pures Appl. 2021, 153, 248–280. [Google Scholar] [CrossRef]
  10. Deng, Y.; Liu, H.; Zheng, G.H. Plasmon resonances of nanorods in transverse electromagnetic scattering. J. Differ. Equations 2022, 318, 502–536. [Google Scholar] [CrossRef]
  11. Singhal, A.; Phogat, M.; Kumar, D.; Kumar, A.; Dahiya, M.; Shrivastava, V.K. Study of deep learning techniques for medical image analysis: A review. Mater. Today Proc. 2022. [Google Scholar] [CrossRef]
  12. Salahuddin, Z.; Woodruff, H.C.; Chatterjee, A.; Lambin, P. Transparency of deep neural networks for medical image analysis: A review of interpretability methods. Comput. Biol. Med. 2022, 140, 105111. [Google Scholar] [CrossRef] [PubMed]
  13. Karimi, D.; Warfield, S.K.; Gholipour, A. Transfer learning in medical image segmentation: New insights from analysis of the dynamics of model parameters and learned representations. Artif. Intell. Med. 2021, 116, 102078. [Google Scholar] [CrossRef] [PubMed]
  14. Niu, S.; Liu, M.; Liu, Y.; Wang, J.; Song, H. Distant domain transfer learning for medical imaging. IEEE J. Biomed. Health Inform. 2021, 25, 3784–3793. [Google Scholar] [CrossRef]
  15. Adel, H.; Dahou, A.; Mabrouk, A.; Abd Elaziz, M.; Kayed, M.; El-Henawy, I.M.; Alshathri, S.; Amin Ali, A. Improving Crisis Events Detection Using DistilBERT with Hunger Games Search Algorithm. Mathematics 2022, 10, 447. [Google Scholar] [CrossRef]
  16. Rehman, A.; Khan, M.A.; Saba, T.; Mehmood, Z.; Tariq, U.; Ayesha, N. Microscopic brain tumor detection and classification using 3D CNN and feature selection architecture. Microsc. Res. Tech. 2021, 84, 133–149. [Google Scholar] [CrossRef] [PubMed]
  17. Öztürk, Ş. Class-driven content-based medical image retrieval using hash codes of deep features. Biomed. Signal Process. Control 2021, 68, 102601. [Google Scholar] [CrossRef]
  18. Anwar, S.M.; Majid, M.; Qayyum, A.; Awais, M.; Alnowami, M.; Khan, M.K. Medical image analysis using convolutional neural networks: A review. J. Med. Syst. 2018, 42, 1–13. [Google Scholar] [CrossRef]
  19. Samala, R.K.; Chan, H.P.; Hadjiiski, L.M.; Helvie, M.A.; Richter, C.; Cha, K. Evolutionary pruning of transfer learned deep convolutional neural network for breast cancer diagnosis in digital breast tomosynthesis. Phys. Med. Biol. 2018, 63, 095005. [Google Scholar] [CrossRef]
  20. Vijh, S.; Sharma, S.; Gaurav, P. Brain tumor segmentation using OTSU embedded adaptive particle swarm optimization method and convolutional neural network. In Data Visualization and Knowledge Engineering; Springer: Berlin/Heidelberg, Germany, 2020; pp. 171–194. [Google Scholar]
  21. Zhao, W.; Wang, L.; Mirjalili, S. Artificial hummingbird algorithm: A new bio-inspired optimizer with its engineering applications. Comput. Methods Appl. Mech. Eng. 2022, 388, 114194. [Google Scholar] [CrossRef]
  22. Ramadan, A.; Ebeed, M.; Kamel, S.; Ahmed, E.M.; Tostado-Véliz, M. Optimal allocation of renewable DGs using artificial hummingbird algorithm under uncertainty conditions. Ain Shams Eng. J. 2022, 101872. [Google Scholar] [CrossRef]
  23. Zhao, W.; Zhang, Z.; Mirjalili, S.; Wang, L.; Khodadadi, N.; Mirjalili, S.M. An effective multi-objective artificial hummingbird algorithm with dynamic elimination-based crowding distance for solving engineering design problems. Comput. Methods Appl. Mech. Eng. 2022, 398, 115223. [Google Scholar] [CrossRef]
  24. Sadoun, A.M.; Najjar, I.R.; Alsoruji, G.S.; Abd-Elwahed, M.; Elaziz, M.A.; Fathy, A. Utilization of improved machine learning method based on artificial hummingbird algorithm to predict the tribological behavior of Cu-Al2O3 nanocomposites synthesized by in situ method. Mathematics 2022, 10, 1266. [Google Scholar] [CrossRef]
  25. Abid, M.S.; Apon, H.J.; Morshed, K.A.; Ahmed, A. Optimal Planning of Multiple Renewable Energy-Integrated Distribution System With Uncertainties Using Artificial Hummingbird Algorithm. IEEE Access 2022, 10, 40716–40730. [Google Scholar] [CrossRef]
  26. Abualigah, L.; Yousri, D.; Abd Elaziz, M.; Ewees, A.A.; Al-qaness, M.A.; Gandomi, A.H. Aquila Optimizer: A novel meta-heuristic optimization Algorithm. Comput. Ind. Eng. 2021, 157, 107250. [Google Scholar] [CrossRef]
  27. Subba Reddy, T.; Harikiran, J.; Enduri, M.K.; Hajarathaiah, K.; Almakdi, S.; Alshehri, M.; Naveed, Q.N.; Rahman, M.H. Hyperspectral Image Classification with Optimized Compressed Synergic Deep Convolution Neural Network with Aquila Optimization. Comput. Intell. Neurosci. 2022, 2022, 6781740. [Google Scholar] [CrossRef]
  28. Ewees, A.A.; Algamal, Z.Y.; Abualigah, L.; Al-qaness, M.A.; Yousri, D.; Ghoniem, R.M.; Abd Elaziz, M. A Cox Proportional-Hazards Model Based on an Improved Aquila Optimizer with Whale Optimization Algorithm Operators. Mathematics 2022, 10, 1273. [Google Scholar] [CrossRef]
  29. Rajinikanth, V.; Aslam, S.M.; Kadry, S.; Thinnukool, O. Semi/Fully-Automated Segmentation of Gastric-Polyp Using Aquila-Optimization-Algorithm Enhanced Images. CMC-Comput. Mater. Contin. 2022, 70, 4087–4105. [Google Scholar] [CrossRef]
  30. Ayan, E.; Ünver, H.M. Diagnosis of pneumonia from chest X-ray images using deep learning. In Proceedings of the 2019 Scientific Meeting on Electrical-Electronics & Biomedical Engineering and Computer Science (EBBT), Istanbul, Turkey, 24–26 April 2019; pp. 1–5. [Google Scholar]
  31. Chouhan, V.; Singh, S.K.; Khamparia, A.; Gupta, D.; Tiwari, P.; Moreira, C.; Damaševičius, R.; De Albuquerque, V.H.C. A novel transfer learning based approach for pneumonia detection in chest X-ray images. Appl. Sci. 2020, 10, 559. [Google Scholar] [CrossRef]
  32. Ge, Z.; Demyanov, S.; Bozorgtabar, B.; Abedini, M.; Chakravorty, R.; Bowling, A.; Garnavi, R. Exploiting local and generic features for accurate skin lesions classification using clinical and dermoscopy imaging. In Proceedings of the 2017 IEEE 14th international symposium on biomedical imaging (ISBI 2017), Melbourne, Australia, 18–21 April 2017; pp. 986–990. [Google Scholar]
  33. Esteva, A.; Kuprel, B.; Novoa, R.A.; Ko, J.; Swetter, S.M.; Blau, H.M.; Thrun, S. Dermatologist-level classification of skin cancer with deep neural networks. Nature 2017, 542, 115–118. [Google Scholar] [CrossRef] [PubMed]
  34. Yu, L.; Chen, H.; Dou, Q.; Qin, J.; Heng, P.A. Automated melanoma recognition in dermoscopy images via very deep residual networks. IEEE Trans. Med. Imaging 2016, 36, 994–1004. [Google Scholar] [CrossRef]
  35. Guo, Y.; Ashour, A.S.; Si, L.; Mandalaywala, D.P. Multiple convolutional neural network for skin dermoscopic image classification. In Proceedings of the 2018 IEEE International Symposium on Signal Processing and Information Technology (ISSPIT), Louisville, KY, USA, 6–8 December 2018; pp. 365–369. [Google Scholar]
  36. Kawahara, J.; BenTaieb, A.; Hamarneh, G. Deep features to classify skin lesions. In Proceedings of the 2016 IEEE 13th International Symposium on Biomedical Imaging (ISBI), Prague, Czech Republic, 13–16 April 2016; pp. 1397–1400. [Google Scholar]
  37. Lopez, A.R.; Giro-i Nieto, X.; Burdick, J.; Marques, O. Skin lesion classification from dermoscopic images using deep learning techniques. In Proceedings of the 2017 13th IASTED International Conference on Biomedical Engineering (BioMed), Innsbruck, Austria, 20–21 February 2017; pp. 49–54. [Google Scholar]
  38. Ayan, E.; Ünver, H.M. Data augmentation importance for classification of skin lesions via deep learning. In Proceedings of the 2018 Electric Electronics, Computer Science, Biomedical Engineerings’ Meeting (EBBT), Istanbul, Turkey, 18–19 April 2018; pp. 1–4. [Google Scholar]
  39. Yu, Z.; Jiang, X.; Zhou, F.; Qin, J.; Ni, D.; Chen, S.; Lei, B.; Wang, T. Melanoma recognition in dermoscopy images via aggregated deep convolutional features. IEEE Trans. Biomed. Eng. 2018, 66, 1006–1016. [Google Scholar] [CrossRef] [PubMed]
  40. Zhang, J.; Xie, Y.; Wu, Q.; Xia, Y. Medical image classification using synergic deep learning. Med. Image Anal. 2019, 54, 10–19. [Google Scholar] [CrossRef]
  41. Yu, Z.; Jiang, F.; Zhou, F.; He, X.; Ni, D.; Chen, S.; Wang, T.; Lei, B. Convolutional descriptors aggregation via cross-net for skin lesion recognition. Appl. Soft Comput. 2020, 92, 106281. [Google Scholar] [CrossRef]
  42. Wei, L.; Ding, K.; Hu, H. Automatic skin cancer detection in dermoscopy images based on ensemble lightweight deep learning network. IEEE Access 2020, 8, 99633–99647. [Google Scholar] [CrossRef]
  43. Shankar, K.; Lakshmanaprabu, S.; Khanna, A.; Tanwar, S.; Rodrigues, J.J.; Roy, N.R. Alzheimer detection using Group Grey Wolf Optimization based features with convolutional classifier. Comput. Electr. Eng. 2019, 77, 230–243. [Google Scholar]
  44. Goel, T.; Murugan, R.; Mirjalili, S.; Chakrabartty, D.K. OptCoNet: An optimized convolutional neural network for an automatic diagnosis of COVID-19. Appl. Intell. 2021, 51, 1351–1366. [Google Scholar] [CrossRef]
  45. Elhoseny, M.; Shankar, K. Optimal bilateral filter and convolutional neural network based denoising method of medical image measurements. Measurement 2019, 143, 125–135. [Google Scholar] [CrossRef]
  46. Zhang, N.; Cai, Y.X.; Wang, Y.Y.; Tian, Y.T.; Wang, X.L.; Badami, B. Skin cancer diagnosis based on optimized convolutional neural network. Artif. Intell. Med. 2020, 102, 101756. [Google Scholar] [CrossRef]
  47. El-Shafeiy, E.; Sallam, K.M.; Chakrabortty, R.K.; Abohany, A.A. A clustering based Swarm Intelligence optimization technique for the Internet of Medical Things. Expert Syst. Appl. 2021, 173, 114648. [Google Scholar] [CrossRef]
  48. Liu, J.; Inkawhich, N.; Nina, O.; Timofte, R. NTIRE 2021 multi-modal aerial view object classification challenge. In Proceedings of the IEEE/CVF Conference on Computer Vision and Pattern Recognition, Nashville, TN, USA, 20–25 June 2021; pp. 588–595. [Google Scholar]
  49. Ignatov, A.; Romero, A.; Kim, H.; Timofte, R. Real-time video super-resolution on smartphones with deep learning, mobile ai 2021 challenge: Report. In Proceedings of the IEEE/CVF Conference on Computer Vision and Pattern Recognition, Nashville, TN, USA, 20–25 June 2021; pp. 2535–2544. [Google Scholar]
  50. Howard, A.; Sandler, M.; Chu, G.; Chen, L.C.; Chen, B.; Tan, M.; Wang, W.; Zhu, Y.; Pang, R.; Vasudevan, V.; et al. Searching for mobilenetv3. In Proceedings of the IEEE/CVF International Conference on Computer Vision, Seoul, Korea, 27 October–2 November 2019; pp. 1314–1324. [Google Scholar]
  51. Tan, M.; Le, Q. Efficientnet: Rethinking model scaling for convolutional neural networks. In Proceedings of the International Conference on Machine Learning, Long Beach, CA, USA, 10–15 June 2019; pp. 6105–6114. [Google Scholar]
  52. Huang, G.; Liu, Z.; Van Der Maaten, L.; Weinberger, K.Q. Densely connected convolutional networks. In Proceedings of the IEEE Conference on Computer Vision and Pattern Recognition, Honolulu, HI, USA, 21–26 July 2017; pp. 4700–4708. [Google Scholar]
  53. Tan, M.; Chen, B.; Pang, R.; Vasudevan, V.; Sandler, M.; Howard, A.; Le, Q.V. Mnasnet: Platform-aware neural architecture search for mobile. In Proceedings of the IEEE/CVF Conference on Computer Vision and Pattern Recognition, Long Beach, CA, USA, 10–15 June 2019; pp. 2820–2828. [Google Scholar]
  54. Abd Elaziz, M.; Dahou, A.; Alsaleh, N.A.; Elsheikh, A.H.; Saba, A.I.; Ahmadein, M. Boosting COVID-19 Image Classification Using MobileNetV3 and Aquila Optimizer Algorithm. Entropy 2021, 23, 1383. [Google Scholar] [CrossRef]
  55. Chlap, P.; Min, H.; Vandenberg, N.; Dowling, J.; Holloway, L.; Haworth, A. A review of medical image data augmentation techniques for deep learning applications. J. Med. Imaging Radiat. Oncol. 2021, 65, 545–563. [Google Scholar] [CrossRef] [PubMed]
  56. He, K.; Zhang, X.; Ren, S.; Sun, J. Deep residual learning for image recognition. In Proceedings of the IEEE Conference on Computer Vision and Pattern Recognition, Las Vegas, NV, USA, 27–30 June 2016; pp. 770–778. [Google Scholar]
  57. Ramachandran, P.; Zoph, B.; Le, Q.V. Searching for activation functions. arXiv 2017, arXiv:1710.05941. [Google Scholar]
  58. Elfwing, S.; Uchibe, E.; Doya, K. Sigmoid-weighted linear units for neural network function approximation in reinforcement learning. Neural Netw. 2018, 107, 3–11. [Google Scholar] [CrossRef] [PubMed]
  59. Pathan, S.; Prabhu, K.G.; Siddalingaswamy, P. Automated detection of melanocytes related pigmented skin lesions: A clinical framework. Biomed. Signal Process. Control 2019, 51, 59–72. [Google Scholar] [CrossRef]
  60. Ozkan, I.A.; Koklu, M. Skin lesion classification using machine learning algorithms. Int. J. Intell. Syst. Appl. Eng. 2017, 5, 285–289. [Google Scholar] [CrossRef]
  61. Moradi, N.; Mahdavi-Amiri, N. Kernel sparse representation based model for skin lesions segmentation and classification. Comput. Methods Programs Biomed. 2019, 182, 105038. [Google Scholar] [CrossRef]
  62. Al Nazi, Z.; Abir, T.A. Automatic skin lesion segmentation and melanoma detection: Transfer learning approach with u-net and dcnn-svm. In Proceedings of the International Joint Conference on Computational Intelligence, Budapest, Hungary, 2–4 November 2020; pp. 371–381. [Google Scholar]
  63. Rodrigues, D.D.A.; Ivo, R.F.; Satapathy, S.C.; Wang, S.; Hemanth, J.; Reboucas Filho, P.P. A new approach for classification skin lesion based on transfer learning, deep learning, and IoT system. Pattern Recognit. Lett. 2020, 136, 8–15. [Google Scholar] [CrossRef]
  64. Afza, F.; Sharif, M.; Mittal, M.; Khan, M.A.; Hemanth, D.J. A hierarchical three-step superpixels and deep learning framework for skin lesion classification. Methods 2021, 202, 88–102. [Google Scholar] [CrossRef]
  65. Madani, A.; Moradi, M.; Karargyris, A.; Syeda-Mahmood, T. Chest X-ray generation and data augmentation for cardiovascular abnormality classification. In Proceedings of the Medical Imaging 2018: Image Processing, Houston, TX, USA, 11–13 February 2018; Volume 10574, p. 105741M. [Google Scholar]
  66. Salehi, M.; Mohammadi, R.; Ghaffari, H.; Sadighi, N.; Reiazi, R. Automated detection of pneumonia cases using deep transfer learning with paediatric chest X-ray images. Br. J. Radiol. 2021, 94, 20201263. [Google Scholar] [CrossRef]
  67. Habibzadeh, M.; Krzyżak, A.; Fevens, T. White blood cell differential counts using convolutional neural networks for low resolution images. In Proceedings of the International Conference on Artificial Intelligence and Soft Computing, Zakopane, Poland, 9–13 June 2013; pp. 263–274. [Google Scholar]
  68. Zhao, J.; Zhang, M.; Zhou, Z.; Chu, J.; Cao, F. Automatic detection and classification of leukocytes using convolutional neural networks. Med. Biol. Eng. Comput. 2017, 55, 1287–1301. [Google Scholar] [CrossRef]
  69. Sharma, M.; Bhave, A.; Janghel, R.R. White blood cell classification using convolutional neural network. In Soft Computing and Signal Processing; Springer: Berlin/Heidelberg, Germany, 2019; pp. 135–143. [Google Scholar]
Figure 1. Flowchart for AO.
Applsci 12 09710 g001
Figure 2. Steps of the AHA.
Applsci 12 09710 g002
Figure 3. The architecture of the model used for feature extraction.
Applsci 12 09710 g003
Figure 4. The architecture of the proposed AHA-AO for the FS problem.
Applsci 12 09710 g004
Figure 5. Samples of medical images for the classification task from the four selected databases.
Applsci 12 09710 g005
Figure 6. Numbers of selected features of different optimizers for all datasets.
Applsci 12 09710 g006
Figure 7. Comparison among the best classifiers with every optimizer and the four datasets: (A) for the ISIC-2016 dataset, (B) for the PH2 dataset, (C) for the Chest dataset, and (D) for the Blood dataset.
Applsci 12 09710 g007
Figure 8. Comparison of the time taken by different optimizers on the four datasets.
Applsci 12 09710 g008
Table 1. Parameter settings of the methods.
AlgorithmParameter Settings
PSOVMax = 6, WMax = 0.9, WMin = 0.2
MFO a = 2 , b = 1 ,
WOA a = 2 t o 0 , a 2 = −1 to −2
AO α = 0.1 , δ = 0.1 , ω = 0.005
AHA r [ 0 , 1 ]
AHA-AO α = 0.1 , δ = 0.1 , ω = 0.005 , r [ 0 , 1 ]
Table 2. Description of the datasets.
Dataset NameClassTraining DataTest DataTotal Images
ISIC-2016Malignant17375248
Benign7273041031
P h 2 Common Nevus681280
Atypical Nevus681280
Melanoma34640
Chest-XRayNormal13492341583
Pneumonia38833904273
Blood-CellNeutrophil24996243123
Monocyte24786203098
Lymphocyte24836203103
Eosinophil24976233120
Table 3. Classification results without using feature selection optimization.
DatasetClassifierAccuracyRecallPrecisionF1-Score
ISIC-2016DT0.82590.82580.81920.8221
LDA0.86020.86010.85180.8541
SVM0.86020.86010.85460.8567
PH2DT0.91790.91780.92060.9177
LDA0.95360.95350.9550.9535
SVM0.95710.95710.95740.9572
Chest-XRayDT0.82530.82530.83840.8156
LDA0.84780.84770.87390.8373
SVM0.87180.87170.89060.8651
Blood-CellDT0.87860.87850.90010.8809
LDA0.88340.88330.90410.8853
SVM0.88460.88450.9050.8865
Table 4. Classification results of each feature selection optimization algorithm on the ISIC-2016 dataset (bold refers to best value).
Alg.ModelAccuracyBAF1-ScoreRecallPrecisionTimeNo. of Features
PSODT0.81530.69910.81340.81530.81170.044986
LDA0.85490.74380.85040.85490.84790.0463
SVM0.86280.74880.85730.86280.85510.155
MFODT0.79950.66410.79510.79950.79160.04458
LDA0.85750.74550.85270.85750.85030.0511
SVM0.86280.74370.85640.86280.85440.1232
WOADT0.80740.67910.80380.80740.80080.039556
LDA0.86020.75710.85670.86020.85460.0379
SVM0.85490.74380.85040.85490.84790.148
AODT0.79420.68590.79620.79420.79840.03953
LDA0.86280.73870.85540.86280.85380.0373
SVM0.85750.73040.84990.85750.84780.1196
AHADT0.82850.72740.82810.82850.82760.049260
LDA0.86810.7470.8610.86810.85980.038
SVM0.86280.73370.85440.86280.85330.1225
AHA-AODT0.81790.72080.81930.81790.82070.039852
LDA0.86280.75880.8590.86280.85690.0349
SVM0.87340.76540.86830.87340.86670.1132
Table 5. Classification results of each feature selection optimization algorithm on the PH2 dataset (bold refers to best value).
Alg.ModelAccuracyBAF1-ScoreRecallPrecisionTimeNo. of Features
PSODT0.88930.90480.890.88930.90370.1484326
LDA0.96430.97020.96430.96430.96480.2309
SVM0.96430.97020.96430.96430.96440.1442
MFODT0.91790.91670.91850.91790.92450.0813222
LDA0.96070.96730.96070.96070.96140.1393
SVM0.96430.97020.96430.96430.96440.0947
WOADT0.87860.8690.87940.87860.89910.0927221
LDA0.96790.97320.96790.96790.96810.1445
SVM0.96790.97320.96790.96790.96790.0961
AODT0.91790.92260.91790.91790.92610.0708159
LDA0.96070.96730.96070.96070.9610.1135
SVM0.96430.97020.96430.96430.96430.0764
AHADT0.9250.92560.92510.9250.92930.0602141
LDA0.96430.97020.96430.96430.96430.1095
SVM0.96070.96730.96070.96070.9610.0773
AHA-AODT0.91070.90480.91150.91070.91920.0482107
LDA0.95710.96430.95710.95710.95730.0937
SVM0.9750.97920.9750.9750.9750.0523
Table 6. Classification results of each feature selection optimization algorithm on the Chest-XRay dataset (bold refers to best value).
Alg.ModelAccuracyBAF1-ScoreRecallPrecisionTimeNo. of Features
PSODT0.80130.74870.78750.80130.81770.390979
LDA0.84460.79530.83390.84460.870.1306
SVM0.84780.80040.8380.84780.87060.7182
MFODT0.81410.76410.8020.81410.83070.439191
LDA0.84620.79830.83610.84620.86940.1405
SVM0.85740.81320.84920.85740.87740.7427
WOADT0.82370.77780.81370.82370.83710.416698
LDA0.83970.7880.82780.83970.86850.1709
SVM0.85580.81030.8470.85580.87780.6557
AODT0.81890.77220.80850.81890.83210.41991
LDA0.84460.79440.83360.84460.87180.1464
SVM0.85580.81110.84730.85580.87630.6305
AHADT0.80610.7560.79370.80610.82040.574399
LDA0.8510.80380.84140.8510.87440.1867
SVM0.85420.80810.84510.85420.87670.6737
AHA-AODT0.82690.78120.81710.82690.84090.598196
LDA0.84940.80170.83960.84940.87330.1783
SVM0.86860.82740.86170.86860.88690.6623
Table 7. Classification results of each feature selection optimization algorithm on the Blood-Cell dataset (bold refers to best value).
Alg.ModelAccuracyBAF1-ScoreRecallPrecisionTimeNo. of Features
PSODT0.87330.87330.87640.87330.89782.0821347
LDA0.88380.88370.88590.88380.90531.2637
SVM0.88580.88580.88770.88580.9060.8885
MFODT0.8810.88090.88240.8810.89761.5234225
LDA0.88140.88130.88340.88140.90310.738
SVM0.88380.88380.88590.88380.90550.7944
WOADT0.87780.87770.880.87780.90051.4109226
LDA0.88060.88050.88280.88060.90270.7313
SVM0.88380.88380.88560.88380.90410.7249
AODT0.88060.88050.88220.88060.8980.8553125
LDA0.8790.87890.88110.8790.90140.5041
SVM0.88380.88380.8860.88380.90580.6661
AHADT0.87210.87210.87530.87210.89770.8567132
LDA0.88180.88170.8840.88180.90370.4571
SVM0.88460.88460.88630.88460.90350.53
AHA-AODT0.87490.87490.8770.87490.89560.405365
LDA0.88260.88250.88440.88260.9030.1887
SVM0.88620.88620.88780.88620.90530.2579
Table 8. Comparison with the state-of-the-art methods. The best results for each item are labeled in bold (bold refers to best value).
DatasetModelAccuracy (%)YearRef.
ISIC-2016CUMED85.502016[34]
BL-CNN85.002017[32]
DCNN-FV86.812018[39]
MC-CNN86.302019[40]
MFA86.812020[41]
AHA-AO87.30presentOur
PH2ANN92.502017[60]
Kernel Sparse93.502019[61]
DenseNet201 + SVM92.002020[62]
DenseNet201 + KNN93.162020[63]
ResNet50 + NB95.402021[64]
AHA-AO97.50presentOur
Chest-XRayDCGAN84.192018[65]
DenseNet12186.802021[66]
AHA-AO86.90presentOur
Blood-CellCNN + SVM85.002013[67]
CNN87.082017[68]
CNN + Augmentation87.002019[69]
AHA-AO88.60presentOur
Publisher’s Note: MDPI stays neutral with regard to jurisdictional claims in published maps and institutional affiliations.

