
Application of Deep Learning and Symmetrized Dot Pattern to Detect Surge Arrester Status


Department of Electrical Engineering, National Chin-Yi University of Technology, 57, Sec. 2, Zhongshan Road, Taiping District, Taichung City 41170, Taiwan
*
Author to whom correspondence should be addressed.
Appl. Sci. 2022, 12(2), 650; https://doi.org/10.3390/app12020650
Submission received: 28 November 2021
/
Revised: 6 January 2022
/
Accepted: 7 January 2022
/
Published: 10 January 2022
(This article belongs to the Special Issue Human-Computer Interactions)
Abstract
:Surge arresters primarily restrain lightning and switch surges in the power system to avoid damaging power equipment. When a surge arrester fails, it leads to huge damage to the power equipment. Therefore, this study proposed the application of a convolutional neural network (CNN) combined with a symmetrized dot pattern (SDP) to detect the state of the surge arrester. First, four typical fault types were constructed for the 18 kV surge arrester, including its normal state, aging of the internal valve, internal humidity, and salt damage to the insulation. Then, the partial discharge signal was measured and extracted using a high-speed data acquisition (DAQ) card, while a snowflake map was established by SDP for the features of each fault type. Finally, CNN was used to detect the status of the surge arrester. This study also used a histogram of oriented gradient (HOG) with support vendor machine (SVM), backpropagation neural network (BPNN), and k-nearest neighbors (KNN) for image feature extraction and identification. The result shows that the proposed method had the highest accuracy at 97.9%, followed by 95% for HOG + SVM, 94.6% for HOG + BPNN, and 91.2% for HOG + KNN. Therefore, the proposed method can effectively detect the fault status of surge arresters.
1. Introduction
The main function of metal-oxide surge arresters (MOSAs) is to restrict the voltage across equipment terminals to non-damaging levels when lightning impulse surges are forced on an electrical system. A surge arrester is a protective device for limiting surge voltages on equipment from over-voltage transients caused by lightning or switching events [1]. Facing the threat of lightning and voltage surges in power equipment switches, the protection of power systems is an important guideline of surge arresters [2,3,4,5]. As an index of high-tension equipment insulation deterioration, the partial discharge (PD) phenomenon does not damage equipment immediately, but it will induce insulation breakdown during long-term operation [6,7]. Wanderley Neto et al. [8] proposed using the thermal images generated by infrared thermal imaging to test for abnormal heating spots or regions in the surge arrester and used artificial neural networks (ANN) to analyze surge arrester faults, including sealing problems, internal dampness, and varistor aging. Suwanasri et al. [9] proposed using an acoustic camera to test high-frequency sound waves, and employed artificial intelligence (AI) or AI cloud systems to analyze the PD phenomenon of surge arresters. Amorim et al. [10] proposed using a high frequency current transformer (HFCT) to sense the grounding cable conductor current of a surge arrester to obtain its PD signal, and used the phase resolved partial discharge (PRPD) spectrum to evaluate its state. Das et al. [11] proposed utilizing the leakage current of surge arresters to identify the severity of surface contamination based on cross-stockwell transform and a sparse autoencoder. Metwally et al. [12] proposed an online monitoring method using prony analysis-Hilbert transform based on feature extraction of the frequencies, phase angles, and magnitudes of all frequency components for the surge arrester considering pollution and dry conditions when measuring the total leakage current. Papliński et al. [13] proposed an approach based on the analysis of the harmonic elements distribution and leakage current waveform for an evaluation of the status of gapless surge arresters without the need to examine the arrester interior. The method used the values of mean, maximal, and harmonic elements of surge arrester leakage current regardless of the voltage level of the power network where they were installed. Lira et al. [14] proposed a monitoring method based on the use of self-organizing maps (SOM) artificial neural networks to identify the harmonic features of the total leakage current for a metal-oxide surge arrester. The six fault types, including sealing loss, superficial pollution, varistor degradation, internal humidity, varistors displacement, and non-uniform voltage distribution, were built in the arresters to evaluate the technical capability. According to the results, the identification accuracy of this method had a high ration of almost 98%.
While most studies focus on monitoring surge arresters, little literature has been proposed a surge arrester simulation and detection platform built based on AI. Therefore, this study constructed surge arrester fault models based on the normal state and three common fault types, including aging of the internal valve, internal humidity, and salt damage to the insulation. This study built an intelligent deep learning method detection system for surge arresters based on discrete wavelet transform (DWT) and symmetrized dot pattern (SDP) combined with CNN for identifying surge arrester PD faults, and used 240 test data to evaluate the performance. Data were measured utilizing an NI PXI high-speed data acquisition (DAQ) instrument. The proposed surge arrester fault feature learning model was expected to identify fault types so that early maintenance could be taken to avoid accidents. The method proposed in this paper was compared with conventional machine learning methods, such as support vector machine (SVM) [15], back propagation neural network (BPNN) [16], and k-nearest neighbors (KNN) [17]. First, the histogram of oriented gradient (HOG) was applied to extract features of the image. Second, the features extracted from the image were input to the conventional machine learning methods for identification [18,19]. The result showed that the method proposed in this paper could effectively test for various faults in the surge arrester of PD.
This paper is organized as follows: Section 2 describes the surge arrester fault construction, and the partial discharge signal acquisition is presented in Section 3. Section 4 introduces the proposed fault diagnosis algorithm in detail. Section 5 presents simulation results, while the conclusions and suggested directions for future work are presented in Section 6.
2. Surge Arrester Fault Construction
In this study, four common surge arrester fault models (Type 1 is the normal state, Type 2 is aging of the internal valve, Type 3 is internal humidity, and Type 4 is salt damage to the insulation) were built for a surge arrester with a rated voltage of 18 kV. The PD phenomenon of surge arresters induced by different faults was discussed. The surge arrester fault models built in this study are described below:
2.1. Normal State (Type 1)
The Type 1 surge arrester model built for this paper is shown in Figure 1, which shows the supply side connecting terminal (line terminal), porcelain bushing (porcelain insulator), varistors made of ZnO (ZnO element), spring, gap tube, and ground side connecting terminal (earthing terminal) of the surge arrester. The construction specifications were complied with before the operation of the surge arrester to avoid endangering the power system and to ensure work safety.
2.2. Aging of the Internal Valve (Type 2)
With the good nonlinear VI characteristics of ZnO varistors, the current flowing through a surge arrester under a normal working voltage is very low. When the power system is impacted by overvoltage, the resistance drops suddenly, and the energy of the overvoltage is released to protect the power system. However, under the effect of a long-term operating voltage, the characteristics of a varistor may change. If the electric field distribution is nonuniform, the varistor may consume too much power under a normal working voltage, leading to local varistor aging and causing the surge arrester to generate the PD phenomenon. The surge arrester valve plate aging fault model built for this paper is shown in Figure 2.
2.3. Internal Humidity (Type 3)
In the surge arrester manufacturing process, if the manufacturing quality is insufficient, inducing defective rubber ring sealing inside the surge arrester, aging of the surge arrester occurs during long-term operation. If the seal assembly is deformed, the surge arrester may become damp inside. Running at a working voltage may result in a nonuniform distribution of the internal electric field and cause the surge arrester to generate the PD phenomenon. The internal dampness fault model of the surge arrester built for this paper is shown in Figure 3.
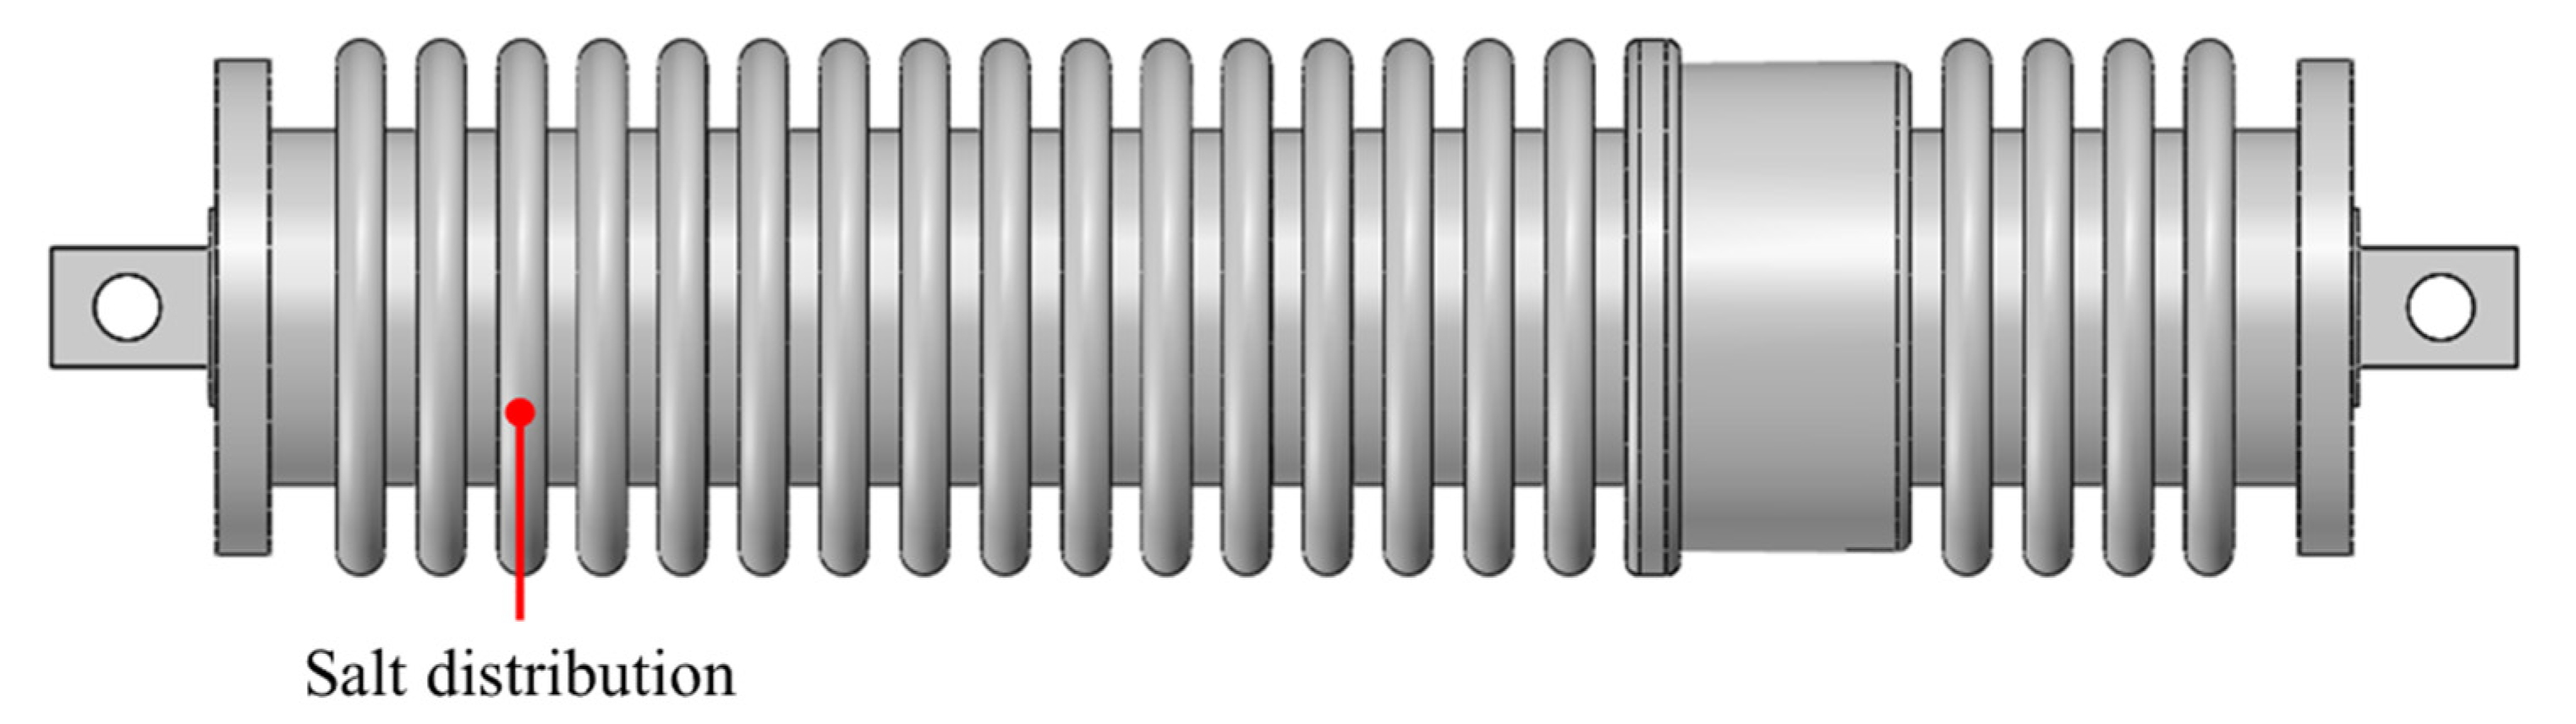
2.4. Salt Damage to the Insulation (Type 4)
If a surge arrester is installed near the sea, saline matter adheres to the ceramic insulator of the surge arrester gradually over time. As long as the surge arrester insulator is cleaned periodically during operation, the salt adhesion amount is insufficient to influence its operation. However, during long-term operation, after a certain adhesion amount is reached, the ceramic insulator of the surge arrester affects its function by changing the electric field distribution and generating the PD phenomenon. Brine was prepared according to IEEE Standard C62.11-2020 [1] by mixing clear water with NaCl in a ratio of 1 kg/m3 and poured on the ceramic insulator of a surge arrester to build salt damage to the ceramic insulator (arrester defect construction) in this study. The fault model of salt damage to the ceramic insulator of the surge arrester is shown in Figure 4.
3. Partial Discharge Signal Acquisition
For the PD signal acquisition, an autotransformer was used to implement voltage regulation for a high tension molded potential transformer. The high tension side was connected to the power supply terminal of a surge arrester and an HFCT was connected to the ground terminal of a surge arrester, so as to detect the current pulse signal in the ground wire of the surge arrester. A high-speed data acquisition card was used to receive the signal from the HFCT, after which the detection system performed an online analysis.
The PD of the surge arrester fault model was tested on a testing platform, so as to analyze the differences among the PD phenomena generated by different faults. The testing platform is shown in Figure 5. The bandwidth of the HFCT ranged from 1 MHz to 60 MHz. The sampling rate of the NI PXI-5105 high-speed data capture card was 20 MS/s. The PD signal and data of the surge arrester were uploaded to LabVIEW for analysis and storage.
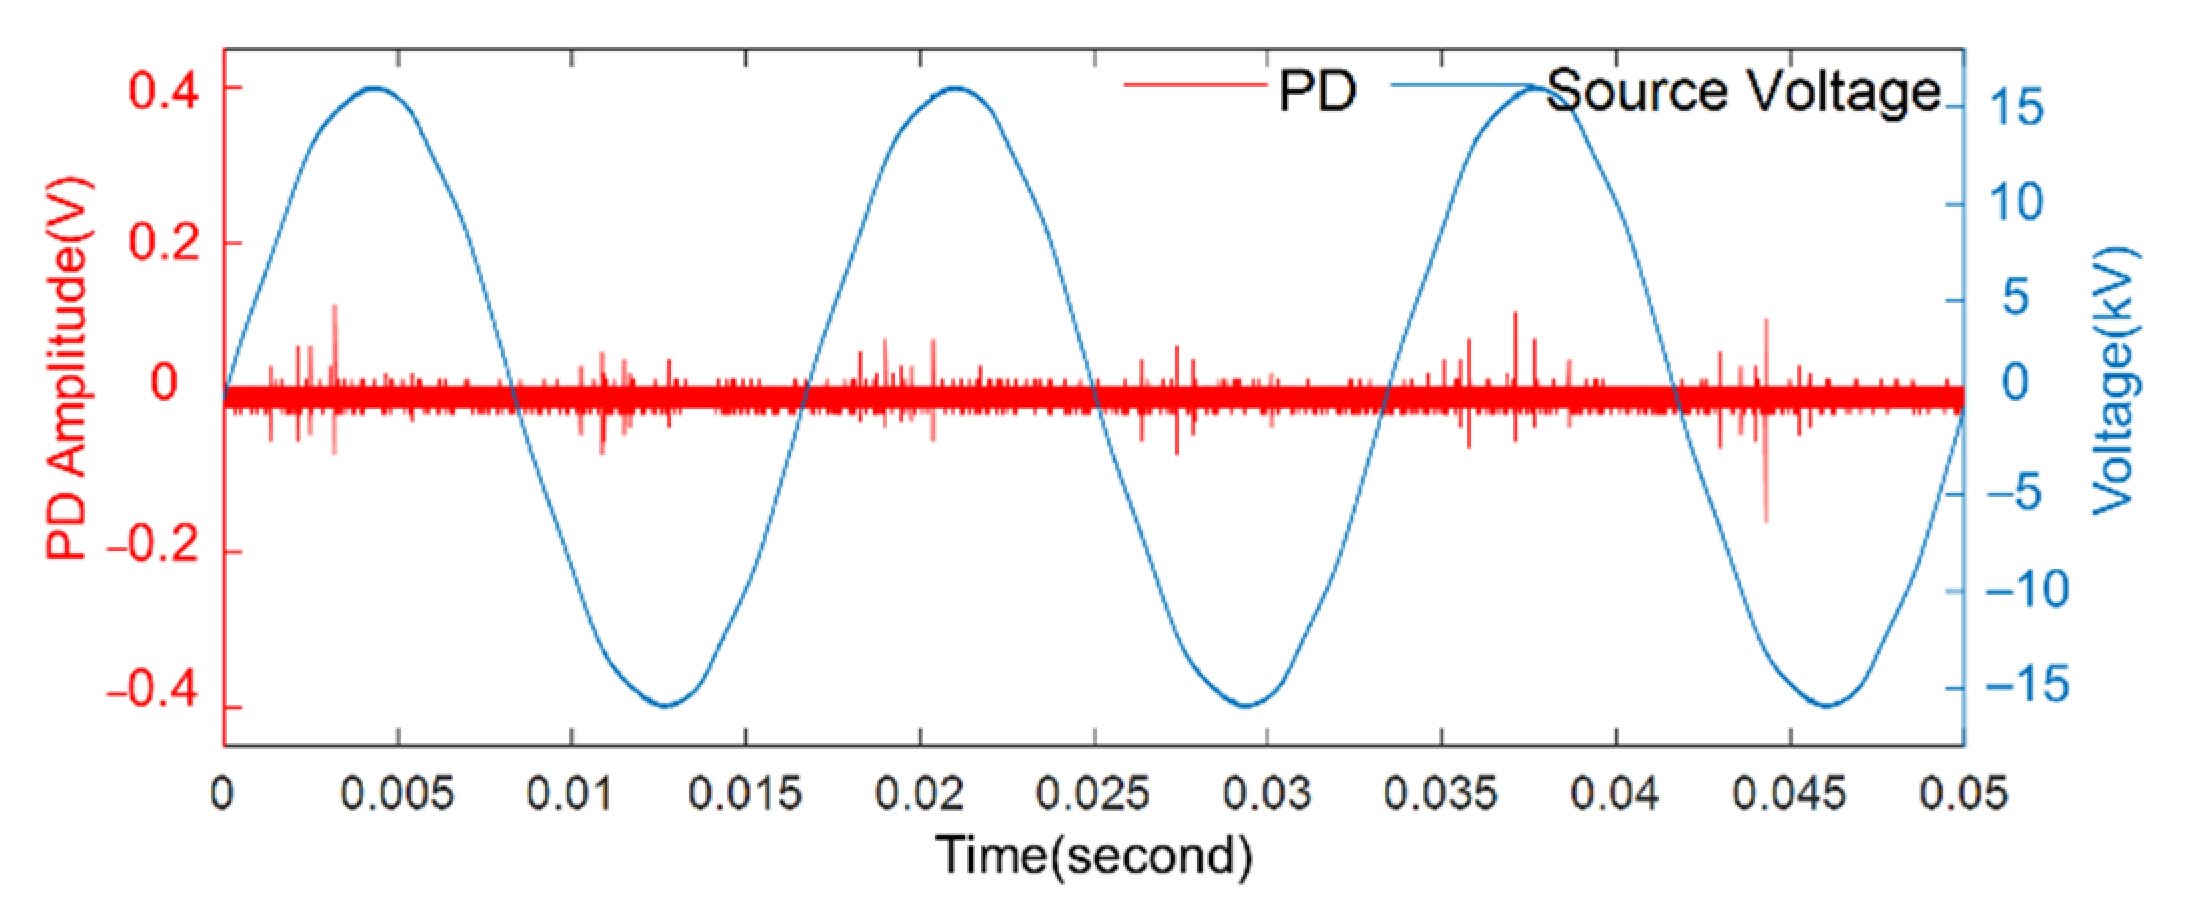
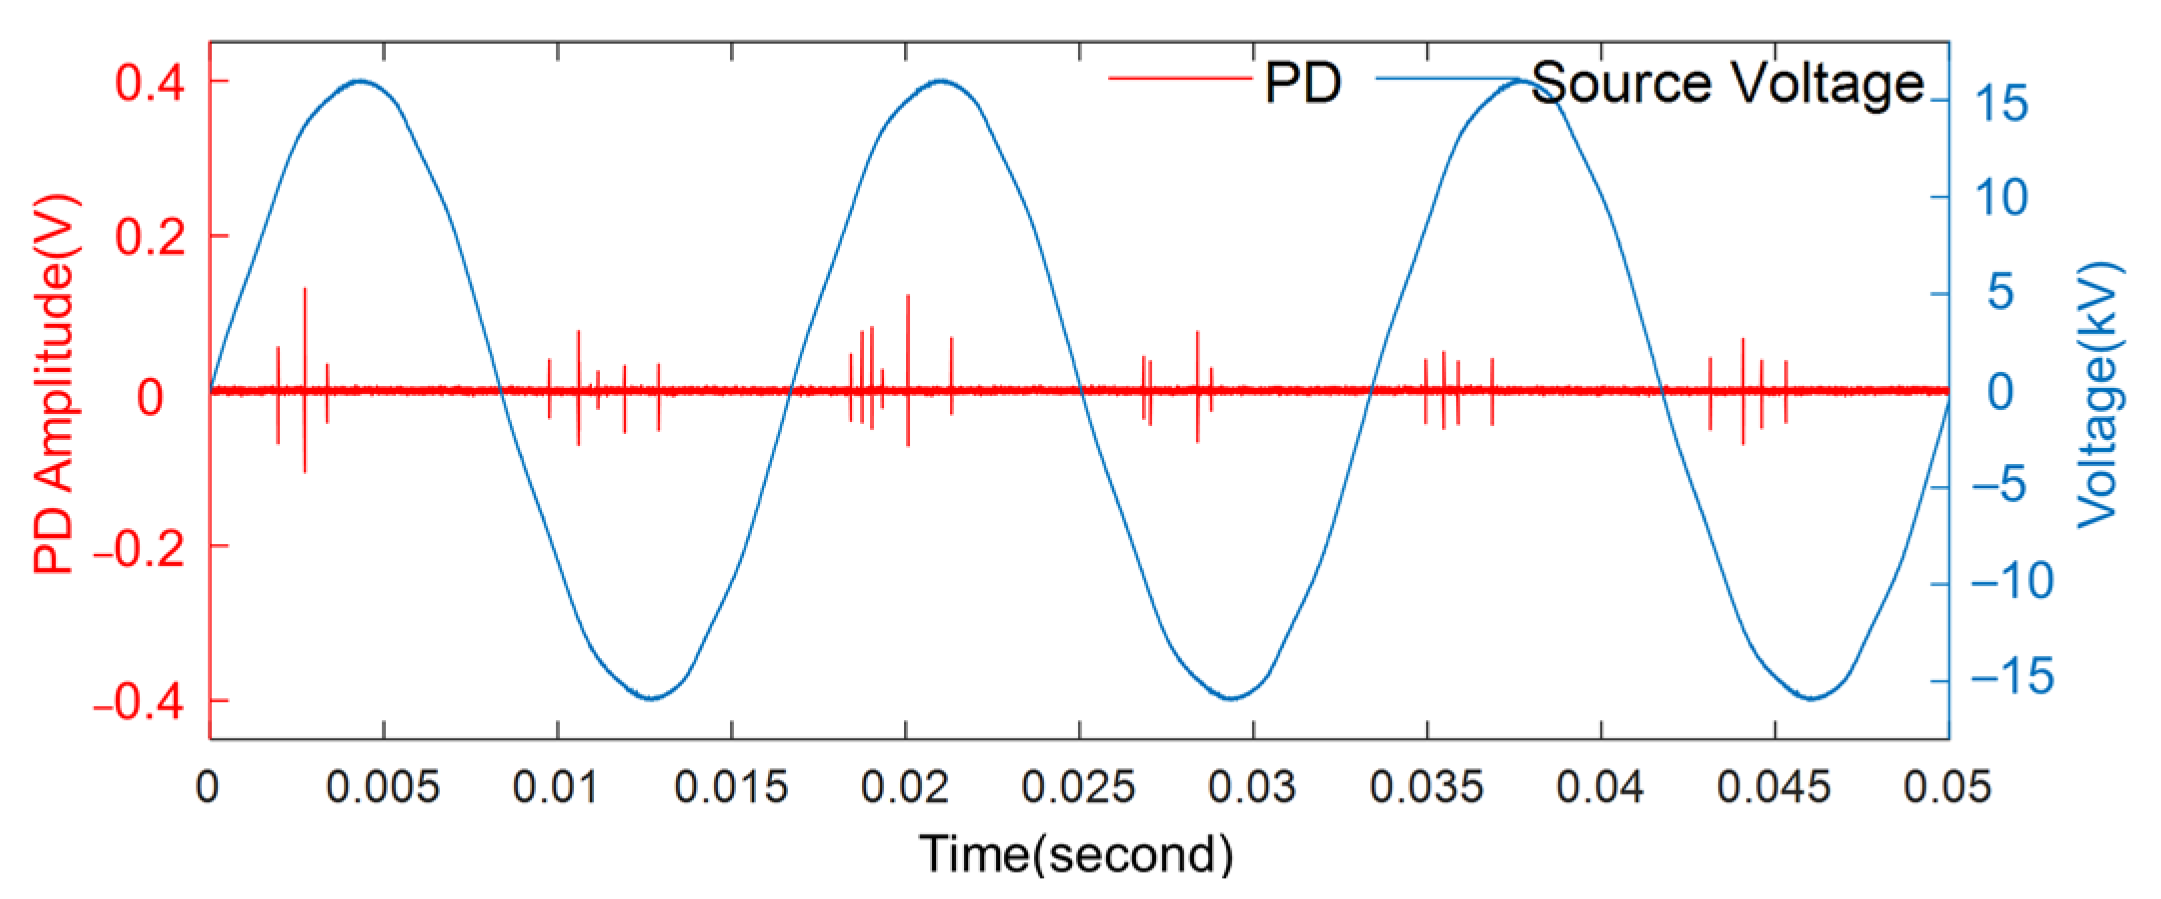
The detected PD signals are shown in Figure 6, Figure 7, Figure 8 and Figure 9. Figure 6 shows the PD signal of a normal surge arrester, Figure 7 shows the PD signal of a surge arrester valve plate after aging, Figure 8 shows the PD signal of a surge arrester with internal dampness, and Figure 9 shows the PD signal of salt damage to the ceramic insulator of a surge arrester. The surge arrester PD signals were based on three cycles of a 60 Hz power supply with a sampling time of 50 ms and a data length of one million points.
As Type 1 was the surge arrester in a normal state, its discharge signal was only background noise. The discharge positions of Type 2 were approximately distributed over the positive and negative half-cycles of the power supply. The number of discharges was smaller than that of the other faults, but the voltage amplitude was larger. The discharge positions of Type 3 were approximately distributed over the positive and negative half-cycles of the power supply, and the positive half-cycle had a larger number of discharges. The discharge positions of Type 4 were distributed over the positive and negative half-cycles, and the voltage amplitude was lower.
4. Methodology
To test the fault type of the surge arrester, this study used discrete wavelet transform (DWT) to filter the surge arrester’s PD signal detected by HFCT. A snowflake-like symmetric image was drawn by SDP and then used as the feature pattern for training and identification by CNN. The PD flow chart is shown in Figure 10.
4.1. Discrete Wavelet Transform
DWT was first proposed by French scholars Morlet and Grossmann in their geologic data analysis in the early 1980s [20]. They found that the conventional Fourier transform could not obtain ideal results; thus, the wavelet concept was imported into the signal analysis. In comparison to Fourier transform or short time span Fourier transform, wavelet transform has multi-resolution characteristics. Therefore, transient signals and non-stationary signals can be detected effectively by using the high flexibility of wavelet transform in local time-frequency analyses.
The basis function of wavelet transformation is derived from a mother wavelet function ψ(t) (mother wavelet) with the compression or expansion of the scale parameter a (scale parameter), and the translation parameter b (shifted parameter) along time. The function of a is to compress or expand the mother wavelet function, and b represents the time when the mother wavelet function moves along the time axis. The basis function can be expressed as (1) [21]:
Using (1) continuous wavelet transform (CWT), the scale parameter a, and the translation parameter b of the CWT, the discrete wavelet transform can be obtained. When (a, b) are discrete values, , , where m and n are integers, , DWT can be expressed as (2):
where the discrete mother wavelet function m,n(t) is:
If a0 = 2, it is called a dyadic wavelet, and (3) can be expressed as:
As long as m is adjusted appropriately, the detailed or approximate analysis of the signal will be available. The discrete wavelet can be expressed as:
where is the wavelet transform coefficient value of signal ; and n is the operation index. The symbols and acronyms used in this section are presented in Table 1. Figure 11, Figure 12, Figure 13, and Figure 14 show the surge arrester’s PD signals after DWT.
4.2. Symmetrized Dot Pattern
For the PD phenomenon of surge arresters in the time domain waveform, it is difficult to directly identify different types of faults. Therefore, this study used the SDP method to map the PD signal of the surge arrester from the time domain waveform to the polar diagram. A snowflake-like symmetrical image (also known as a snowflake pattern) was drawn, and the image showed different snowflake petal patterns according to the variation of the signal waveform amplitude value and frequency value. This image was imported as a feature pattern into the CNN for image recognition.
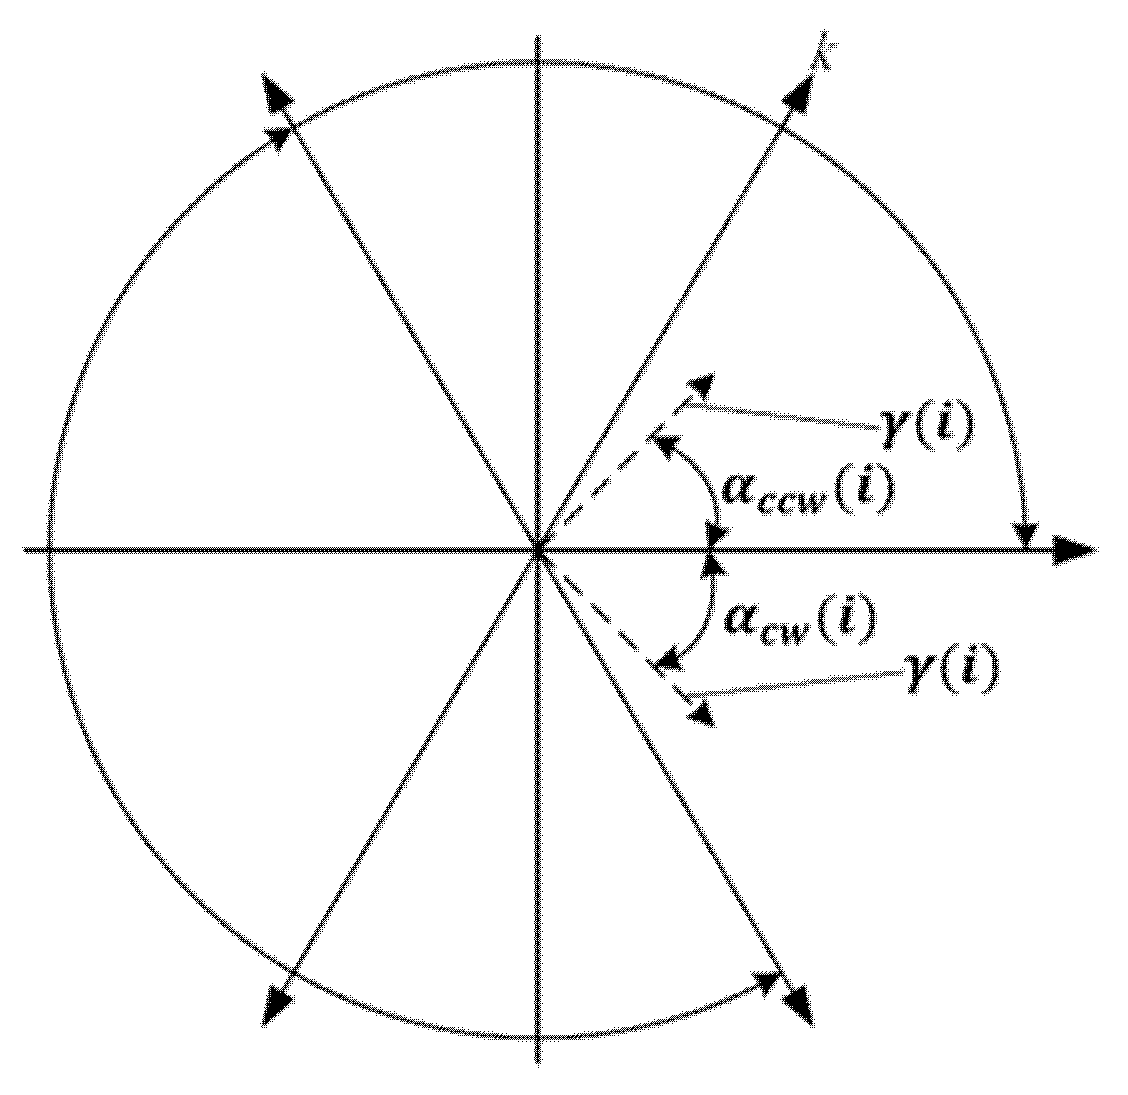
The SDP directly transformed the surge arrester’s PD signal from the time domain waveform into the polar diagram. A schematic diagram is shown in Figure 15 [22,23], where is the polar coordinate radius, is the clockwise rotation angle of the initial line, and is the counterclockwise rotation angle of the initial line. In the discrete sampling data sequence of the vibration signals, if the vibration value of time is , the vibration value at time will be . When this value is substituted in (6) to (8), the point in the transformed polar coordinate space is , and the vibration signals can be generated by changing the initial rotation angle to form the SDP.
where is the minimum value of vibration value; is the maximum value of the vibration value; is the time interval (range value 1–10); is the initial rotation angle; and is the magnification of the rotation angle (generally smaller than the value of ψ). According to the test result, the feature extraction parameter values suitable for surge arrester fault prediction were = 60°, = 3, = 30. The symbols and acronyms used in this section are presented in Table 2.
4.3. Convolutional Neural Networks
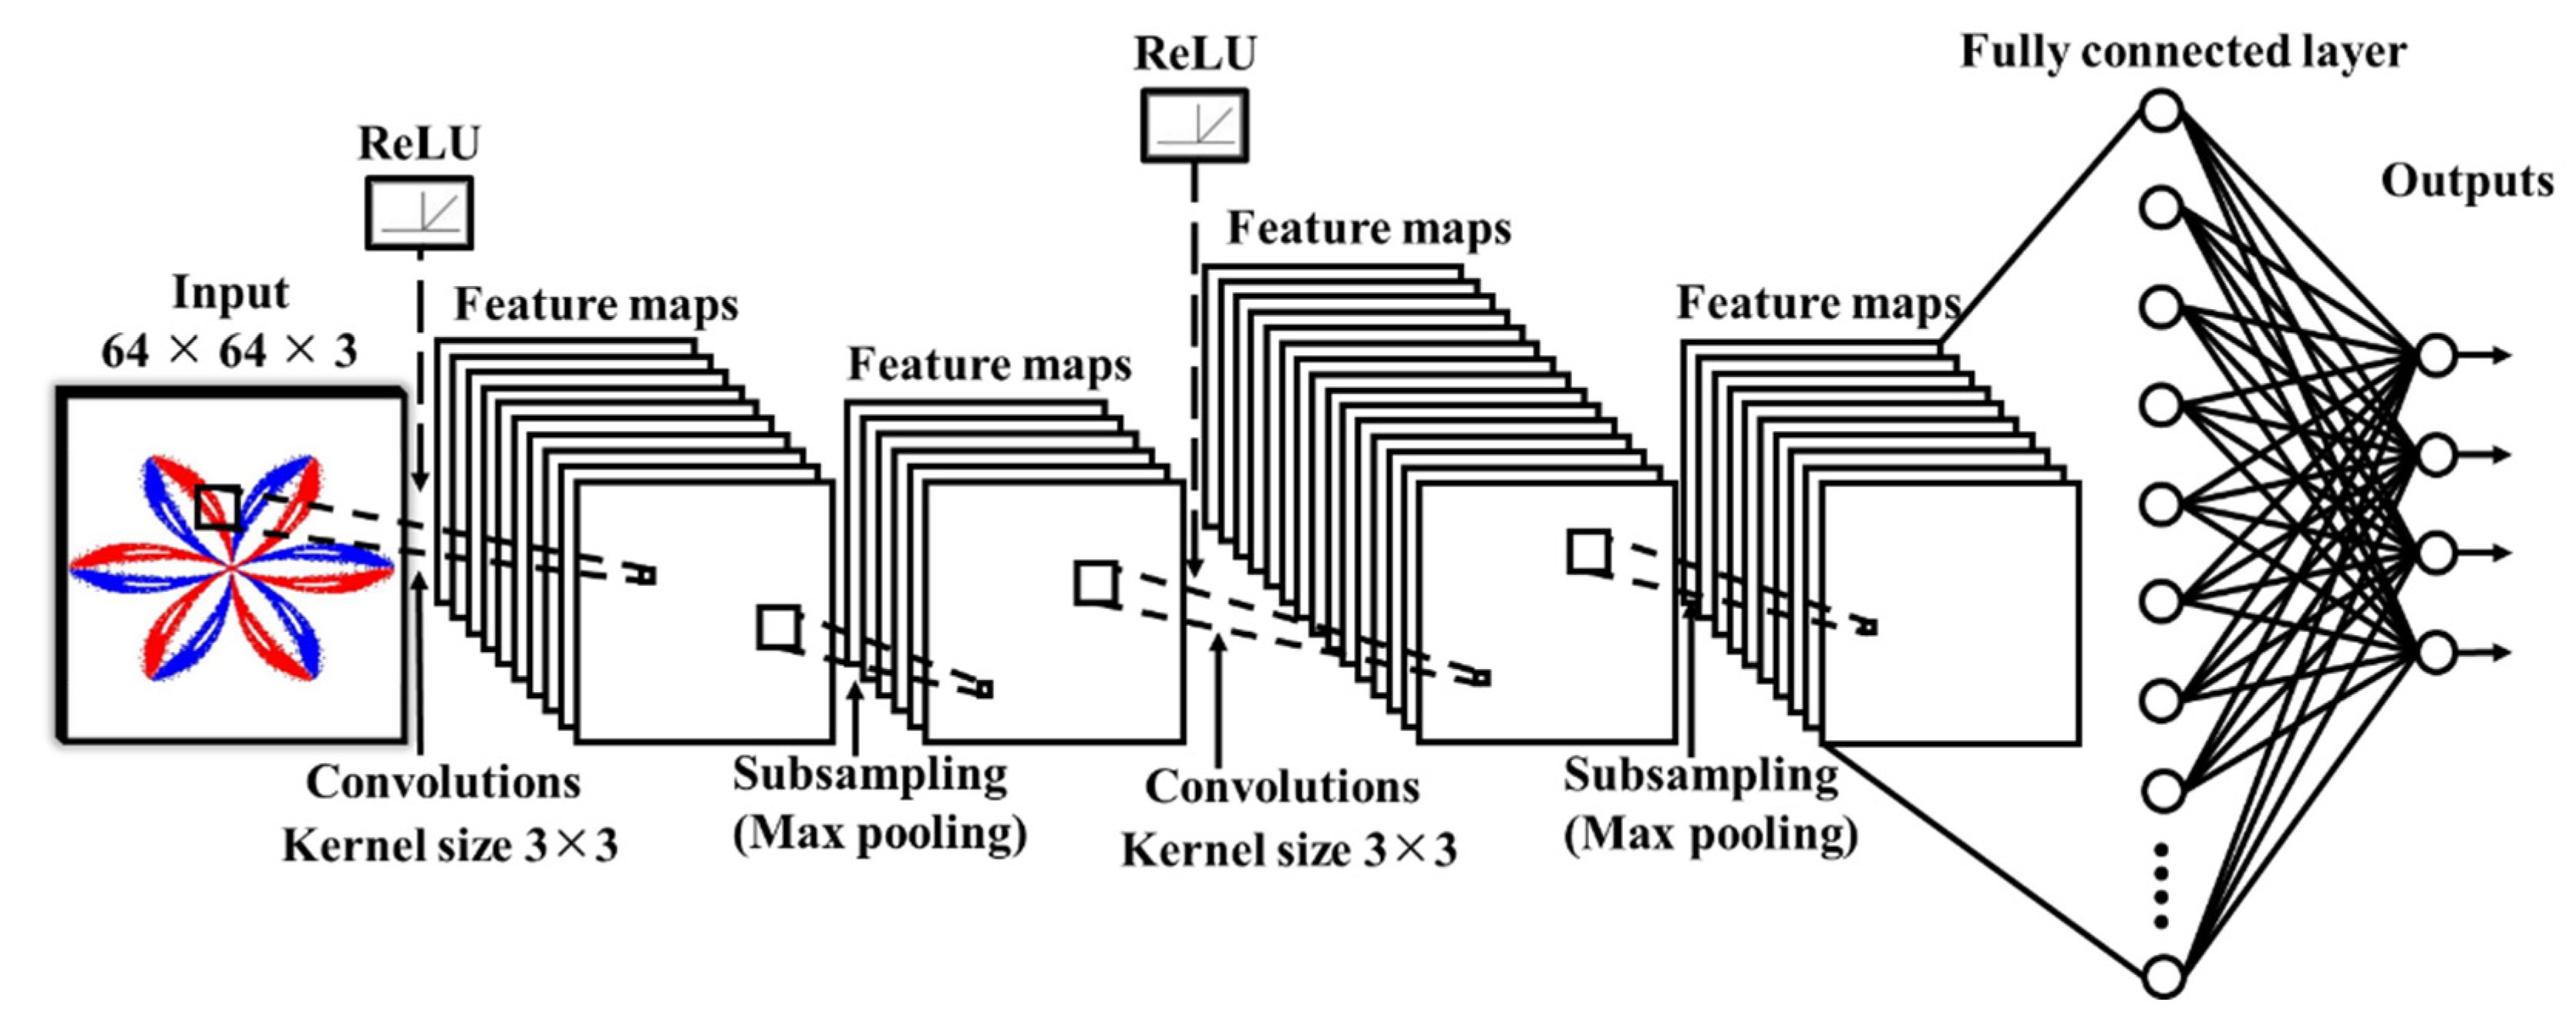
In recent years, CNN has been extensively used for signal processing and image classification in areas such as face recognition [24], imaging medicine [25], and fault diagnosis [26], and there have been good effects in these applications. This study used CNN to identify the SDP of surge arrester fault states. The image format was an RGB image with a size of 64 × 64 pixels. The CNN model architecture designed for surge arrester fault type recognition is shown in Figure 16. The architecture comprised two convolution layers, two pooling layers, one fully connected layer, and the ReLu activation function.
4.3.1. Convolutional Layer
The convolution layer was used for feature extraction. The convolution operation was performed by different convolution kernels or filters, and the image features were extracted or enhanced based on the concept of spatial filtering. A 3 × 3 convolution kernel performed the convolution operation on a 7 × 7 image and each stride was one step. This process continued until all the pixels of the original input image were completed by the inner product of the mask to obtain a feature map. The convolution operation process is shown in Figure 17.
4.3.2. Pooling Layer
After the image feature was obtained by the convolution layer, in order to effectively reduce the image feature size and minimize the effect on the feature value, the extracted feature was put in the pooling layer to reduce the overall network computation complexity and allow the information after pooling to further concentrate on whether there were coincident features in the image. The general pooling methods include max pooling and average pooling. Figure 18 shows the operation mode of the pooling layer.
4.3.3. Fully Connected Layer
The architecture of the fully connected layer was a neural network composed of a flatten layer, a hidden layer, and an output layer. It obtained the results of the convolution and pooling processes, and then modified the error between input and output by back propagation. Finally, the image was predicted and classified by the results. The structure of the fully connected layer is shown in Figure 19.
4.3.4. Activation Layer
The major function of an activation layer is to enhance the nonlinear separability of a network. Common activation functions include the sigmoid, TanHyperbolic (tanh), ReLu and leaky ReLU functions [27]. This study used the ReLU function as the activation function of the CNN, as it performed better than the other functions at increasing the training speed of the CNN [28] and did not influence the generalization accuracy of the model. The ReLU function is expressed as (9), where 𝑥 is the output of the previous neuron.
5. Experimental Result
There were 840 items of surge arrester PD data extracted in this paper, including 210 data items for each of the four surge arrester fault types. After SDP, each type had 210 SDP diagrams, of which 150 images were taken as training samples and 60 were taken as test samples for CNN recognition.
5.1. Symmetrized Dot Pattern Result
The SDP formula shows that the position of the midpoint of the polar coordinates is the focus of the algorithm. If the high frequency is the main component in the signal, the difference between the initial point and the next point in the time domain waveform is high, and the corresponding point in the polar coordinates represented by SDP will have a larger radius and smaller deflection angle and vice versa. Figure 20, Figure 21, Figure 22 and Figure 23 show the SDP diagrams of the different fault types drawn using SDP. When the PD signal of the surge arrester was transformed from a time domain into a polar diagram, a more severe PD signal resulted in a pattern that was less like a snowflake. The PD signals of the different fault types were very different; therefore, this paper used CNN for training and recognition based on the forenamed characteristic. Since the original waveforms of valve aging and internal humidity were quite different from the normal shape, after the waveform was converted into an SDP graph, the graphs were also quite different, as shown in Figure 21 and Figure 22. The original waveform of the salt damage of the ceramic barrier was slightly different from the normal shape. After getting converted, some of the graphics were observed to be similar to the normal shape, but the differences could also be observed, as shown in Figure 23.
5.2. Convolutional Neural Network Fault Recognition
The CNN model designed in this paper had two convolution layers, two pooling layers, one fully connected layer, a 3 × 3 convolution kernel, and the ReLu activation function. The test environment was MATLAB R2021a, an Intel Core (TM) i5-10400 CPU with a 2.90 GHz processor, an NVIDIA GeForce RTX 3060 graphic card, and the Windows professional 64-bit operating system. The CNN model designed in this paper used the SDP diagrams of surge arresters as recognition samples. There were 600 SDP diagrams used for training the CNN model, and each fault had 150 samples. To validate the effectiveness of the CNN model in identifying the fault types in the surge arresters, 240 SDP diagrams were used for the test, and each fault had 60 samples. According to the result shown in Table 3, the method could effectively classify different fault types of surge arresters and the recognition accuracy rate was 97.9% including normal (93.3%), aging (100%), internal humidity (100%), and salt damage (98.3%).
The detection methods for image recognition in CNN and conventional machine learning were compared for their performance in identifying the surge arrester fault types, and the result is shown in Table 4. In terms of the training time, the conventional HOG + SVM and HOG + KNN methods only spent 5 s and 3 s on model training, respectively. The HOG + BPNN method required 121 s for training, making it the most time-consuming of all the detection methods. CNN spent 22 s on training. Although CNN was not the fastest among the four detection methods, its recognition accuracy was 97.9%, which was the highest among the four detection methods, followed by 95% for HOG + SVM and 94.6% for HOG + BPNN. The HOG + KNN method had the lowest accuracy at 91.2%.
6. Conclusions
This paper proposed the SDP + CNN method for surge arrester fault recognition. Four common fault types for surge arresters were established in this paper. The PD signals of the surge arrester were transformed by SDP from the time domain waveform into SDP diagrams for use as fault diagnosis samples and imported into the trained CNN model for recognition. The proposed method was compared to conventional HOG + SVM, HOG + BPNN, and HOG + KNN. The HOG + SVM and HOG + KNN methods only spent 1.7 s and 0.3 s on training, respectively, but the test time required 5 s and 3 s, and their respective recognition accuracies were 95% and 91.2%. The training time of HOG + BPNN was 121 s, which was the most time-consuming among the four detection methods, but the test time was only 0.35 s, and the recognition accuracy was 94.6%. The recognition accuracy of the proposed method in this paper was as high as 97.9% and the test required 0.46 s. By comparing the identification accuracy of the HOG + SVM, HOG + BPNN, and HOG + KNN, the proposed (SDP + CNN) method was found to exhibit a good accuracy of up to 97.9%, indicating that it can be applied for effective fault diagnosis of surge arresters. In the future, the proposed approach could also be applied in other high-voltage electric power and energy-related fields, such as generators, power capacitors, power cables, etc.
Author Contributions
Contributions: M.-H.W. conceived the presented idea, designed, and experimented with this work; S.-D.L. supervised, planned the experiments, and wrote this article; C.-C.H. performed and validated the numerical simulations; all authors provided critical feedback and helped shape the research, analysis, and manuscript. All authors have read and agreed to the published version of the manuscript.
Funding
This research was funded by the Ministry of Science and Technology of Taiwan, under contract numbers: MOST 110-2221-E-167-006 and MOST 110-2221-E-167-025.
Conflicts of Interest
The authors declare no conflict of interest.
References
- IEEE C62.11-2020. IEEE Standard for Metal-Oxide Surge Arresters for AC Power Circuits (>1 kV); IEEE: New York, NY, USA, 2020. [Google Scholar]
- Sabiha, N.A. Limiting surge arrester failure under direct lightning strokes for attaining service continuity of distribution networks. IET Gener. Transm. Distrib. 2020, 14, 4796–4804. [Google Scholar] [CrossRef]
- Massimo, B.; Federico, D.; Renato, P.; Mansueto, R.; Farhad, R. Evaluation of Power System Lightning Performance—Part II: Application to an Overhead Distribution Network. IEEE Trans. Electromagn. Compat. 2017, 59, 146–153. [Google Scholar]
- Khodsuz, M.; Mirzaie, M.; Seyyedbarzegar, S.M. Metal oxide surge arrester condition monitoring based on analysis of leakage current components. Int. J. Electr. Power Energy Syst. 2015, 66, 188–193. [Google Scholar] [CrossRef]
- Khodsuz, M.; Mirzaie, M. Evaluation of ultraviolet ageing, pollution and varistor degradation effects on harmonic contents of surge arrester leakage current. IET Sci. Meas. Technol. 2015, 9, 979–986. [Google Scholar] [CrossRef]
- Rodrigues, T.B.; Amorim, H.P.; Tanscheit, R.; Vellasco, M. Automatic Evaluation of Partial Discharges Presence in Surge Arresters and Current Transformers Installed in Substations Without Equipment Shutdown. In Proceedings of the 2020 IEEE 3rd International Conference on Dielectrics (ICD), Valencia, Spain, 5–31 July 2020. [Google Scholar]
- Da Silva, D.A.; de Jesus, R.C.; Pissolato, J.; Lahti, K. Partial discharge activity in distribution MOSAs due to internal moisture. In Proceedings of the 2015 International Symposium on Lightning Protection (XIII SIPDA), Balneario Camboriu, Brazil, 28 September–2 October 2015. [Google Scholar]
- Wanderley Neto, E.T.; da Costa, E.G.; Maia, M.J.A. Artificial Neural Networks Used for ZnO Arresters Diagnosis. IEEE Trans. Power Deliv. 2009, 24, 1390–1395. [Google Scholar] [CrossRef]
- Suwanasri, S.; Khetcharoen, W.; Suwanasri, T.; Panmala, N.; Rungsivattagapong, S.; Atiwet, N.; Poonpoch, P. Partial Discharge Investigation and Failure Analysis on Distribution Network Using Acoustic Camera. In Proceedings of the 2021 9th International Electrical Engineering Congress (iEECON), Pattaya, Thailand, 10–12 March 2021. [Google Scholar]
- Amorim, H.P.; Carvalho, A.T.D.; Rodrigues, T.B.; Borges, J.B.S.; de C. Cunha, C.F.F. Experience with on-line insulation diagnostics of surge arresters by PD measurement in the field. In Proceedings of the 2016 IEEE International Conference on Dielectrics (ICD), Montpellier, France, 3–7 July 2016. [Google Scholar]
- Das, A.K.; Dalai, S.; Chatterjee, B. Deep learning–based surface contamination severity prediction of metal oxide surge arrester in power system. IET Sci. Meas. Technol. 2021, 15, 376–384. [Google Scholar] [CrossRef]
- Metwally, I.A.; Eladawy, M.; Feilat, E.A. Online Condition Monitoring of Surge Arresters Based on Third-Harmonic Analysis of Leakage Current. IEEE Trans. Dielectr. Electr. Insul. 2017, 24, 2274–2281. [Google Scholar] [CrossRef]
- Papliński, P.; Wańkowicz, J. Application of leakage current parameters for technical diagnostics of surge arresters. IEEE Trans. Dielectr. Electr. Insul. 2016, 23, 3458–3465. [Google Scholar] [CrossRef]
- Lira, G.R.S.; Costa, E.G.; Ferreira, T.V. Metal-oxide surge arrester monitoring and diagnosis by self-organizing maps. Electr. Power Syst. Res. 2014, 108, 315–321. [Google Scholar] [CrossRef]
- Khodsuz, M.; Mirzaie, M. Monitoring and identification of metal–oxide surge arrester conditions using multi-layer support vector machine. IET Gener. Transm. Distrib. 2015, 9, 2501–2508. [Google Scholar] [CrossRef]
- Liu, Z.; Sun, H. Fault Diagnosis Using Neural Networks for Parallel Shaft Gearboxes and Discussion on Its Generalization Ability. In Proceedings of the 2020 IEEE 9th Data Driven Control and Learning Systems Conference (DDCLS), Liuzhou, China, 20–22 November 2020. [Google Scholar]
- Jayaganthan, S.; Guvvala, N.; Ramanujam, S. Identification and Classification of Incipient Discharges in GIS Adopting Machine Learning Techniques. In Proceedings of the 2021 IEEE International Conference on the Properties and Applications of Dielectric Materials (ICPADM), Johor Bahru, Malaysia, 12–14 July 2021. [Google Scholar]
- Awais, M.; Iqbal, M.J.; Ahmad, I.; Alassafi, M.O.; Alghamdi, R.; Basheri, M.; Waqas, M. Real-Time Surveillance Through Face Recognition Using HOG and Feedforward Neural Networks. IEEE Access 2019, 7, 121236–121244. [Google Scholar] [CrossRef]
- Pan, X. Fusing HOG and convolutional neural network spatial–temporal features for video-based facial expression recognition. IET Image Proc. 2020, 14, 176–182. [Google Scholar] [CrossRef]
- Papadhopulli, I.; Cico, B. Implementation in FPGA of 3d discrete wavelet transform for imaging noise removal. In ICT Innovations 2012; Markovski, S., Gusev, M., Eds.; Springer: Berlin/Heidelberg, Germany, 2012; Volume 207, pp. 363–372. [Google Scholar]
- Suryavanshi, H.; Velandy, J.; Sakthivel, M. Wavelet Power Ratio Signature Spectrum Analysis for Prediction of Winding Insulation Defects in Transformer and Shunt Reactor. IEEE Trans. Dielectr. Electr. Insul. 2017, 24, 2649–2659. [Google Scholar] [CrossRef]
- Wang, S.; Liu, H.; Xu, X. Fan fault diagnosis based on symmetrized dot pattern and improved BP neural network. In Proceedings of the 2016 3rd International Conference on Materials Engineering, Manufacturing Technology and Control, Taiyuan, China, 27–28 February 2016. [Google Scholar]
- González, J.; Oro, J.M.F.; Delgado, L.; Méndez, D.; Argüelles, K.M.; Sandra, V.S.; Rodríguez, D. Symmetrized dot pattern analysis for the unsteady vibration state in a Sirocco fan unit. Appl. Acoust. 2019, 152, 1–12. [Google Scholar] [CrossRef]
- Ranjan, R.; Bansal, A.; Zheng, J.; Xu, H.; Gleason, J.; Lu, B.; Nanduri, A.; Chen, J.C.; Castillo, C.D.; Chellappa, R. A fast and accurate system for face detection, identification, and verification. IEEE Trans. Biom. Behav. Identity Sci. 2019, 1, 82–96. [Google Scholar] [CrossRef] [Green Version]
- Pereira, S.; Pinto, A.; Alves, V.; Silva, C.A. Brain Tumor Segmentation Using Convolutional Neural Networks in MRI Images. IEEE Trans. Med. Imaging 2016, 35, 1240–1251. [Google Scholar] [CrossRef] [PubMed]
- Liu, R.; Meng, G.; Yang, B.; Sun, C.; Chen, X. Dislocated Time Series Convolutional Neural Architecture: An Intelligent Fault Diagnosis Approach for Electric Machine. IEEE Trans. Ind. Inf. 2017, 13, 1310–1320. [Google Scholar] [CrossRef]
- Lau, M.M.; Lim, K.H. Review of Adaptive Activation Function in Deep Neural Network. In Proceedings of the 2018 IEEE-EMBS Conference on Biomedical Engineering and Sciences (IECBES), Sarawak, Malaysia, 3–6 December 2018. [Google Scholar]
- Wang, Y.; Li, Y.; Rong, X. The Influence of the Activation Function in a Convolution Neural Network Model of Facial Expression Recognition. Appl. Sci. 2020, 10, 1897. [Google Scholar] [CrossRef] [Green Version]
Figure 1.
Model of normal surge arrester.

Figure 2.
Surge arrester valve plate aging fault model.

Figure 3.
Internal dampness fault model of a surge arrester.

Figure 4.
Fault model of salt damage to the ceramic insulator of a surge arrester.

Figure 5.
Surge arrester testing platform.

Figure 6.
PD signal of a normal surge arrester (Type 1).

Figure 7.
PD signal of a surge arrester valve plate after aging (Type 2).

Figure 8.
PD signal of a surge arrester with internal dampness (Type 3).

Figure 9.
PD signal of salt damage to the ceramic insulator of a surge arrester (Type 4).

Figure 10.
PD detection flow chart.

Figure 11.
PD signal of a normal surge arrester after filtering.

Figure 12.
PD signal of a surge arrester valve plate with aging after filtering.

Figure 13.
PD signal of a surge arrester with internal dampness after filtering.

Figure 14.
PD signal of salt damage to the ceramic insulator of a surge arrester after filtering.

Figure 15.
Schematic diagram of SDP.

Figure 16.
CNN architecture designed in this paper.

Figure 17.
Schematic diagram of the convolution operation process.

Figure 18.
Schematic diagram of the pooling computing process.

Figure 19.
Model architecture for fully connected layer.

Figure 20.
SDP diagram of a normal surge arrester (Type 1).

Figure 21.
SDP diagram of a surge arrester valve plate after aging (Type 2).

Figure 22.
SDP diagram of a surge arrester with internal dampness (Type 3).

Figure 23.
SDP diagram of salt damage to the ceramic insulator of a surge arrester (Type 4).


Table 1.
Symbols and acronyms of Section 4.1.
Table 1.
Symbols and acronyms of Section 4.1.
| Acronyms | Definition |
|---|---|
| DWT | Discrete wavelet transform |
| CWT | Continuous wavelet transform |
| Symbols | |
| Mother wavelet | |
| Scale parameter | |
| Shifted parameter |
Table 2.
Symbols and acronyms used in Section 4.2.
Table 2.
Symbols and acronyms used in Section 4.2.
| Acronyms | Definition |
|---|---|
| PD | Partial discharge |
| SDP | Symmetrized dot pattern |
| CNN | Convolutional neural network |
| Symbols | |
| Polar coordinate radius | |
| The clockwise rotation angle of the initial line | |
| The counterclockwise rotation angle of the initial line | |
| The maximum value of the vibration value | |
| The minimum value of the vibration value | |
| Time interval (range value 1–10) | |
| Initial rotation angle | |
| Magnification of the rotation angle |
Table 3.
Surge arrester fault recognition result.
| Fault Type | Test Pattern | Accurate Pattern | Accurate Rate (%) | Recognizing Rate (%) |
|---|---|---|---|---|
| Normal | 60 | 56 | 93.3 | 97.9 |
| Aging of the internal valve | 60 | 60 | 100 | |
| Internal humidity | 60 | 60 | 100 | |
| Salt damage to the insulation | 60 | 59 | 98.3 |
Table 4.
Recognition performance comparison of SDP + CNN and traditional detection methods.
| Detection Method | Training Time (Second) | Test Time (Second) | Recognizing Rate (%) | Ranking |
|---|---|---|---|---|
| SDP + CNN | 22 | 0.46 | 97.9 | 1 |
| HOG + SVM | 5 | 1.7 | 95 | 2 |
| HOG + BPNN | 121 | 0.35 | 94.6 | 3 |
| HOG + KNN | 3 | 0.3 | 91.2 | 4 |
Publisher’s Note: MDPI stays neutral with regard to jurisdictional claims in published maps and institutional affiliations. |
© 2022 by the authors. Licensee MDPI, Basel, Switzerland. This article is an open access article distributed under the terms and conditions of the Creative Commons Attribution (CC BY) license (https://creativecommons.org/licenses/by/4.0/).
Share and Cite
MDPI and ACS Style
Wang, M.-H.; Lu, S.-D.; Hung, C.-C. Application of Deep Learning and Symmetrized Dot Pattern to Detect Surge Arrester Status. Appl. Sci. 2022, 12, 650. https://doi.org/10.3390/app12020650
AMA Style
Wang M-H, Lu S-D, Hung C-C. Application of Deep Learning and Symmetrized Dot Pattern to Detect Surge Arrester Status. Applied Sciences. 2022; 12(2):650. https://doi.org/10.3390/app12020650
Chicago/Turabian StyleWang, Meng-Hui, Shiue-Der Lu, and Chun-Chun Hung. 2022. "Application of Deep Learning and Symmetrized Dot Pattern to Detect Surge Arrester Status" Applied Sciences 12, no. 2: 650. https://doi.org/10.3390/app12020650
Note that from the first issue of 2016, this journal uses article numbers instead of page numbers. See further details here.