Article

Quantitative Neutron Dark-Field Imaging of Milk: A Feasibility Study

1
School of Mechanical Engineering, Pusan National University, Busan 46241, Korea
2
Laboratory for Neutron Scattering and Imaging, Paul Scherrer Institut, 5232 Villigen, Switzerland
3
Neutron Science Center, Korea Atomic Energy Research Institute, Daejeon 34057, Korea
4
Laboratoire Léon Brillouin, CNRS-UMR12-CEA-Université Paris-Saclay, 91190 Gif-sur-Yvette, France
5
INRAE, UMR MIA 518, ISC-PIF, 113 Rue Nationale, 75013 Paris, France
6
Forschungs-Neutronenquelle, Heinz Maier-Leibnitz Zentrum (FRM II), Technische Universität München, Lichtenbergstraße 1, 85748 Garching, Germany
*
Authors to whom correspondence should be addressed.
Appl. Sci. 2022, 12(2), 833; https://doi.org/10.3390/app12020833
Submission received: 1 December 2021 / Revised: 10 January 2022 / Accepted: 12 January 2022 / Published: 14 January 2022
(This article belongs to the Special Issue Neutron Dark-Field Imaging and Grating Interferometry)

Abstract

:
Scattering studies of milk and milk products, which are highly relevant food products on the global market, are often utilized and reported in literature to investigate and understand the subtle microscopic structural differences between dairy samples. These structural features determine the physical properties and ultimately the texture of milk products and, thus, also influence the consumer’s experience. Small-angle neutron scattering is a prominent example, which enables observations of length scales, which convey proteins and fat globules in food-grade milk. In addition, deuteration enables contrast variations between the constituents of dairy products. In this study, we investigate the potential of probing small-angle neutron scattering from milk samples through quantitative neutron dark-field imaging using grating interferometry, to establish the feasibility of studying, in particular, fat globules and milk gel structures with this spatially resolved scattering technique.

1. Introduction

Dairy milk has a very long history of use and forms a basic part of global nutrition, which is reflected in global production in 2019 of 881 hundred million tons [1]. Thus, the structure of milk during processing is of considerable commercial and consumer interest in the sense of creating a demand for new dairy products; optimizing processing; human nutrition; and oral drug delivery. The most basic and main constituents of milk, apart from water, salts, and whey proteins, are casein micelles (CM) and fat in the form of fat globules (FG) with sizes ranging between 10–102 nm for CM and approximately 103 nm for FG, respectively. Dairy products contain a hierarchy of length scales in the arrangements of these structures. Milk coagulation in the formation of dairy gels, by, for example, microbiological action, pH variation, or enzymatic action, results in the formation of continuous networks. In milk, the CM is a colloidal and electrostatically stabilized sol, where glycomacropeptide strands, κ-casein, decorate the CM surface in the form of brushes, providing electrostatic or steric repulsion. To enable gelation, the repulsion can either be neutralized or, in the case of rennet gels, the brush strands can be removed by enzymes. Conventionally, animal rennet was predominantly used, while modern trends have turned to rennet sourced from plants, bacteria, or fungi.
Dairy structures have mainly been studied using microscopy techniques, i.e., optical imaging [2,3,4], but also using scattering techniques [5,6,7,8,9], such as dynamic light scattering and small-angle X-ray and neutron scattering. Details of CM networks in dairy gels have been inferred indirectly from mechanical and optical rheological studies [10]. Real space or microscopy techniques offer, by contrast, direct visualization of structures, but the challenges of reconstructing the bulk of the properties from a sufficiently statistical description can make the practical application of such techniques problematic. Small-angle neutron scattering combines the advantages of (i) being able to penetrate bulk samples where light fails, (ii) being non-destructive, and (iii) non-invasive, allowing a (iv) separate assessment of fat-based and CM-based structures through contrast variation (hydrogen and deuterium substitution), and finally (v) requiring a minimum effort of sample preparation [11]. Small-angle neutron scattering (SANS) has been applied to probe the relevant length scales from nanometers to micrometers of milk and dairy gels. Several SANS techniques were employed, including conventional SANS instruments, which have been used to accessing length scales from approximately 10 to a few 100 nm [12]; Ultra small-angle neutron scattering (USANS) [13], which have extended the range to approximately 10 μm; and the more recent Spin Echo SANS (SESANS) [14] technique, which can probe from 10 s of nm to a few 10 s of μm [15]. The latter directly probes real space correlations; however, this only occurs in one dimension, such as the slit-smeared intensity of USANS, which does not pose an issue for isotropic systems such as dairy samples. Correspondingly, conventional SANS is well suited to probe the structure of casein micelles themselves [16] but reaches its limits around the largest size of casein micelles, and thus, USANS and SESANS are required to elucidate the coagulation as well as the gel formation processes and structures [8,16]. It is these length scales which are most directly related to the important bulk properties of dairy gels [17].
In this paper, we propose and evaluate the potential of a novel technique, namely quantitative neutron dark-field contrast imaging (DFI) [18,19,20], which adds the promise to combine microscopic studies (in analogy to the SESANS technique) with macroscopic observations of micro-structural variations. The latter must be expected when, e.g., gravity plays a role or external stimuli or additions to the system are not homogeneous throughout the sample. This method utilizes a spatial modulation of the beam, which is commonly induced and resolved by a Talbot–Lau interferometer added on a neutron imaging instrument [21]. However, a number of different means have been introduced so far, which enable spatial beam modulation for neutron dark-field imaging, and the range of microstructure sizes that can be probed has been extended continuously [22]. Today, such techniques are, overall able to access size ranges from a few 10 nm to a few 10 μm; however, no single method is typically able to reasonably probe more than two orders of magnitude individually. For this work, we utilized a symmetric version of a Talbot–Lau interferometer [23], covering a length scale range from approximately 100 nm to 3 μm.
The principle of measurement relates to the loss of spatial beam modulation visibility v = ( I m a x I m i n ) / ( I m a x + I m i n ) due to intensity redistribution from the sample by small-angle scattering. Scanning the distance of the sample to the modulation detection and/or the wavelength enables the probing of different angular ranges of scattering and, hence, corresponding correlation length ranges of the scattering structures. It can be shown that such scans of visibility, probed in each pixel through phase stepping, reproduce the microstructure’s projected real-space correlation function (for one-dimensional scattering resolution) in the probed regime. In other words, the scattering function is Fourier back-projected to real space in full analogy to the SESANS measurement principle, where, however, visibility in terms of polarization is measured [14], except in the case of SEMSANS [24,25]. The combination of the modulation technique with an imaging set-up allows local, pixel-wise analyses and, therefore, spatially resolved scattering and microstructure quantification to be performed [18,19,20].

2. Material and Method
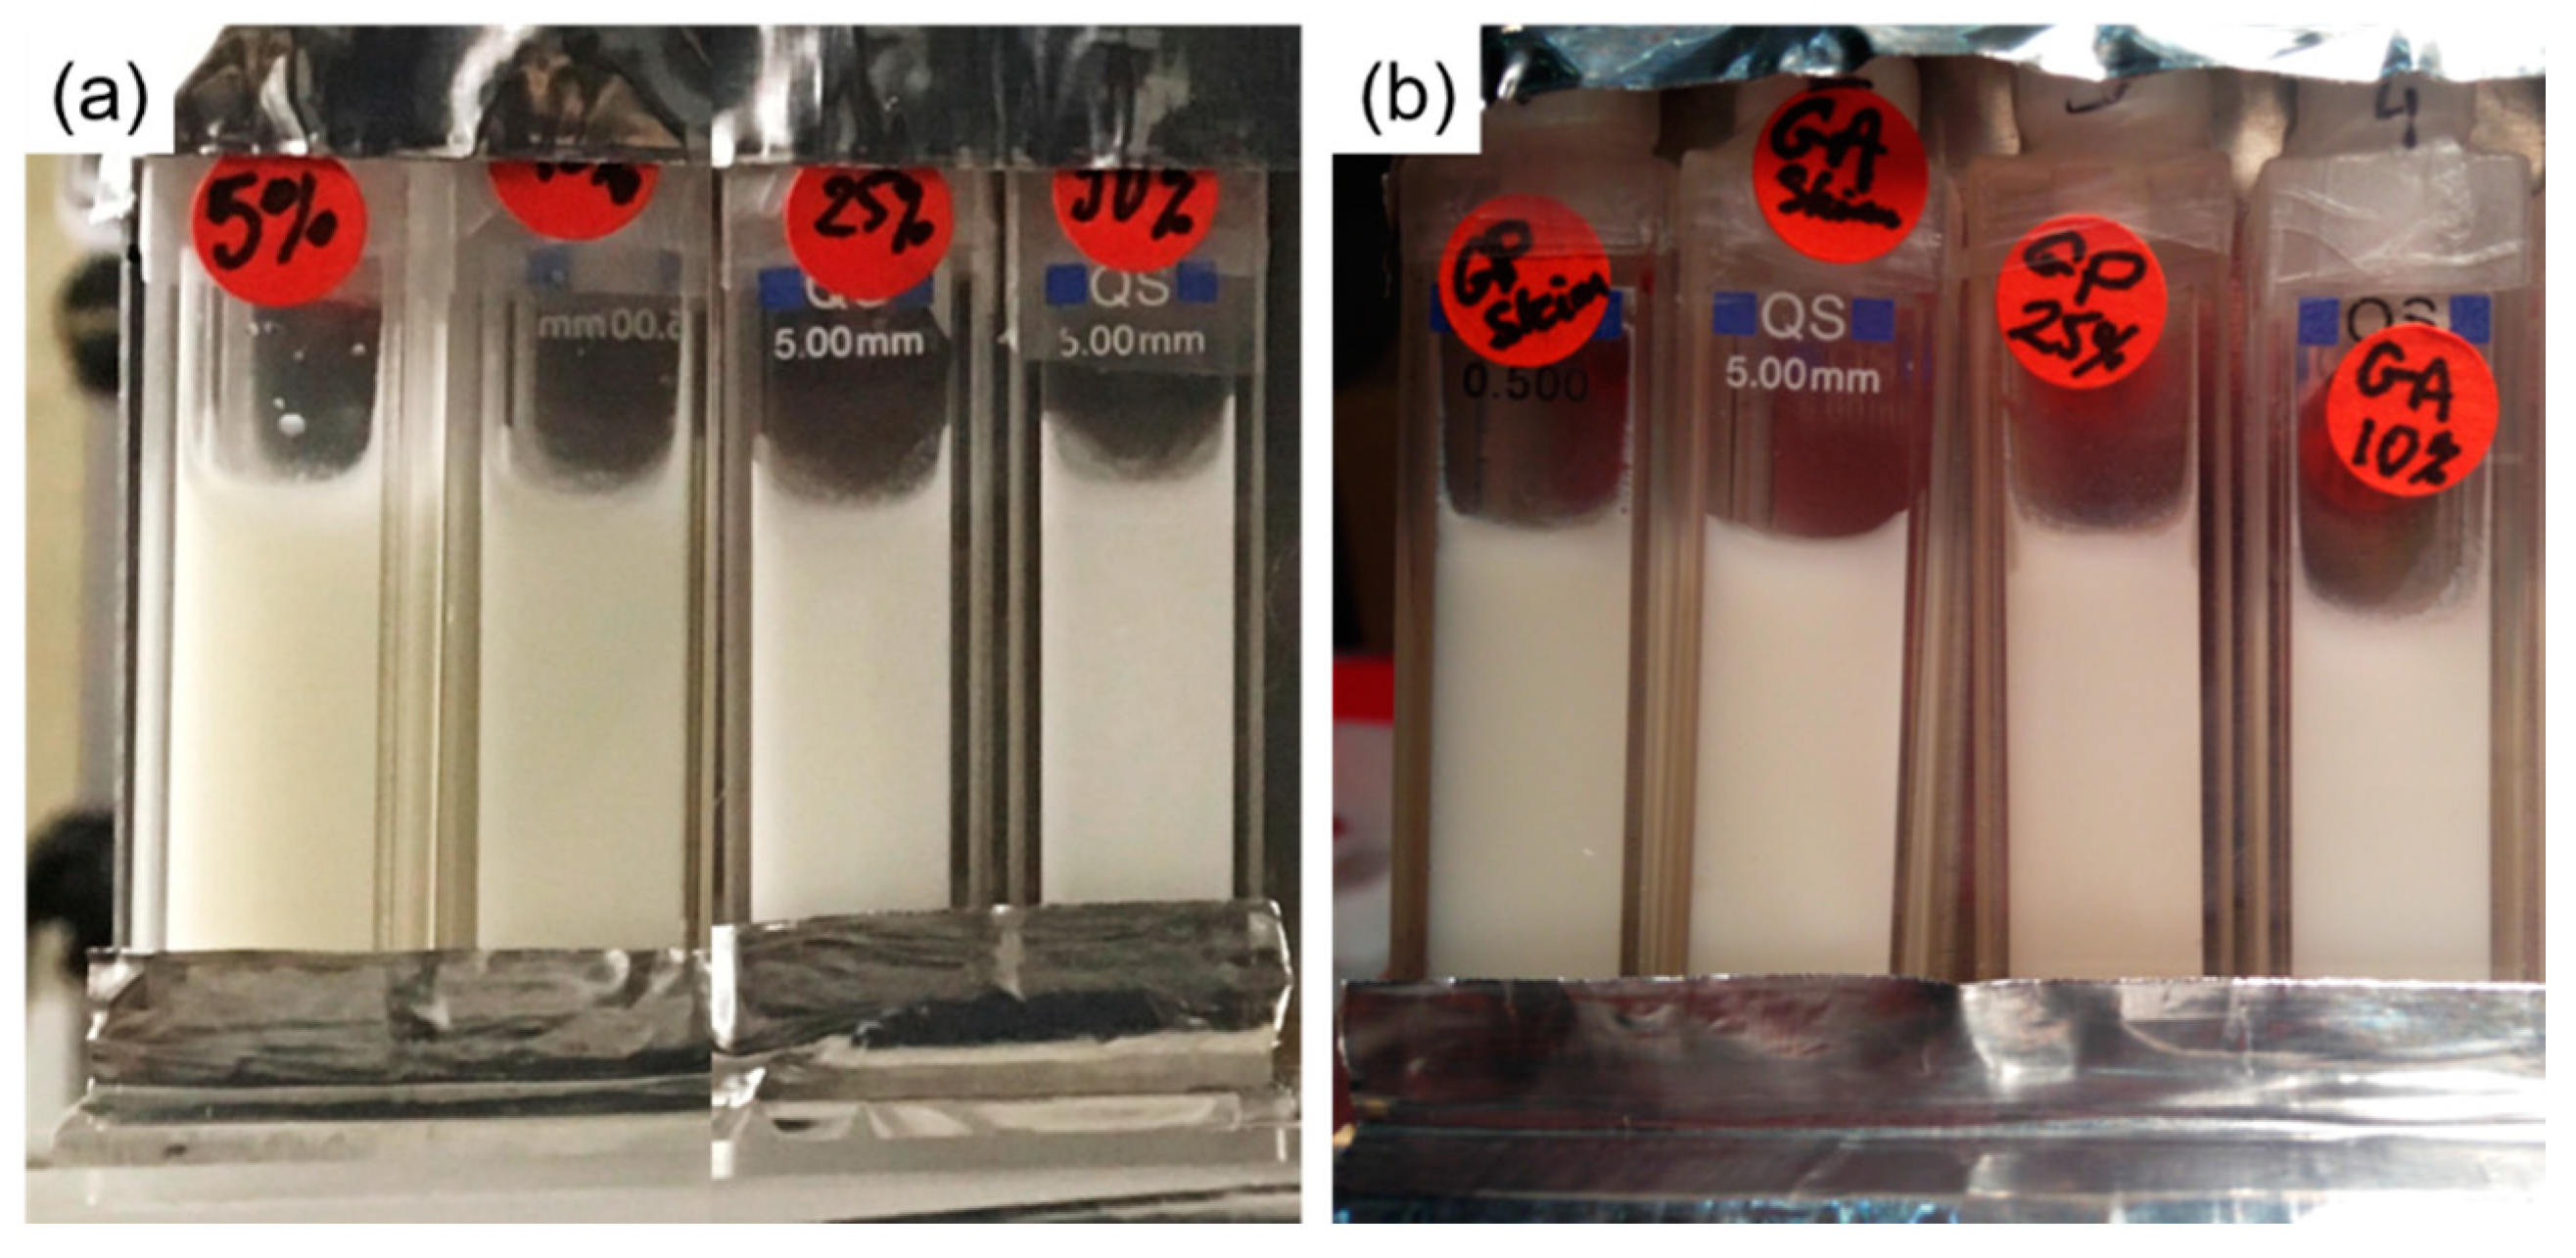
2.1. Samples

The milk powders used were products 21,447 and 22,058 manufactured by LACTALIS with 0% (skim milk) and 26% fat (whole milk), respectively. The milk powders were dissolved in deuterated water (1 g of powder for 10 mL D2O). The two solutions were mixed in the ratios 5%, 10%, 25%, and 50% in volume of fat–milk solution (we will refer to the samples with respect to these ratios). This corresponds to 1.3 g/L, 2.6 g/L, 6.5 g/L, and 13 g/L of fat, respectively. D2O enables a higher neutron scattering length density (nSLD) contrast with casein and even higher with fat.
For the experiments, the deuterated dairy samples were filled into cuvettes as shown in Figure 1. These were arranged on a sample holder in groups that were probed simultaneously, profiting from the spatial resolution of the method. The deuterated milk samples were contained and sealed in these standard quartz cuvettes of 5 mm thickness (t).
Gelation of the milk samples was achieved using the same initial diluted milk powders, by applying two different mechanisms: acidification on the one hand and rennet-induction on the other hand. The rennet-induced gel was prepared for fat-free (skim) and 25%-fat milk and the acidified gel for fat-free and 10%-fat milk (due to the difficulty associated with gelling the 25% milk sample). The acidification was generated by adding Glucono delta-lactone to the solution, which progressively lowers the pH, similar to lactic bacillae. The surface pendent chains of CM, hair-like κ-caseins, bear COO-H+ charged groups, which induce electrostatic inter-casein repulsion. The low pH changes the COO-H+ charged groups into COOH uncharged groups and thus neutralizes the repulsion of the casein MCs and facilitates coagulation. The rennet gel uses rennet enzymes, which shave off the hair-like κ-casein, suppressing repulsion as well. GP (P for “Présure”) and GA (A for “Acide”) in Figure 1 correspondingly denote rennet and acid gels, respectively.

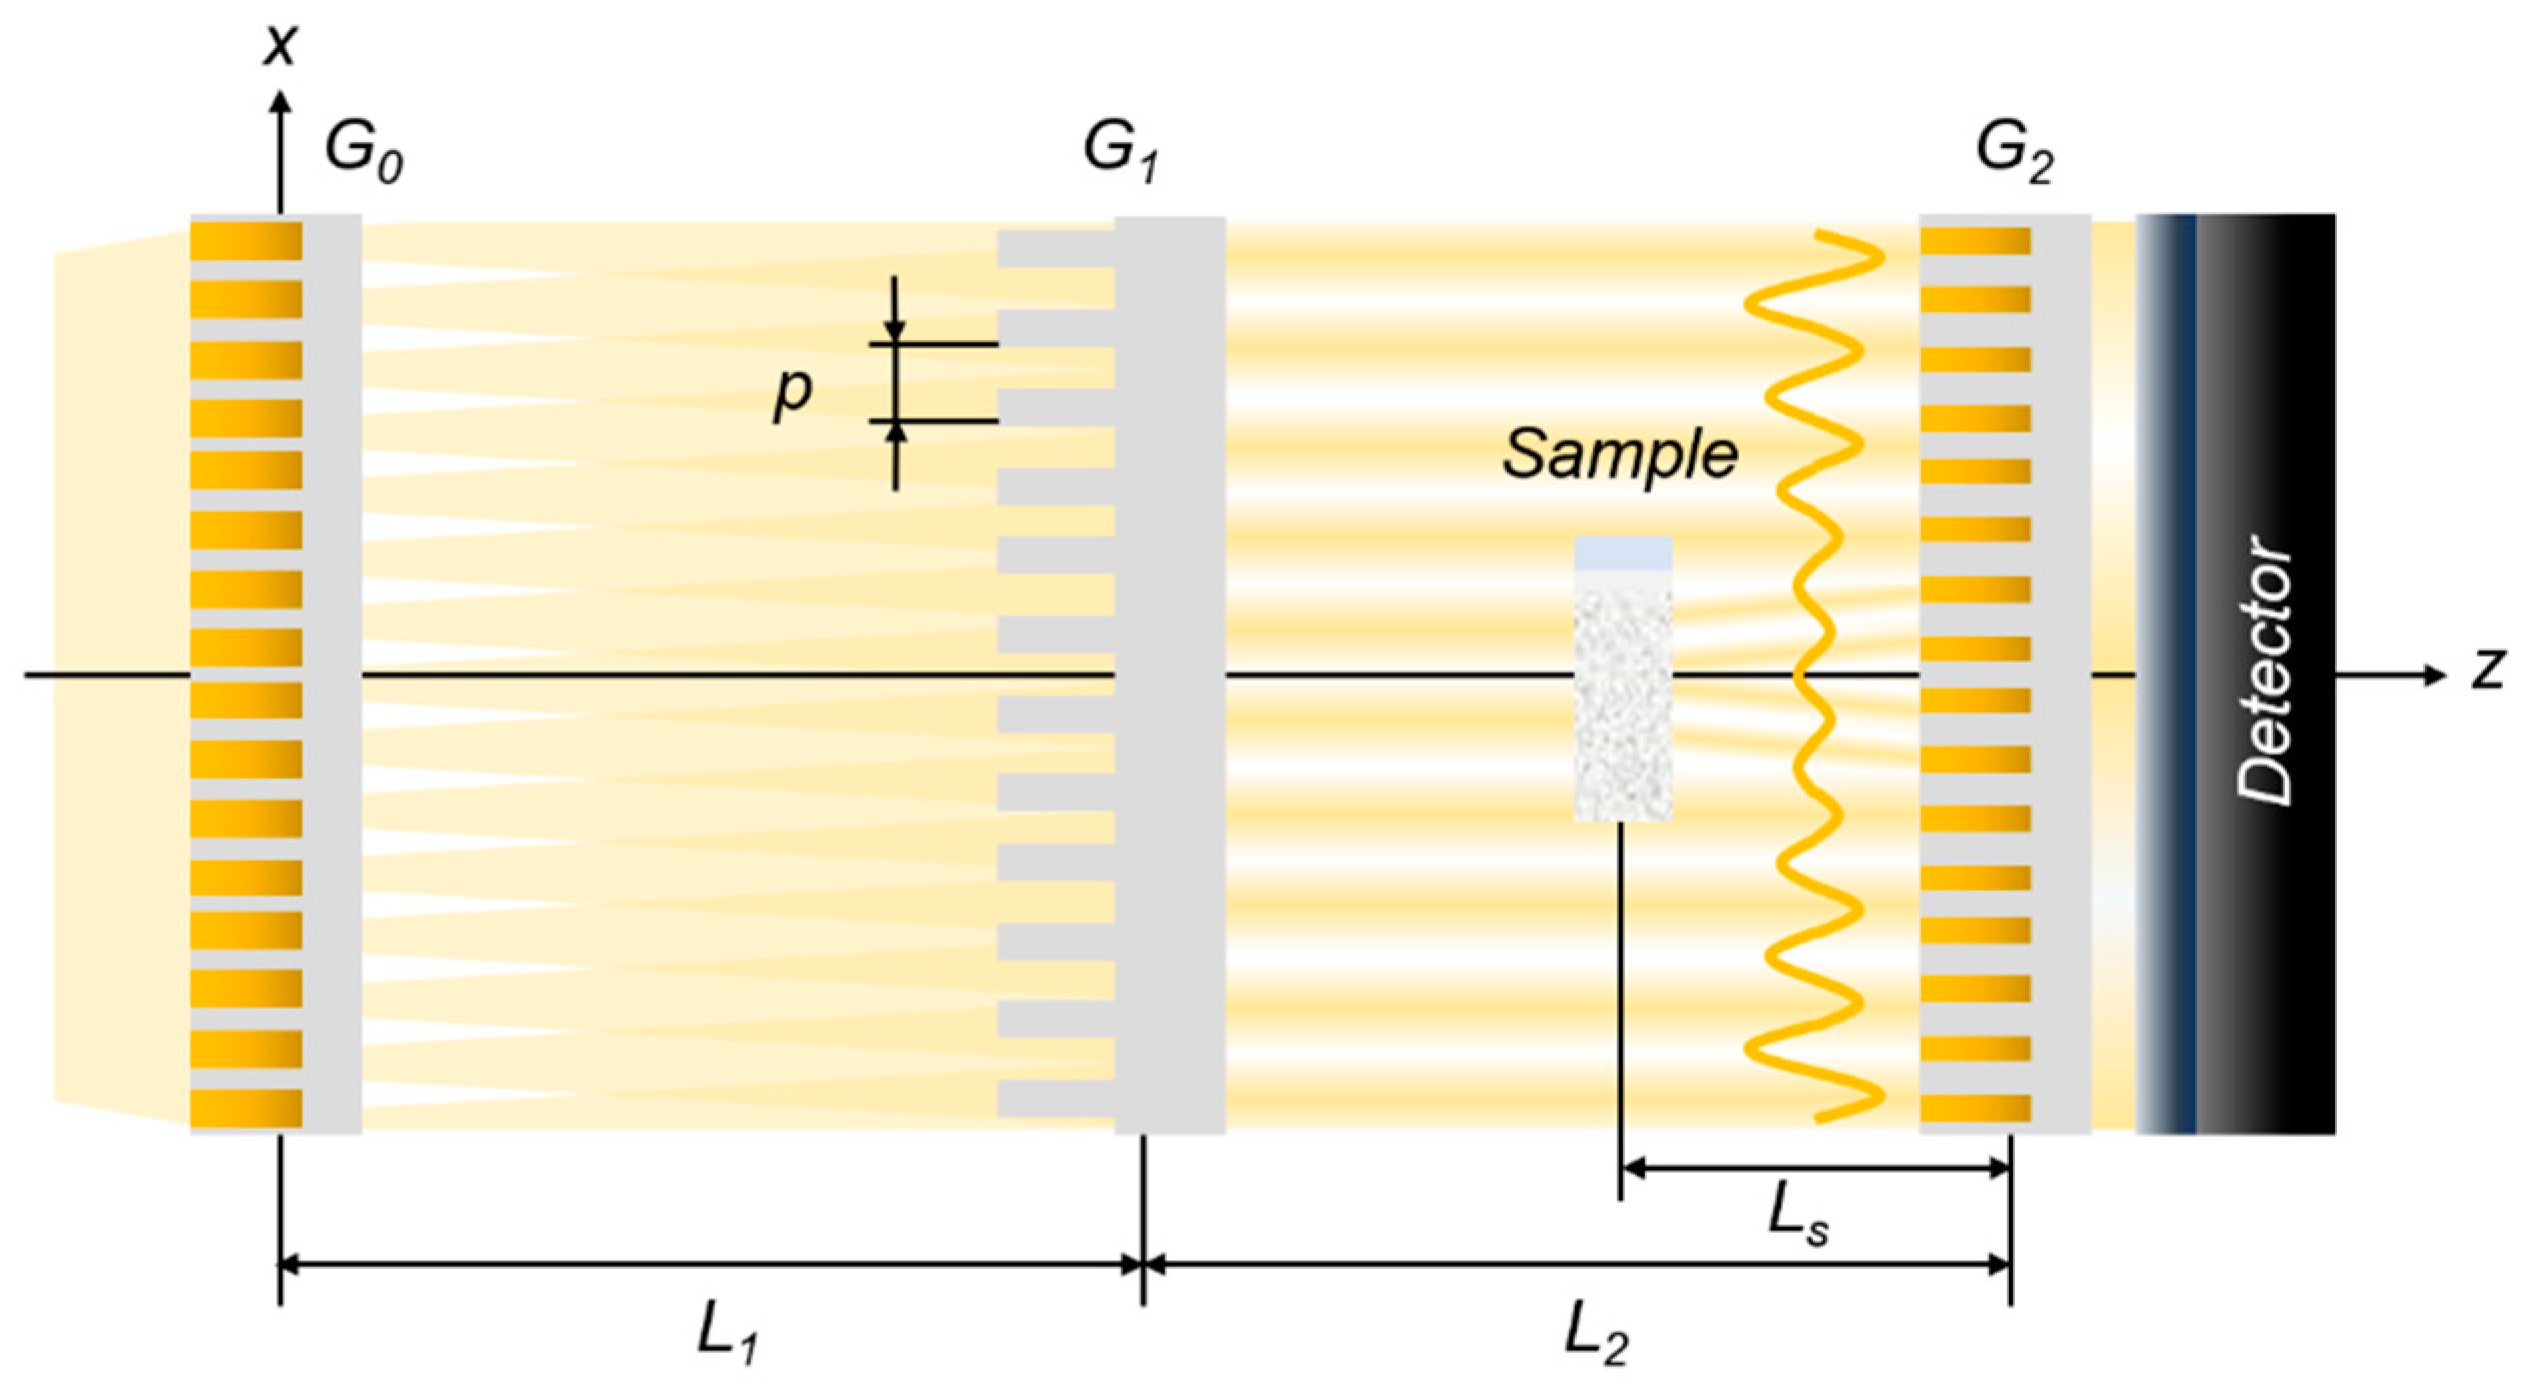
2.2. Dark-Field Contrast Imaging

Figure 2 shows the principal set-up of a Talbot–Lau grating interferometer (TLI). The TLI consists of a source grating, G0, a phase grating, G1, and an analyzer grating, G2. G0 is an absorption grating that is positioned downstream of the source to generate multiple collimated beams, providing a partially coherent beam. G1 is a phase grating that generates an interference pattern, called a Talbot pattern, further downstream. G2 is another absorption grating that is positioned at a fractional Talbot distance and matches the period of the interference pattern. The geometry of G0 and G1 is such that the interference patterns of the individual coherent beams from G0 add constructively at G2. The imaging detector system is positioned directly after G2 and resolves the local interference pattern pixel-wise through the phase stepping of one of the gratings, typically G0.
Small-angle neutron scattering from a sample convolutes with the intensity modulation induced by the gratings. This results in the damping of the interference fringes at G2, i.e., a loss of visibility,   v s . The relative loss of visibility, v s / v o , is referred to as the DFI contrast. The scattering distribution at G2 varies with the sample distance L s and the wavelength λ , and it can be shown that these parameters, together with the beam modulation period p , define the real-space length probed in the scattering structure [19]. This length is referred to as instrumental or probed correlation length, ξ , in full analogy to the spin-echo length in SESANS. It can be written as:
ξ = λ L s / p ,
where p coincides with the period of G2 in the TLI setup.
Correspondingly, the DFI contrast can be described quantitatively with regards to the real-space correlation function G ( ξ ) of a scattering structure:
D F I ( ξ ) = v s ( ξ ) / v 0 ( ξ ) = e Σ s t ( G ( ξ ) 1 ) ,
where Σ s is the total small-angle neutron scattering cross section, containing the volume fraction φ , the nSLD contrast Δ ρ , the characteristic structure size ζ (often referred to as the specific correlation length of a structure), and the utilized wavelength λ , while t is the sample thickness [19]. The real-space correlation function, G ( ξ ) , which is a one-dimensional projection of the three-dimensional scattering-length density correlation function of the scattering structure, is related to the small-angle scattering intensity I ( q ) of the structure through the Hankel transform [26]:
G ( ξ ) = 1 2 π ζ 0 J 0 ( q ξ ) I ( q ) q d q ,
where J 0 is the zeroth-order Bessel function of the first kind, and q = ( 4 π sin θ ) / λ is the magnitude of the scattering vector, with θ being the scattering angle. The characteristic structure size ζ can be expressed as:
ζ = 1 2 π 0 I ( q ) q d q .

2.3. Data Acquisition

The TLI was applied at the cold neutron beamline, BOA, at the Swiss neutron source, SINQ, of the Paul Scherrer Institute [27]. The TLI was a symmetric setup, using the first fractional Talbot distance. The TLI worked at the effective neutron wavelength of 4.1 Å and utilized the cold spectrum of the beamline, which was cut off at short wavelengths by a cooled beryllium filter installed upstream. The detailed parameters of TLI are presented at Table 1.
G0 has the one-dimensional line structure of gadolinium oxysulfide (Gadox, Gd2O2S), G1 has the two-dimensional checker-board structure of silicon, and G2 has the two-dimensional mesh-grid structure of Gadox. Each grating has the fabricated-structure area of 100 mm × 100 mm on a 15 cm diameter silicon wafer. G0 and G2 were fabricated by a Gadox-particle-filling method [28], and G1 was fabricated by silicon deep wet etching.
The detector used was an Andor iKon-M CCD camera operated with a standard PSI Midi-box detector design, with a mirror and commercial optical lens system (100 mm Nikkor). The scintillator was a 200 μm thick LiF:ZnS screen. The image area was 1024 × 1024 pixels corresponding to an approximately 67 × 67 mm2 field of view.
The phase-stepping method was adopted by a G1 scan performed in eight phase steps for each DFI image. The exposure time was 30 s for each raw image, and three images were recorded per phase step, which were combined by a median filter operation during data reduction. The DFI contrast was extracted from the resulting images pixel by pixel using Fourier analysis. In addition, the sample distance, L s , was scanned to probe the local correlation function, G ( ξ ) , for the correlation length ξ (Equation (1)) from 130 nm to 3.13 μm.

2.4. Data Analyses

The deuterated milk samples comprised of CM and FG scattering structures, which are both spherical entities of colloidal dimensions, in aqueous solvent. The radius of CM is typically less than 70 nm within a total range of 20–200 nm, and FG are expected to fall into a size range of 100–15,000 nm. Both are highly polydisperse in the solvent [6,9]. The CM range at the lower limit of the resolved range and provided a lower nSLD contrast than the FG in the used solvent. Thus, they were not expected to be resolved, at least when they were not aggregated by gelation.
In particular, the FG provided a high nSLD contrast, as expected. This also manifested in a significant DFI contrast increase for samples of increasing fat content. The scattering of the FG can be modeled assuming hard spheres, a model applied regularly in quantitative DFI analyses [19,20]. However, it is known from the literature that the FG do not appear as being monodisperse, but rather as being polydisperse, a situation that has, in contrast, not been modelled in the context of DFI so far.
The polydispersity of spheres can be considered using a model of spheres weighted by a size distribution P ( r ) , which is expressed by [26]:
G ( ξ ) = 0 G ( ξ , r ) P ( r ) d r .
According to the literature for the FG, a log-normal size distribution can be assumed according to [8] with:
P ( r ) = 1 r σ 2 π e ( ln r μ ) 2 2 σ 2 ,
where μ is the mean, and σ is the standard deviation of sphere radius r . For the log-normal distribution, the median radius of the sphere is r 0 = e μ , and the mean radius of the sphere is r = r 0 e σ 2 / 2 .
In addition, particularly for high volume fractions of fat, a structure factor of inter-particle correlations must be accounted for in modelling G( ξ ) of the system. For this, we first consider the Fourier space description of small-angle scattering, where the scattered intensity distribution, I ( q ) , of a dense system of hard spheres with radius r , sphere volume V ( r ) , volume fraction φ , and nSLD contrast Δ ρ is described by:
I ( q , r ) = φ V ( r ) Δ ρ 2 | F ( q , r ) | 2 S ( q , r ) ,
where F is the form factor, and S is the structure factor.
The form factor of a sphere of is:
F ( q , r ) = 3 sin ( q r ) q r cos ( q r ) ( q r ) 3 .
The structure factor of such system, describing the scattering contribution arising due to the arrangement of the spheres with respect to each other, can be written as the so-called Percus–Yevick expression [29,30]:
S ( q , r ) = 1 1 + 24 φ Υ ( 2 q r ) 2 q r ,
where the function Υ ( x ) is given by
Υ ( x ) = α sin ( x ) x cos ( x ) x 2 + β 2 x sin ( x ) + ( 2 x 2 ) cos ( x ) 2 x 3 + γ x 4 cos ( x ) + 4 [ ( 3 x 2 6 ) cos ( x ) + ( x 3 6 x ) sin ( x ) + 6 ] x 5 ,
with
α = ( 1 + 2 φ ) 2 ( 1 φ ) 4 ,
β = 6 φ ( 1 + φ 2 ) 2 ( 1 φ ) 4 ,
γ = φ α 2 .
Considering, on the other hand, the gelled samples, it is widely accepted that, during gelation, CMs aggregate and form a self-affine network with characteristic fractal dimensions in a manner analogous to colloidal gels [17], as shown in Figure 3.
As outlined above the electrostatic repulsion between CMs is diminished, mechanistically, through acidification, or through shaving of surface κ-caseins, leading to a decrease in colloidal stability and aggregation and the formation of a network structure with a number of physical factors determining the scaling of the network [31]. The structural characteristics of a fractal network such as milk gel can be expressed by coarseness and space-filling capacity related to the fractal dimension D f . These are parametrized by a , the characteristic length of inhomogeneity, and the Hurst exponent, H , which is related to fractal dimension through [8]:
D f = 2 H + 3 .
To model the fractal network of the CM of the gels, we employed a self-affine-structure model referred to as a random two-phase media model [26], reading:
G ( ξ ) = 2 Γ ( H + 1 / 2 ) ( ξ 2 a ) H + 1 / 2 K H + 1 / 2 ( ξ a ) ,
where Γ is the gamma function, and K is the modified Bessel function of the second kind.
However, to better reflect the structure of the network of CM, the model was modified by substituting the exponential function ( e ( ξ 2 a ) ) for the modified Bessel function of the second kind ( K H + 1 / 2 ( ξ a ) ), accounting in particular for the long length-scale correlations of the fractal network of CM according to Ref. [8].
Thus, we used:
G ( ξ ) = 2 Γ ( H + 1 / 2 ) ( ξ 2 a ) H + 1 / 2 e ( ξ 2 a )  
for modelling the data of the skim milk gels.

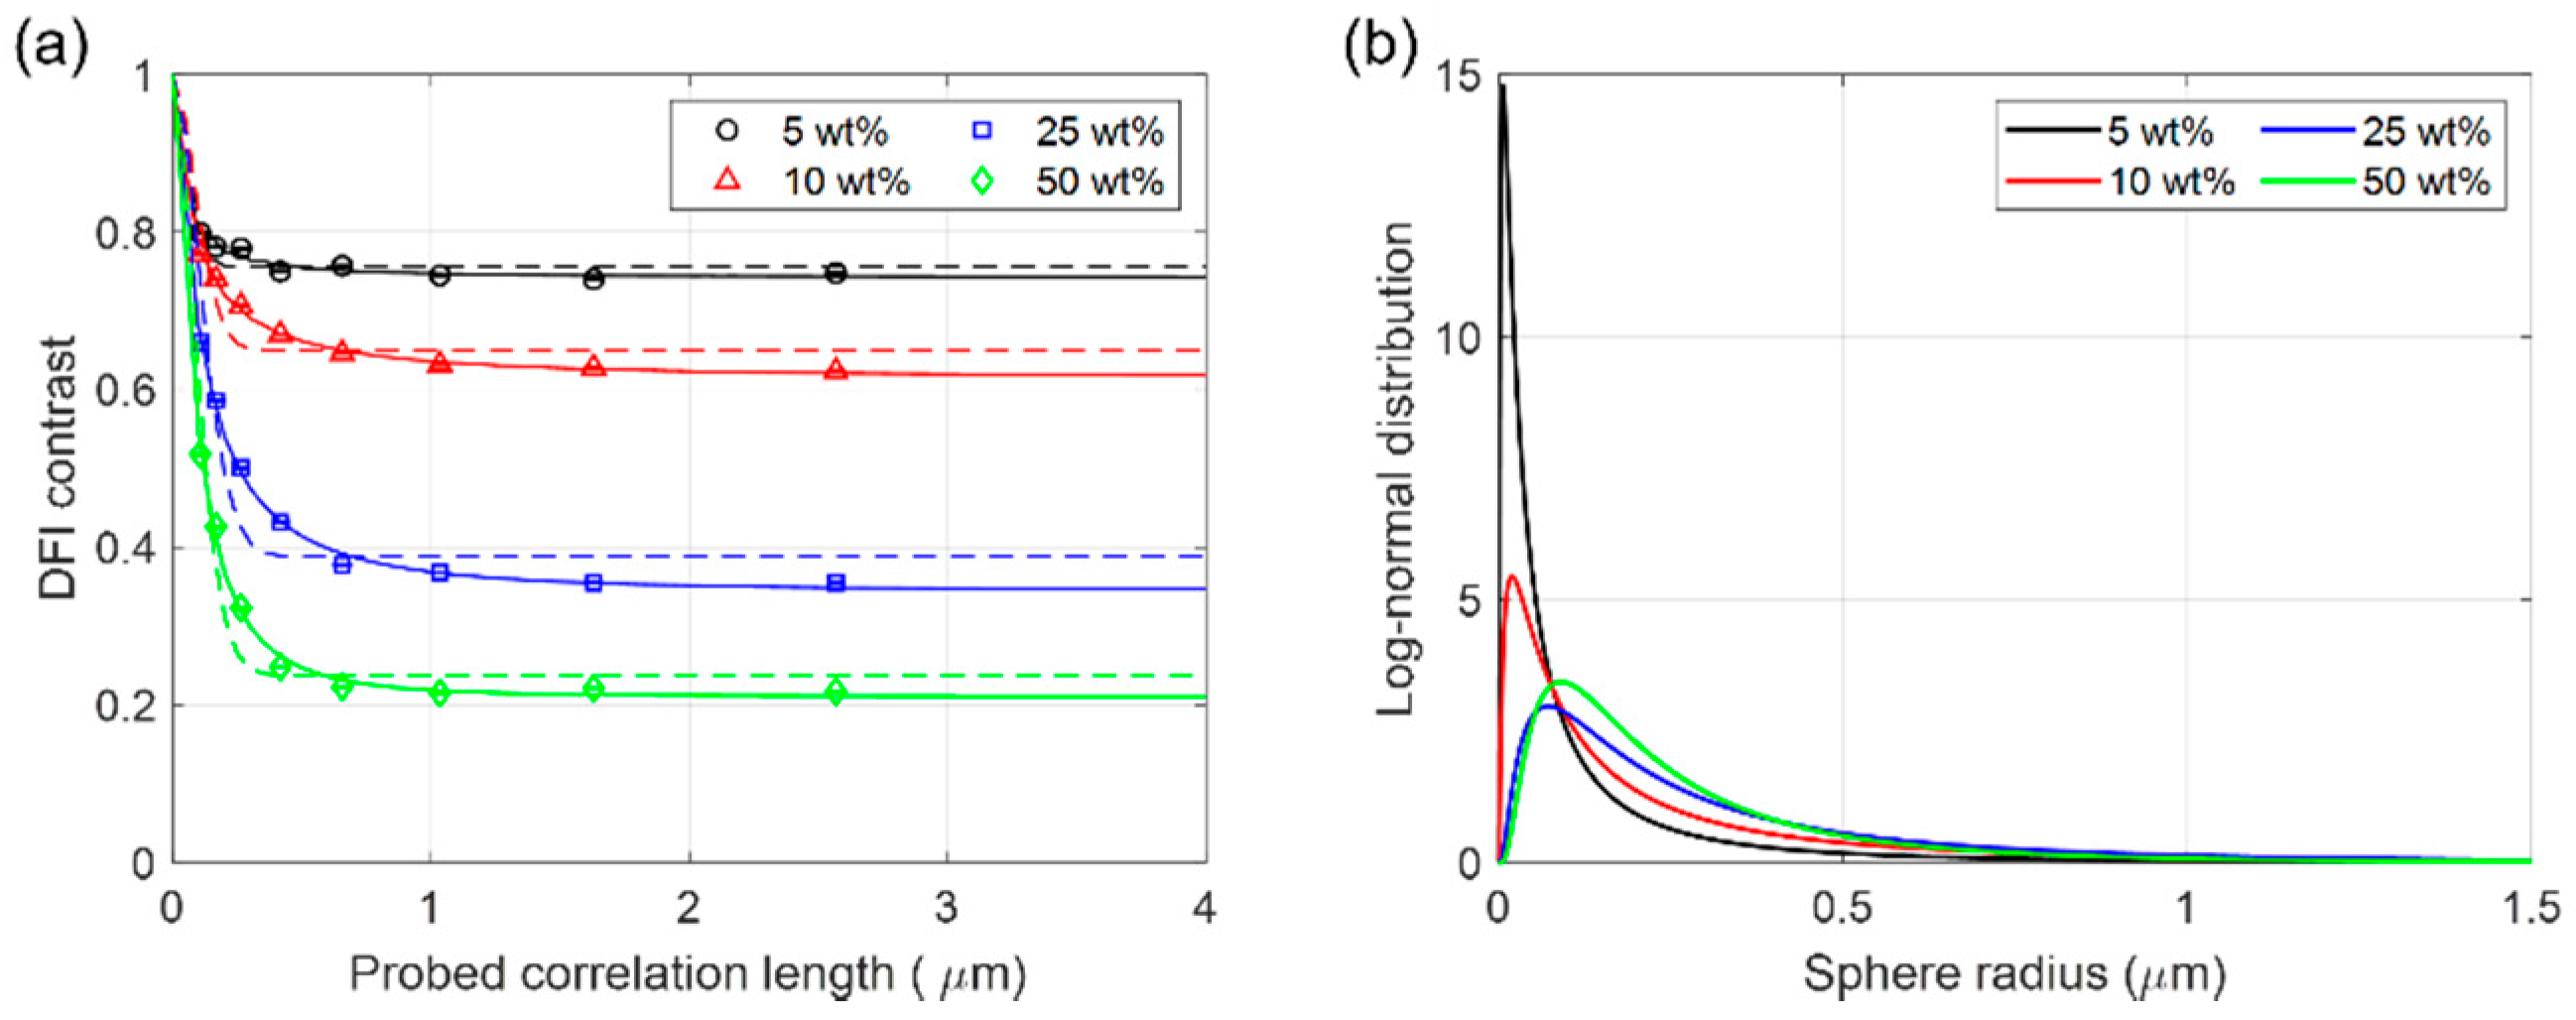
3. Results and Discussion

Figure 4 shows conventional neutron attenuation contrast images (AI) alongside dark-field contrast images (DFI) recorded at two different instrumental settings and probed lengths (130 nm ad 3.13 μm) of the deuterated milk and milk gel samples. The conventional AI images, which, in terms of contrast, do not depend on the changing experimental settings, display only minor contrast variations with respect to fat content and gelation. This is clearly different for the DFI images, where the contrast increases obviously with increasing fat content, as well as with an increasing probed correlation length, ξ . This is the first indication that the contribution of the scattering by FG dominates the scattering signal and that this scattering contrast is picked up for all samples, respectively.
In order to analyze the detected local scattering, i.e., the dark-field contrast over the probed correlation length, the DFI curves were extracted for different regions of interest (ROI). These curves can be modelled and fitted according to Section 2.4. In Figure 5a, the plotted DFI contrast values are median values of ROIs consisting of 60 × 180 pixels as indicated exemplarily for two samples in Figure 4. Figure 5 displays the corresponding DFI curves of the deuterated milk samples. Initial visual inspection suggested the dominating structure sizes of up to approximately 1–2 μm by observing where the curves became flat, as G ( ξ ) tended to zero (compare Equation (2)). The increasing contrast, i.e., the deeper levels of flat tails, indicates increased total scattering cross sections, Σ s , due to increasing volume fractions of the dominating scatterers, i.e., FG. The dashed lines represent initial fits with a simple isolated monodisperse hard-sphere model [19,20,26], and Table 2 presents the fit results in terms of fitted parameters. It is observed that such fits, as expected, do not fully account for the measured slopes, which is especially the case where these turn from a steep decay to flat tails. The more extended bending region in the measured curves shows the influence of polydispersity. The solid lines, therefore, represent subsequent nonlinear least square fits with the polydisperse hard-sphere model, where the projected real-space correlation function G ( ξ ) is calculated by a numerical Hankel transform, according to Ref. [32] (Equation (3)), of the analytic expression of the scattered intensity according to Equations (5)–(12). The model thus accommodates the form factor (FG) of the spheres, i.e., the hard-sphere structure factor, for their high concentration and thus correlation, as well as their polydispersity. These fits result in good agreement with the measured data of the DFI contrast for different probed correlation lengths in the ROIs (Figure 5a) and result in the fitted structural parameters for the FGs as shown in Table 3. The goodness of fits of FGs in the deuterated milk for the mono- and polydisperse hard-sphere models were considered using R2 and the adjusted R2 evaluation. The polydisperse hard-sphere model improves the quality of fit, in terms of both (R2) and adjusted R2, compared to the monodisperse hard-sphere model, as shown in Table 3. Both reach values > 0.95. We also found that the use of a structure factor does not further improve these values, which might be expected due to the low actual fat volume fraction.
The median radius, r 0 , and the mean radius, r , of FG are calculated by extracting the structural parameters from the fitted log-normal polydispersity, chosen based on the literature about corresponding systems [33]. The radii are calculated from the mean μ and the standard deviation σ of the log-normal distribution, respectively. We found that the median radius and the mean radius of FG both increased with an increase in volume fraction. The mean size of FG was found to increase from approximately 0.36 μm to approximately 1.36 μm in mean diameter ( 2 r ) when considering fat concentrations of 5 to 50% fat milk.
When considering the homogeneity of the samples by choosing several smaller ROIs from top to bottom for each sample, as this imaging technique enables, a subtle increase of total scattering from bottom to top was found. Figure 6 shows an evaluation of the total neutron scattering with an increment of approximately 2.5 mm from the bottom to the top of the samples. The corresponding ROIs are indicated in the exemplary image on the right-hand side of Figure 6. The total neutron scattering increases clearly, in particular for the samples with higher fat concentrations. This indicates the presence of larger volume fractions and/or larger sizes of FG towards the top, which is intuitive, considering the lower density of fat. The fits do not, however, provide a clear conclusion about increasing radii towards the top of the samples. It is, therefore, possible that FG concentrates at the top without coalescing, due to a persistent slight repulsion.
The results of the deuterated milk gel samples are presented in Figure 7. Different analyses strategies and models were required to be chosen for the skim milk gels and the fat milk gels. This was due to the fact that once again the FG signal dominated in the case of the fat milk gels. The fractal network of CM in the skim milk gels was modelled using an exponential function substituting the Bessel function in Equation (13), as described in Section 2.4. Good fits were achieved this way for both the rennet gel (GA) and the acidified gel (GP). The extracted structural parameters of the fractal CM networks are summarized in Table 4 and appear in reasonable agreement with the literature [34,35].
For the acidified gel (GA Skim) and the rennet gel (GP Skim), one can notice at first sight that the curves are flatter than those representing the results for milk, as expected from the spatial correlations of a fractal network. The typical size of inhomogeneities was found to be approximately 0.2170 μm and 0.3545 μm for the two gels, respectively. The Hurst exponent, representing the space-filling capacity, i.e., the dimensionality of the fractal structure, assists in quantifying the fractal dimension, D f , as 2.7598 for the acid gel (GA Skim) and 2.5427 for the rennet gel (GP Skim).
For the fat milk gels, GA Fat and GP Fat, respectively, the scattering of which was dominated by the 10- and 25%-fat milk content, only the assumption of an unaltered fractal network (as compared to the skim gels) enabled us to use an approach to characterize the FG structure. This is enabled, in a crude force approach, by dividing the corresponding curves by those of the skim milk gels and subsequently fitting a polydisperse hard-sphere model with a hard-sphere structure factor, in analogy to the fat milk samples. The results are shown in Figure 7 and are summarized in Table 5. The results suggest FG sizes approximately double those of the milk samples with a corresponding fat content, namely approximately 1.5 μm diameter.

4. Conclusions

Dark-field imaging was applied to study the structure of deuterated milk and milk gel samples using a symmetric Talbot–Lau neutron-grating interferometer. In order to model the data, a numerical Hankel transform of the analytic expression of the small-angle scattering intensity in the case of polydisperse spheres was applied. This enabled us to fit the projected real-space correlation function resulting from the quantitative DFI scans, taking into account a polydisperse size distribution for the form factor. Moreover, a structure factor was considered, but showed little impact with regard to the relatively low concentration of fat globules. As a result, the mean size and log-normal size distribution of the fat globules, as well as their dependence on concentration, could be quantified. In addition, the mapping of the total scattering cross-section as a function of sample height revealed a subtle gradient in the concentration of fat globules towards the top surface of the samples, increasing with fat concentration. Moreover, the structure of the milk gel could be modelled as a fractal network with long-range correlations for skim milk gels related to the casein micelle aggregation enabled by acid and rennet enzymes, respectively. Slightly different structure parameters and fractal dimensions were modelled. For fat milk gels, the fat globules in the fat milk gels were analyzed by approximating their scattering contribution through normalization with the respective skim milk gel data. This approximation implied somewhat larger fat globules in the gels than in the milk samples with the same fat concentrations.
In conclusion, this paper has demonstrated that dark-field imaging data enables the extraction of quantitative information for complex systems involving polydispersity and structure-factor contributions. In particular, quantitative dark-field contrast neutron imaging was found to be a well-suited quantitative tool for investigations of dairy system structures. The proven ability to analyze local variations through the imaging approach allows us to add not only the identification but also the assessment of macroscopic variations of microstructures resulting from external stimuli or processing and mixing of constituents to the body of research in this field. This approach holds the promise to be extended to other soft-matter and material science problems.

Author Contributions

Conceptualization: Y.K., F.B. and M.S.; methodology: Y.K., J.V., J.K. and M.S.; software: Y.K. and O.O.; validation: Y.K., C.G. and M.S.; formal analysis: Y.K. and M.S.; investigation: Y.K., C.G., E.L., F.B. and J.V.; resources: Y.K., J.K., S.W.L., F.B., E.L. and M.S.; data curation: C.G., M.B. and M.S.; writing—original draft preparation: Y.K. and M.S.; writing—review and editing: J.V., O.O., J.K., C.G., S.W.L., F.B., E.L. and M.S.; visualization: Y.K.; supervision: M.S.; project administration: M.S.; funding acquisition: Y.K., S.W.L. and M.S. All authors have read and agreed to the published version of the manuscript.

Funding

This research was funded by the National Research Foundation of Korea: NRF-2020K1A3A7A09078093, NRF-2019R1A2C1007491; the Cultural Heritage Administration, National Research Institute of Cultural Heritage: 2021A01D02-001 (Contribution rate: 30%); the Swiss State Secretariat for Education, Research and Innovation: EG-KR-11–92017; and the Swiss National Science Foundation: 162582.

Institutional Review Board Statement

Not applicable.

Informed Consent Statement

Not applicable.

Data Availability Statement

Data is contained within the article.

Conflicts of Interest

The authors declare no conflict of interest.

References

  1. FAO (Food and Agriculture Organization of the United Nations). Food Outlook—Biannual Report on Global Food Markets; FAO: Rome, Italy, 2015; ISBN 3906570541. [Google Scholar]
  2. Ong, L.; Dagastine, R.R.; Kentish, S.E.; Gras, S.L. The effect of milk processing on the microstructure of the milk fat globule and rennet induced gel observed using confocal laser scanning microscopy. J. Food Sci. 2010, 75, 135–145. [Google Scholar] [CrossRef] [PubMed]
  3. Ong, L.; Dagastine, R.R.; Kentish, S.E.; Gras, S.L. Microstructure of milk gel and cheese curd observed using cryo scanning electron microscopy and confocal microscopy. LWT Food Sci. Technol. 2011, 44, 1291–1302. [Google Scholar] [CrossRef]
  4. McMahon, D.J.; Oommen, B.S. Supramolecular structure of the casein micelle. J. Dairy Sci. 2008, 91, 1709–1721. [Google Scholar] [CrossRef] [PubMed] [Green Version]
  5. Gebhardt, R.; Doster, W.; Friedrich, J.; Kulozik, U. Size distribution of pressure-decomposed casein micelles studied by dynamic light scattering and AFM. Eur. Biophys. J. 2006, 35, 503–509. [Google Scholar] [CrossRef]
  6. Stothart, P.H.; Cebula, D.J. Small-angle neutron scattering study of bovine casein micelles and sub-micelles. J. Mol. Biol. 1982, 160, 391–395. [Google Scholar] [CrossRef]
  7. Tromp, R.H.; Bouwman, W.G. A novel application of neutron scattering on dairy products. Food Hydrocoll. 2007, 21, 154–158. [Google Scholar] [CrossRef]
  8. Van Heijkamp, L.F.; De Schepper, I.M.; Strobl, M.; Hans Tromp, R.; Heringa, J.R.; Bouwman, W.G. Milk gelation studied with small-angle neutron scattering techniques and monte carlo simulations. J. Phys. Chem. A 2010, 114, 2412–2426. [Google Scholar] [CrossRef]
  9. Adams, C.P.; Callaghan-Patrachar, N.; Peyronel, F.; Barker, J.; Pink, D.A.; Marangoni, A.G. Small and ultra-small angle neutron scattering studies of commercial milk. Food Struct. 2019, 21, 100120. [Google Scholar] [CrossRef]
  10. Sandra, S.; Cooper, C.; Alexander, M.; Corredig, M. Coagulation properties of ultrafiltered milk retentates measured using rheology and diffusing wave spectroscopy. Food Res. Int. 2011, 44, 951–956. [Google Scholar] [CrossRef]
  11. Lopez-Rubio, A.; Gilbert, E.P. Neutron scattering: A natural tool for food science and technology research. Trends Food Sci. Technol. 2009, 20, 576–586. [Google Scholar] [CrossRef]
  12. Wood, K.; Mata, J.P.; Garvey, C.J.; Wu, C.M.; Hamilton, W.A.; Abbeywick, P.; Bartlett, D.; Bartsch, F.; Baxter, P.; Booth, N.; et al. QUOKKA, the pinhole small-angle neutron scattering instrument at the OPAL Research Reactor, Australia: Design, performance, operation and scientific highlights. J. Appl. Crystallogr. 2018, 51, 294–314. [Google Scholar] [CrossRef]
  13. Rehm, C.; De Campo, L.; Brûlé, A.; Darmann, F.; Bartsch, F.; Berry, A. Design and performance of the variable-wavelength Bonse-Hart ultra-small-angle neutron scattering diffractometer KOOKABURRA at ANSTO. J. Appl. Crystallogr. 2018, 51, 1–8. [Google Scholar] [CrossRef] [Green Version]
  14. Rekveldt, M.T. Novel SANS instrument using neutron spin echo. Nucl. Instrum. Methods Phys. Res. Sect. B Beam Interact. Mater. At. 1996, 114, 366–370. [Google Scholar] [CrossRef]
  15. Smith, G.N. Revisiting neutron scattering data from deuterated milk. Food Hydrocoll. 2021, 113, 106511. [Google Scholar] [CrossRef]
  16. De Kruif, C.G. The structure of casein micelles: A review of small-angle scattering data. J. Appl. Crystallogr. 2014, 47, 1479–1489. [Google Scholar] [CrossRef]
  17. Shih, W.-H.; Shih, W.Y.; Kim, S.-I.; Liu, J.; Aksay, I.A.A. Scaling behavior ofthe elastic properties of colloidal gels. Phys. Rev. A 1990, 42, 4772. [Google Scholar] [CrossRef]
  18. Strobl, M.; Grünzweig, C.; Hilger, A.; Manke, I.; Kardjilov, N.; David, C.; Pfeiffer, F. Neutron dark-field tomography. Phys. Rev. Lett. 2008, 101, 123902. [Google Scholar] [CrossRef] [PubMed] [Green Version]
  19. Strobl, M. General solution for quantitative dark-field contrast imaging with grating interferometers. Sci. Rep. 2014, 4, 7243. [Google Scholar] [CrossRef] [Green Version]
  20. Strobl, M.; Betz, B.; Harti, R.P.; Hilger, A.; Kardjilov, N.; Manke, I.; Gruenzweig, C. Wavelength-dispersive dark-field contrast: Micrometre structure resolution in neutron imaging with gratings. J. Appl. Crystallogr. 2016, 49, 569–573. [Google Scholar] [CrossRef]
  21. Pfeiffer, F.; Grünzweig, C.; Bunk, O.; Frei, G.; Lehmann, E.; David, C. Neutron phase imaging and tomography. Phys. Rev. Lett. 2006, 96, 215505. [Google Scholar] [CrossRef] [Green Version]
  22. Strobl, M.; Harti, R.P.; Gruenzweig, C.; Woracek, R.; Plomp, J.; Grünzweig, C. Plomp Small Angle Scattering in Neutron Imaging—A Review. J. Imaging 2018, 3, 64. [Google Scholar] [CrossRef] [Green Version]
  23. Kim, Y.; Valsecchi, J.; Kim, J.; Lee, S.W.; Strobl, M. Symmetric Talbot-Lau neutron grating interferometry and incoherent scattering correction for quantitative dark-field imaging. Sci. Rep. 2019, 9, 18973. [Google Scholar] [CrossRef] [PubMed] [Green Version]
  24. Strobl, M.; Tremsin, A.S.; Hilger, A.; Wieder, F.; Kardjilov, N.; Manke, I.; Bouwman, W.G.; Plomp, J. TOF-SEMSANS—Time-of-flight spin-echo modulated small-angle neutron scattering. J. Appl. Phys. 2015, 112, 014503. [Google Scholar] [CrossRef] [Green Version]
  25. Strobl, M.; Wieder, F.; Duif, C.P.; Hilger, A.; Kardjilov, N.; Manke, I.; Bouwman, W.G. Using a grating analyser for SEMSANS investigations in the very small angle range. Phys. B Condens. Matter 2012, 407, 4132–4135. [Google Scholar] [CrossRef]
  26. Andersson, R.; Van Heijkamp, L.F.; De Schepper, I.M.; Bouwman, W.G. Analysis of spin-echo small-angle neutron scattering measurements. J. Appl. Crystallogr. 2008, 41, 868–885. [Google Scholar] [CrossRef]
  27. Morgano, M.; Peetermans, S.; Lehmann, E.H.; Panzner, T.; Filges, U. Neutron imaging options at the BOA beamline at Paul Scherrer Institut. Nucl. Instrum. Methods Phys. Res. Sect. A Accel. Spectrometers Detect. Assoc. Equip. 2014, 754, 46–56. [Google Scholar] [CrossRef]
  28. Kim, J.; Lee, K.H.; Lim, C.H.; Kim, T.; Ahn, C.W.; Cho, G.; Lee, S.W. Fabrication and characterization of the source grating for visibility improvement of neutron phase imaging with gratings. Rev. Sci. Instrum. 2013, 84, 063705. [Google Scholar] [CrossRef]
  29. Uca, O.; Bouwman, W.G.; Rekveld, M.T. Model calculations for the spin-echo small-angle neutron-scattering correlation function. J. Appl. Crystallogr. 2003, 36, 109–116. [Google Scholar] [CrossRef]
  30. Ashcroft, N.W.; March, N.H. Structure factor and direct correlation function for a classical hard sphere fluid. Proc. R. Soc. London. Ser. A. Math. Phys. Sci. 1967, 297, 336–350. [Google Scholar] [CrossRef]
  31. Lazzari, S.; Nicoud, L.; Jaquet, B.; Lattuada, M.; Morbidelli, M. Fractal-like structures in colloid science. Adv. Colloid Interface Sci. 2016, 235, 1–13. [Google Scholar] [CrossRef] [Green Version]
  32. Bakker, J.H.; Washington, A.L.; Parnell, S.R.; van Well, A.A.; Pappas, C.; Bouwman, W.G. Analysis of SESANS data by numerical Hankel transform implementation in SasView. J. Neutron Res. 2020, 22, 57–70. [Google Scholar] [CrossRef]
  33. De Kruif, C.G.; Holt, C. Casein micelle structure, functions and interactions. In Advanced Dairy Chemistry—Proteins, 1, 3rd ed.; Fox, P.F., McSweeney, P.L.H., Eds.; Kluwer Academic/Plenum Publishers: New York, NY, USA, 2003; pp. 233–276. [Google Scholar]
  34. Andoyo, R.; Guyomarc’h, F.; Burel, A.; Famelart, M.-H. Spatial arrangement of casein micelles and whey protein aggregate in acid gels: Insight on mechanisms. Food Hydrocoll. 2015, 51, 118–128. [Google Scholar] [CrossRef]
  35. Andoyo, R.; Lestari, V.D.; Mardawati, E.; Nurhadi, B. Fractal Dimension Analysis of Texture Formation of Whey Protein-Based Foods. Int. J. Food Sci. 2018, 2018, 7673259. [Google Scholar] [CrossRef] [PubMed]
Figure 1. The deuterated milk samples. (a) Diluted milk powders in D2O solvent and (b) milk gels manufactured from diluted milk powders by acidification (marked “GA”) and rennet-induction (marked “GP”).
Applsci 12 00833 g001
Figure 2. Schematics of the Talbot–Lau neutron grating interferometer.
Applsci 12 00833 g002
Figure 3. Schematic representation of the milk structure (fat globules and casein micelles) and the gelation process.
Applsci 12 00833 g003
Figure 4. (a) Attenuation contrast image (AI) and dark-field images (DFI) of deuterated milk samples with different volume fractions of fat at probed correlation lengths of 130 nm and 3.131 μm; (b) Attenuation contrast image (AI) and dark-field images (DFI) of milk gel samples at probed correlation lengths of 130 nm and 3.131 μm; scale bar is 10 mm.
Applsci 12 00833 g004
Figure 5. (a) Dark-field image (DFI) contrast of the diluted milk over probed correlation length. The solid lines represent fits by projected real-space correlation functions of the polydisperse interacting hard-sphere model for fat globules (FG), and the dashed lines represent the results of simple isolated monodisperse hard-sphere model. (b) The log-normal size distribution of the polydisperse FG modelled for the different deuterated milk samples. (Color in online).
Applsci 12 00833 g005
Figure 6. Total neutron scattering dependence on sample height. Right-hand-side illustration illustrates the ROIs utilized for height dependent data points.
Applsci 12 00833 g006
Figure 7. (a) Dark-field contrast of the deuterated milk gels over probed correlation length. The solid lines represent fits by projected real-space correlation functions. The fractal network model was fitted to the skim rennet gel (GP Skim) and the skim acidified gel (GA Skim), and a polydisperse interacting the hard-sphere model was used to model the FG in the reduced rennet gel (GP Fat) and the acidified gel (GA Fat) data. (b) The modelled log-normal size distribution of FG in the fat milk gels. (Color in online).
Applsci 12 00833 g007
Table 1. The detailed parameters of the Talbot–Lau neutron-grating interferometer.
Effective wavelength (Å) λ 4.1
Fractional Talbot order n 1
Inter-grating distance (mm)G0 − G1 (L1)1420
G1 − G2 (L2)1420
Period of gratings (μm)pg (p0 = p1 = p2)50
Height of gratings (μm)h0100 (Gadox)
h134.39 (Silicon)
h220 (Gadox)
Duty cycle of gratingsd00.75
d10.5
d20.5
Table 2. Structural parameters and goodness of fits for fat globules (FG) in the deuterated milk samples with different fat contents derived using the simple isolated monodisperse hard-sphere model.
Milk Sample Σ s t r   ( μ m ) R 2 Adjusted   R 2
5 wt%0.28050.09370.99750.9965
10 wt%0.42990.13930.98410.9778
25 wt%0.94540.18120.91560.8818
50 wt%1.43600.16470.54220.3591
Table 3. Structural parameters and goodness of fits for fat globules (FG) in the deuterated milk samples with different fat contents derived using a model for polydisperse interacting spheres (Equations (7)–(13)).
Milk Sample Σ s t μ σ r 0   ( μ m ) r   ( μ m ) R 2 Adjusted   R 2
5 wt%0.2974−16.71941.48990.05500.16680.99960.9993
10 wt%0.4845−15.77391.41560.14110.38430.99990.9998
25 wt%1.0627−15.31921.06700.22230.39280.99800.9966
50 wt%1.5560−15.45240.87500.19460.28530.97310.9530
Table 4. Structural parameters and goodness of fits for the fractal network of casein micelles (CM) in the deuterated skim milk gels.
Gel Sample Σ s t α   ( μ m ) H D f R 2 Adjusted   R 2
GA Skim0.39310.2170−0.12012.75980.96720.9425
GP Skim0.32140.3545−0.22872.54270.86770.7684
Table 5. The structural parameters and goodness of fits for fat globules (FG) in the fat milk gel.
Gel Sample Σ s t μ σ r 0   ( μ m ) r   ( μ m ) R 2 Adjusted   R 2
GA Fat0.4141−14.55360.99060.47810.78080.98980.9822
GP Fat0.9128−14.93361.14490.32690.63000.99730.9953
Publisher’s Note: MDPI stays neutral with regard to jurisdictional claims in published maps and institutional affiliations.

