
Documenting Archaeological Petroglyph Sites with the Use of 3D Terrestrial Laser Scanners—A Case Study of Petroglyphs in Kyrgyzstan


Abstract
:1. Introduction
- I.
- Adaptation of the 3DScaMITE [9] methodology, developed for scanning cultural heritage objects with 3D TLS, to the scanning of petroglyphs in the places of their occurrence.
- II.
- Verification of the proposed adaptation during the scanning of petroglyphs at The Petroglyphs of Cholpon-Ata Museum in Kyrgyzstan.
- III.
- Verification of the usefulness of the obtained data to confirm or reject the thesis about improper conservation of petroglyphs.
- Section 2 provides an overview of publications on documenting rock art and the methods of its protection;
- Section 3 discusses the main aspects of 3D TLS scanning, and presents modifications to the 3DScaMITE methodology for petroglyph scanning tasks;
- Section 4 discusses the effects of scanning petroglyphs at Cholpon-Ata and discusses the results in terms of confirming the thesis about the improper conservation of petroglyphs.
2. Rock Art Documentation
3. Contemporary 3D TLS and the Methodology of Their Use for Documenting Archaeological Artefacts
3.1. TLS Scanners
- Use of an external camera/digital camera mounted in a special holder and synchronized with the scanner.
- Use of a built-in spherical camera or set of cameras permanently installed in the scanner housing.
- Use of a built-in camera using the same optical path as the laser measurement.
3.2. Scanning Methodology
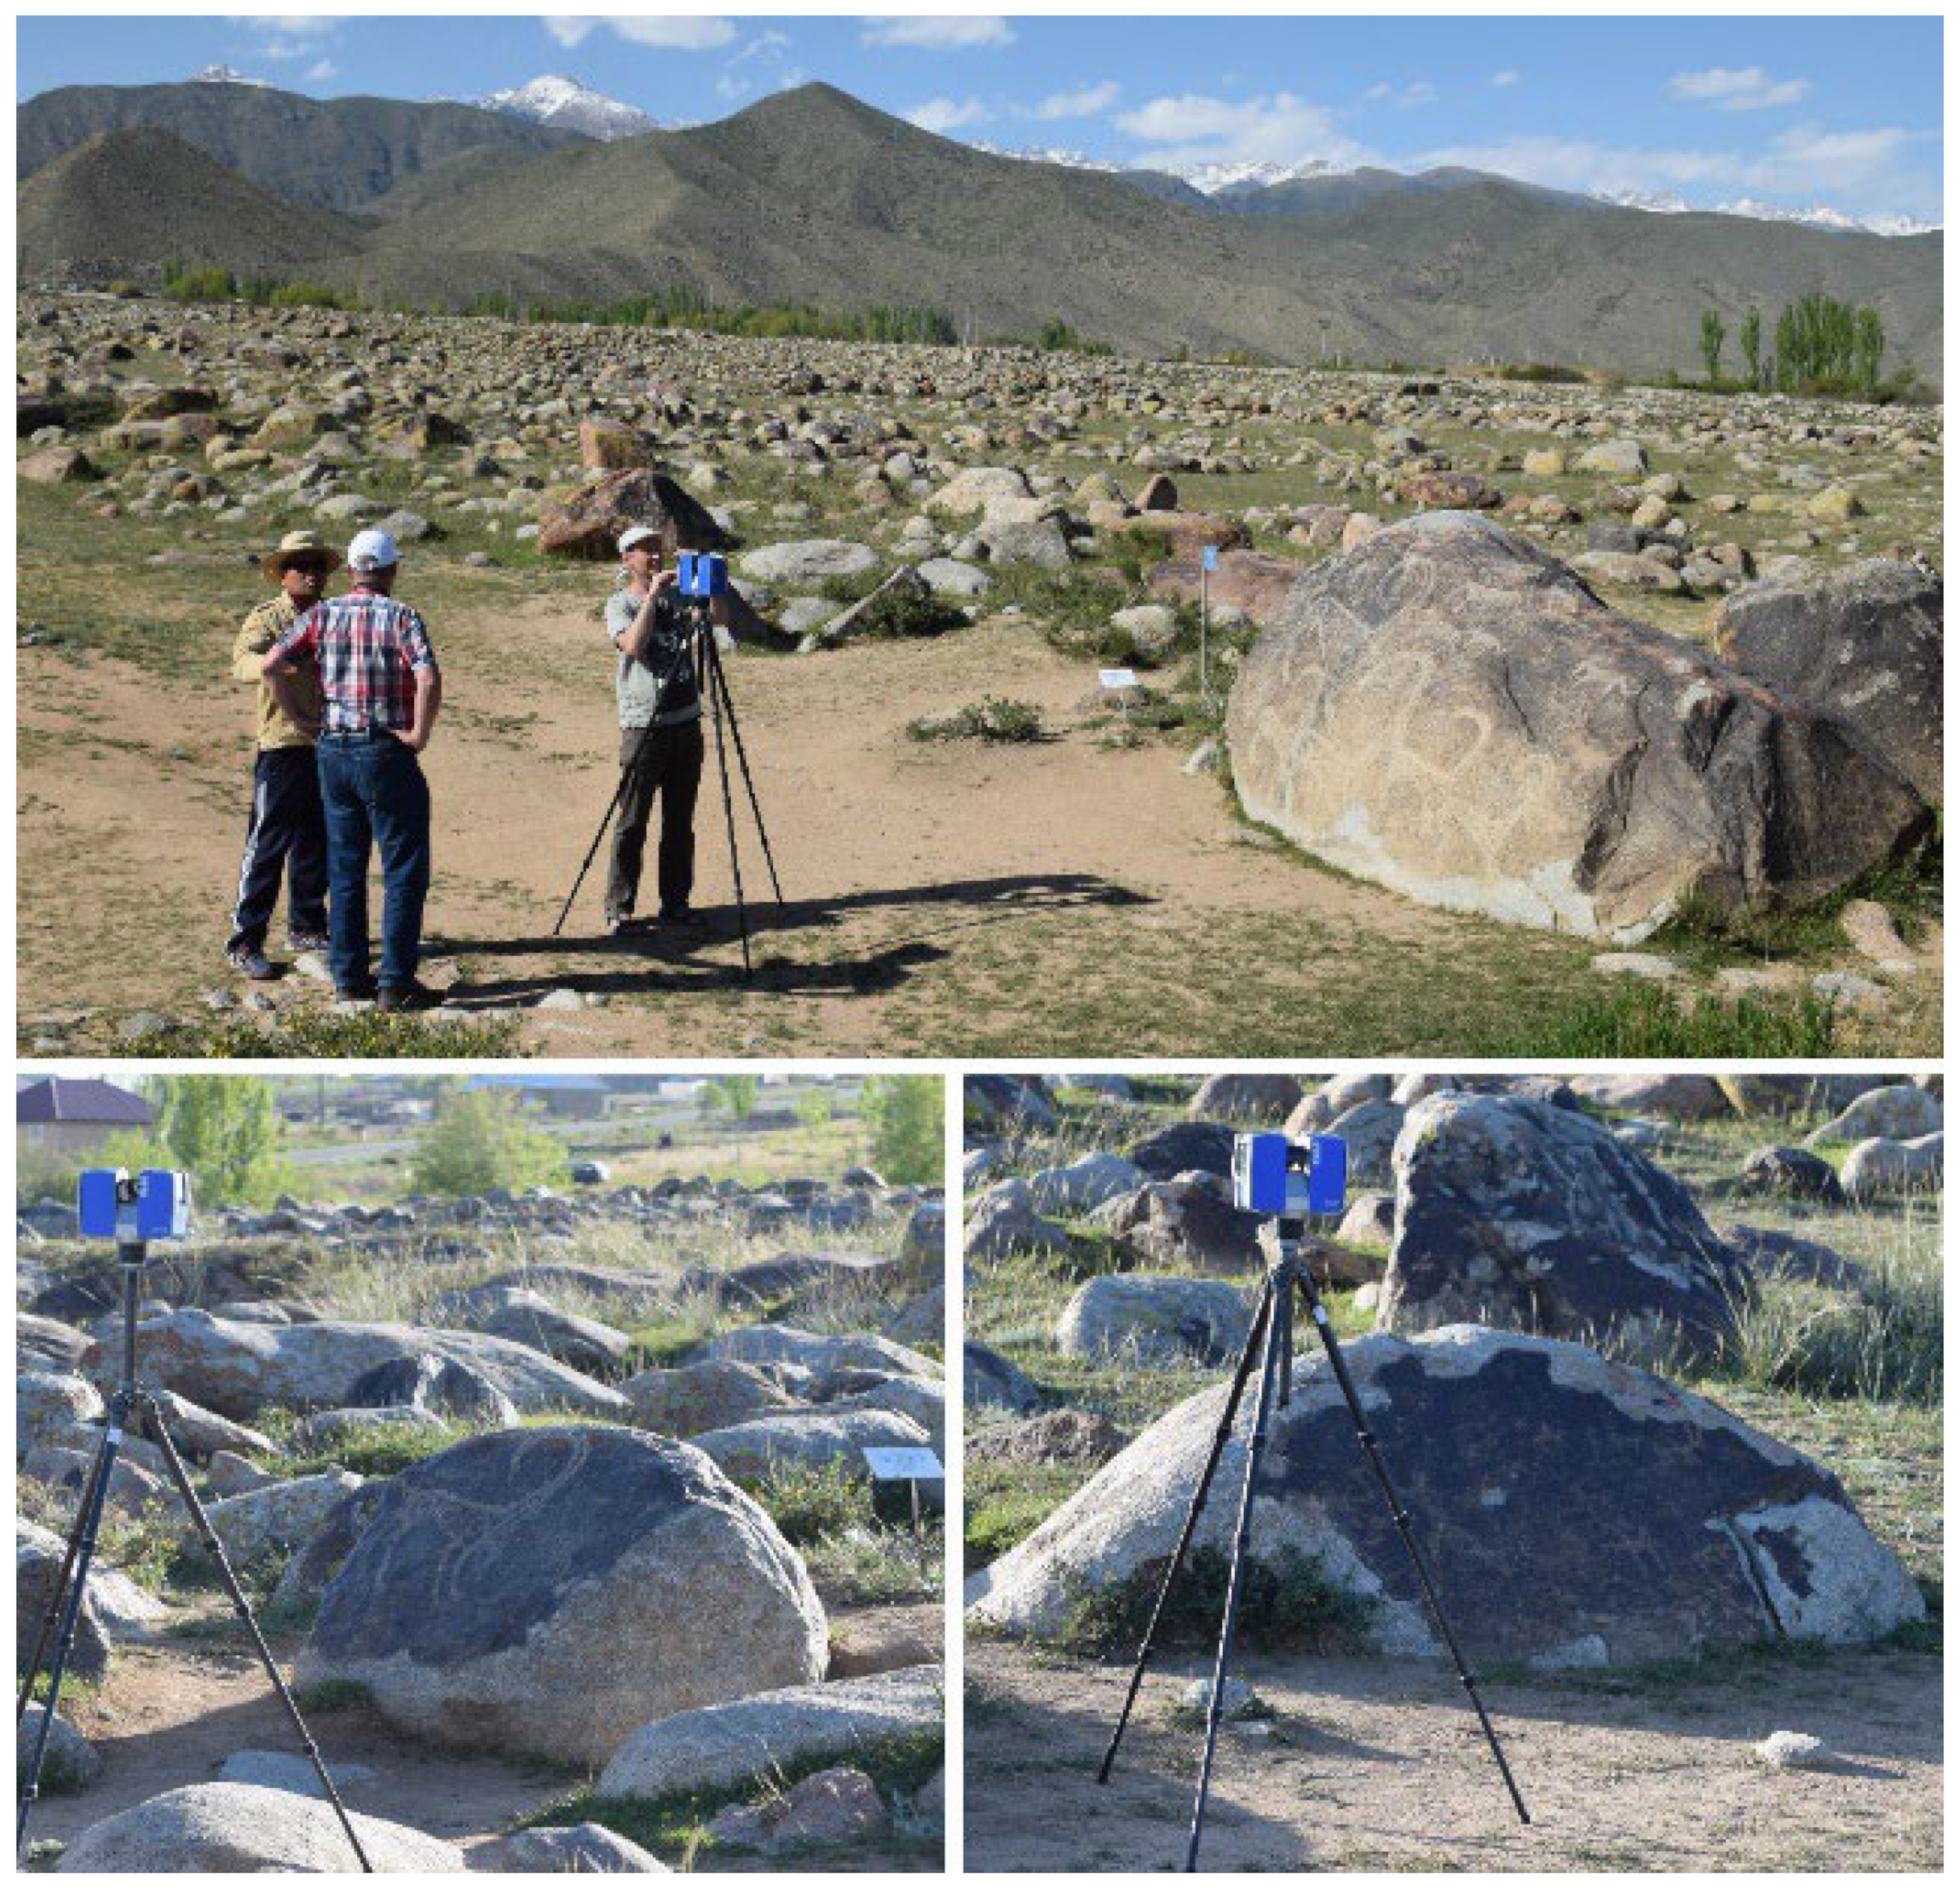
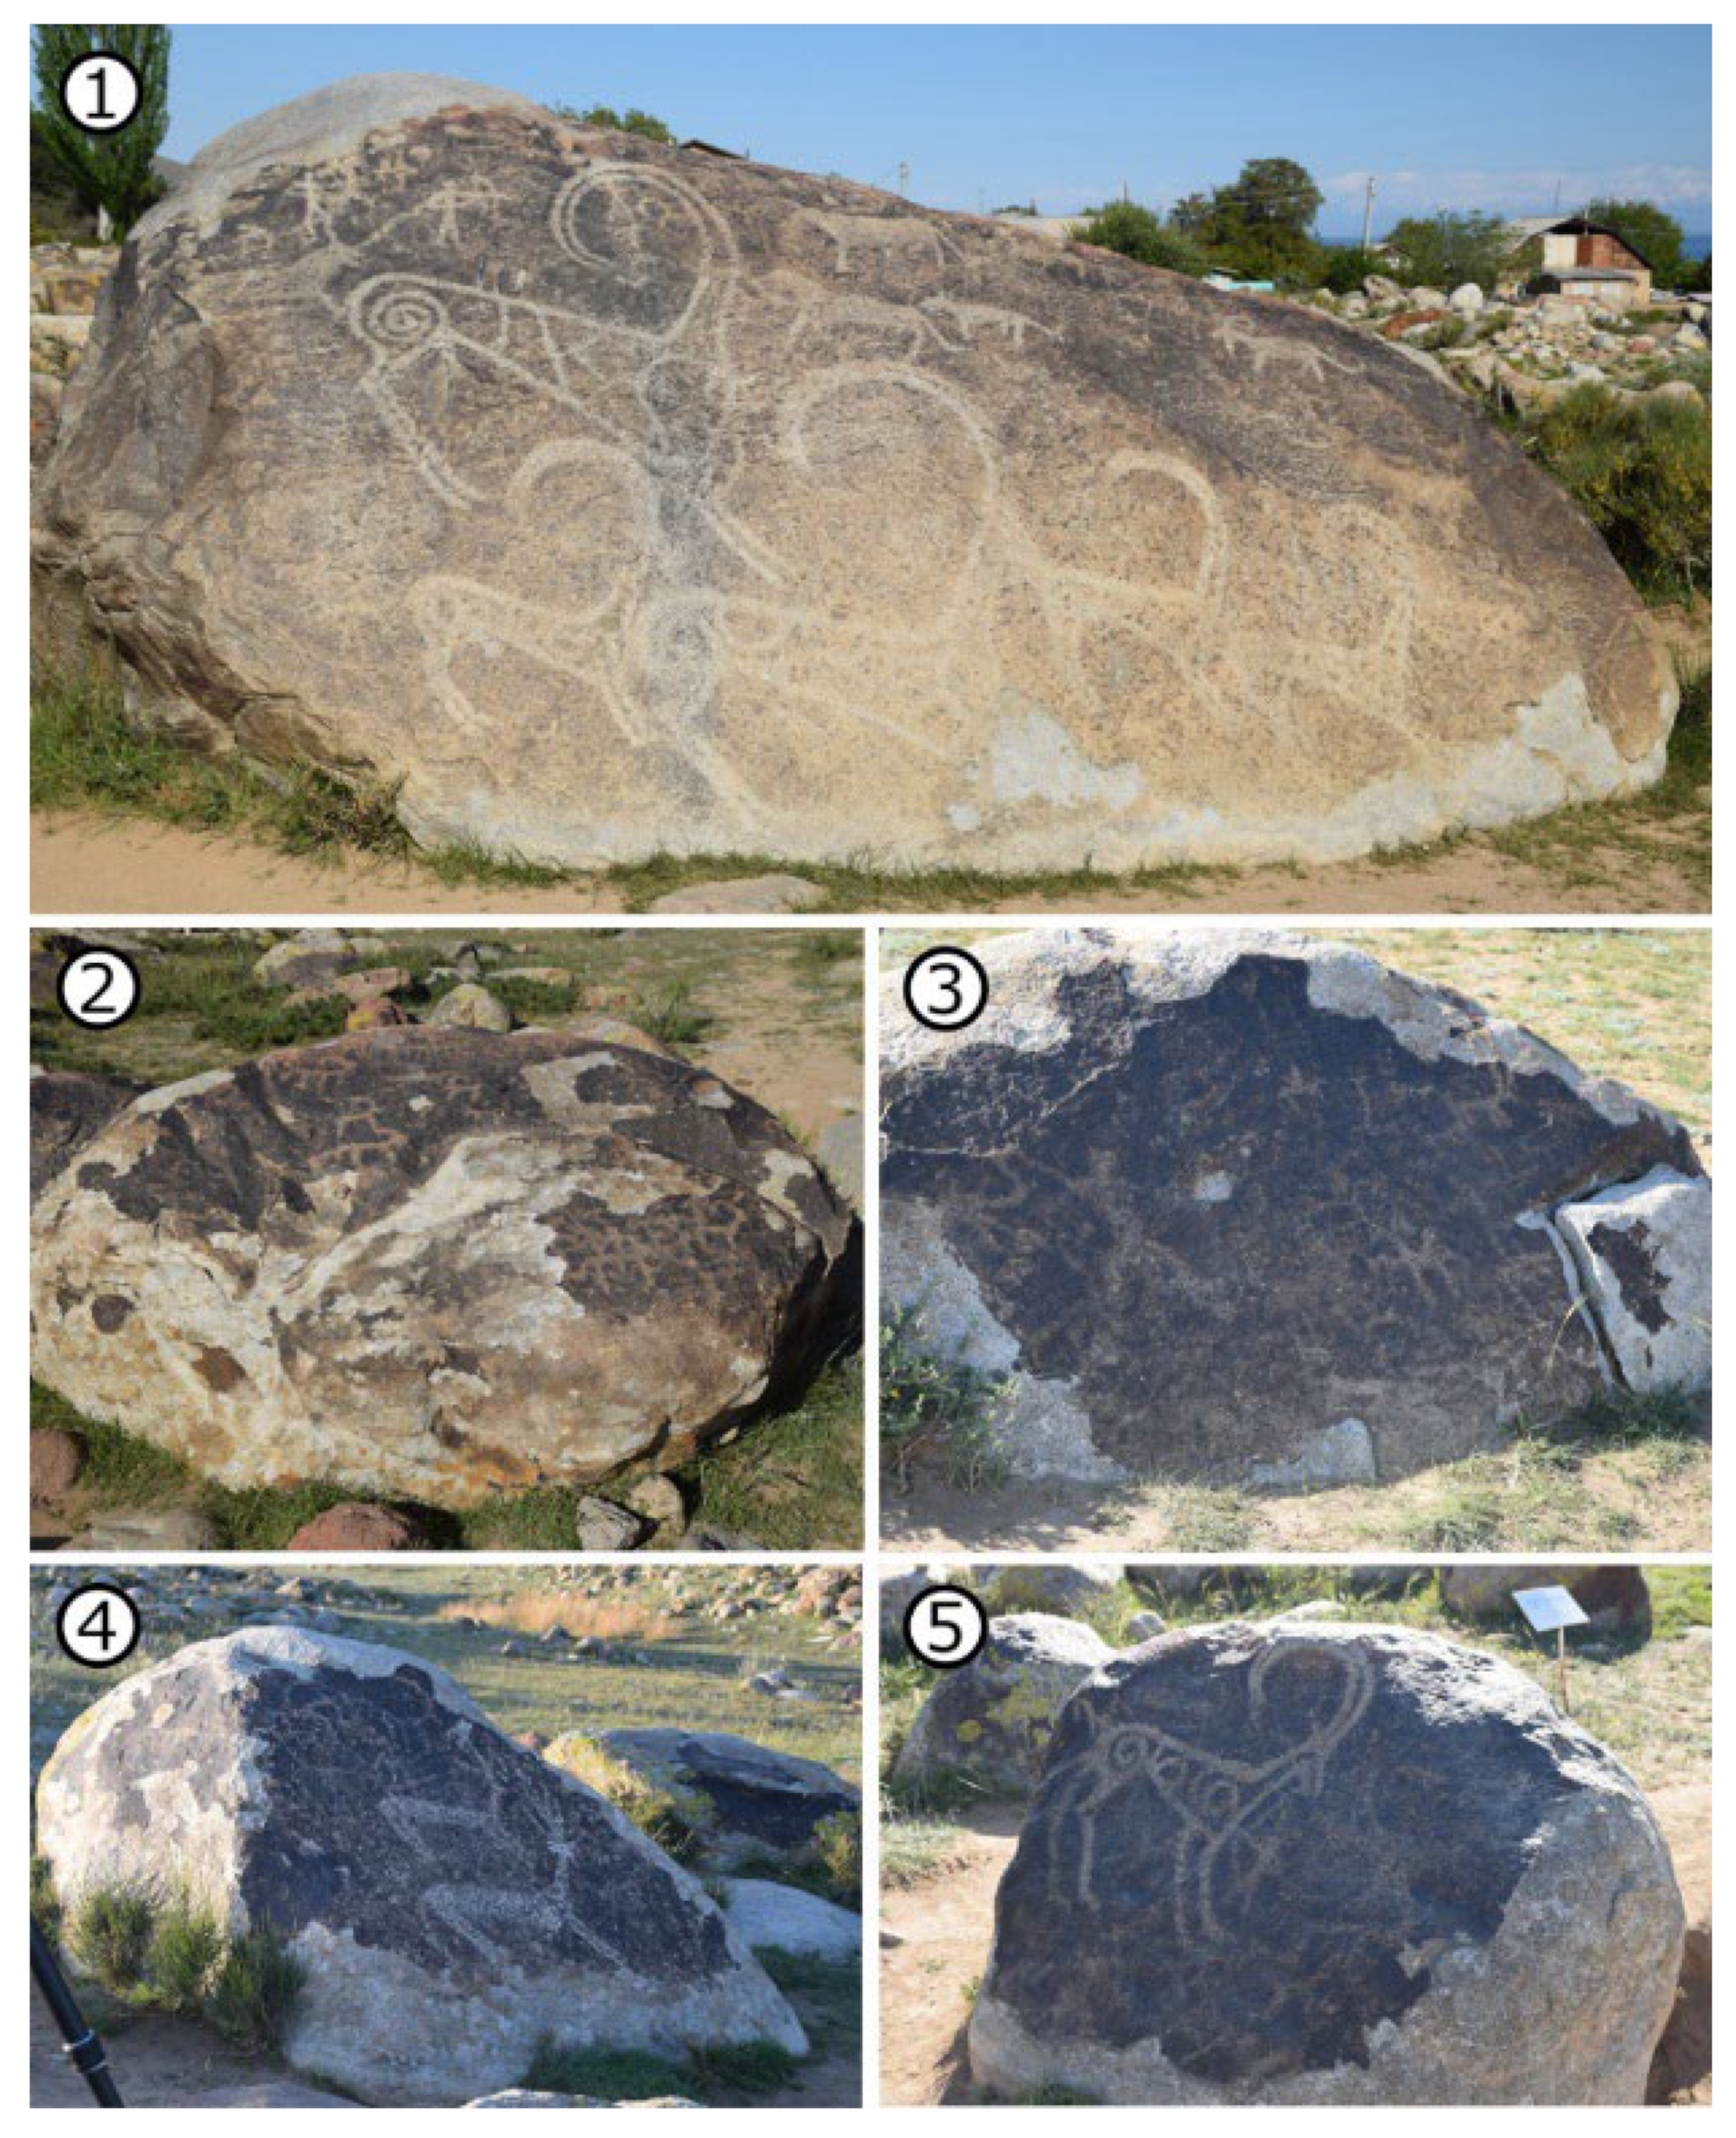
4. Petroglyphs at Cholpon-Ata, Kyrgyzstan and Their Scanning
5. Scanning Results and Discussion
6. Conclusions
Author Contributions
Funding
Institutional Review Board Statement
Informed Consent Statement
Acknowledgments
Conflicts of Interest
References
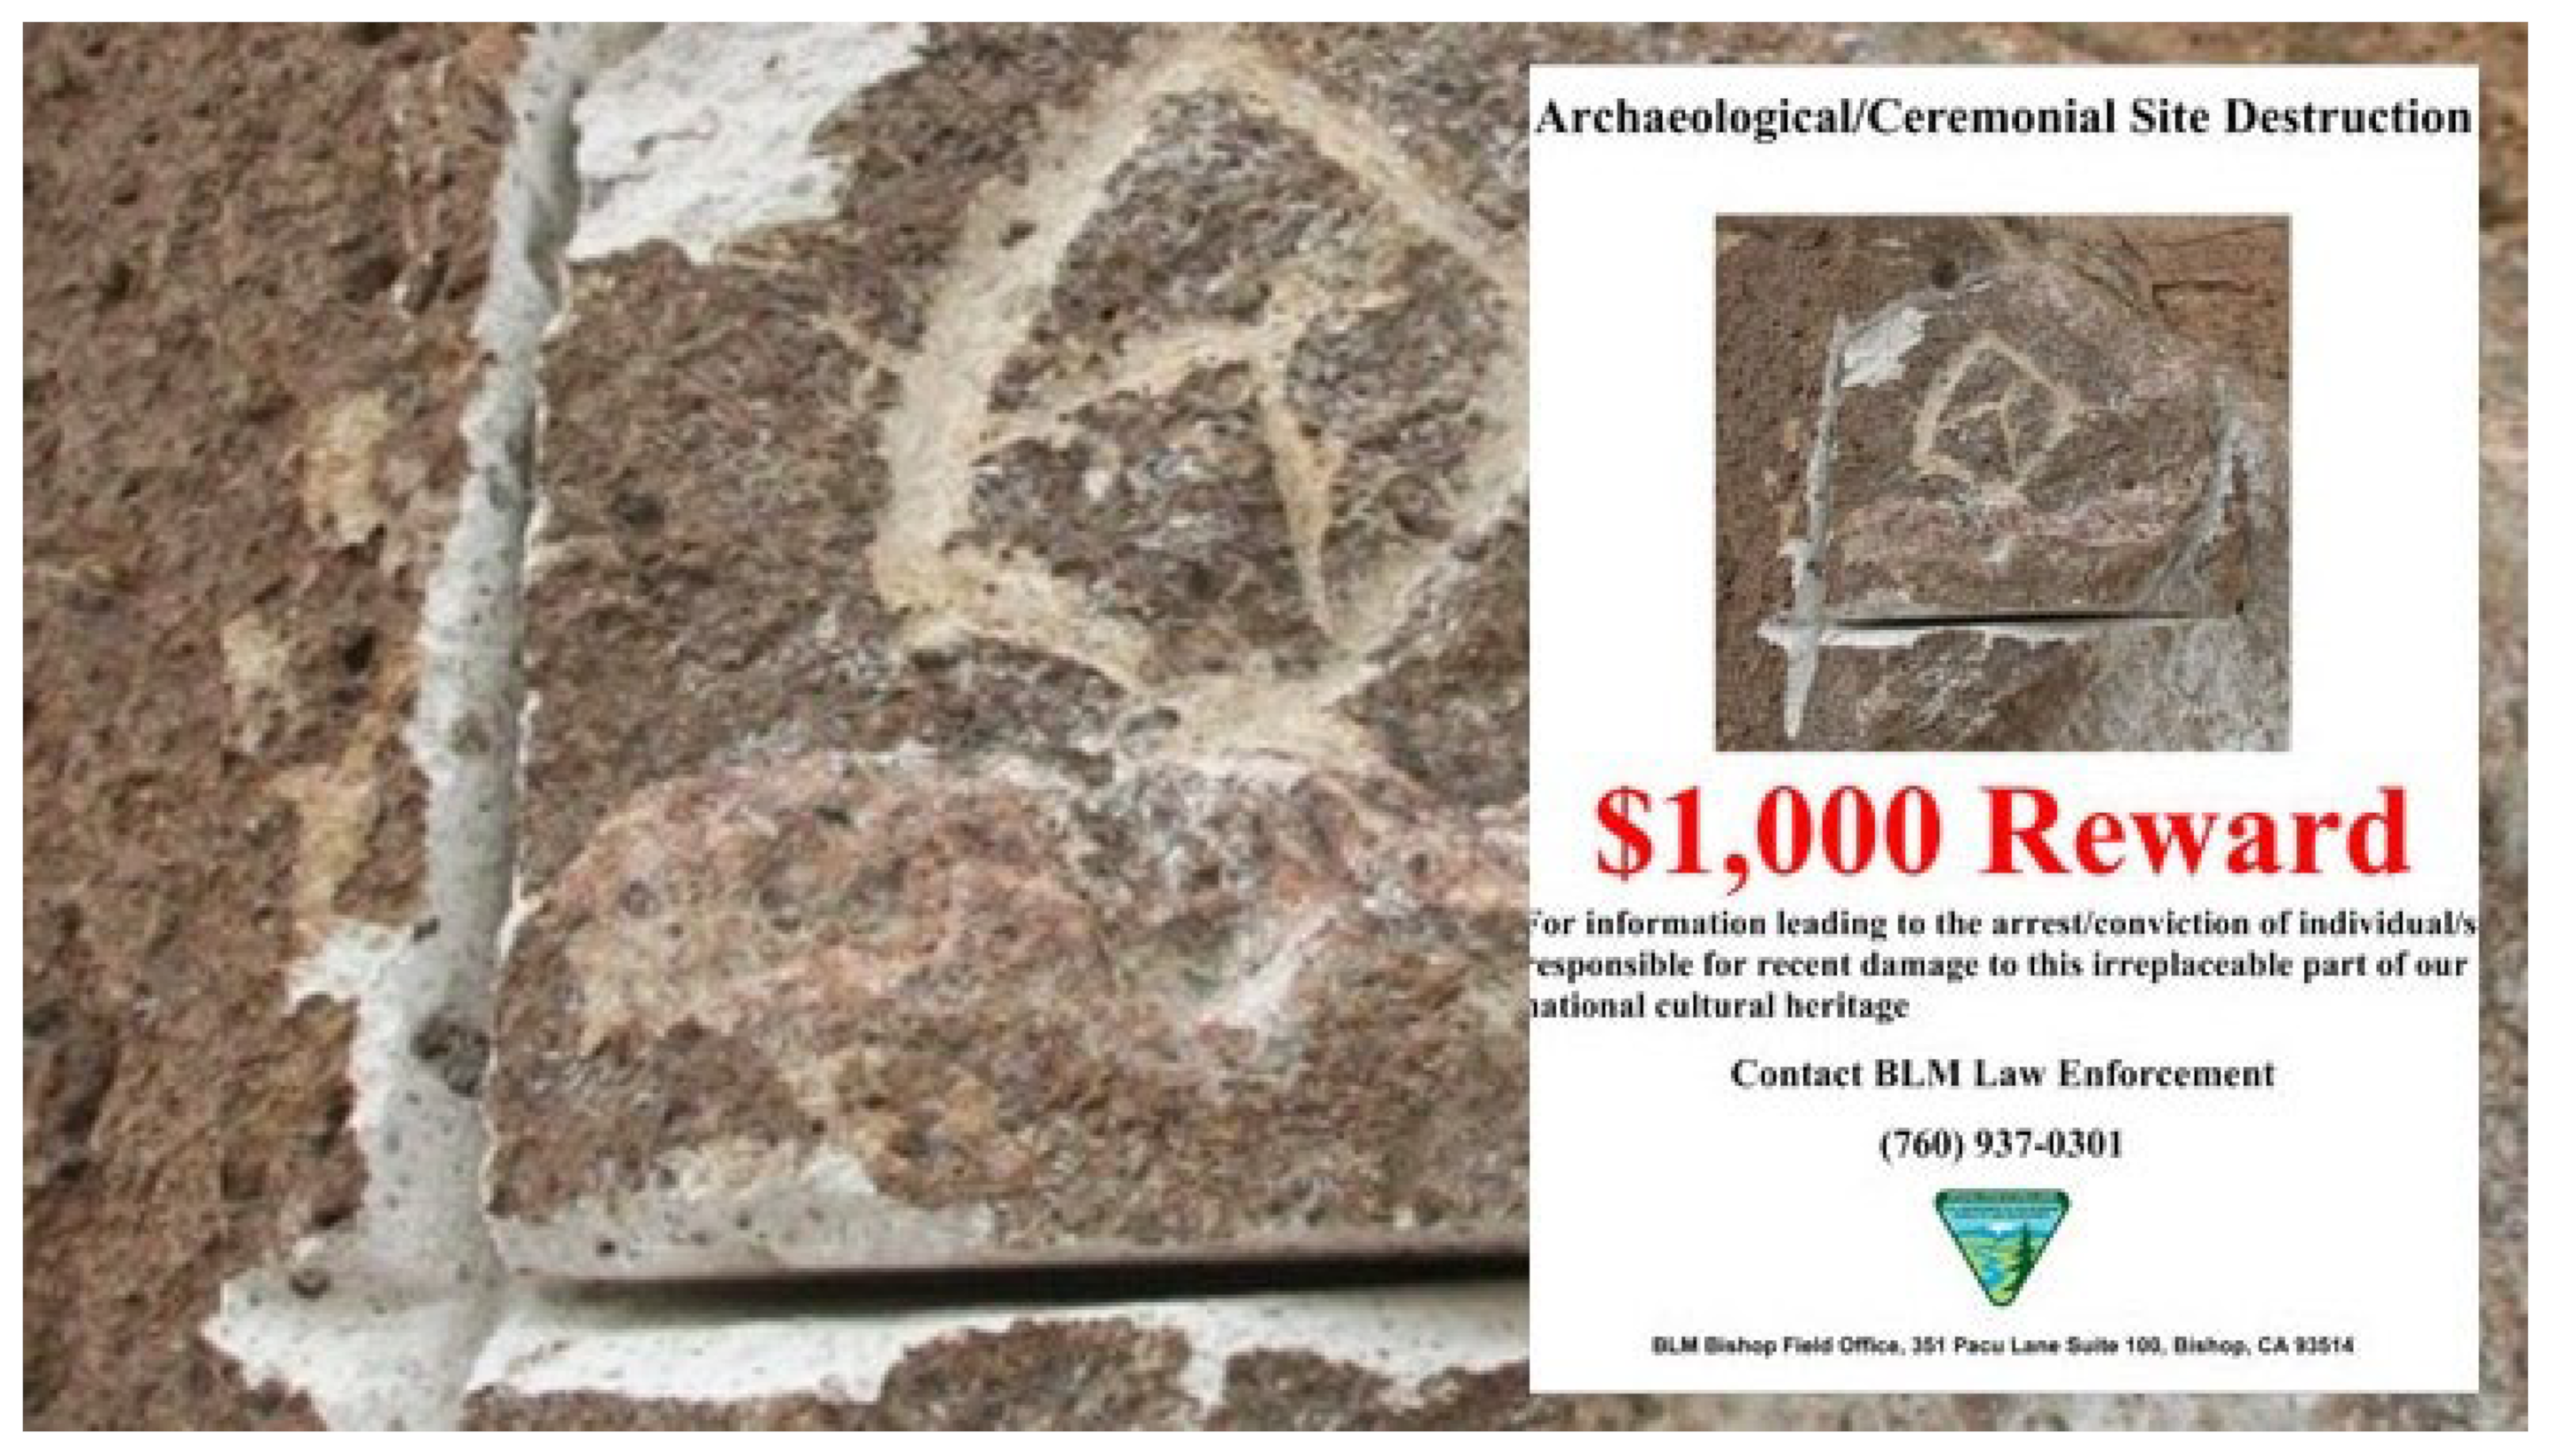
- The “Wanted” Poster for Petroglyph Theft, Released in Fox News Site. Available online: https://static.foxnews.com/static/managed/img/Scitech/damage%20to%20rock%20art%20Sierra%20Nevadas.jpg (accessed on 15 October 2022).
- Thevenot, C.G. Stolen Petroglyph Returns to Canyon after Rocky Journey. Las Vegas Journal. 2011. Available online: https://www.reviewjournal.com/crime/courts/stolen-petroglyph-returns-to-canyon-after-rocky-journey/ (accessed on 15 July 2022).
- Ogilvie, F. The Art of Stealing. ABS News. 2019. Available online: https://www.abc.net.au/news/2019-11-10/aboriginal-petroAvailableonline:glyphs-stolen-and-missing-from-tasmania/11663382?nw=0 (accessed on 15 July 2022).
- Vasyukova, Y. Petroglify Khabarovskogo Kraya Rastaskivayut na Suveniry a Politsiya Bessil’na. HabInfo. 2017. Available online: https://habinfo.ru/petroglify-razvorovyvayut/ (accessed on 15 July 2022).
- Ryan, S. Vandalism and Petroglyphs. Archaeology Southwest. 2020. Available online: https://www.archaeologysouthwest.org/2020/03/16/vandalism-and-petroglyphs/ (accessed on 17 July 2022).
- Vandalizm nad Petroglifami v Oshe—Informatsiyu Napravyat v Militsiyu. Available online: https://ru.sputnik.kg/society/20200915/1049625110/kyrgyzstan-petroglif-vandalizm.html (accessed on 20 March 2022).
- Aleksandrov, Y. Khoteli kak luchshe… Kirgizskiye “Restavratory” Sterli Unikal’nyye Petroglify. CentrAsia 2004. Available online: https://centrasia.org/newsA.php?st=1083311700 (accessed on 15 October 2022).
- Taube, M.; Chelazzi, D. The removal of aged acrylic coatings from wall paintings using microemulsions. In Proceedings of the 17th Triennial Conference 2014 Melbourne Murals Stone and Rock Art 2014, Melbourne, Australia, 15–19 September 2014. [Google Scholar]
- Milosz, M.; Kęsik, J.; Montusiewicz, J. 3D Scanning and Visualization of Large Monuments of Timurid Architecture in Central Asia—A Methodical Approach. J. Comput. Cult. Herit. 2021, 14, 31. [Google Scholar] [CrossRef]
- Enkhbat, G. The Creation of a Registration and Information Database for Cultural Heritage in Mongolia. In New Horizons for Asian Museums and Museology; Sonoda, N., Ed.; Springer: Singapore, 2016. [Google Scholar] [CrossRef] [Green Version]
- Леванoва, Е.С.; Кoрoль, Г.Г. Оснoвные Направления Научных Изыскаий Е.Г. Дэвлет. Краткие Сooбщения Института Археoлoгии 2019, 257, 408–421. [Google Scholar]
- Angás, J.; Jasim, S.A.; Bea, M.; Farjas, M.; Uribe, P.; Lanau, P.; Otero, X. Rock Art Recording in Khatm Al Melaha (United Arab Emirates): Multirange Data Scanning and Web Mapping Technologies. Int. Arch. Photogramm. Remote Sens. Spat. Inf. Sci. 2019, 42, 85–92. [Google Scholar] [CrossRef] [Green Version]
- Tomášková, S. Digital technologies in context: Prehistoric engravings in the Northern Cape South Africa. Digit. Appl. Archaeol. Cult. Herit. 2015, 2, 2–3. [Google Scholar] [CrossRef]
- Hurst, S.; Louden, E.; Johnson, E. Unravelingthe Cowhead Mesa petroglyphs with 3-D laser scanning and high-resolution digital photography. Rock Art. 2009, 26, 45–53. [Google Scholar] [CrossRef]
- Kipnis, R.; Santos, H.B.C.; Tizuka, M.M.; Almeida, M.J.G.T.; Corga, M.P. Application of 3D modeling technologies combined with traditional techniques for registering rock engravings in the Madeira River, Rondônia, Brazil. Bol. Mus. Para. Emílio Goeldi. Ciências Hum. 2013, 8, 605–619. [Google Scholar] [CrossRef]
- Berquista, S.; Spence-Morrow, G.; Gonzalez-Macqueen, F.; Rizzuto, B.; Álvarez, W.Y.; Bautista, S.; Jennings, J. A new aerial photogrammetric survey method for recording inaccessible rock art. Digit. Appl. Archaeol. Cult. Herit. 2018, 8, 46–56. [Google Scholar] [CrossRef]
- Davis, A.; Belton, D.; Helmholz, P.; Bourke, P.; McDonald, J. Pilbara rock art: Laser scanning, photogrammetry and 3D photographic reconstruction as heritage management tools. Herit. Sci. 2017, 5, 25. [Google Scholar] [CrossRef] [Green Version]
- Fryer, J.G.; Chandler, J.H.; El-Hakim, S.F. Recording and Modelling an Aboriginal Cave Painting: With or Without Laser Scanning? in TS5—3D Techniques for Heritage Applications, ISPRS Archives. 2018. Available online: https://www.isprs.org/proceedings/XXXVI/5-W17/pdf/3.pdf (accessed on 10 September 2022).
- Díaz-Guardamino, M.; Sanjuán, L.G.; Wheatley, D.; Zamora, V.R. RTI and the study of engraved rock art: A re-examination of the Iberian south-western stelae of Setefilla and Almadén de la Plata 2 (Seville, Spain). Digit. Appl. Archaeol. Cult. Herit. 2015, 2, 41–54. [Google Scholar] [CrossRef]
- Díaz-Guardamino, M.; Wheatley, D. Rock art and digital technologies: The application of Reflectance Transformation Imaging (RTI) and 3D laser scanning to the study of Late Bronze Age Iberian stelae. Rev. Prehist. Andal. J. Andal. Prehistory 2013, 4, 187–203. [Google Scholar]
- Bendichoa, V.M.L.-M.; Ortegab, Á.M.; Vincentc, M.L.; Martín-Buitragoa, Á.J.C.; Pintadoa, J.O. Uso Combinado de la Fotografía Digital Nocturna y de la Fotogrametría en Los Procesos de Documentación de Petroglifos: El Caso de Alcázar de San Juan (Ciudad Real, España). Virtual Archaeol. Rev. 2017, 8, 64–74. [Google Scholar] [CrossRef]
- Sanz, J.O.; Docampo, M.D.L.L.G.; Rodríguez, S.M.; Sanmartín, M.T.R.; Cameselle, G.M. A Simple Methodology for Recording Petroglyphs Using Low-Cost Digital Image Correlation. J. Archaeol. Sci. 2010, 37, 3158–3169. [Google Scholar] [CrossRef]
- Ochoa, B.; García-Diez, M.; Domingo, I.; Martins, A. Dating Iberian prehistoric rock art: Methods, sampling, data, limits and interpretations. Quat. Int. 2021, 572, 88–105. [Google Scholar] [CrossRef]
- Horn, C. The cunning of the fox: A case of zoomorphism in Scandinavian rock art. In Giving the Past a Future: Essays in Archaeology and Rock Art Studies in Honour of Dr Phil. h.c. Gherhard Milstreu; Dodd, J., Meijer, E., Eds.; Archaeopress: Oxford, UK, 2018; pp. 143–152. [Google Scholar]
- Horn, C.; Ling, J.; Bertilsson, U.; Potter, R. By All Means Necessary—2.5D and 3D Recording of Surfaces in the Study of Southern Scandinavian Rock Art. Open Archaeol. 2017, 4, 81–96. [Google Scholar] [CrossRef]
- Horn, C.; Ivarsson, O.; Lindhé, C.; Potter, R.; Green, A.; Ling, J. Artificial Intelligence, 3D Documentation, and Rock Art—Approaching and Reflecting on the Automation of Identification and Classification of Rock Art Images. J. Archaeol. Method Theory 2021, 29, 188–213. [Google Scholar] [CrossRef]
- Höll, T.; Holler, G.; Pinz, A. A Novel High Accuracy 3D Scanning Device for Rock-Art Sites. Int. Arch. Photogramm. Remote Sens. Spat. Inf. Sci. 2014, 40, 285. [Google Scholar] [CrossRef] [Green Version]
- Forgia, V.; Sineo, L. Within the symbolic world of the Paleolithic hunters: A GIS-based and 3D model analysis of sites with complexes of linear incisions in western Sicily. Digit. Appl. Archaeol. Cult. Herit. 2021, 20, e00175. [Google Scholar] [CrossRef]
- Trinks, I.; Díaz-Andreu, M.; Hobbs, R.; Sharpe, K.E. Digital rock art recording: Visualising petroglyphs using 3D laser scanner data. Rock Art Res. 2005, 22, 131–139. [Google Scholar]
- Lesvignes, E.; Robert, E.; Valentin, B. Using digital techniques to document prehistoric rock art: First approaches on the engraved panels of the Paris Basin shelters. Digit. Appl. Archaeol. Cult. Herit. 2019, 15, e00122. [Google Scholar] [CrossRef]
- Zainuddin, K.; Majid, Z.; Ariff, M.F.M.; Idris, K.M.; Abbas, M.A.; Darwin, N. 3D Modeling for Rock Art Documentation using Lightweight Multispectral Camera. Int. Arch. Photogramm. Remote Sens. Spat. Inf. Sci. 2019, 42, 787–793. [Google Scholar] [CrossRef] [Green Version]
- Horna, C.; Pitmanb, D.; Potterc, R. An evaluation of the visualisation and interpretive potential of applying GIS data processing techniques to 3D rock art data. J. Archaeol. Sci. Rep. 2019, 27, 101971. [Google Scholar] [CrossRef]
- Fuentes-Portoa, A.; García-Ávilab, C.; Marrero-Salasc, E. Casa del samarín, una estación de grabados rupestres en deterioro. documentación, análisis y diagnóstico en los llanos de ifara, Granadilla, Tenerife. Virtual Archaeol. Rev. 2020, 12, 99–114. [Google Scholar] [CrossRef]
- Jarosz, K. The Attractiveness of Cholpon Ata Resort and the Museum of Petroglyphs as a Tourist Destination. Folia Tur. 2017, 44, 9–29. [Google Scholar] [CrossRef]
- 3rd Scientific Expedition of the Lublin University of Technology to Central Asia. Part 1—Kyrgystan. 13–17 May 2019. Available online: https://cs.pollub.pl/3-naukowa-ekspedycja-politechniki-lubelskiej-do-centralnej-azji-czesc-1-kirgistan-13-17-maja-2019/?lang=en (accessed on 20 September 2022).
- Hermann, L. Les Pétroglyphes de Tcholpon-Ata au Kirghizstan; BoD-Books on Demand France: Paris, France, 2010. [Google Scholar]
- Baglionia, M.; Benavidesa, Y.J.; Desprat-Drapelab, A.; Giorgia, R. Amphiphile-based nanofludis for the removal of styrene/acrylate coatings: Cleaning of stucco decoration in the Uaxactun archeological site (Guatemala). J. Cult. Herit. 2015, 16, 862–868. [Google Scholar] [CrossRef]
- Giné, A.B.; Ortega, S.M.; Pons, P.R. The removal of Paraloid® coatings with aqueous based formulations. Practical case in frescoes from els Munts Roman villa (Catalonia). Estud. Conserv. Restauro 2019, 10, 67–83. [Google Scholar]
- Baglioni, M.; Giorgi, R.; Berti, D.; Baglioni, P. Smart cleaning of cultural heritage: A new challenge for soft nanoscience. Nanoscale 2012, 4, 42–53. [Google Scholar] [CrossRef]
- Salwierz, A.; Szymczyk, T. Methods of creating realistic spaces—3D scanning and 3D modelling. J. Comput. Sci. Inst. 2020, 14, 101–108. [Google Scholar] [CrossRef]
- Ciekanowska, A.; Kiszczak-Gliński, A.; Dziedzic, K. Comparative analysis of Unity and Unreal Engine efficiency in creating virtual exhibitions of 3D scanned models. J. Comput. Sci. Inst. 2021, 20, 247–253. [Google Scholar] [CrossRef]
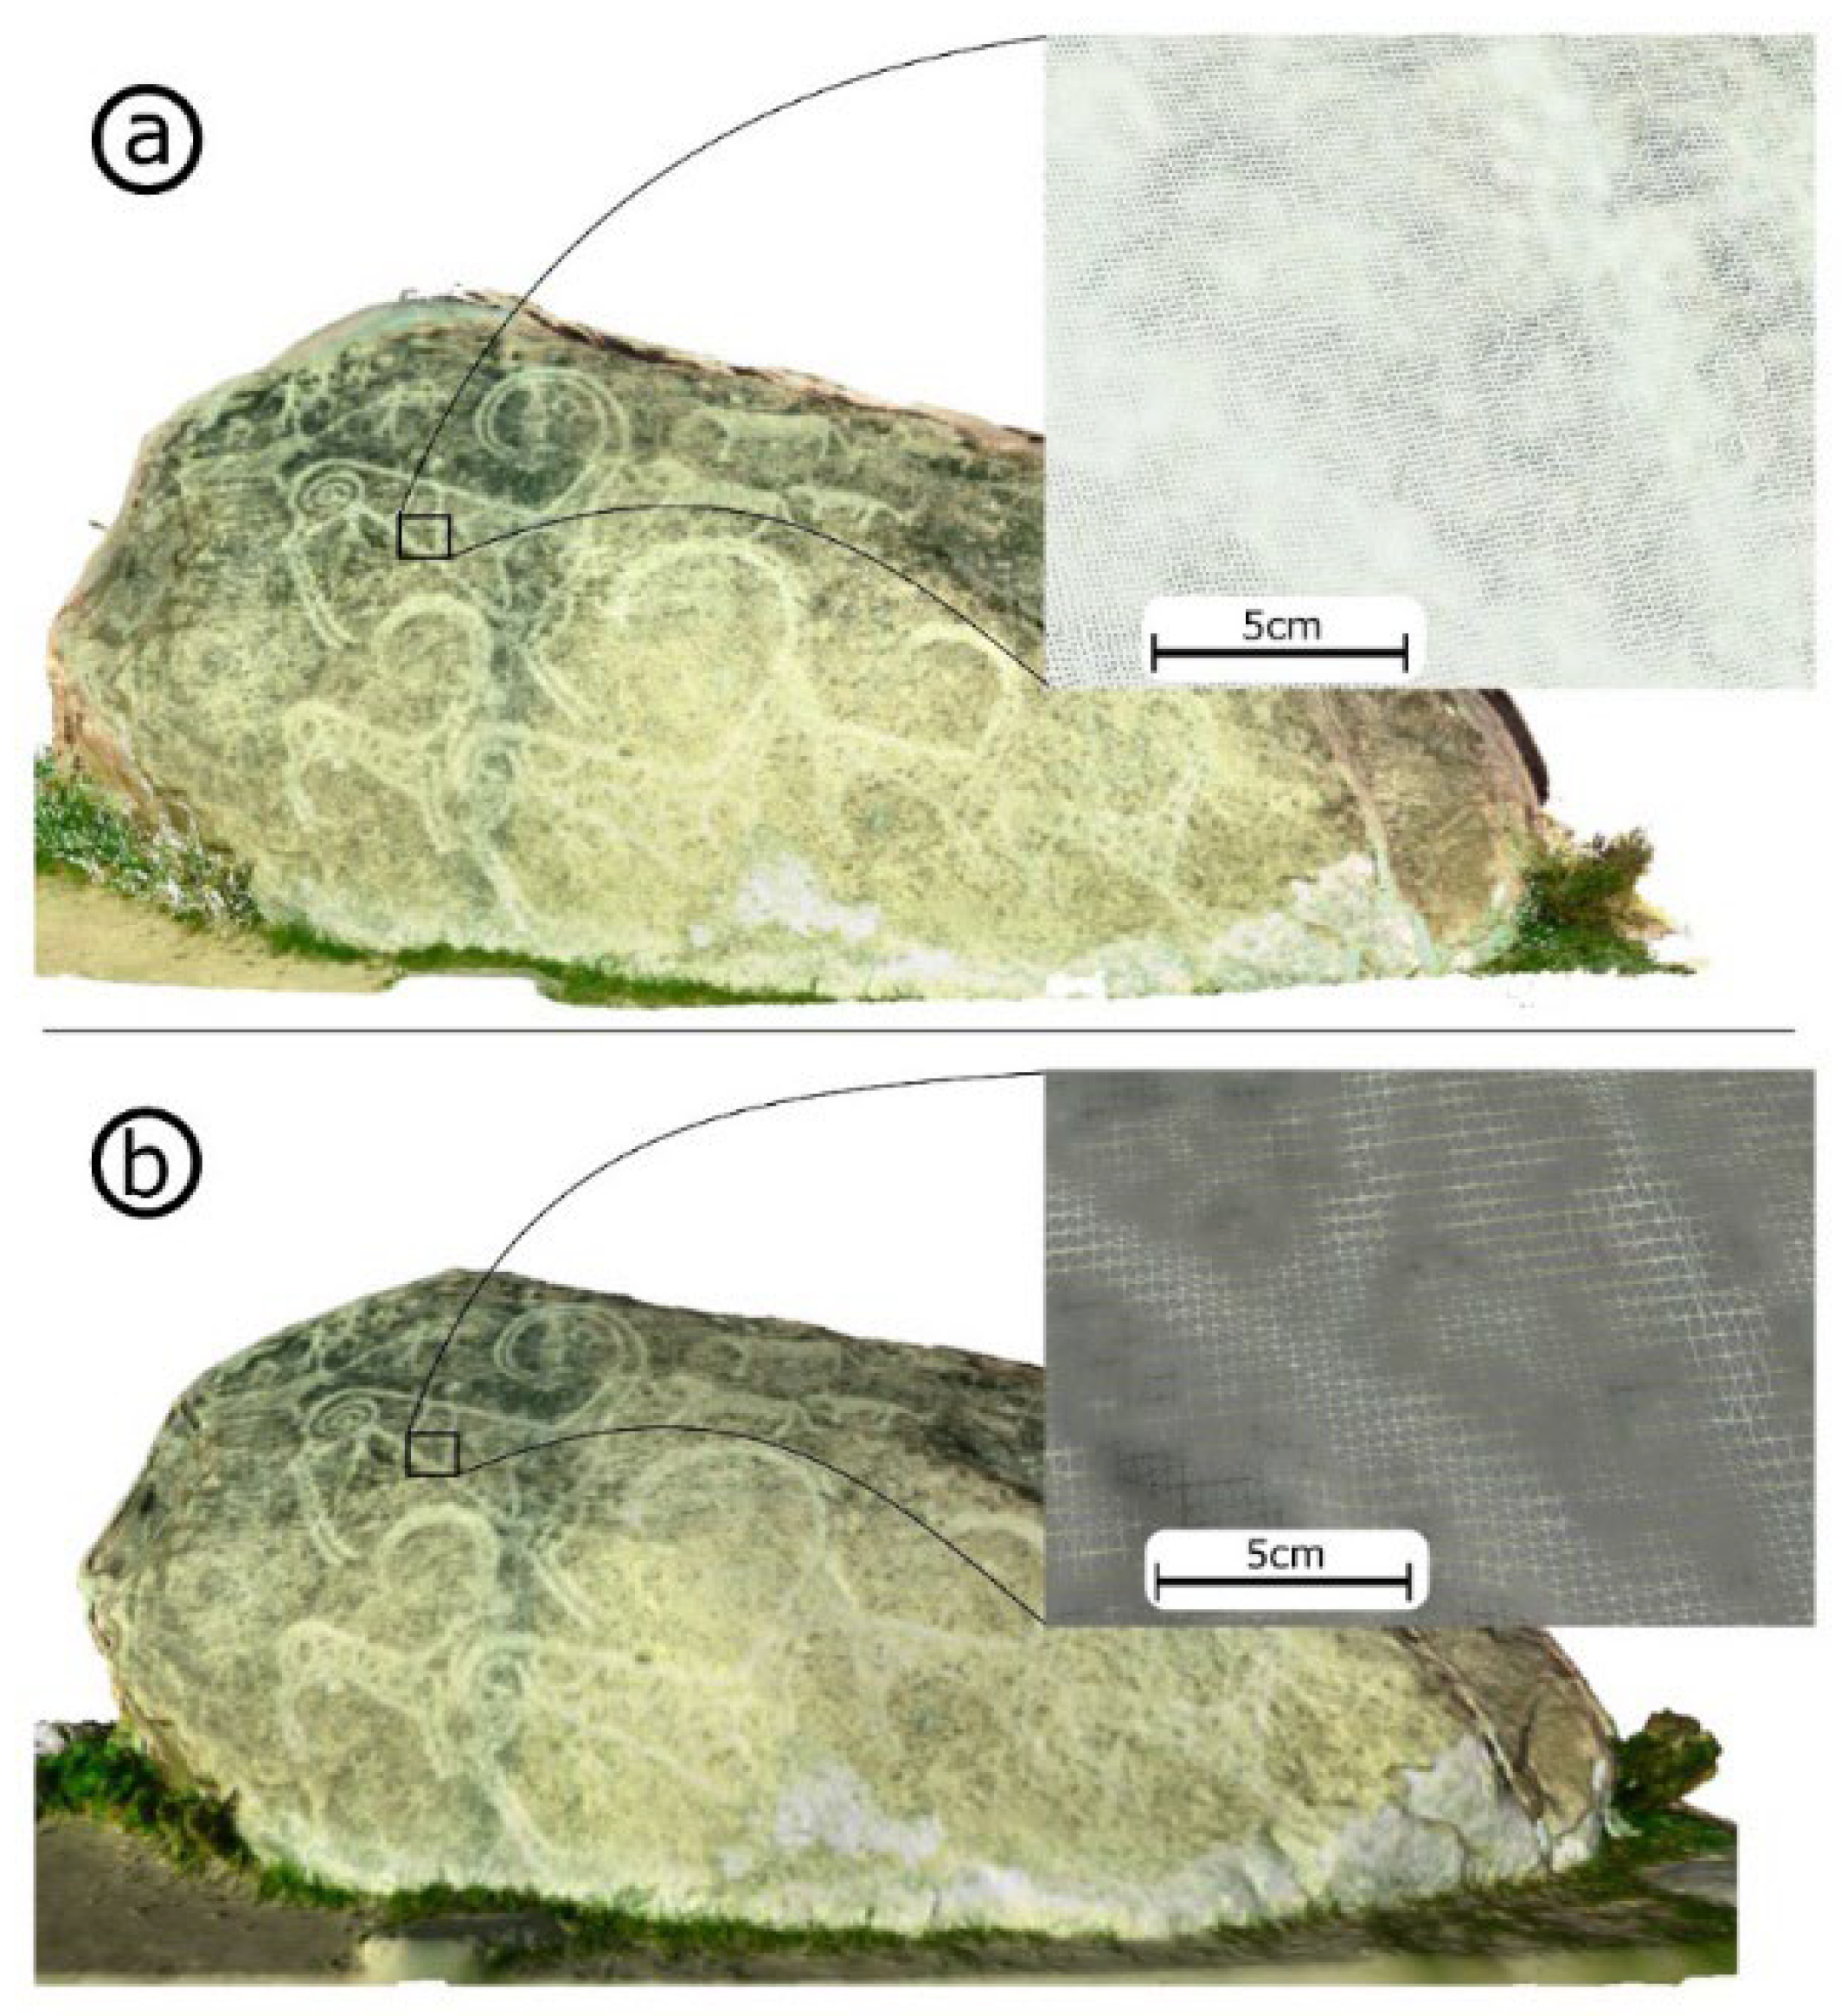
- Wojcicki, P.; Korga, S.; Milosz, M. Preliminary Application of the Algorithm Highlighting Petroglyph Patterns. Appl. Sci. 2022, 12, 1660. [Google Scholar] [CrossRef]


| Name of the Stage | Sub-Stages | Results |
|---|---|---|
|
| Sequence and location of petroglyphs to be scanned—initial list. |
| Final list of objects. Initial plan of scanning of every petroglyph chosen. | |
| Plan of scanning adjusted to on-site conditions. | |
| For each petroglyph from list: For each scan position:
| Folders for each petroglyph containing: files with scans data, additional data (photo, historical, …). |
|
| Source point clouds arranged over site area. |
| Final point clouds of each petroglyph arranged over site area. | |
| Base (high quality) model of each petroglyph with corresponding supplementary data (e.g., background images). | |
|
| Dissemination of petroglyph model. |
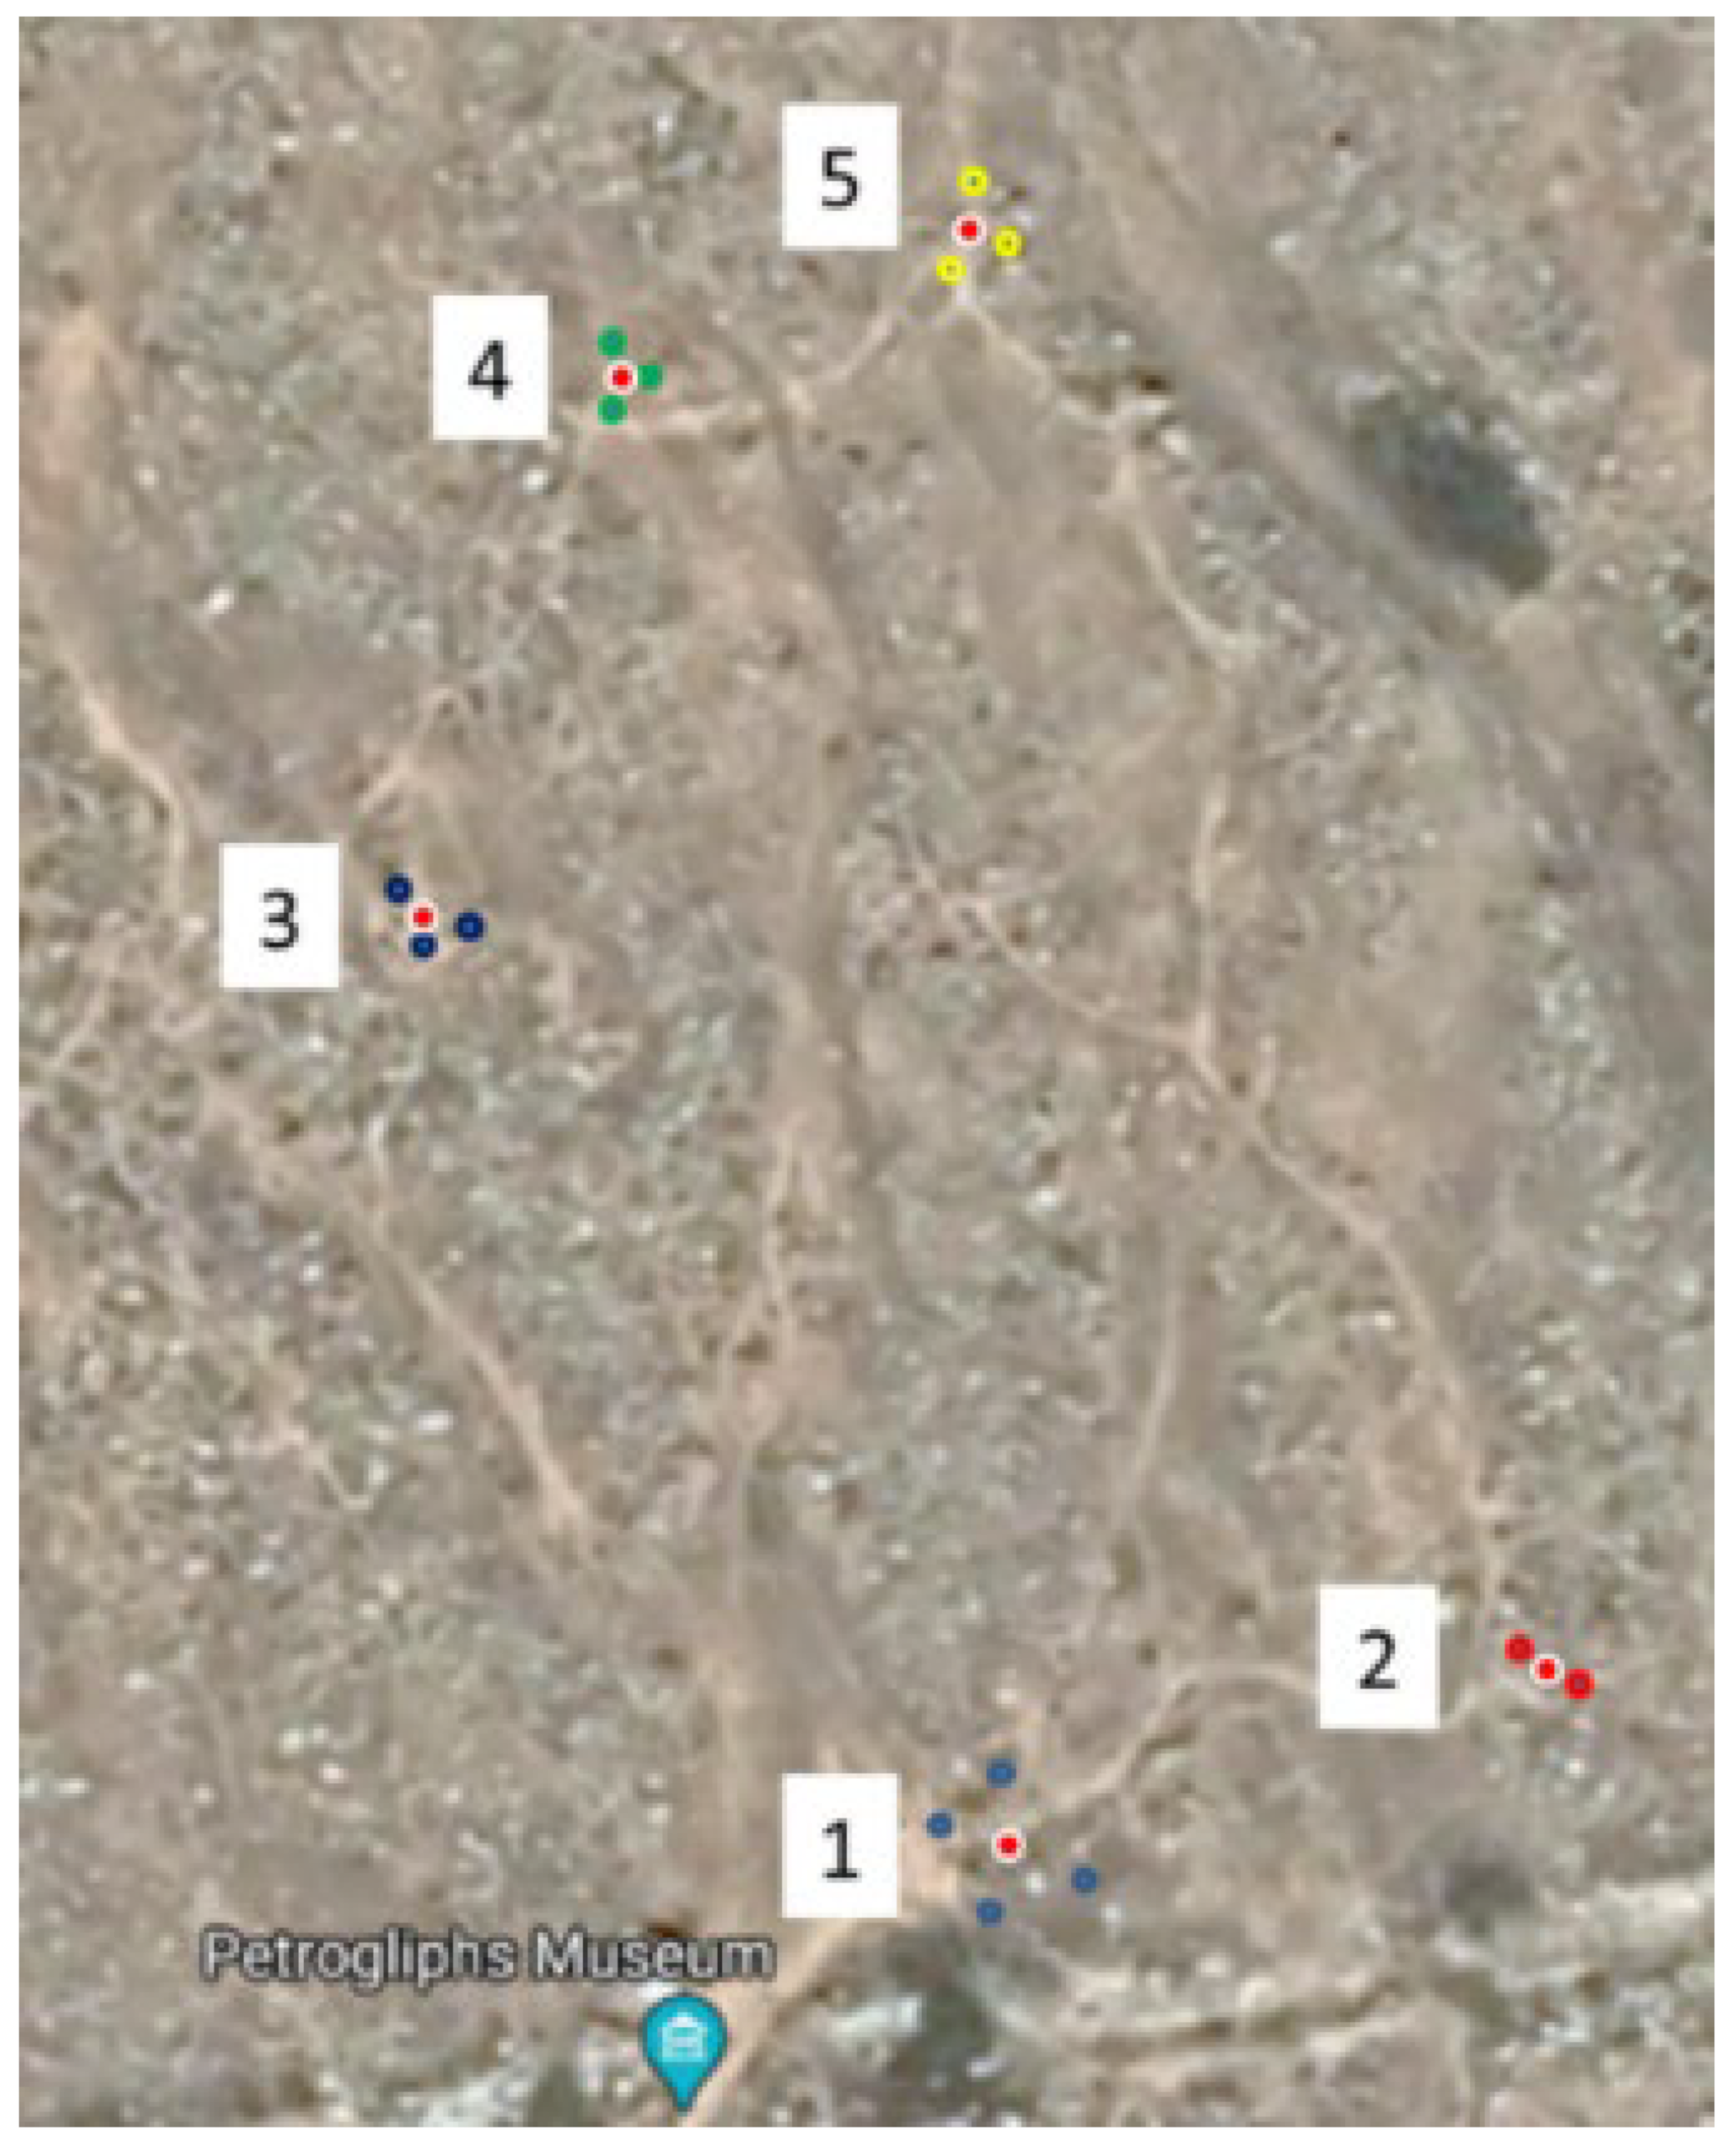
| Object Number | Latitude | Longitude |
|---|---|---|
| 1 (4 positions) | 42.658102 | 77.057090 |
| 42.658042 | 77.057133 | |
| 42.658067 | 77.057237 | |
| 42.658157 | 77.057150 | |
| 2 (2 positions) | 42.658253 | 77.057732 |
| 42.658222 | 77.057780 | |
| 3 (3 positions) | 42.658823 | 77.056525 |
| 42.658845 | 77.056553 | |
| 42.658873 | 77.056488 | |
| 4 (3 positions) | 42.659255 | 77.056722 |
| 42.659273 | 77.056762 | |
| 42.659302 | 77.056722 | |
| 5 (3 positions) | 42.659370 | 77.057098 |
| 42.659387 | 77.057155 | |
| 42.659435 | 77.057122 |
| Object No | Vertices in Point Cloud Count (M) | Average Point Cloud Density (pts/cm2) | Mesh Faces Count (M) | File Size (MB) |
|---|---|---|---|---|
| 1 | 5.534 | 107 | 2.547 | 132 |
| 2 | 5.015 | 114 | 2.823 | 149 |
| 3 | 3.794 | 118 | 2.431 | 130 |
| 4 | 3.441 | 120 | 3.473 | 185 |
| 5 | 4.457 | 140 | 5.085 | 274 |
| Object No | Fragment with Texture | Surface of the Fragment |
|---|---|---|
| 1 |  |  |
| 2 | 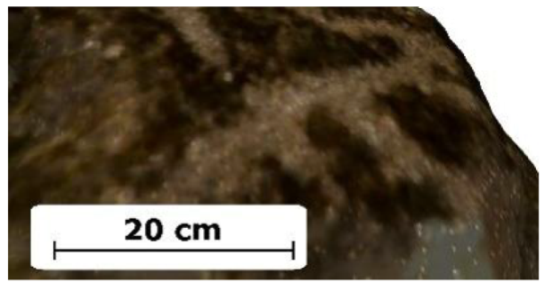 | 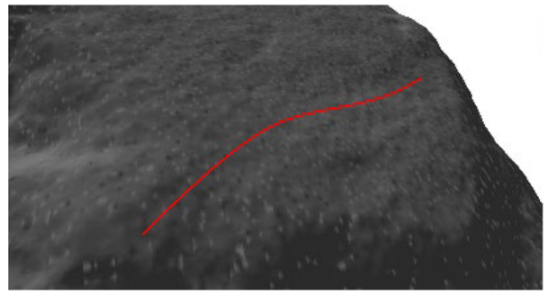 |
| 3 |  | 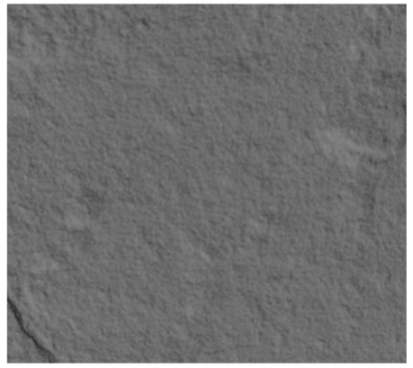 |
| 4 | 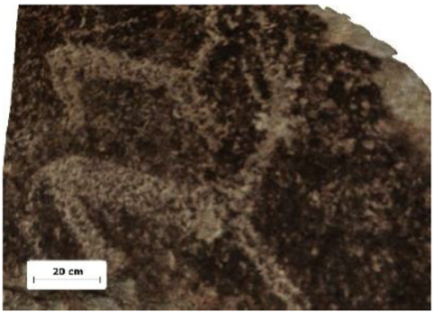 | 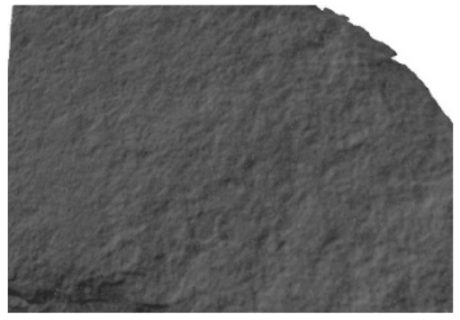 |
| 5 | 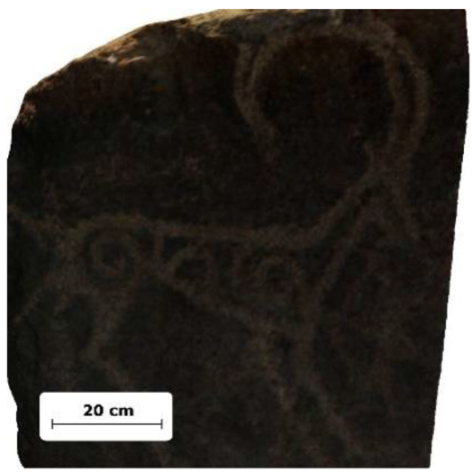 | 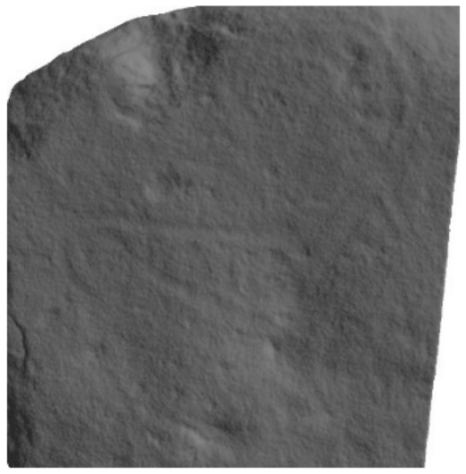 |
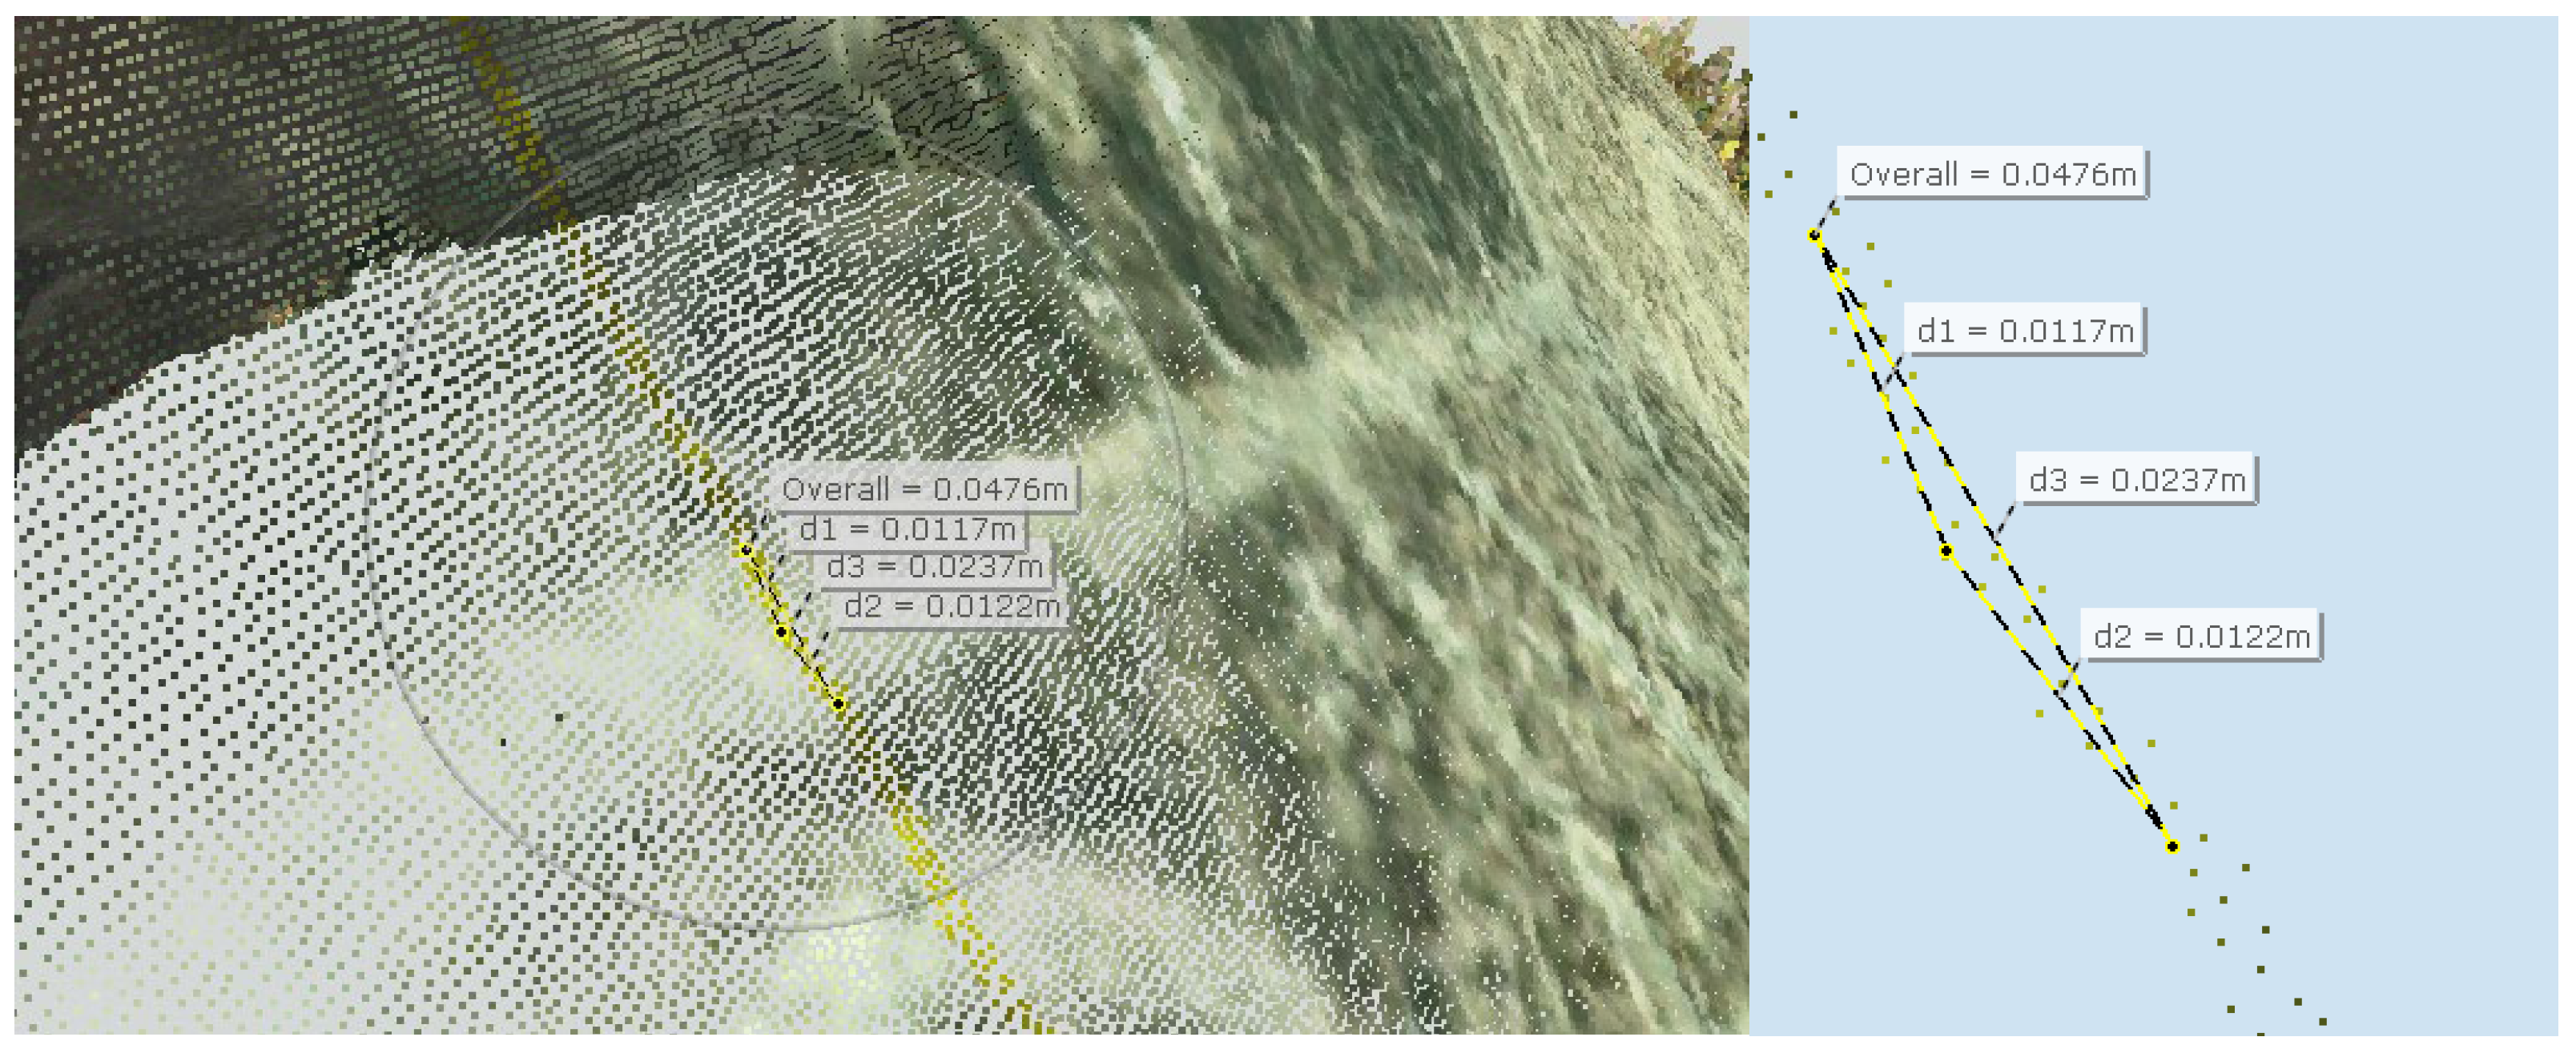
| Object No | Carvings-Visibility | Carvings-Occurrence | Carvings-Average Depth (mm) |
|---|---|---|---|
| 1 | Clearly visible | Significant | 1.5 |
| 2 | Barely seen | Slight | 0.4 |
| 3 | Imperceptible | None | - |
| 4 | Imperceptible | None | - |
| 5 | Clearly visible | Significant | 1.3 |
Publisher’s Note: MDPI stays neutral with regard to jurisdictional claims in published maps and institutional affiliations. |
© 2022 by the authors. Licensee MDPI, Basel, Switzerland. This article is an open access article distributed under the terms and conditions of the Creative Commons Attribution (CC BY) license (https://creativecommons.org/licenses/by/4.0/).
Share and Cite
Kęsik, J.; Miłosz, M.; Montusiewicz, J.; Israilova, N. Documenting Archaeological Petroglyph Sites with the Use of 3D Terrestrial Laser Scanners—A Case Study of Petroglyphs in Kyrgyzstan. Appl. Sci. 2022, 12, 10521. https://doi.org/10.3390/app122010521
Kęsik J, Miłosz M, Montusiewicz J, Israilova N. Documenting Archaeological Petroglyph Sites with the Use of 3D Terrestrial Laser Scanners—A Case Study of Petroglyphs in Kyrgyzstan. Applied Sciences. 2022; 12(20):10521. https://doi.org/10.3390/app122010521
Chicago/Turabian StyleKęsik, Jacek, Marek Miłosz, Jerzy Montusiewicz, and Nella Israilova. 2022. "Documenting Archaeological Petroglyph Sites with the Use of 3D Terrestrial Laser Scanners—A Case Study of Petroglyphs in Kyrgyzstan" Applied Sciences 12, no. 20: 10521. https://doi.org/10.3390/app122010521