Article

Soil Characterization and Soiling Impact to Facilitate Photovoltaic Installation

1
Centro de Desarrollo Energético Antofagasta, Universidad de Antofagasta, Antofagasta, Angamos 601, 1270300 Antofagasta, Chile
2
Freelance Solar Energy Researcher, 04007 Almería, Spain
3
Departamento de Química, Universidad Católica del Norte, Angamos 610, 1270709 Antofagasta, Chile
*
Author to whom correspondence should be addressed.
Appl. Sci. 2022, 12(20), 10582; https://doi.org/10.3390/app122010582
Submission received: 21 September 2022 / Accepted: 15 October 2022 / Published: 20 October 2022
(This article belongs to the Special Issue Solar Power Technology for Electricity Generation)

Abstract

:
There is currently an energy crisis that has led to photovoltaic operators maximizing their resources, making soiling a problem to consider in order to ensure project profitability. Energy production costs are strongly affected by the use of scarcely efficient cleaning techniques that are not suitable for a particular type of contaminant, climate, and installation. This paper introduces a technology that is suitable for studying soiling, thus decreasing the number of variables studied and reliable results were obtained. Our attention is focused on deposited material physicochemistry, local geology, and installation effects. Analysis via scanning electron microscopy and pits revealed a similarity between local geological processes and module soiling, with gypsum being responsible for soil and module cementation. Analysis with Atomic Force Microscopy confirms the cementation effect and crust formation on the lower part of the photovoltaic glass, the latter concentrating in the greatest amount of cemented material. Using a solar simulator, the characteristic curves produced by the cemented material were studied, and it was determined that the lower part of the glass produced the greatest losses (27%). Thus, a non-uniformity deposition was generated, creating resistance between the cells. From the data obtained, it was possible to make recommendations regarding making decisions about plant cleaning, instead of only considering the physicochemical analysis of the deposited material.

1. Introduction

One of the important challenges in operating and maintaining photovoltaic (PV) systems on a worldwide basis is to avoid soiling on a PV module surface as far as possible in order to prevent a decrease in performance. This effect results in serious losses in energy generation, thus affecting PV project viability. Cleaning costs may considerably increase the price of the energy generated since it depends on the type of cleaning (manual or robotic), the use of water (dry cleaning), and cleaning frequency (daily, weekly, monthly, semestral or annual) [1,2]. Ilse et al. claimed that soiling is a highly important issue that must be considered in the solar market since, in an optimum cleaning scenario, soiling may reduce solar energy production by 3–4%, being equivalent to economic losses of at least €3–5 billion annually on a worldwide basis, without considering monetary losses due to the selection of inappropriate and scarcely efficient cleaning techniques [2]. In addition, the current scenario produced by the COVID-19 pandemic and the monetary instability on a worldwide basis have led to a situation that fosters the development and innovation of efficient cleaning plans and techniques to optimize the economic resources of a PV plant and to ensure profitability [3]. For these reasons, researchers around the world are seeking different ways to simplify soiling studies via outdoor and indoor experimental campaigns and computing simulations to provide efficient solutions suitable for the present panorama [4,5,6,7].
Defining a maintenance plan that is adequate for each PV plant to minimize optic and economic losses is a complex task, owing to the different factors related to soiling deposition. These factors are grouped as: Climatic conditions (wind speed and direction, relative humidity, ambient temperature, solar radiation, airborne dust, and precipitations), type of soiling (inorganic and organic), installation factors (slope and orientation), and type of technology (modules and glass) [8,9]. These factors are further divided into other subsections, making soiling research more complex. For instance, to study the nature of soiling, it is necessary to understand the type of material deposited, its size, morphology, chemical composition, load, and solubility. If the soiling interaction with the panel is added to this, other variables, such as capillarity, must be considered, e.g., capillarity, Van der Waals and Coulomb forces, mechanical interlocking, and contact electrification [10,11]. However, soiling studies show an additional complexity, since soiling is considered as a local phenomenon. Every area around the world has unique characteristics that interact differently with the PV module, such as the combination of compounds deposited, precipitation level, solar resource quality, wind speed and direction, airborne dust, and relative humidity, thus making many studies unreproducible for PV installations on a worldwide basis [12,13,14].
This study shows how local soiling studies can be conducted to decrease the number of variables to be analyzed, thus obtaining highly reliable results. Attention is focused on PV module soiling deposition, which is analyzed from its physicochemical nature and the influence of geology on the site. In addition, soiling effects on the optical properties of a PV glass installed with a fixed slope configuration is evaluated by analyzing IV current-voltage curves. This results in a methodology for improving soiling cleaning and mitigation plans for PV plants, thus directly affecting PV Project profitability for investment (CAPEX) and maintenance operation (OPEX).

2. Methodology

This study was conducted at the Solar Platform of Atacama Desert (PSDA, for its acronym in Spanish). This site constitutes a natural lab for studying and testing different types of solar technologies because the quality and availability of its solar resource (8 kWh/m2 global radiation) and 3% cloudiness is appealing [15,16]. It is located at 1000 m.a.s.l. in the Atacama Desert (24.09° S, 69.93° E), with a BWK-type Köppen climatic classification, corresponding to a cold arid desert zone [17]. This platform is operated by the Antofagasta Energy Development Center (CDEA, for its acronym in Spanish), Chile.
For the geological study of the soil, seven pits were made around PSDA (Figure 1). Each of them was excavated at 3–3.7 m deep, including underground material sampling and a stratigraphic description. In addition, natural soil densities were measured to evaluate and classify them according to natural compactness, along with solubility tests according to norm NLT-1 1 4/99.
To study material deposition on PV modules, four 6.5 cm × 4.5 cm standard PV glasses were installed and were oriented northwards, with a 20° slope (fixed structure). These glasses were subjected to soiling in open air for one year (September 2020–2021) to observe the effect of the four seasons on the material deposition. Special attention was paid to the significant physical and chemical changes of the material deposition, as compared to other years of study on the site [18]. To evaluate the physical and chemical changes of the deposited material, morphological and elemental characterization tests were conducted with scanning electron microscopy (SEM-EDX), using a Joel SEMJSM-6360LV equipment. To study PV glass soiling topography, a Witec Raman-AFM Alpha 300 atomic force microscope was used and operated in ambient temperature.
To study soiling effects, four pieces of glass were left on a reference cell in the open air. Each PV piece of glass was divided into three sectors (low, middle, and high). Each sector was divided into three subsectors, thereby obtaining nine quadrants, and their middle and low parts (six spaces) were measured. To observe the soiling effect, the soiled glass measures were compared to the values of clean PV glass with the same characteristics as the reference cell. For a better representativity, measurements were taken in triplicate. To do this, a Photo Emission Tech CT80AAA solar simulator was used, together with an Xe (300 W) lamp, simulating ASTM G173 norm conditions, i.e., 1.5 air mass and 1 sun illumination (100 mW/cm2). Intensity was adjusted using the c-Si (2 × 2 cm) reference cell, while IV curves were measured with a Keithley 2400 source meter. Uncertainty on standard test conditions (STC) for IV parameters was 0.31% for the short-circuit current (Isc), 0.52% for the current at the maximum power point (Impp), 0.07% for the open-circuit voltage (Voc), 0.18% for voltage at the maximum power point (Vmpp), 0.36% for maximum power (Pmpp), 0.36% for efficiency, and 0.55% for the fill factor (FF).

3. Results and Discussion

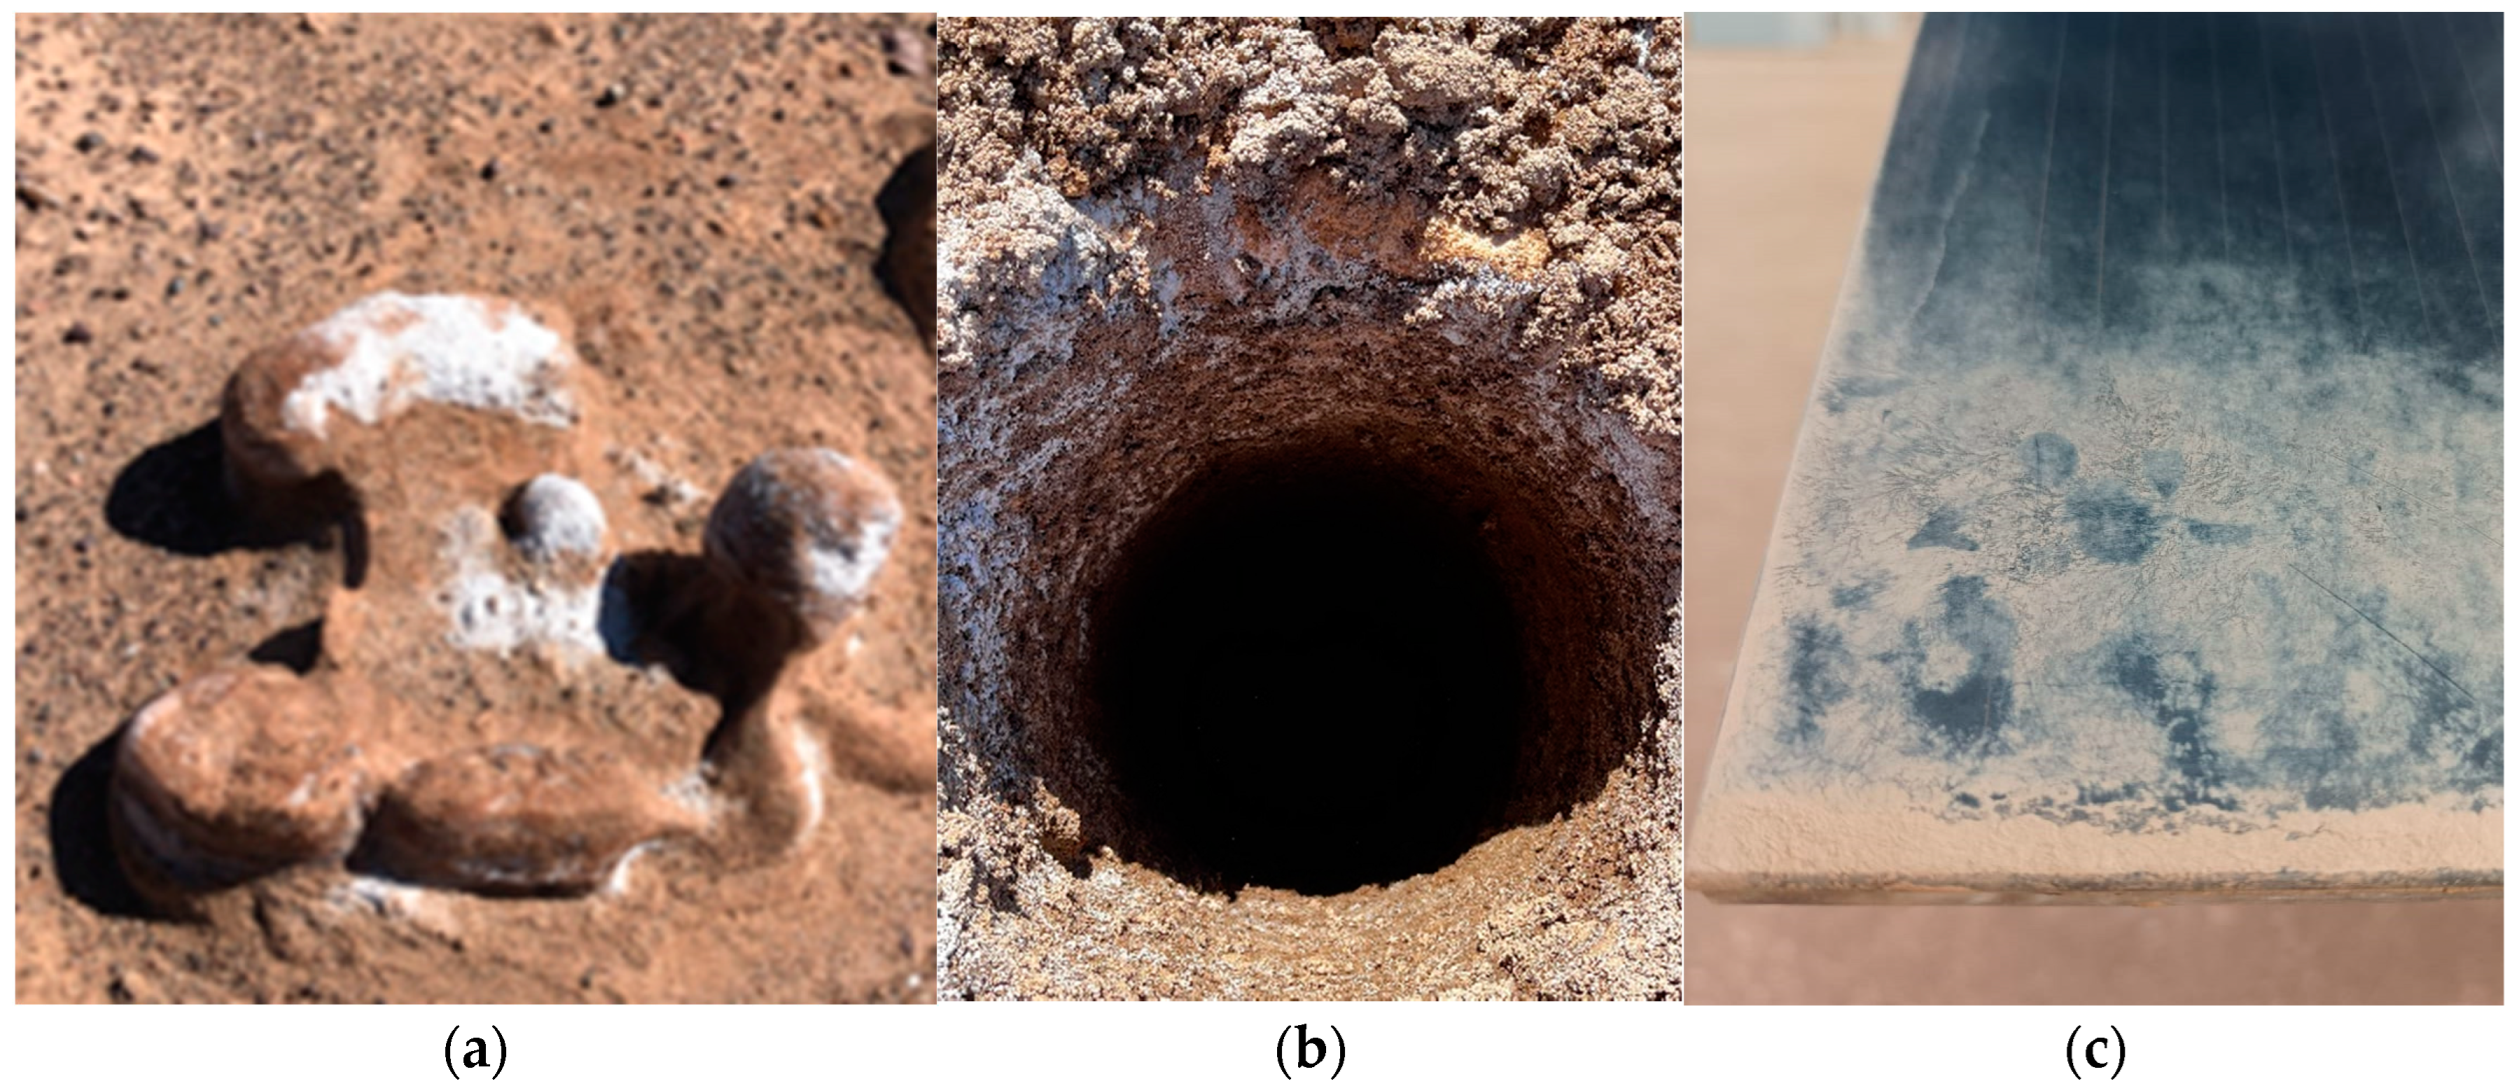
3.1. Stratigraphic Description

Pits revealed the presence of dry, cemented, whitish and clayey material on the soil surface. The stratigraphic description was made according to Atterberg’s soil classification [19]. The results show a sequence of predominant strata of silty sands with gravel, except for pits three and seven, where the sands showed light brown, whitish cemented clay of evaporitic origin. Sampling points indicate the presence of 7–25% gravel particles; 64–72% coarse-to-fine grain sands, mainly middle sized; and 16% fine low plasticity grain. Middle-to-firm cementation was found in the upper strata and humidity in the lower strata of alluvial–colluvial origin. The results obtained from soluble salts show a 1.12% mean, with pit three presenting the highest value (3.2%). These results are complemented by the results obtained by Ferrada et al. [20], who reported that the soil is mainly formed by albite (NaAlSi3O8), anorthite (CaAl2Si2O8), gypsum (CaSO 4·2H2O), quartz (SiO2), and orthoclase (KAlSi3O8), among others. The results also indicate a similarity between the chemical composition of the material deposited on the PV modules and the soil, but showed no significant changes.
The results obtained from the pits are comparable to those reported in previous studies, where the presence of gypsum is documented as a soluble material, which is essential for the cementation processes taking place on the site [18]. Additionally, pit analyses indicate middle-to-firm soil cementation, influencing the amount of material that can be aero-transported by the wind to be deposited on the PV module surface. Previous research reveals that the amount of material deposited on a PV module surface does not exceed 0.05 mg/cm2 in one month of exposure [6], as compared with 0.2 mg/cm2 in Kathmandu [21], or 1% daily output power loss in Dhaka [22]. These geological characteristics make the place attractive for the type of soil, which allows for low soiling levels in a desert zone, thus meaning that the site geology plays a positive role.
There is a similarity between the site geology and the material deposited on the PV modules. Figure 2a shows the geology of the soil in the presence of whitish cemented surface salt, as indicated by the pit results. Figure 2b, corresponding to pit five, shows the presence of white cemented salt at the pit edge. Figure 2c shows a soiled PV module on the site, where crusted clay deposition can be observed, the lower part of the module concentrating the greatest amount of crusted material due to condensed humidity and the slope angle [13,23,24]. This comparison helps to understand the geological importance of the site, since it provides relevant data on the PV module soiling formation.

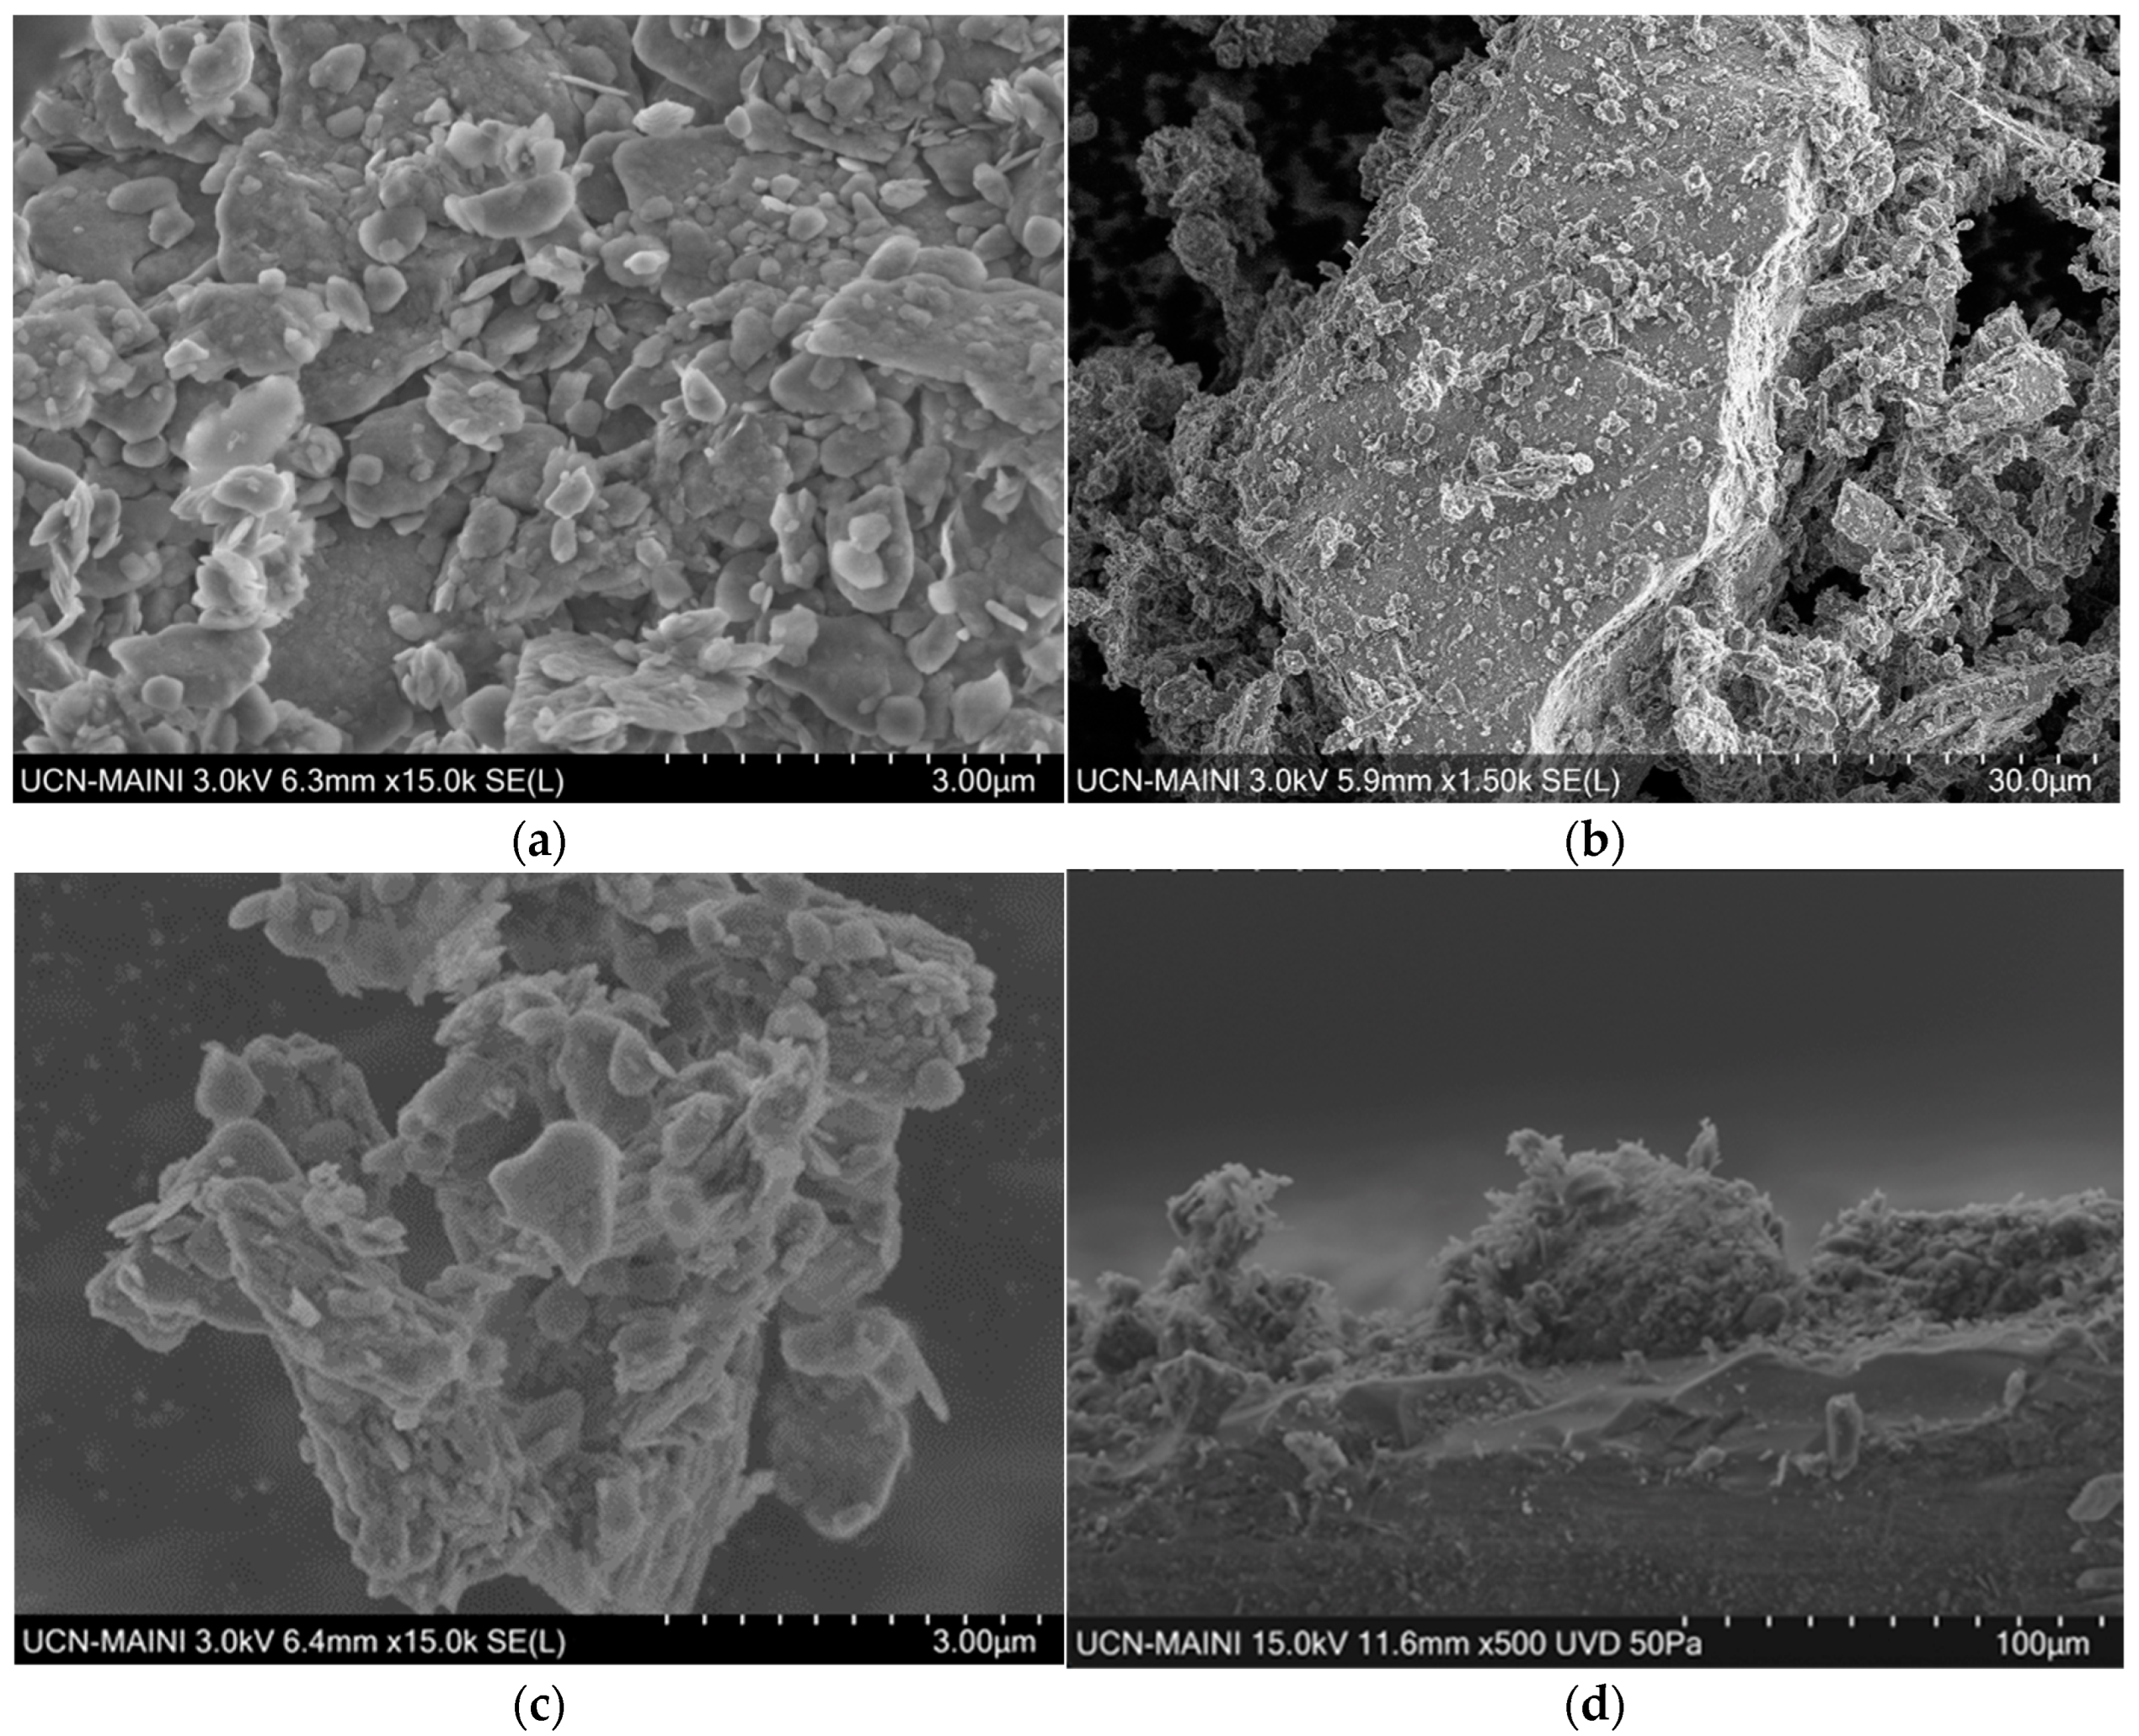
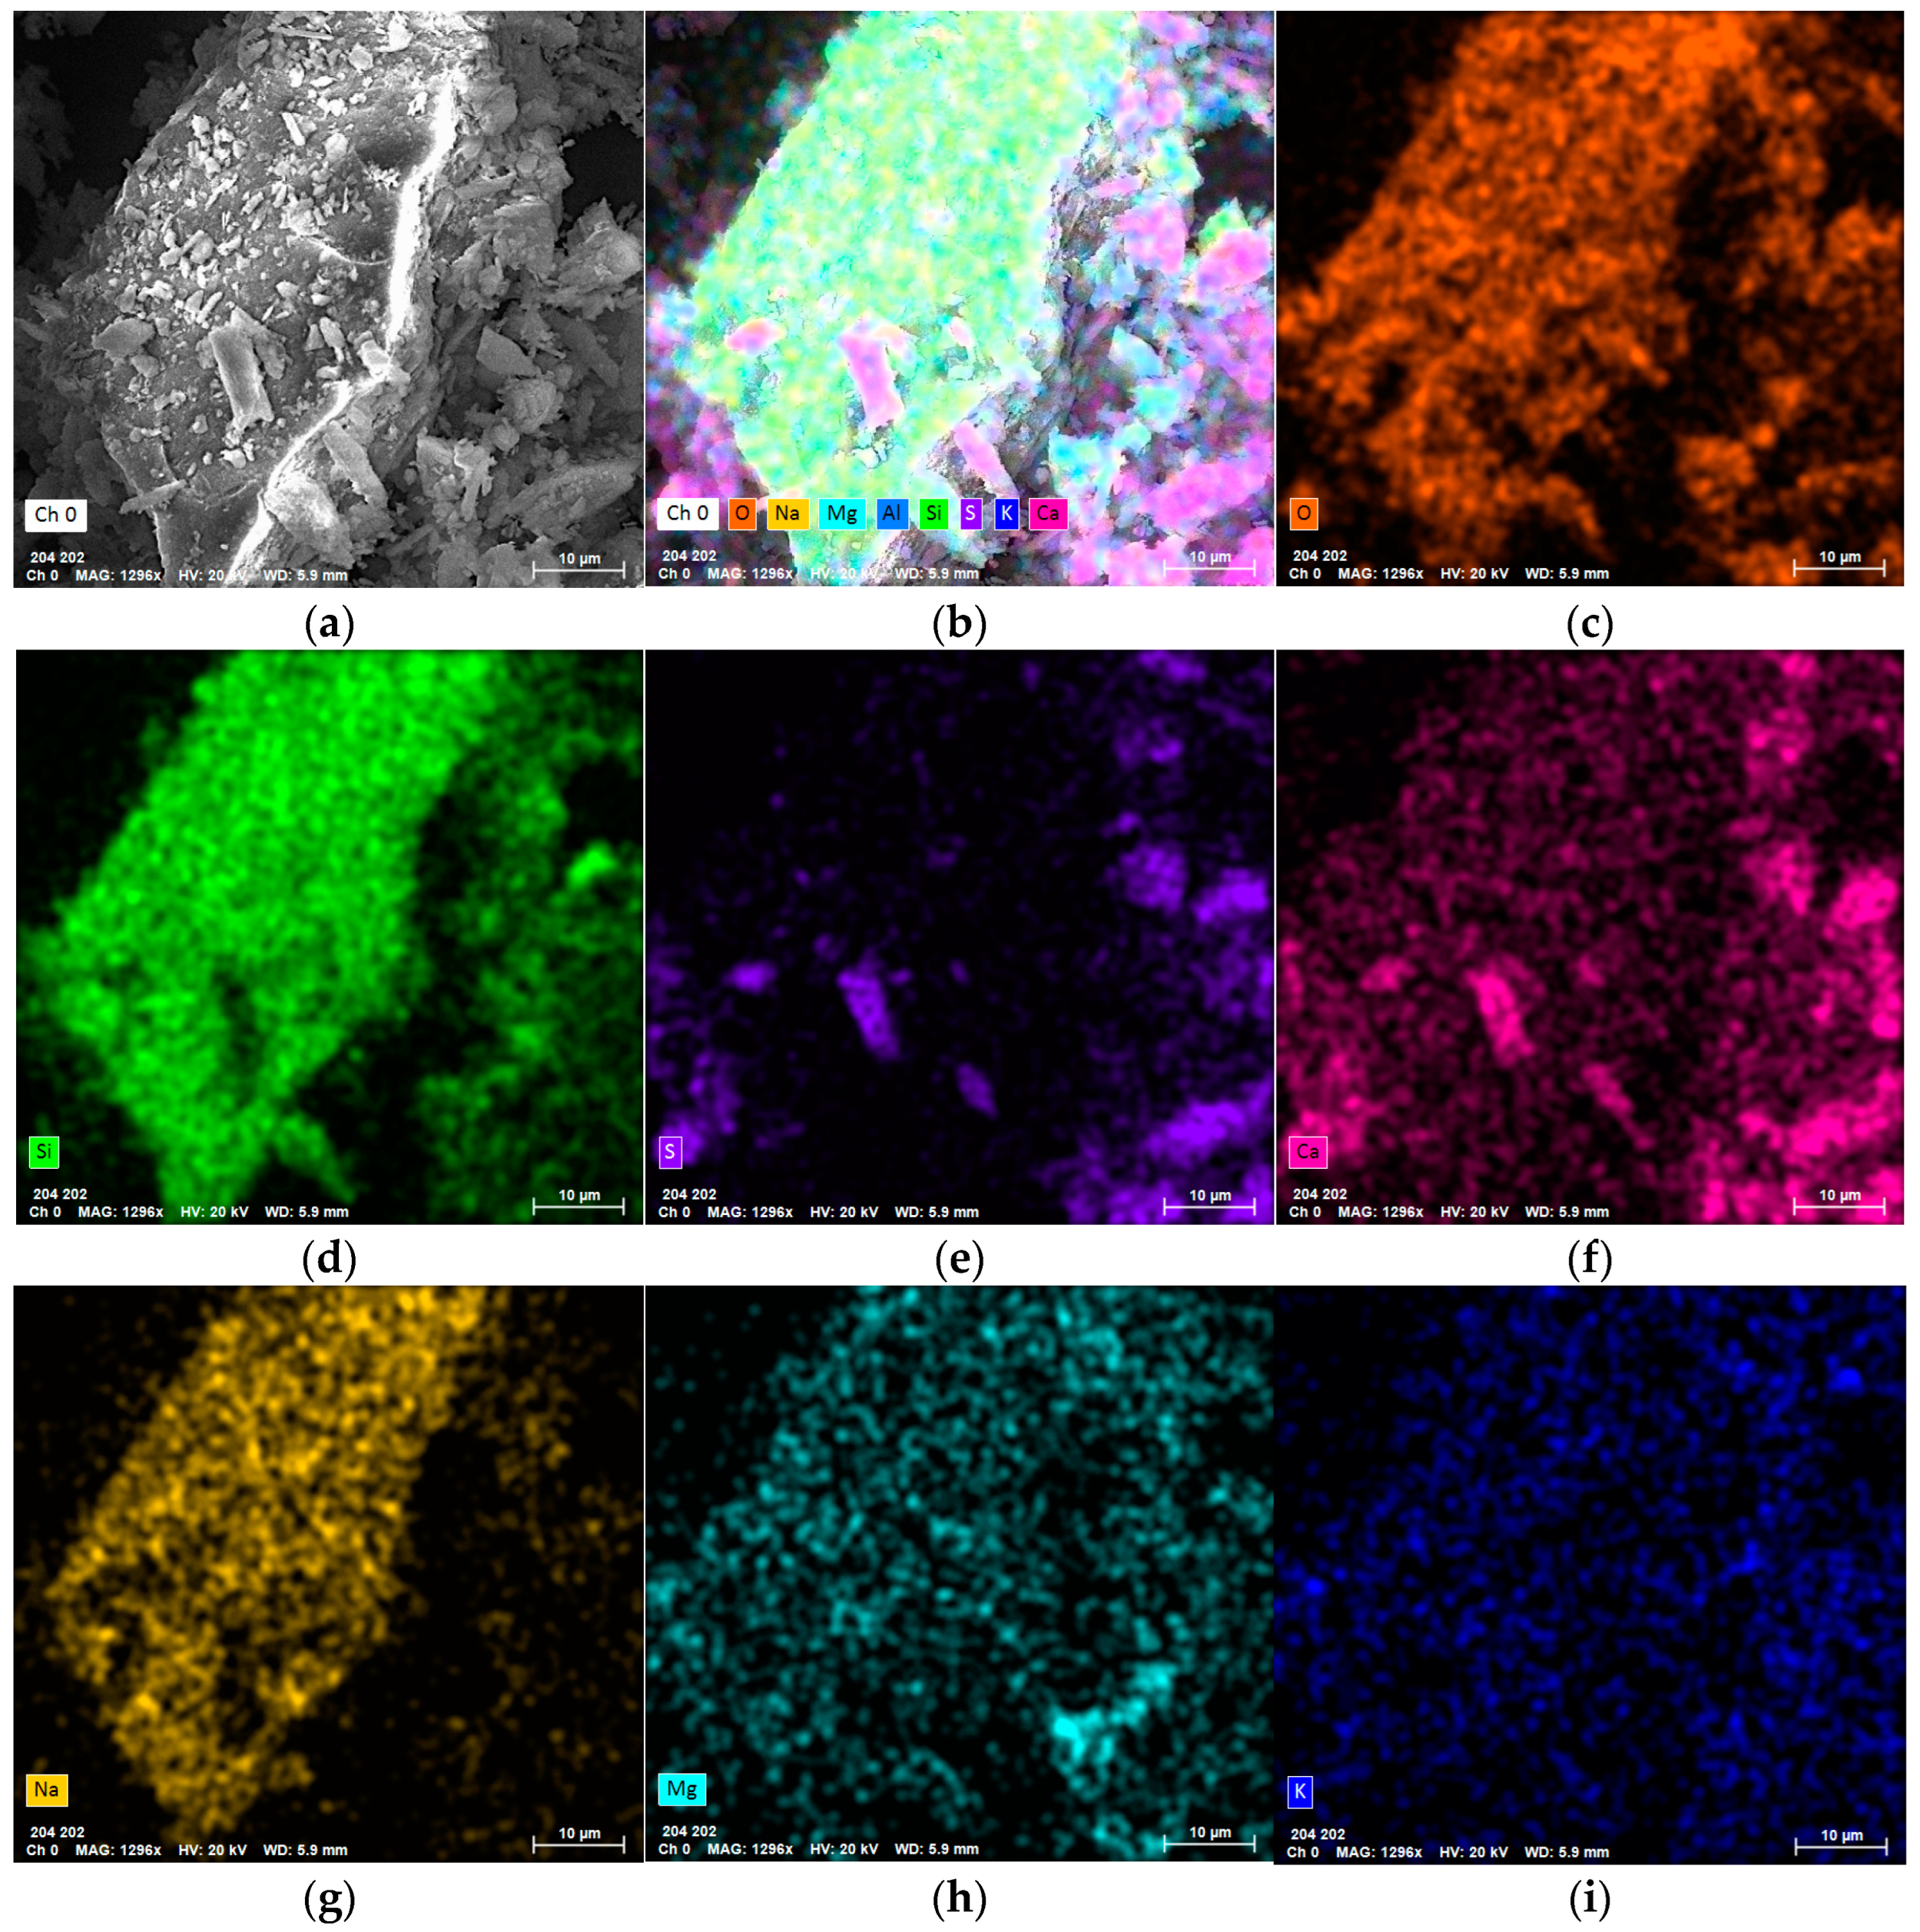
3.2. Microstructural Characterization

To observe the soiling process at a microscopic level, SEM tests were conducted. Figure 3a shows soiling deposition at the lower part of the PV glass. The deposited material is formed by particles of different sizes and a mixture that has a diverse morphology. The particles tend to generate agglomerates between them and this covers the glass surface. This phenomenon is more clearly shown in Figure 3b,c, which corresponds to a random section of the lower PV glass quadrant and shows the presence of prismatic particles surrounded by other particles with a random geometry. Both random high-resolution images show how prismatic particles capture the deposited material, encapsulating the deposited material that adheres to the PV glass surface. Figure 3d shows this effect better and corresponds to the PV glass cross-section. Prismatic particles cause an effect on agglomerate formation and this fosters soiling crust formation.
To further understand the interaction process between the deposited material and crust formation, tests were conducted via EDX elemental mapping. Figure 4 shows a random section of the exposed glass and focuses on the presence of prismatic material owing to its ability to generate agglomerates. The selected area shows great amounts of O (~56.3%), Si (~19.5%), Al (~10.1%) Ca (~6.7%), and a few Mg (~1.3%), K (~0.8%), S (~3.5), and Na (~4.5%). Figure 4e,f show that prismatic particles are formed by sulphur and calcium, which are attributable to gypsum (CaSO4·H2O). Thus, the results confirm that prismatic particles produce material agglomeration, thus capturing silicon grains (sand), as shown in Figure 4d. Prismatic particles do not only influence the adhesion of more abundant particles, but there is also an interaction with all the deposited materials. The adhesion of this material was also documented by Ilse et al. [25], who reported that the soluble material responsible for cementation does not only serve as an adherent to the glass surface, but also as a focus of attraction for other minerals. As to PSDA, gypsum is the only hygroscopic material that can interact with the humidity on the site. This material is related to the results obtained from the pits, which indicate the presence of soluble material, which are not abundant, but there is enough for soiling crust formation.
The close interconnection between the prismatic particles, glass, and the rest of the material confirms the influence of the cementation process due to condensation and evaporation cycles that occur on the site. This phenomenon was documented by Olivares et al., who reported that the meteorological conditions on the site, along with the physicochemical characteristics of the material, generated the cementation process [18]. Evaluating and comparing different periods of time is important to confirm that cementation is a phenomenon that occurs on site, and is not unique to a certain year. This allows us to establish long-term action plans for places characterized by the presence of crustal soil.
The topography of the deposited material was performed by AFM-Raman. The results are shown in Figure 5a. The analysis confirms the presence of agglomeration produced by the deposited material, which is the deposition thickness that grows on the lower part of the PV glass. Relative humidity and condensation interact with the deposited material, thereby producing mud with soluble and insoluble material which, due to gravity, flows to the lower part of the glass [11,26,27]. Later, when the temperature increases (solar noon), the material becomes dry, thus producing mud crusts [28]. This process is repeated daily, making the soiling layer thickness increase, with the lower part of the PV module concentrating the greatest amount of cemented material [18,29,30]. Figure 5b shows three types of layers, as documented by Bethea et al. [31]. The first one (A) corresponds to the first soiling layer. This has the most exposure time, which then changes into a waterproof layer. Layer (B) corresponds to the material deposited on layer (A) and its exposure to atmospheric conditions is shorter. Finally, layer (C) corresponds to the last crust of the deposited material. It is the least exposed and can be more easily removed by the action of the rain, dew or wind. This confirms that crust (A) is not only the first soiling layer, but it also serves as the nucleus and propulsor of crust generation. Cemented crust formation on the module surface is related to cleaning methodologies. The greater the amount of agglomerated particles produced by gypsum, the greater the difficulty to eliminate them and the greater the force and time needed to remove it [32,33].
Cemented crusts produced by gypsum influence the selection of the type of methodology to be used for cleaning a PV plant, such as using water or dry cleaning. The combination of mineral species deposited on the module surface indicates the presence of quartz, i.e., hardness seven on the Mohs scale, meaning that it may scratch the glass. This reveals that an improper choice of the cleaning technique may damage the PV glass surface because the cemented crust contains quartz. For these reasons, soiling crust formation on the PV module (periodic cleaning) or the use of water for dissolving crusted salt should be avoided. This is not in agreement with the work by Ghazi et al., who indicated that weekly dry cleaning is recommended in arid zones [34]. However, crust formation produced by material cementation at PSDA shows that these cleaning mechanisms are valid if they are used to avoid crust formation; otherwise, crusted salts are difficult to remove if water is not used to dissolve them.

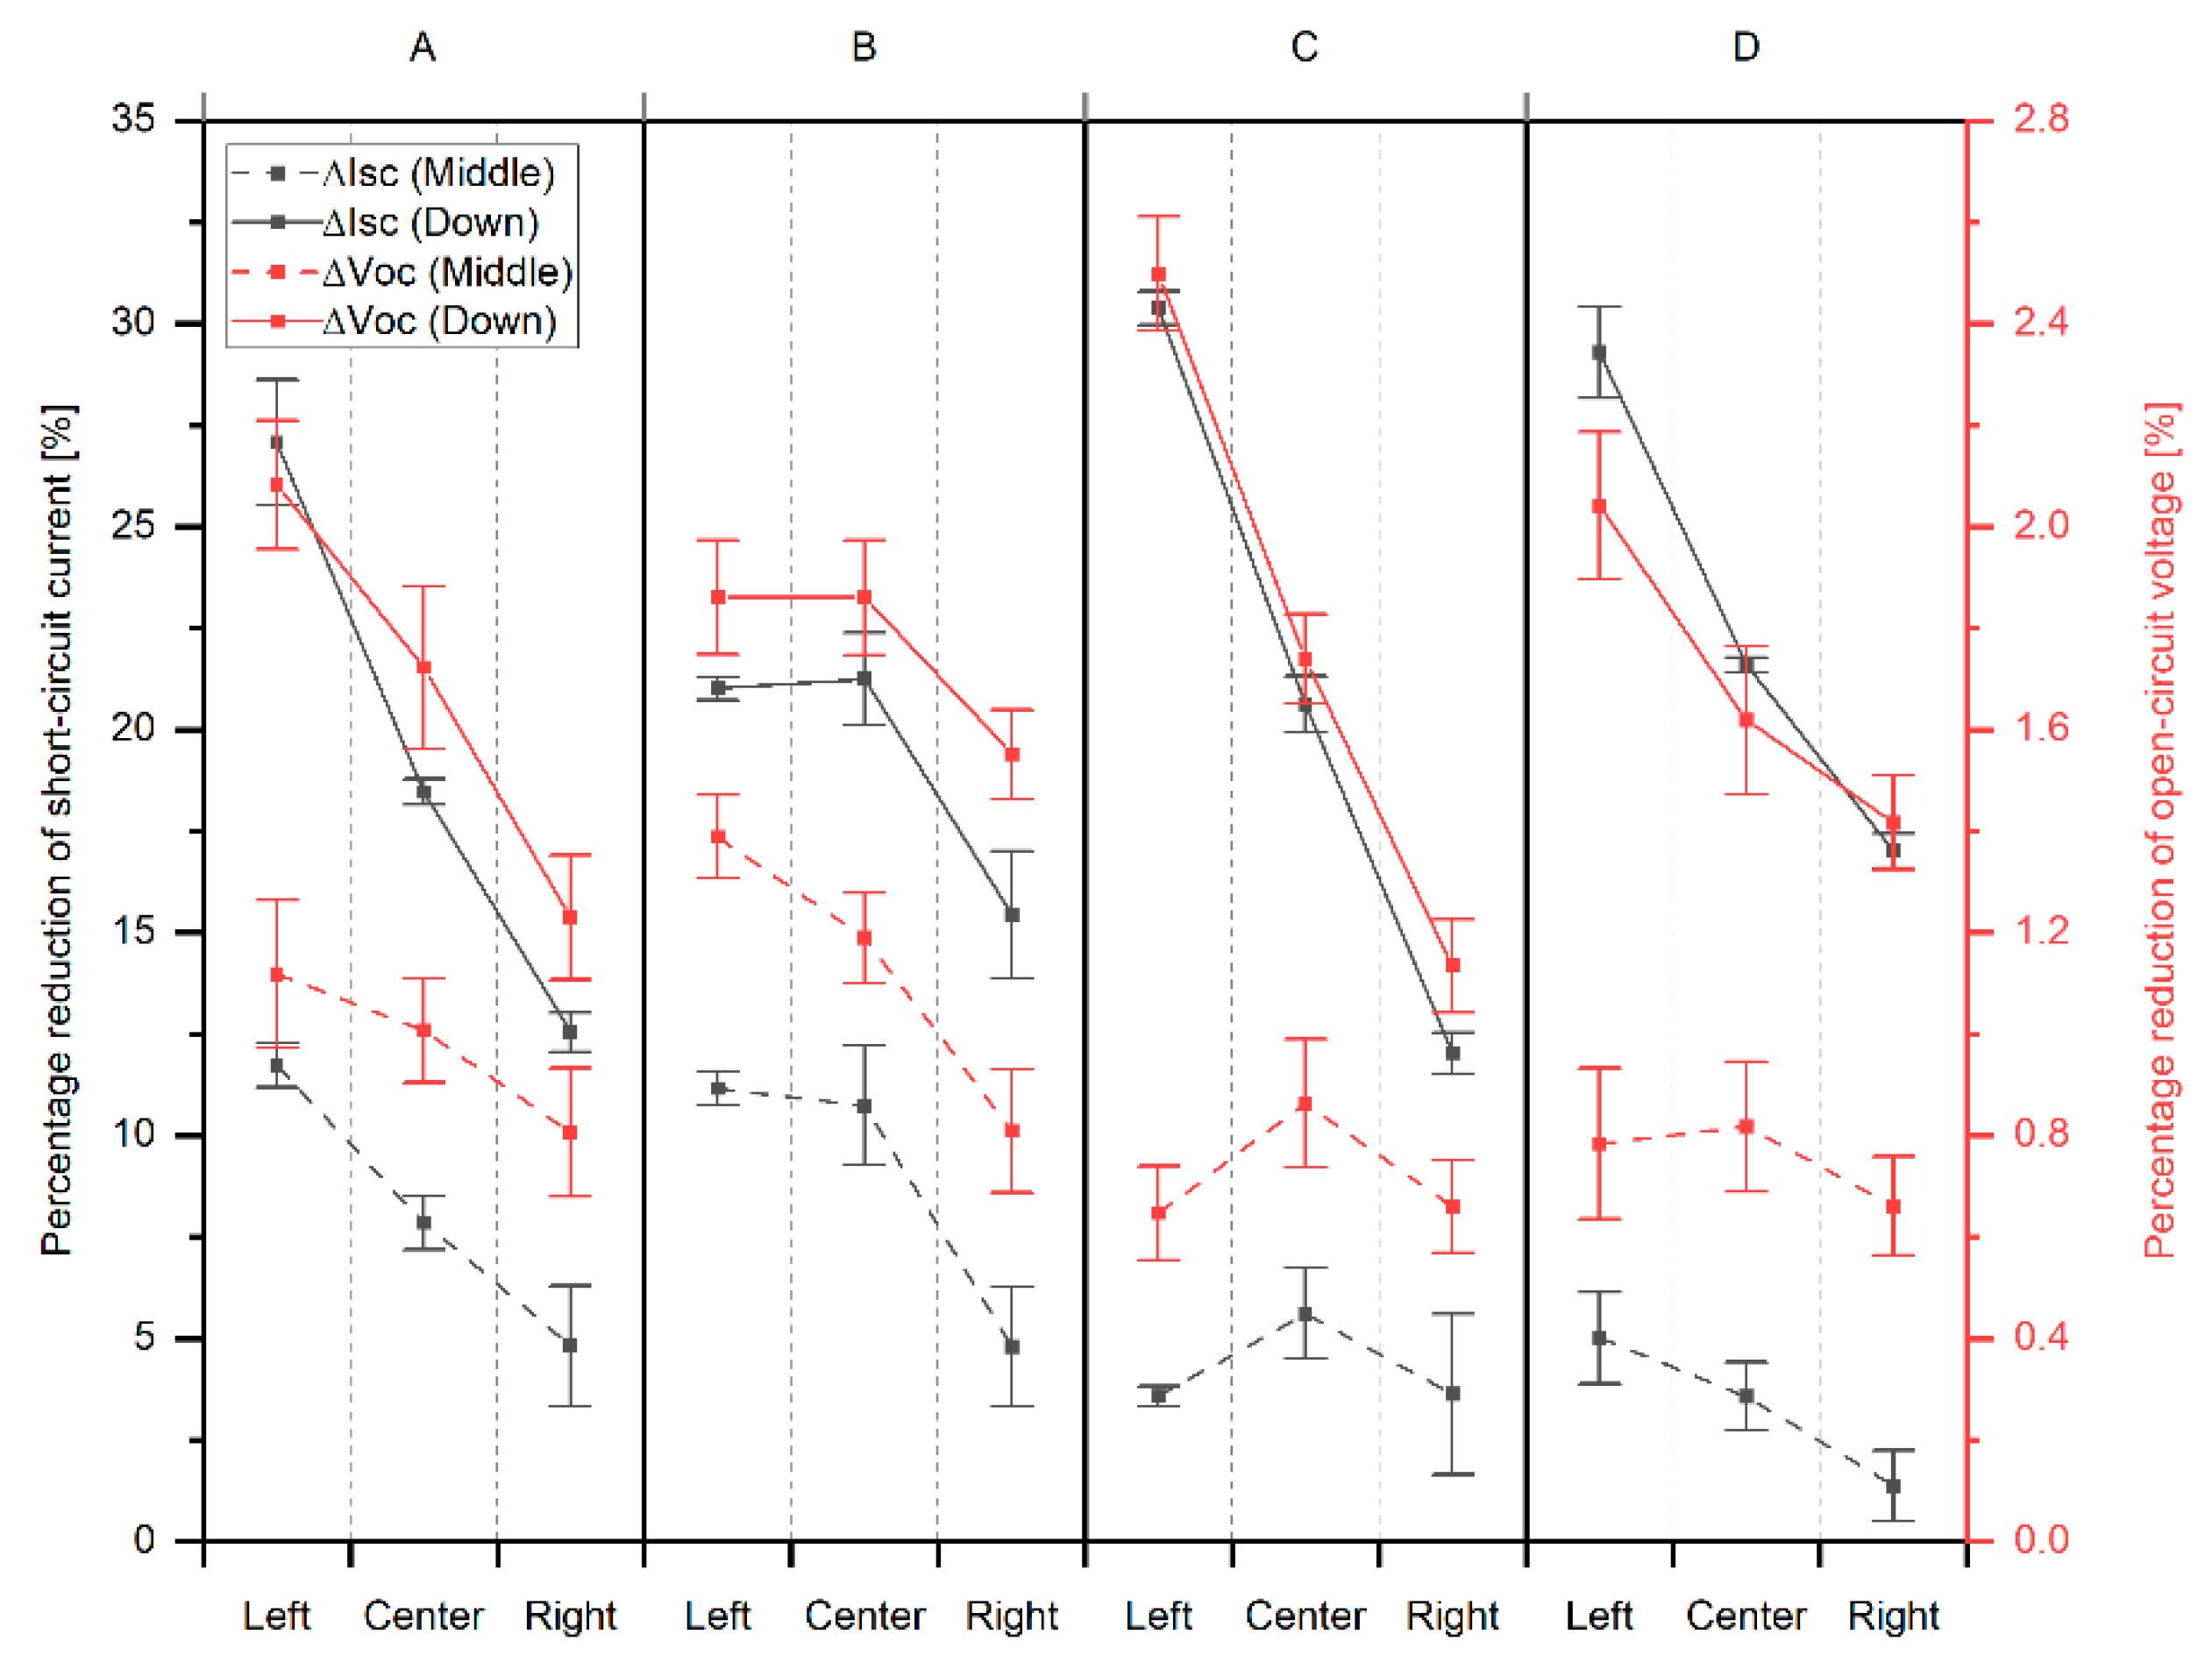
3.3. Non-Homogeneous Soiling Effects

If periodic cleaning is not done, cemented crust formation is inevitable. The effects of cemented material on PV glass installed on a 20° slope, being the most used around the world, are shown below. In particular, the soiling effect was quantified from measurements made on PV glass samples (A, B, C, and D) with a reference c-Si cell on six different sectors, as shown in red in Figure 6a. There is a reduction in the maximum power due to the deposited dust, mostly because of the current reduction. This effect is shown by the results obtained from IV measurements, as shown in Figure 6. The left, central, and right parts of the glass samples are not similar in regards to IV measurements. This is explained by non-homogeneous soiling deposition on the PV glass surface. However, the 20° slope effect on dust deposition can be observed. A significant difference is shown among the measurements of the middle and lower quadrants of the four PV pieces of glass, the lower part concentrating the greatest current losses.
The difference between the middle and lower parts of the samples is clearly observed in the percentage difference between a clean and soiled glass. Figure 7 shows the parameters related to the short-circuit current and the open-circuit voltage. The short-circuit current percentage reduction lay between 12.0% and 31.0% for the lower part and between 0.5% and 13.0% for the middle part. This confirms that dust deposition on the lower part is greater than that on the middle part, thereby producing a short-circuit current decrease, which is directly proportional to the incident light [35]. However, the open-circuit voltage percentage reduction shows differences between the lower and middle parts of the samples, but it varies in lower ranges not over 2.6% voltage drop.
Losses due to soiling in each sector are obtained from the power percentage difference between the exposed and a clean glass sample measurement, this is shown in Figure 8. The lower left end shows the highest power reduction values, which are attributed to the predominant wind direction on the site (northeast) [18]. This phenomenon generates soiling patters that are similar to the four PV pieces of glass, thus accumulating more soiling in the sector. For instance, power reduction on the lower left corner of sample A was 27.7 ± 0.4%, while it was 14.4 ± 1.5% on the lower right corner. This trend is the same as the other three pieces of glass.
The irregular soiling pattern indicated by losses due to soiling in each sector suggests that solar cells forming a PV module operate in different conditions owing to non-homogeneous PV glass transmissivity and losses due to soiling. This causing the so-called mismatch effect that further decreases the PV module power which, together with faulty derivation diodes, may generate hot spots [36,37].

4. Conclusions

This paper proposes a methodology to understand the influence of local geology on soiling deposition and to support decision-making in cleaning PV plants. The methodology is based on geologic analysis using pits and the physicochemical characterization of materials deposited on PV modules. Data to make recommendations regarding cleaning methodologies to be used in a desert zone with soluble salts were obtained. This methodology can be used in any place around the world, in so far as there is interest in developing a PV project, considering that some necessary and mandatory work must be done, e.g., making pits, from which invaluable data can be obtained.
As a whole, the results show that soils with soluble salts (gypsum) have a positive influence on crust formation, thus avoiding high soiling levels. However, the influence of soluble salts on the PV module is negative since it fosters the cementation process. These data suggest that cemented crust formation must be avoided by daily cleaning. If this cannot be done, solvents that are able to dissolve the soluble salt crust should be used.
Additionally, this study shows the impact of local geology on PV glass soiling deposition, using one of the most common configurations (fixed slope) on a worldwide basis. The results show a connection among the deposited material chemistry, the installation configuration, and the local geology. Crust formation is favored on the lower part of the PV glass, where a greater amount of cemented material is generated. This is also the place where more energy is needed to eliminate the soiling crust. Electric measurements of IV curves show that the greatest concentration of crusted material occurs where electric losses are greater.
In general, the methodology used is suitable for studying soiling in different places around the world. One of the advantages is that data are obtained during the PV plant construction process, during which soil studies (pits) are needed. This process is neccessary for all PV projects. Hence, this stage can be used to obtain data on local geology and its possible influence on soiling. This must be complemented with the morphological and chemical analysis of the material deposited on PV modules to improve decision-making regarding mitigation and cleaning techniques. These simple methodological characteristics have become highly important due to the great development of solar projects, seeking PV plant profitability on a worldwide basis.

Author Contributions

Conceptualization, D.O. and A.T.; Formal analysis, D.O. and D.E.; Investigation, D.O. and A.T.; Methodology, P.F. and A.M.; Project administration, M.H.; Supervision, J.L. and E.F.; Writing—original draft, D.O., A.T. and P.F.; Writing—review & editing, P.F. All authors have read and agreed to the published version of the manuscript.

Funding

The authors thank ANID/FONDAP/15110019 “Solar Energy Research Center” SERC-Chile; Chilean Economic Development Agency (CORFO), contract No17PTECES-75830 for project “AtaMoS TeC”; GORE-Antofagasta, Chile, FIC-R Antofagasta Project 2017 BIP code 30488824-0; Unidad de equipamiento científico “MAINI” at Universidad Católica del Norte for supporting sample preparation and data analysis and generation through the SEM and AFM team; ANID/FONDECYT Project N°11190289 (APC funding project); and FONDECYT Project 1181302 for IPCE use.

Institutional Review Board Statement

Not applicable.

Informed Consent Statement

Not applicable.

Conflicts of Interest

The authors declare no conflict of interest.

References

  1. Zaihidee, F.M.; Mekhilef, S.; Seyedmahmoudian, M.; Horan, B. Dust as an unalterable deteriorative factor affecting PV panel’s efficiency: Why and how. Renew. Sustain. Energy Rev. 2016, 65, 1267–1278. [Google Scholar] [CrossRef]
  2. Ilse, K.; Micheli, L.; Figgis, B.W.; Lange, K.; Daßler, D.; Hanifi, H.; Wolfertstetter, F.; Naumann, V.; Hagendorf, C.; Gottschalg, R.; et al. Techno-Economic Assessment of Soiling Losses and Mitigation Strategies for Solar Power Generation. Joule 2019, 310, 2303–2321. [Google Scholar] [CrossRef] [Green Version]
  3. Priya, S.S.; Cuce, E.; Sudhakar, K. A perspective of COVID 19 impact on global economy, energy and environment. Int. J. Sustain. Eng. 2021, 14, 1290–1305. [Google Scholar] [CrossRef]
  4. Muñoz-García, M.Á.; Fouris, T.; Pilat, E. Analysis of the soiling effect under different conditions on different photovoltaic glasses and cells using an indoor soiling chamber. Renew. Energy 2021, 163, 1560–1568. [Google Scholar] [CrossRef]
  5. Hussain, N.; Shahzad, N.; Yousaf, T.; Waqas, A.; Hussain Javed, A.; Khan, S.; Ali, M.; Liaquat, R. Designing of homemade soiling station to explore soiling loss effects on PV modules. Sol. Energy 2021, 225, 624–633. [Google Scholar] [CrossRef]
  6. Olivares, D.; Marzo, A.; Ferrada, P.; Campo, V.; Llanos, J.; Pilat, E.; Muñoz, D.; Fuentealba, E. Characterization of Changes in the Soiling Properties and Deposition Rates Because of Groundworks Near a PV Plant in the Atacama Desert. In Proceedings of the Online Solar World Congress (SWC2021), International Solar Energy Society (ISES 2021), 25–29 October 2021; pp. 305–314. Available online: http://proceedings.ises.org/paper/swc2021/swc2021-0033-Olivares.pdf (accessed on 8 August 2022).
  7. Song, Z.; Liu, J.; Yang, H. Air pollution and soiling implications for solar photovoltaic power generation: A comprehensive review. Appl. Energy 2021, 298, 117247. [Google Scholar] [CrossRef]
  8. Sarver, T.; Al-Qaraghuli, A.; Kazmerski, L.L. A comprehensive review of the impact of dust on the use of solar energy: History, investigations, results, literature, and mitigation approaches. Renew. Sustain. Energy Rev. 2013, 22, 698–733. [Google Scholar] [CrossRef]
  9. Figgis, B.; Ennaoui, A.; Ahzi, S.; Rémond, Y. Review of PV soiling particle mechanics in desert environments. Renew. Sustain. Energy Rev. 2017, 76, 872–881. [Google Scholar] [CrossRef]
  10. Chanchangi, Y.N.; Ghosh, A.; Sundaram, S.; Mallick, T.K. An analytical indoor experimental study on the effect of soiling on PV, focusing on dust properties and PV surface material. Sol. Energy 2020, 203, 46–68. [Google Scholar] [CrossRef]
  11. Figgis, B.; Brophy, B. PV Coatings and Particle Adhesion Forces. In Conference Proceedings PV-Days Halle; 2015; Volume 20, pp. 1–9. Available online: https://scholar.google.com/scholar_lookup?title=PV%20coatings%20and%20particle%20adhesion%20forces&publication_year=2015&author=B.W.%20Figgis&author=B.%20Brophy (accessed on 8 August 2022).
  12. Wasim, J.; Bing, G.; Yiming, W.; Figgis, B. Photovoltaic performance degradation due to soiling and Characterization of the accumulated dust. In Proceedings of the 2016 IEEE International Conference on Power and Renewable Energy (ICPRE) 2016, Shanghai, China, 21–23 October 2016; pp. 580–584. [Google Scholar] [CrossRef]
  13. Javed, W.; Wubulikasimu, Y.; Figgis, B.; Guo, B. Characterization of dust accumulated on photovoltaic panels in Doha, Qatar. Sol. Energy 2017, 142, 123–135. [Google Scholar] [CrossRef]
  14. Said, S.A.M.; Hassan, G.; Walwil, H.M.; Al-Aqeeli, N. The effect of environmental factors and dust accumulation on photovoltaic modules and dust-accumulation mitigation strategies. Renew. Sustain. Energy Rev. 2018, 82, 743–760. [Google Scholar] [CrossRef]
  15. Marzo, A.; Ferrada, P.; Beiza, F.; Besson, P.; Alonso-Montesinos, J.; Ballestrín, J.; Román, R.; Portillo, C.; Escobar, R.; Fuentealba, E. Standard or local solar spectrum? Implications for solar technologies studies in the Atacama desert. Renew. Energy 2018, 127, 871–882. [Google Scholar] [CrossRef]
  16. Gostein, M.; Marion, B.; Stueve, B. Spectral Effects in Albedo and Rearside Irradiance Measurement for Bifacial Performance Estimation. Conf. Rec. IEEE Photovolt. Spec. Conf. 2020, 2020, 0515–0519. [Google Scholar] [CrossRef]
  17. Kottek, M.; Grieser, J.; Beck, C.; Rudolf, B.; Rubel, F. World map of the Köppen-Geiger climate classification updated. Meteorol. Z. 2006, 15, 259–263. [Google Scholar] [CrossRef]
  18. Olivares, D.; Ferrada, P.; Marzo, A.; Llanos, J.; Miranda-Ostojic, C.; del Campo, V.; Bravo, S.; Fuentealba, E. Microstructural analysis of the PV module cementation process at the Solar Platform of the Atacama Desert. Sol. Energy Mater. Sol. Cells 2021, 227, 111109. [Google Scholar] [CrossRef]
  19. White, W.A. Atterberg plastic limits of clay minerals. Am. Mineral. 1949, 34, 508–512. [Google Scholar]
  20. Ferrada, P.; Olivares, D.; del Campo, V.; Marzo, A.; Araya, F.; Cabrera, E.; Llanos, J.; Correa-Puerta, J.; Portillo, C.; Román Silva, D.; et al. Physicochemical characterization of soiling from photovoltaic facilities in arid locations in the Atacama Desert. Sol. Energy 2019, 187, 47–56. [Google Scholar] [CrossRef]
  21. Paudyal, B.R.; Shakya, S.R. Dust accumulation effects on efficiency of solar PV modules for off grid purpose: A case study of Kathmandu. Sol. Energy 2016, 135, 103–110. [Google Scholar] [CrossRef]
  22. Sayyah, A.; Horenstein, M.N.; Mazumder, M.K. Energy yield loss caused by dust deposition on photovoltaic panels. Sol. Energy 2014, 107, 576–604. [Google Scholar] [CrossRef]
  23. Luo, W.; Khoo, Y.S.; Hacke, P.; Naumann, V.; Lausch, D.; Harvey, S.P.; Singh, J.P.; Chai, J.; Wang, Y.; Aberle, A.G.; et al. Potential-induced degradation in photovoltaic modules: A critical review. Energy Environ. Sci. 2017, 10, 43–68. [Google Scholar] [CrossRef]
  24. Curcio, J.A. Adsorption and Condensation of Water on Mirror and Lens Surfaces. NRL Memo. Rep. 1976, 3359, 5–21. [Google Scholar] [CrossRef]
  25. Ilse, K.; Werner, M.; Naumann, V.; Figgis, B.W.; Hagendorf, C.; Bagdahn, J. Microstructural analysis of the cementation process during soiling on glass surfaces in arid and semi-arid climates. Phys. Status Solidi—Rapid Res. Lett. 2016, 10, 525–529. [Google Scholar] [CrossRef]
  26. Kazmerski, L.L.; Diniz, A.S.A.C.; Maia, C.B.; Viana, M.M.; Costa, S.C.; Brito, P.P.; Campos, C.D.; De Morais Hanriot, S.; De Oliveira Cruz, L.R. Soiling particle interactions on PV modules: Surface and inter-particle adhesion and chemistry effects. In Proceedings of the 2017 IEEE 44th Photovoltaic Specialist Conference, PVSC 2017, Washington, DC, USA, 25–30 June 2017; pp. 2551–2553. [Google Scholar]
  27. Ilse, K.K.; Rabanal, J.; Schönleber, L.; Khan, M.Z.; Naumann, V.; Hagendorf, C.; Bagdahn, J. Comparing indoor and outdoor soiling experiments for different glass coatings and microstructural analysis of particle caking processes. IEEE J. Photovolt. 2018, 8, 203–209. [Google Scholar] [CrossRef]
  28. Figgis, B.; Nouviaire, A.; Wubulikasimu, Y.; Javed, W.; Guo, B.; Ait-Mokhtar, A.; Belarbi, R.; Ahzi, S.; Rémond, Y.; Ennaoui, A. Investigation of factors affecting condensation on soiled PV modules. Sol. Energy 2018, 159, 488–500. [Google Scholar] [CrossRef]
  29. Cuddihy, E.F. Soiling mechanism and performance of anti-soiling surface coating. Part. Surfaces 1988, 1, 91–111. [Google Scholar] [CrossRef]
  30. Olivares, D.; Trigo-González, M.; Marzo, A.; Ferrada, P.; Llanos, J.; Araya, F.; López, G.; Polo, J.; Alonso-Montesinos, J.; Gueymard, C. Analysis of the local factors that influence the cementation of soil and effects on PV generation at the plataforma solar del desierto de atacama, Chile. In Proceedings of the ISES Solar World Congress, Santiago, Chile, 4–7 November 2019; pp. 1051–1060. [Google Scholar] [CrossRef]
  31. Bethea, R.M.; Barriger, M.T.; Williams, P.F.; Chin, S. Environmental effects on solar concentrator mirrors. Sol. Energy 1981, 27, 497–511. [Google Scholar] [CrossRef]
  32. Lin, J.; Zheng, Z.J.; Yu, J.L.; Bai, Y.L. A thin liquid film and its effects in an atomic force microscopy measurement. Chinese Phys. Lett. 2009, 26, 8–12. [Google Scholar] [CrossRef]
  33. Varga, H.F.; Wiesner, M.R. Relationship between Atomic Force Microscopy and Centrifugation Measurements for Dust Fractions Implicated in Solar Panel Soiling. Environ. Sci. Technol. 2022, 56, 9604–9612. [Google Scholar] [CrossRef] [PubMed]
  34. Ghazi, S.; Sayigh, A.; Ip, K. Dust effect on flat surfaces—A review paper. Renew. Sustain. Energy Rev. 2014, 33, 742–751. [Google Scholar] [CrossRef]
  35. Ghosh, A. Soiling Losses: A Barrier for India’s Energy Security Dependency from Photovoltaic Power. Challenges 2020, 11, 9. [Google Scholar] [CrossRef]
  36. Olivares, D.; Ferrada, P.; Bijman, J.; Rodríguez, S.; Trigo-González, M.; Marzo, A.; Rabanal-Arabach, J.; Alonso-Montesinos, J.; Batlles, F.J.; Fuentealba, E. Determination of the Soiling Impact on Photovoltaic Modules at the Coastal Area of the Atacama Desert. Energies 2020, 13, 3819. [Google Scholar] [CrossRef]
  37. Zefri, Y.; Elkettani, A.; Sebari, I.; Lamallam, S.A. Thermal infrared and visual inspection of photovoltaic installations by uav photogrammetry—Application case: Morocco. Drones 2018, 2, 41. [Google Scholar] [CrossRef]
Figure 1. Solar Platform location in Atacama Desert. (a) Image taken from MODIS TERRA space instrument, 16 March 2021; (b) Pits at PSDA and its surroundings.
Applsci 12 10582 g001
Figure 2. Site geology influence on PV module material deposition: (a) Random picture of PSDA soil; (b) Pit 5; and (c) material deposited on the fine layer module at PSDA.
Applsci 12 10582 g002
Figure 3. Scanning electron microscopy: (a) Sample of soiling deposited on the lower part of the PV glass; (b,c) random prismatic particle analysis; and (d) PV glass cross-section.
Applsci 12 10582 g003
Figure 4. Elemental mapping analysis on a random section of the soiling samples deposited on the exposed glass. (a) Randomly selected area to be analyzed. (b) Combination of elements present in selected area (O, Na, Mg, Al, Si, S, K and Ca). (ci) Mapping of the elemental analysis to random section of soiling samples deposited on the exposed glass.
Applsci 12 10582 g004
Figure 5. AFM-Raman deposition profile studies: (a) Random PV glass sector analysis; (b) soiling layers growing one over the other on the lower part of the PV glass.
Applsci 12 10582 g005
Figure 6. IV curve measurement of the lower and middle parts of glass samples (A, B, C, and D). (a) Clean glass divided into sectors to be analyzed; (b) IV curves on the middle and lower left sides; (c) IV curves on the middle and lower central parts; and (d) IV curves on the middle and lower right side.
Applsci 12 10582 g006
Figure 7. Short-circuit current and open-circuit voltage percentage reduction for the samples (AD).
Applsci 12 10582 g007
Figure 8. Power reduction percentage of glass samples (AD) installed northwards at PSDA at a 20° slope for a one-year exposure (September 2020–2021).
Applsci 12 10582 g008
Publisher’s Note: MDPI stays neutral with regard to jurisdictional claims in published maps and institutional affiliations.

